Embed Size (px)
Citation preview
Macquarie Group Limited Presentation to Debt Investors
November 2014

PAGE 2
The material in this presentation has been prepared by Macquarie Group Limited ABN 94 122 169 279 (Macquarie) and is general background information about Macquarie’s activities current as at the date of this presentation. This information is given in summary form and does not purport to be complete. Information in this presentation, including forecast financial information, should not be considered as advice or a recommendation to investors or potential investors in relation to holding, purchasing or selling securities or other financial products or instruments and does not take into account your particular investment objectives, financial situation or needs. Before actingonany information you should consider the appropriateness of the information having regard to these matters, any relevant offer document and in particular, you should seek independent financialadvice. All securities and financial product or instrument transactions involve risks, which include (among others) the risk of adverse or unanticipated market, financial or political developments and, in international transactions, currency risk.
This presentation may contain forward looking statements including statements regarding our intent, belief or current expectations with respect to Macquarie’s businesses and operations, market conditions, results of operation and financial condition, capital adequacy, specific provisions and risk management practices. Readers are cautioned not to place undue reliance on these forward looking statements. Macquarie does not undertake any obligation to publicly release the result of any revisionstothese forward looking statements to reflect events or circumstances after the date hereof to reflect the occurrence of unanticipated events. While due care has been used in the preparation of forecast information, actual results may vary in a materially positive or negative manner. Forecasts and hypothetical examples are subject to uncertainty and contingencies outsideMacquarie’s control. Past performance is not a reliable indication of future performance.
Unless otherwise specified all information is for the half year ended 30 September 2014.
Certainfinancial information in this presentation is prepared on a different basis to the Macquarie Group Limited Financial Report, which is prepared in accordance with Australian Accounting Standards.Where financial information presented within this presentation does not comply with Australian Accounting Standards,a reconciliation to the statutory information isprovided.
This report provides further detail in relation to key elements of Macquarie Group Limited’s financial performance and financialposition.It also provides an analysis of the funding profile of the Groupbecausemaintaining the structural integrity of the Group's balance sheet requires active management of both asset and liability portfolios. Active management of the funded balance sheet enables the Group to strengthen its liquidity and funding position.
Any additional financial information in this presentation which is not included in the Macquarie Group Limited Financial Report was not subject to independent audit or review by PricewaterhouseCoopers.
Disclaimer

PAGE 3
01. Overview
02. Financial Results
03. FY15 Outlook
04. Capital and Funding
05. Appendices
Agenda

01 Overview
Presentation to Debt Investors November 2014

PAGE 5 Note: Unless otherwise noted, all data is as at 30 September 2014.
Macquarie overview
New Zealand 3 locations
Australia 9 locations
Africa 2 locations
Latin America 3 locations
Asia 14 locations
Middle East 2 locations
Europe 12 locations
North America 21 locations
Fixed Income, Currencies and Commodities
Banking Financial Services
Macquarie Capital Corporate Asset Finance
Macquarie Securities Group
Macquarie Funds Group
Macquarie Group
APRA primary regulator for MBL & MGL
Market Capitalisation of
A$18.5bn as at 30 Sep 2014
14,138 employees,
operating in 28 countries
~A$425bn assets under
management as at 30 Sep 2014
MBL A/A2/A credit rating
$A678m in Net Profit for
1H14
Macquarie Group Overview Global Locations
Macquarie Group in Numbers
Global provider of banking, financial advisory, investment and funds management services
PAGE 6
Equity
Debt and Hybrid Equity
Debt and Equity Debt and Equity
Debt and Hybrid Equity
Non-Bank Group
Macquarie Bank Limited (MBL)
Bank Group
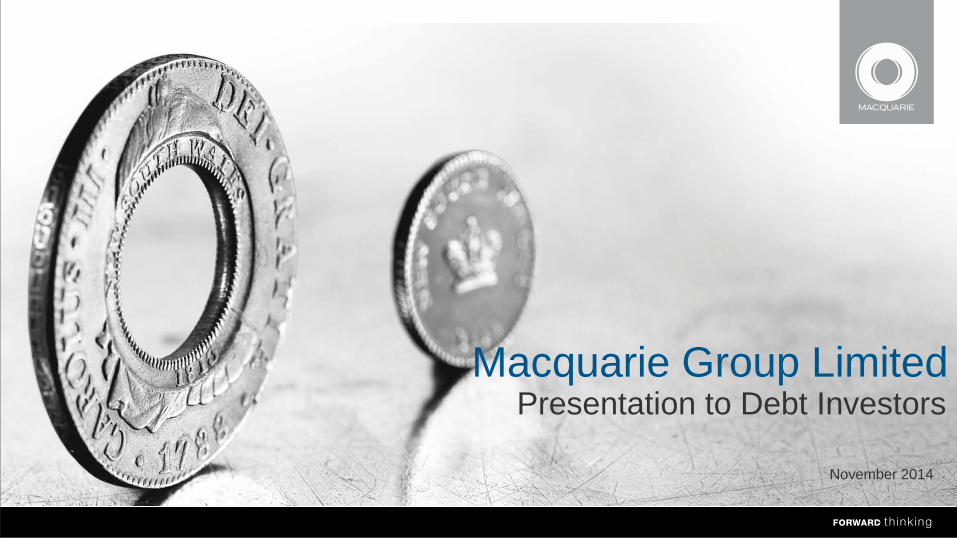
• MGL and MBL are the Group’s two primary external funding vehicles which have separate and distinct funding, capital and liquidity management arrangements
• MBL provides funding to the Bank Group
• MGL provides funding principally to the Non-Bank Group and limited funding to some MBL Group subsidiaries
Group funding structure
Macquarie Group Limited (MGL)

PAGE 7
0
20
40
60
80
100
1980 1981 1982 1983 1984 1985 1986 1987 1988 1989 1990 1991 1992 1993 1994 1995
Savings and loan crisis
US banks capital losses
Global debt crisis
US recession $A floated
MBL established
First listed property trust
Enter stockbroking
Stock market crash
London office opens
Hills Motorway Mortgage
securitisation Global real
estate crash Recession
0
500
1,000
1,500
2,000
1996 1997 1998 1999 2000 2001 2002 2003 2004 2005 2006 2007 2008 2009 2010 2011 2012 2013 2014 1H15
0.0 0.4 0.8 1.2 1.6 2.0
1969 1970 1971 1972 1973 1974 1975 1976 1977 1978 1979
Hill Samuel UK opens branch office
in Sydney
Currency Crisis Recession
MBL listed
BT Australia acquired
Sydney Airport
ING Acquired
Asian Financial
Crisis
Russian Debt Crisis
Dot Com crash
9/11 US
Recession SARS
Thames Water Giuliani Capital
GFC Constellation
Tristone
Delaware FPK Blackmont Sal Opp.
ILFC GMAC Presidio Innovest REGAL
Onstream
Orion Securities CIT Systems Leasing Group Restructure Significant Market Disruption
Macquarie has a long history of profitability
European rail leasing
ING IM Korea GE Capital’s Premium Funding business
PAGE 8
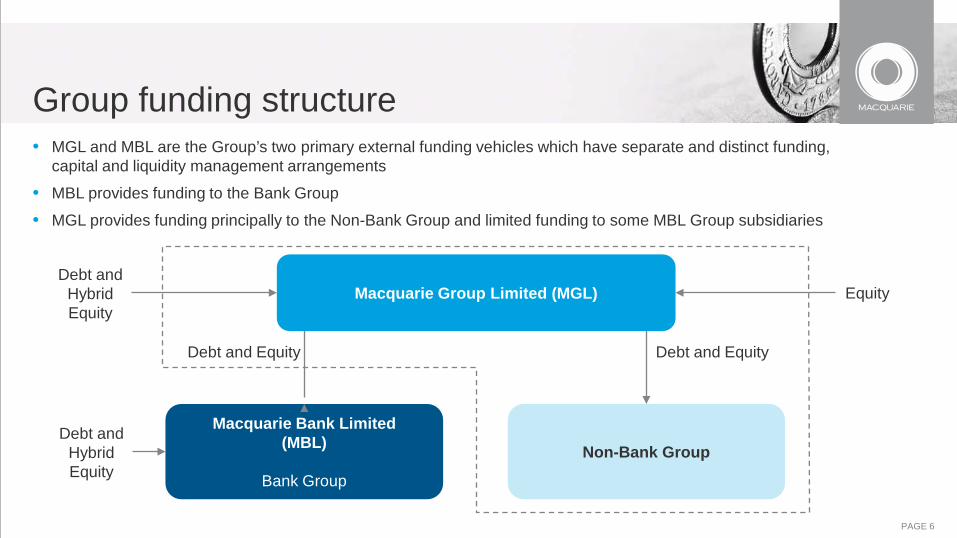
Evolution of business • Macquarie’s pre-tax earnings are almost identical with that achieved in FY08
FY08 FY14
Operating Income 8,248 8,132
Operating Expenses 6,043 6,026
NPBT 2,205 2,106

PAGE 9
Annuity style income growth Evolution of the business
Annuity vs Market Facing Income FY08 Annuity vs Market Facing Income FY14
Annuity 32%
Market facing 68%
Annuity 74%
Market facing 26%
Annuity income represents the % contribution to net profit before tax after profit share for MFG, CAF and BFS. Market facing represents the % contribution to net profit before tax after profit share for MSG, MacCap and FICC.
PAGE 10
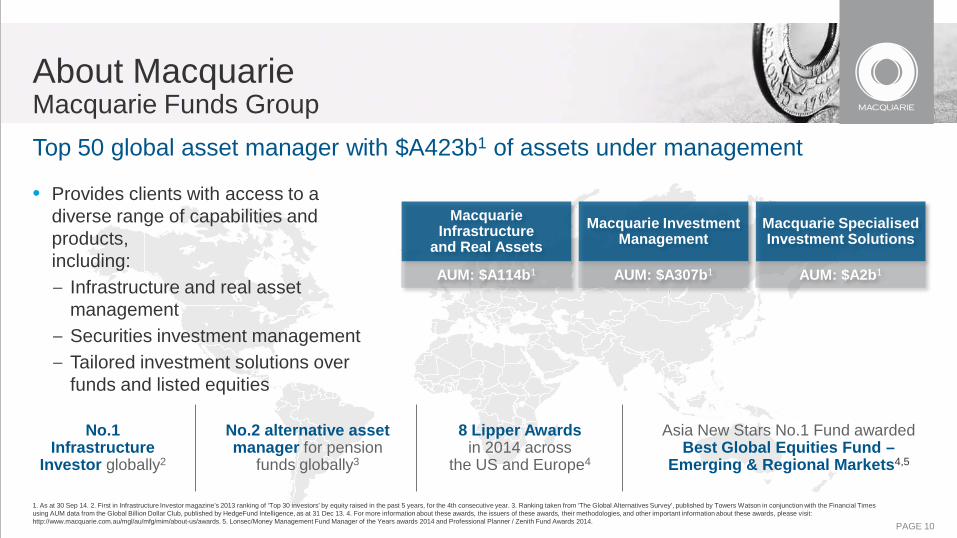
Top 50 global asset manager with $A423b1 of assets under management
• Provides clients with access to a diverse range of capabilities and products, including: – Infrastructure and real asset
management – Securities investment management – Tailored investment solutions over
funds and listed equities
About Macquarie Macquarie Funds Group
1. As at 30 Sep 14. 2. First in Infrastructure Investor magazine’s 2013 ranking of ‘Top 30 investors’ by equity raised in the past 5 years, for the 4th consecutive year. 3. Ranking taken from ‘The Global Alternatives Survey’, published by Towers Watson in conjunction with the Financial Times using AUM data from the Global Billion Dollar Club, published by HedgeFund Intelligence, as at 31 Dec 13. 4. For more information about these awards, the issuers of these awards, their methodologies, and other important information about these awards, please visit: http://www.macquarie.com.au/mgl/au/mfg/mim/about-us/awards. 5. Lonsec/Money Management Fund Manager of the Years awards 2014 and Professional Planner / Zenith Fund Awards 2014.
No.2 alternative asset manager for pension
funds globally3
Macquarie Investment Management
Macquarie Infrastructure
and Real Assets Macquarie Specialised Investment Solutions
8 Lipper Awards in 2014 across
the US and Europe4
No.1 Infrastructure
Investor globally2
Asia New Stars No.1 Fund awarded Best Global Equities Fund –
Emerging & Regional Markets4,5
AUM: $A307b1
AUM: $A114b1 AUM: $A2b1
PAGE 11
0
50
100
150
200
250
300
350
400
450
Mar 11 Mar 12 Mar 13 Mar 14 Sep-14
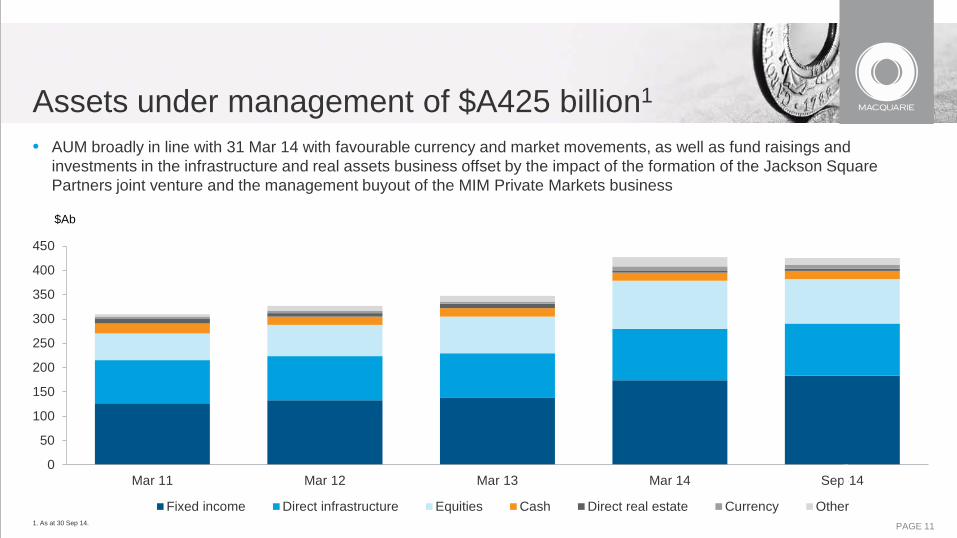
Fixed income Direct infrastructure Equities Cash Direct real estate Currency Other
Assets under management of $A425 billion1
• AUM broadly in line with 31 Mar 14 with favourable currency and market movements, as well as fund raisings and investments in the infrastructure and real assets business offset by the impact of the formation of the Jackson Square Partners joint venture and the management buyout of the MIM Private Markets business
1. As at 30 Sep 14.
$Ab
PAGE 12
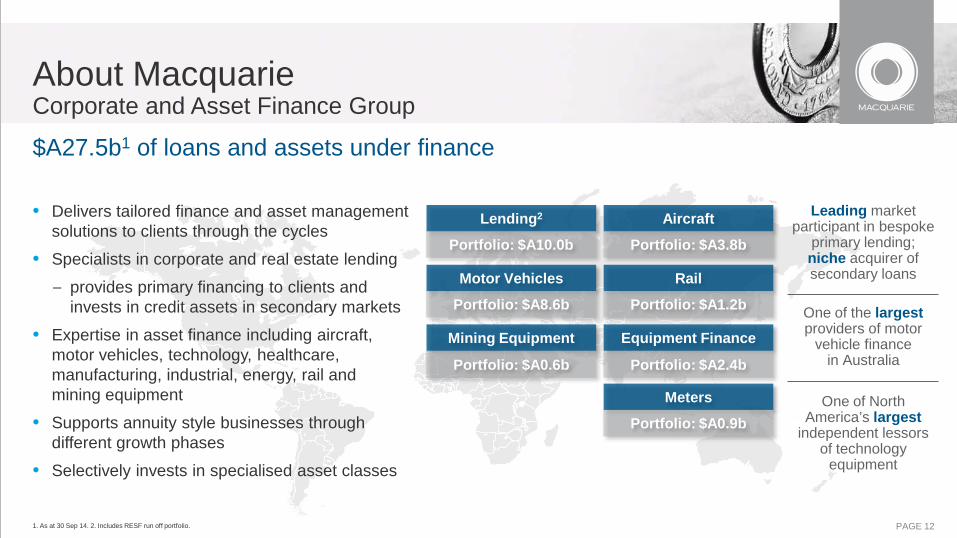
$A27.5b1 of loans and assets under finance
• Delivers tailored finance and asset management solutions to clients through the cycles
• Specialists in corporate and real estate lending
– provides primary financing to clients and invests in credit assets in secondary markets
• Expertise in asset finance including aircraft, motor vehicles, technology, healthcare, manufacturing, industrial, energy, rail and mining equipment
• Supports annuity style businesses through different growth phases
• Selectively invests in specialised asset classes
About Macquarie Corporate and Asset Finance Group
1. As at 30 Sep 14. 2. Includes RESF run off portfolio.
Leading market participant in bespoke
primary lending; niche acquirer of secondary loans Motor Vehicles
Lending2 Aircraft
Portfolio: $A8.6b
Portfolio: $A10.0b Portfolio: $A3.8b
One of North America’s largest
independent lessors of technology
equipment
One of the largest providers of motor
vehicle finance in Australia
Rail
Equipment Finance
Meters
Portfolio: $A1.2b
Portfolio: $A2.4b
Portfolio: $A0.9b
Mining Equipment
Portfolio: $A0.6b
PAGE 13
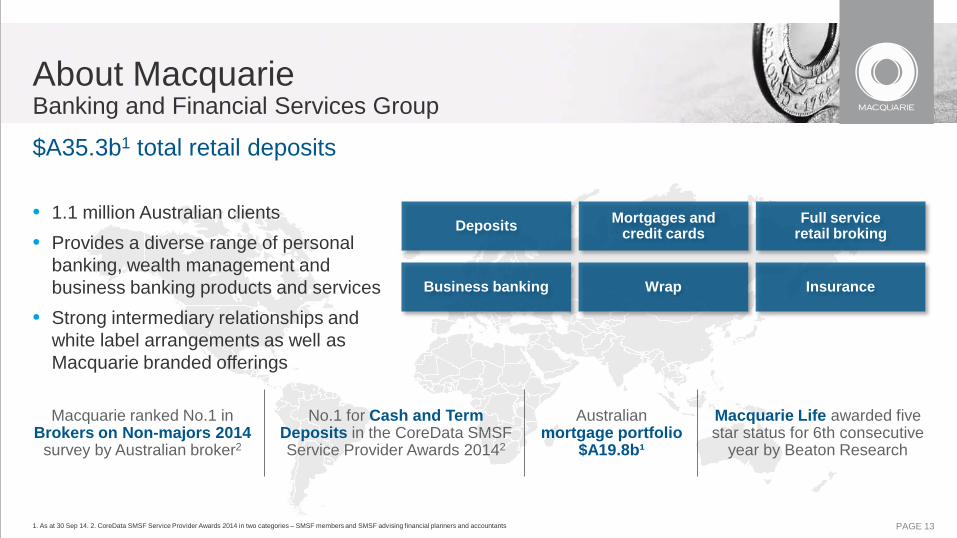
$A35.3b1 total retail deposits
• 1.1 million Australian clients • Provides a diverse range of personal
banking, wealth management and business banking products and services
• Strong intermediary relationships and white label arrangements as well as Macquarie branded offerings
About Macquarie Banking and Financial Services Group
1. As at 30 Sep 14. 2. CoreData SMSF Service Provider Awards 2014 in two categories – SMSF members and SMSF advising financial planners and accountants
Mortgages and credit cards Deposits Full service
retail broking
Wrap Business banking Insurance
No.1 for Cash and Term Deposits in the CoreData SMSF Service Provider Awards 20142
Australian mortgage portfolio
$A19.8b¹
Macquarie ranked No.1 in Brokers on Non-majors 2014
survey by Australian broker2
Macquarie Life awarded five star status for 6th consecutive
year by Beaton Research

PAGE 14
Innovative specialists leveraging Asia-Pacific insights to the world
• Global institutional securities house with strong Asia-Pacific foundations covering sales, research, ECM, execution and derivatives activities
• Full-service cash equities in Australia, Asia, South Africa and Canada with offerings in US and Europe. Specialised derivatives in key locations globally
• Key specialities: infrastructure and utilities, TMET, resources (mining and energy), industrials and financial institutions
About Macquarie Macquarie Securities Group
1. As at 30 Sep 14. 2. Peter Lee Associates 2013 Survey of Australian Institutional Investors – Australian Equities. 3. Market share by turnover Apr-Sep 14. Source: local exchanges. 4. Greenwich 2013 Survey of US Institutional Investors – Australian Equities and Greenwich Survey of European Institutional Investors – Australian Equities.
Corporate Access Research Derivatives
Execution Trading Equity capital markets
Equity finance
1,013 staff1 across 19 countries
25+ years Knowledge and
experience in Asia-Pacific No.1 for Australian
Equities in Australia2
No.1 warrants market share Singapore3 No.3 in Thailand3
No.1 for Australian Equities in US and
Europe4

PAGE 15
• Global corporate finance capability, including M&A, debt and equity capital markets, and principal investments
• Key specialities: infrastructure, utilities and renewables; resources (mining and energy); real estate; telecommunications, media, entertainment and technology; industrials and financial institutions
• Winner of over 27 awards globally in the twelve months to 30 September 2014, including Best Investment Bank (Australia)1 and Best M&A House (Australia)2
About Macquarie Macquarie Capital
1. The Asset; M&A Advisor; Global Finance Magazine. 2. Euromoney; Capital CFO; FinanceAsia; Asiamoney. 3. Dealogic, CY14, by number (Australia and New Zealand). 4. Dealogic, CY14, by number & value. 5. Euromoney. 6. Asiamoney 7. Reactions (Sompo acquisition of Canopius). 8. The Banker, Project and Finance category.
No.1 Australia for IPOs4
Best M&A House Australia 20145 and Domestic Equity
House Australia 20146
No.1 ANZ announced and
completed M&A deals3
Financial Institutions
Industrials
Infrastructure, Utilities & Renewables
Real Estate
Resources
Telecommunications, Media, Entertainment & Technology
MER
GER
S &
AC
QU
ISIT
ION
S
PRO
JEC
T FI
NA
NC
E
EQU
ITY
CA
PITA
L M
AR
KET
S
DEB
T C
API
TAL
MA
RK
ETS
PRIV
ATE
CA
PITA
L M
AR
KET
S
PRIN
CIP
AL
INVE
STM
ENTS
UK Deal of the Year7
Most innovative investment bank8

PAGE 16
A portfolio of businesses across Commodity and Financial markets • Global fixed income, currencies and commodities
provider of finance, risk solutions and market access to producers/consumers and financial institutions/investors
• Growing presence in commodities (natural gas, LNG, NGLs, power, oil, coal, base metals, iron ore, sugar and freight)
• Predominant in US and Australia, niche offering in Canada and Latin America, growing presence in Asia and EMEA
• Key specialties: commodities, Asian and emerging markets, high yield and distressed debt
About Macquarie Fixed Income, Currencies and Commodities
1. Commodity Business Awards 2010-2013. 2. Platts, Q2 CY14. Ranking maintained since 2010.
Metals markets
Energy markets
Asian and emerging markets
Futures
30+ years in Metals and
Futures markets
20+ years in Agricultural
and FX markets
Consistently ranked No.1 in Agricultural
and Softs1
10+ years in Energy markets
No.4 physical gas marketer in
North America2
Fixed income and currency
markets Credit
markets Agricultural
markets Metals and
energy capital

PAGE 17
• Macquarie’s approach to risk is supported by the Risk Management Group • Macquarie determines aggregate risk appetite by assessing risk relative to earnings, more than by
reference to capital
Business heads responsible for identifying risks within their businesses and ensuring these are managed appropriately. Seek a clear analysis of the risks before taking decisions.
Risk management approach based on examining the consequences of worst case outcomes and determining whether risks can be tolerated. Adopted for all material risk types and often achieved by stress testing.
Risk Management Group (RMG) signs off all material risk acceptance decisions. For material proposals, RMG opinion sought at the early stage in decision making process, and independent input from RMG on risk and return is included in the approval document submitted to senior management.
Ownership of risk at the business level
Understanding worst case outcomes
Requirement for independent sign-off by Risk Management
Long standing conservative risk management
• The key aspects of Macquarie’s risk management approach are:
• Macquarie’s risk management principles have remained largely stable over 30 years and served the Group well over the past few years
PAGE 18
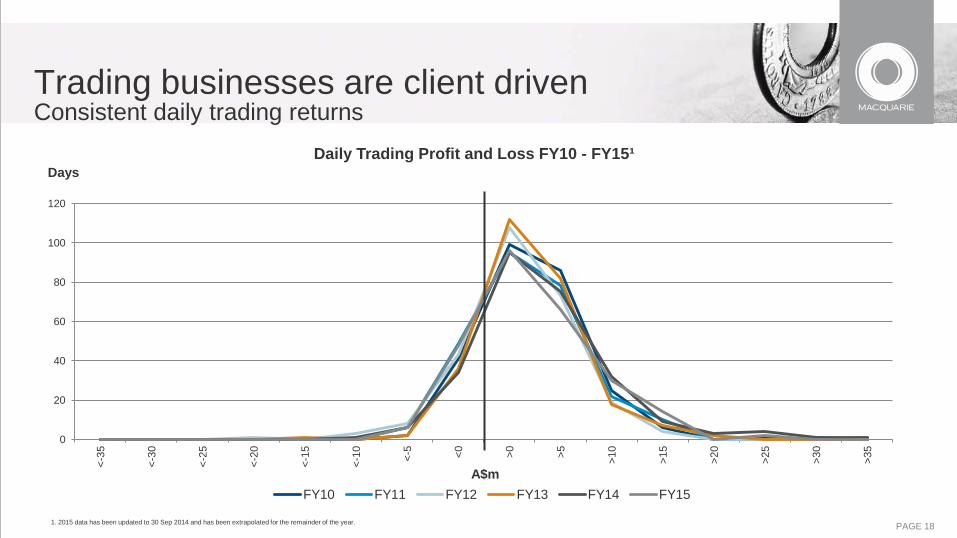
Trading businesses are client driven Consistent daily trading returns
1. 2015 data has been updated to 30 Sep 2014 and has been extrapolated for the remainder of the year.
0
20
40
60
80
100
120
<-35
<-30
<-25
<-20
<-15
<-10
<-5 <0
>0
>5
>10
>15
>20
>25
>30
>35
Days
A$m
Daily Trading Profit and Loss FY10 - FY15¹
FY10 FY11 FY12 FY13 FY14 FY15
PAGE 19
2.0 4.0 6.0 8.0
10.0 12.0 14.0
-
0.5
1.0
1.5
P&L
vola
tility
Investment Banks
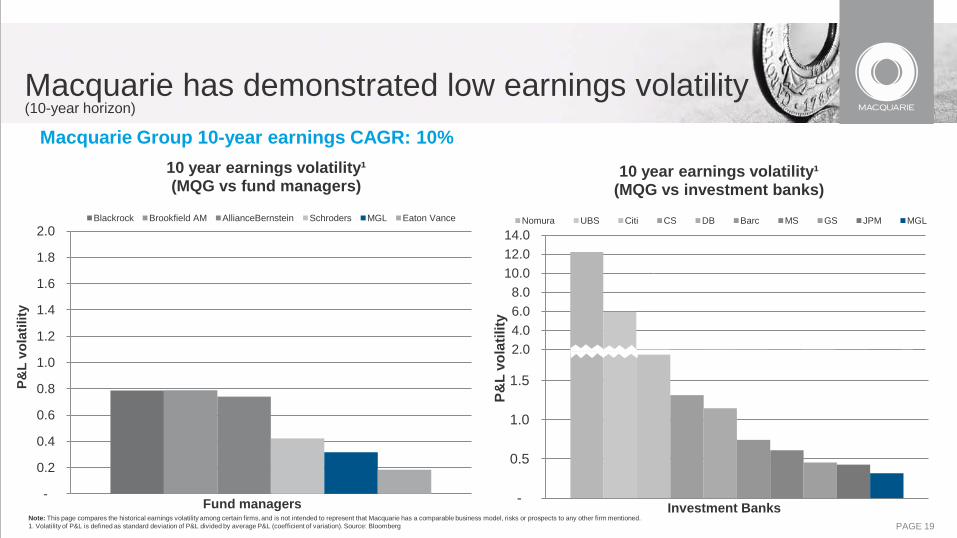
10 year earnings volatility¹ (MQG vs investment banks)
Nomura UBS Citi CS DB Barc MS GS JPM MGL
Note: This page compares the historical earnings volatility among certain firms, and is not intended to represent that Macquarie has a comparable business model, risks or prospects to any other firm mentioned. 1. Volatility of P&L is defined as standard deviation of P&L divided by average P&L (coefficient of variation). Source: Bloomberg
Macquarie Group 10-year earnings CAGR: 10%
Macquarie has demonstrated low earnings volatility (10-year horizon)
-
0.2
0.4
0.6
0.8
1.0
1.2
1.4
1.6
1.8
2.0
P&L
vola
tility
Fund managers
10 year earnings volatility¹ (MQG vs fund managers)
Blackrock Brookfield AM AllianceBernstein Schroders MGL Eaton Vance

02 Half Year Financial Results
Macquarie Group Limited - 30 September 2014 Presentation to Debt Investors
November 2014

PAGE 21
• Net profit $A678m, up 35% on 1H14 and down 11% on 2H14 – Increase on 1H14 stronger than previously expected given the timing of transactions
• Operating income $A4.3b, up 17% on 1H14 and down 3% on 2H14 • As foreshadowed:
– Macquarie’s annuity-style businesses (Macquarie Funds Group, Corporate and Asset Finance, and Banking and Financial Services) continued to perform well with 1H15 combined net profit contribution1 up 38% on 1H14 and up 23% on 2H14
– Macquarie’s capital markets facing businesses’ (Macquarie Securities, Macquarie Capital, and Fixed Income, Currencies and Commodities) combined net profit contribution up 11% on 1H14 and down 43% on a 2H14 which benefited from strong results in the Energy Markets business
• Operating expenses $A3.2b, up 11% on 1H14 and in line with 2H14 • Effective tax rate 38.9% up from 38.0% in 1H14 and down from 40.5% in 2H14 • Earnings per share $A2.13, up 42% on 1H14 and down 9% on 2H14 • Annualised return on equity 12.5%, up from 8.7% in 1H14 and down from 13.5% in 2H14 • 1H15 dividend $A1.30 (40% franked), up on 1H14 dividend of $A1.00 (40% franked) and down on 2H14 dividend of $A1.60
(40% franked)2
1H15 Result
1. Net profit contribution is management accounting profit before unallocated corporate costs, profit share and income tax. 2. In addition, in 2H14 eligible shareholders benefitted from the SYD distribution in Jan 14 which comprised a special dividend of $A1.16 (40% franked) and a return of capital of $A2.57 per share.

PAGE 22
1H15 $Am
2H14 $Am
1H14 $Am
1H15 v 1H14
Net operating income 4,298 4,453 3,679 17%
Total operating expenses (3,177) (3,157) (2,869) 11%
Operating profit before income tax 1,121 1,296 810 38%
Income tax expense (432) (520) (307) 41%
Profit attributable to non-controlling interests (11) (12) (2)
Profit attributable to MGL shareholders 678 764 501 35%
Earnings per share $A2.13 $A2.35 $A1.50 42%
1H15 Result

PAGE 23
0.00
1.00
2.00
3.00
2H12 1H13 2H13 1H14 2H14 1H15
$A
2,000
3,000
4,000
5,000
2H12 1H13 2H13 1H14 2H14 1H15
$Am
0.00
1.00
2.00
3.00
2H12 1H13 2H13 1H14 2H14 1H15
$A
0
250
500
750
1,000
2H12 1H13 2H13 1H14 2H14 1H15
$Am
Financial performance
1H15 Profit of $A678m
1H15 up 35% on 1H14
1H15 EPS of $A2.13 1H15 up 42% on 1H14
1H15 Operating income of $A4,298m 1H15 up 17% on 1H14
1H15 DPS of $A1.30 1H15 up 30% on 1H14
1. In 2H14 eligible shareholders benefitted from the SYD distribution in Jan 14 which comprised a special dividend of $A1.16 (40% franked) and a return of capital of $A2.57 per share.
SYD Special
Dividend1
PAGE 24
EuropeAmsterdamDublinFrankfurtGenevaGlasgowLondonLuxembourgMoscowMunichParisViennaZurich
South AfricaCape TownJohannesburg
Middle EastAbu DhabiDubai
AustraliaAdelaideAlburyBrisbaneCanberraGold CoastMelbournePerthSunshine CoastSydney
New ZealandAucklandChristchurchWellington
Latin AmericaMexico CityRibeirao PretoSao Paulo
USAAtlantaAustinBostonChicagoDenverDetroitHoustonIrvineLos Angeles
CanadaCalgaryMontrealGreater TorontoVancouver
ManilaMumbaiSeoulShanghaiSingaporeTaipeiTokyo
AsiaBangkokBeijingGurgaonHong KongHsin-ChuJakartaKuala Lumpur
MiamiNashvilleNew YorkPhiladelphiaRolling MeadowsSan DiegoSan FranciscoSan Jose
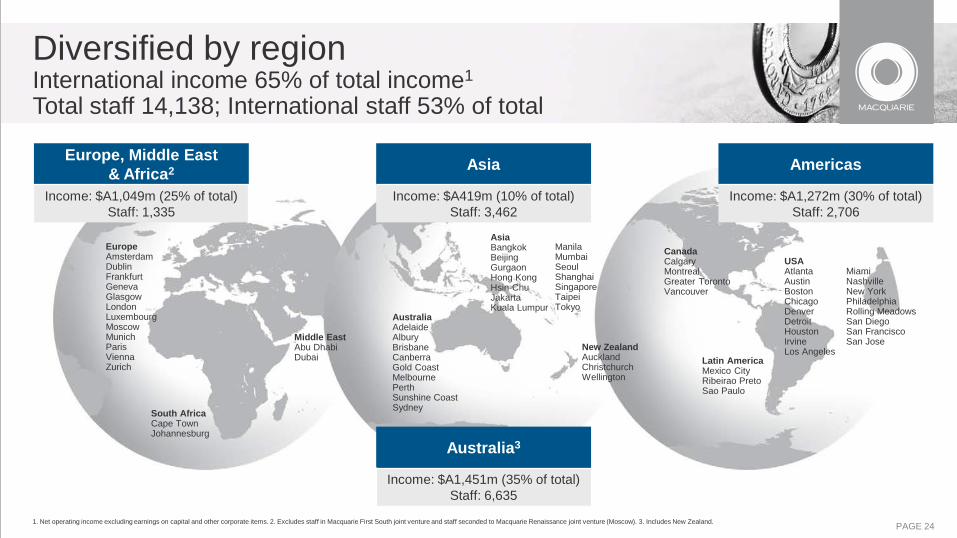
Europe, Middle East & Africa2
Income: $A1,049m (25% of total) Staff: 1,335
Americas
Income: $A1,272m (30% of total) Staff: 2,706
Australia3
Income: $A1,451m (35% of total) Staff: 6,635
Diversified by region International income 65% of total income1 Total staff 14,138; International staff 53% of total
1. Net operating income excluding earnings on capital and other corporate items. 2. Excludes staff in Macquarie First South joint venture and staff seconded to Macquarie Renaissance joint venture (Moscow). 3. Includes New Zealand.
Asia
Income: $A419m (10% of total) Staff: 3,462
03 FY15 Outlook
Presentation to Debt Investors November 2014
PAGE 26
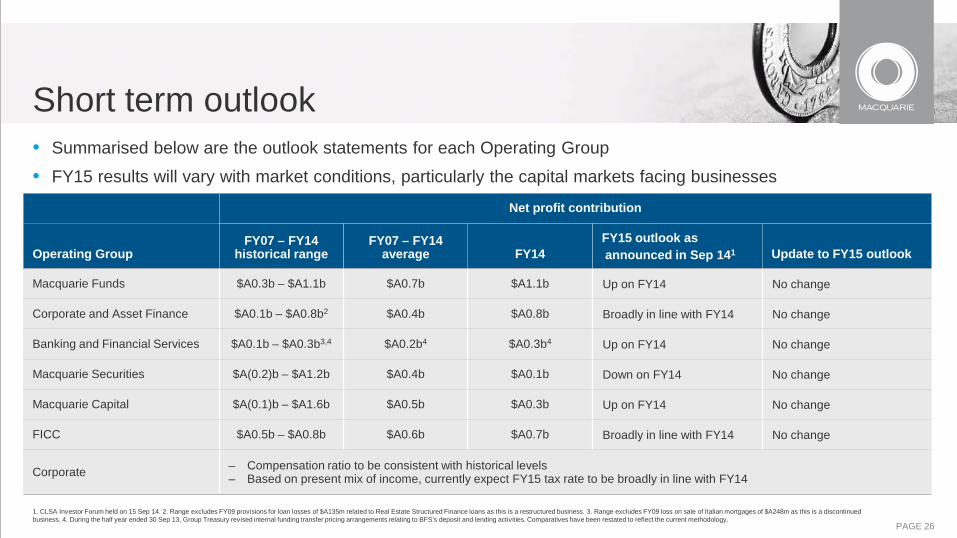
Short term outlook • Summarised below are the outlook statements for each Operating Group
• FY15 results will vary with market conditions, particularly the capital markets facing businesses
Net profit contribution
Operating Group FY07 – FY14
historical range FY07 – FY14
average FY14 FY15 outlook as announced in Sep 141 Update to FY15 outlook
Macquarie Funds $A0.3b – $A1.1b $A0.7b $A1.1b Up on FY14 No change
Corporate and Asset Finance $A0.1b – $A0.8b2 $A0.4b $A0.8b Broadly in line with FY14 No change
Banking and Financial Services $A0.1b – $A0.3b3,4 $A0.2b4 $A0.3b4 Up on FY14 No change
Macquarie Securities $A(0.2)b – $A1.2b $A0.4b $A0.1b Down on FY14 No change
Macquarie Capital $A(0.1)b – $A1.6b $A0.5b $A0.3b Up on FY14 No change
FICC $A0.5b – $A0.8b $A0.6b $A0.7b Broadly in line with FY14 No change
Corporate – Compensation ratio to be consistent with historical levels – Based on present mix of income, currently expect FY15 tax rate to be broadly in line with FY14
1. CLSA Investor Forum held on 15 Sep 14. 2. Range excludes FY09 provisions for loan losses of $A135m related to Real Estate Structured Finance loans as this is a restructured business. 3. Range excludes FY09 loss on sale of Italian mortgages of $A248m as this is a discontinued business. 4. During the half year ended 30 Sep 13, Group Treasury revised internal funding transfer pricing arrangements relating to BFS’s deposit and lending activities. Comparatives have been restated to reflect the current methodology.

PAGE 27
• While the impact of future market conditions makes forecasting difficult, we continue to expect that the FY15 combined net profit contribution1 from operating groups will be up on FY14, offsetting the FY14 realised gain relating to the SYD distribution
• The FY15 tax rate is currently expected to be broadly in line with FY14
• Accordingly, the FY15 result for the Group is currently expected to be slightly up on FY14
• Our short term outlook remains subject to a range of challenges including:
– Market conditions
– The impact of foreign exchange
– The cost of our continued conservative approach to funding and capital
– Potential regulatory changes and tax uncertainties
Short term outlook
1. Net profit contribution is management accounting profit before unallocated corporate costs, profit share and income tax.
PAGE 28
• Macquarie remains well positioned to deliver superior performance in the medium term • Deep expertise in major markets • Build on our strength in diversity and continue to adapt our portfolio mix to changing market conditions
– Annuity-style income is provided by three significant businesses which are delivering superior returns following years of investment and recent acquisitions – Macquarie Funds, Corporate and Asset Finance and Banking and Financial Services
– Three capital markets facing businesses well positioned to benefit from improvements in market condition with strong platforms and franchise positions – Macquarie Securities, Macquarie Capital and Fixed Income, Currencies and Commodities
• Ongoing benefits of continued cost initiatives • Strong and conservative balance sheet
– Well matched funding profile with minimal reliance on short term wholesale funding – Surplus funding and capital available to support growth
• Proven risk management framework and culture
Medium term
PAGE 29
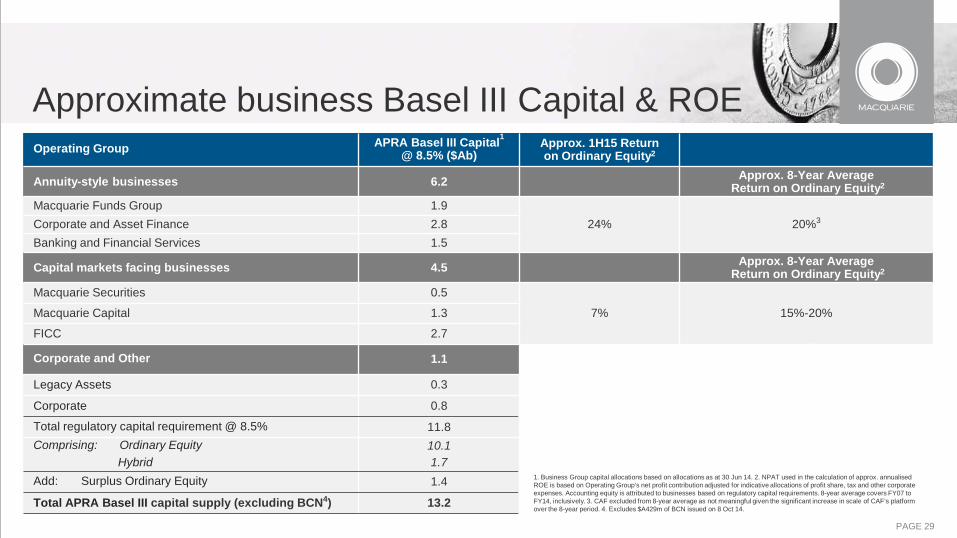
Operating Group APRA Basel III Capital1 @ 8.5% ($Ab)
Approx. 1H15 Return on Ordinary Equity2
Annuity-style businesses 6.2 Approx. 8-Year Average Return on Ordinary Equity2
Macquarie Funds Group 1.9 24% 20%3 Corporate and Asset Finance 2.8
Banking and Financial Services 1.5
Capital markets facing businesses 4.5 Approx. 8-Year Average Return on Ordinary Equity2
Macquarie Securities 0.5
7% 15%-20% Macquarie Capital 1.3
FICC 2.7
Corporate and Other 1.1
Legacy Assets 0.3
Corporate 0.8
Total regulatory capital requirement @ 8.5% 11.8 Comprising: Ordinary Equity
Hybrid 10.1 1.7
Add: Surplus Ordinary Equity 1.4
Total APRA Basel III capital supply (excluding BCN4) 13.2
Approximate business Basel III Capital & ROE
1. Business Group capital allocations based on allocations as at 30 Jun 14. 2. NPAT used in the calculation of approx. annualised ROE is based on Operating Group’s net profit contribution adjusted for indicative allocations of profit share, tax and other corporate expenses. Accounting equity is attributed to businesses based on regulatory capital requirements. 8-year average covers FY07 to FY14, inclusively. 3. CAF excluded from 8-year average as not meaningful given the significant increase in scale of CAF’s platform over the 8-year period. 4. Excludes $A429m of BCN issued on 8 Oct 14.

04 Capital and Funding
Presentation to Debt Investors November 2014
PAGE 31
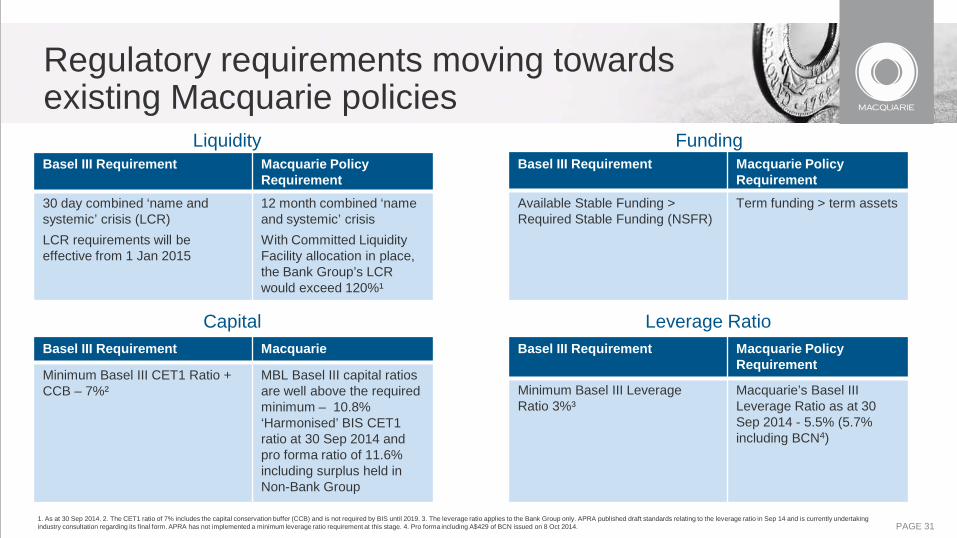
Liquidity Basel III Requirement Macquarie Policy
Requirement
30 day combined ‘name and systemic’ crisis (LCR)
LCR requirements will be effective from 1 Jan 2015
12 month combined ‘name and systemic’ crisis
With Committed Liquidity Facility allocation in place, the Bank Group’s LCR would exceed 120%¹
Regulatory requirements moving towards existing Macquarie policies
Basel III Requirement Macquarie Policy Requirement
Available Stable Funding > Required Stable Funding (NSFR)
Term funding > term assets
Funding
Leverage Ratio Capital Basel III Requirement Macquarie
Minimum Basel III CET1 Ratio + CCB – 7%²
MBL Basel III capital ratios are well above the required minimum – 10.8% ‘Harmonised’ BIS CET1 ratio at 30 Sep 2014 and pro forma ratio of 11.6% including surplus held in Non-Bank Group
Basel III Requirement Macquarie Policy Requirement
Minimum Basel III Leverage Ratio 3%³
Macquarie’s Basel III Leverage Ratio as at 30 Sep 2014 - 5.5% (5.7% including BCN4)
1. As at 30 Sep 2014. 2. The CET1 ratio of 7% includes the capital conservation buffer (CCB) and is not required by BIS until 2019. 3. The leverage ratio applies to the Bank Group only. APRA published draft standards relating to the leverage ratio in Sep 14 and is currently undertaking industry consultation regarding its final form. APRA has not implemented a minimum leverage ratio requirement at this stage. 4. Pro forma including A$429 of BCN issued on 8 Oct 2014.
PAGE 32
• On-market share purchases since 31 Mar 14 – FY14 MEREP $A265m at a weighted average price of $A59.56 – 2H14 Dividend Reinvestment Plan $A63m at a weighted average price of $A59.94
• On 8 Oct 14, $A429m Macquarie Bank Capital Notes (BCN) were issued. The BCN were issued by MBL and have been confirmed eligible for inclusion as Additional Tier 1 capital by APRA
• Given business growth, the Board has resolved to issue shares to satisfy the Dividend Reinvestment Plan for the 1H15 dividend and has reintroduced a discount to the prevailing market price1 of 1.5%
• In Aug 14, APRA issued its final rules for Conglomerates with the implementation timing dependent on the outcomes of the Financial System Inquiry. We continue to work through the application of these rules with APRA, however, our current assessment is that Macquarie has sufficient capital to meet the minimum APRA capital requirements for Conglomerates
Capital management and regulatory update
1. Determined in accordance with the DRP rules as the average of the daily volume weighted average price over the nine business days commencing on the third business day after the relevant election date.

PAGE 33
3.0 3.0 2.5
1.4
1.51.8
4.1 4.1
2.52.9
0.5
0.4
(0.5)
(1.6)
0.0
1.0
2.0
3.0
4.0
5.0
Harmonised Basel IIIat Mar 14
Business Growth Net Capital Generation Harmonised Basel IIIat Sep 14
APRA Basel III'super equivalence'
APRA Basel IIIat Sep 14
Issuanceof BCN
Pro forma APRA Basel IIIat Sep 14
Group regulatory surplus: Basel III (Sep 14)
Group regulatory surplus at 7% RWAs Group regulatory surplus at 8.5% RWAs
$Ab
$A429m Macquarie Bank Capital Notes (BCN) were issued on 8 Oct 14
5 6 4
Mainly growth in BFS Mortgages Australia & CAF Leasing & Lending activities
Basel III capital position • APRA Basel III Group capital (including BCN1) at Sep 14 of $A13.7b, Group surplus of $A1.8b (1 Jan 16 requirements2),
$A2.9b (existing requirements3)
• Bank Group APRA Basel III CET1 ratio: 8.7% (9.6% including Non-Bank Group capital surplus) • Bank Group APRA Basel III Tier 1 ratio: 10.3% including BCN1 (11.1% including Non-Bank Group capital surplus)
1. Pro forma including $A429m of BCN issued on 8 Oct 14 , which are eligible for inclusion as Additional Tier 1 Capital. 2. Calculated at 8.5% RWA including capital conservation buffer (CCB), per the 1 Jan 16 minimum requirements in the APRA Prudential Standard APS 110. 3. Calculated at 7% RWA, per the internal minimum Tier 1 ratio of the Bank Group. 4. ‘Harmonised’ Basel III estimates assume alignment with BIS in areas where APRA differs from the BIS. 5. Includes 1H15 P&L net of FY14 dividend, Share Based Payment reserve movement, FY14 MEREP & other movements in capital supply and requirements including the net impact of hedging employed to reduce the sensitivity of the Group’s capital position to FX translation movements. 6. APRA Basel III ‘super-equivalence’ includes full CET1 deductions of equity investments ($A0.6b); deconsolidated subsidiaries ($A0.5b); DTAs and other impacts ($A0.5b).
Based on 8.5% (minimum Tier 1 ratio + CCB), which is not required by APRA until 2016
PAGE 34
• Balance sheet remains solid and conservative
– Term assets covered by term funding, stable deposits and equity
– Minimal reliance on short term wholesale funding markets
• Retail deposits1 continuing to grow, 6% to $A35.3b in Sep 14 from $A33.3b at Mar 14
• $A17.4b2 of new term funding raised in FY14
• $A11.2b3 of new term funding raised since 31 Mar 14:
– $A4.7b mortgage and motor vehicle/equipment secured funding
– $A4.1b senior unsecured debt issuance in the US market
– $A1.6b senior unsecured debt issuance in Euro and Sterling markets
– $A0.4b MBL private placements and structured note issuance
– $A0.4b Macquarie Bank Capital Notes (BCN) issued on 8 Oct 14
Balance sheet highlights
1. Retail deposits are a subset of total deposits per the funded balance sheet ($A38.8b at 30 Sep 14), which differs from total deposits per the statutory balance sheet ($A44.2b at 30 Sep 14). The funded balance sheet excludes any deposits which do not represent a funding source for the Group. 2. Issuances are AUD equivalent based on FX rates at the time of issuance. 3. Amounts are AUD equivalent based on FX rates at the time of issuance and amounts include issuances completed during Oct 14, comprising BCN ($A0.4b) and MBL 3 year USD bond ($A2.0b).

PAGE 35
Liquidity Policy • The key requirement of MGL and MBL’s liquidity policies is that the entities are able to meet all liquidity obligations during a
period of liquidity stress:
– a minimum twelve month period with constrained or no access to funding markets and with only a limited impact on franchise businesses
• Term assets are funded by term funding, stable deposits and equity
Liquidity Framework • A robust liquidity risk management framework ensures that both MGL and MBL are able to meet their funding requirements
as they fall due under a range of market conditions. Key tools include:
– Scenario analysis
– Unencumbered liquid asset holdings
– Liability driven approach to balance sheet management
• Liquidity management is performed centrally by Group Treasury, with oversight from the Asset and Liability Committee and the Risk Management Group
• The Boards of each entity approve their respective liquidity policy and are provided with liquidity reporting on a monthly basis
Conservative long standing liquidity risk management framework

PAGE 36
0
10
20
30
40
50
60
70
80
90
100
Funding sources Funded assets
Equity and hybrids (13%)
Retail deposits (36%)
Wholesale deposits (4%)
Other debt maturing in the next 12 mths (8%)
ST wholesale issued paper (12%)
Cash, liquids and self securitised assets (30%)
Trading assets (17%)
Loan assets > 1 year (35%)
Debt maturing beyond 12 mths (27%)
Equity investments and PPE (7%)
Loan assets < 1 year (11%)
0
10
20
30
40
50
60
70
80
90
100
Funding sources Funded assets
Equity investments and PPE (8%)
Loan assets > 1 year (33%)
Loan assets < 1 year (13%)
Trading assets (16%)
Cash, liquids and self securitised assets (30%)
Debt maturing beyond 12 mths (27%)
Equity and hybrids (14%)
Retail deposits (36%)
Other debt maturing in the next 12 mths (9%)
Wholesale deposits (5%)
ST wholesale issued paper (9%)
0
10
20
30
40
50
60
70
80
90
100
Funding sources Funded assets
Equity and hybrids (13%)
Debt maturing beyond 12 mths (29%)
Retail deposits (36%)
Wholesale deposits (4%)
Other debt maturing in the next 12 mths (9%)
ST wholesale issued paper (9%)
Equity investments and PPE (7%)
Loan assets > 1 year (34%)
Loan assets < 1 year (12%)
Trading assets (18%)
Cash, liquids and self securitised assets (29%)
Funded balance sheet remains strong 31 March 2014 30 September 2014 30 September 2013
These charts represent Macquarie Group Limited’s funded balance sheets at the respective dates noted above. For details regarding reconciliation of the funded balance sheet to the Group’s statutory balance sheet, refer to slide 55. 1. ‘Other debt maturing in the next 12 mths’ includes Structured Notes, Secured Funding, Bonds, Other Loans maturing within the next 12 months and Net Trade Creditors. 2. ‘Debt maturing beyond 12 mths’ includes Loan Capital. The BCN ($A0.4b) and MBL 3 year USD bond ($A2.0b) issuances completed during Oct 14 are excluded from balances reported at 30 Sep 14. 3. ‘Cash, liquids and self securitised assets’ includes self securitisation of repo eligible Australian mortgages originated by Macquarie. 4. ‘Loan Assets > 1 yr’ includes Debt Investment Securities and Operating Lease Assets. 5. ‘Equity Investments and PPE’ includes the Group’s co-investments in Macquarie-managed funds and equity investments.
3
$Ab
2
5
4
1
$Ab
2
5
4
1 3
$Ab
2
5
1 3
4

PAGE 37
Wholesale issued paper12%
Deposits - corporate and wholesale
4%
Deposits - retail36%
Other loans1%
Structured notes2%
Secured funding6%
Senior credit facility1%
Bonds21%
Loan capital4%
Equity & Hybrid13%
0
5
10
15
20
25
1-2 yrs <3 yrs <4 yrs <5 yrs 5 yrs+
Debt Loan capital Equity and hybrids
Well diversified funding sources MGL term funding (drawn and undrawn1) maturing
beyond one year (including equity and hybrids)
• Well diversified funding sources • Minimal reliance on short term wholesale funding markets • Deposit base represents 40% of total funding sources
Diversity of MGL funding sources
• Term funding beyond one year (excluding equity) has a weighted average term to maturity of 4.5 years
1. Includes $A0.7b of undrawn term facilities for the Group.
$Ab

PAGE 38
0
5
10
15
20
25
30
35
40
Mar-10 Mar-11 Mar-12 Mar-13 Mar-14 Sep-14
($Ab)
Retail Corporate/wholesale
Continued retail deposit1 growth • Macquarie has been successful in pursuing its strategy of diversifying its funding sources through
growing its deposit base
– 1.1 million retail clients, of whom circa 600,000 are depositors
– Focus on the composition and quality of the deposit base
– Continue to grow deposits in the CMA product which has an average account balance of $A43,000
1. Retail deposits are those placed with the Banking and Financial Services Group and include products such as the Cash Management Account, Term Deposits and Business Banking deposits. Retail counterparties primarily consist of individuals, self-managed super funds and small to medium enterprises.

PAGE 39
Macquarie Bank Limited Macquarie Group Limited
Long-term
rating
Long-term
rating outlook
Short-term
rating
Long-term
rating
Long-term
rating outlook
Short-term
rating
Moody’s A2 Stable P-1 A3 Stable P-2
Fitch A Stable F-1 A- Stable F-2
S&P A Stable A-1 BBB Stable A-2
Current credit ratings

PAGE 40
JPMorgan Chase Bank
Credit Suisse AG
UBS AG Barclays Bank Deutsche Bank
Goldman Sachs Group
Bank of America
Citibank Morgan Stanley Bank
Macquarie Bank
Rat
ing
mov
emen
t (no
tche
s)
AA- A+
A
AA
AA+
A- BBB+
Rat
ing
mov
emen
t (no
tche
s)
Aa2 Aa3 A1
Aa1 AAA
A2
Baa1 A3
JPMorgan Chase Bank
UBS AG
Deutsche Bank
Credit Suisse AG
Barclays Bank
Bank of America
Citibank
Goldman Sachs Group
Morgan Stanley Bank
Macquarie Bank
Moody’s Ratings Movements from 1 May 2007
Standard & Poor’s Ratings Movements from 1 May 2007
As at 30 July 2014 *Goldman Sachs Group is used for comparison purposes. Goldman Sachs bank only rated by Standard & Poor’s from 2012.
2007
2014
Intra-period ratings
movement
MBL has maintained its S&P ‘A’ rating for
YEARS 23
MBL long term ratings stability

05 Appendices
Presentation to Debt Investors November 2014

A Appendix: Macquarie Bank Limited
30 September 2014 Presentation to Debt Investors
November 2014

PAGE 43
• Net profit $A394m, up 8% on 1H14 and up 2% on 2H14 • Operating income $A2.8b, up 11% on 1H14 and down 3% on 2H14 • Macquarie’s annuity-style businesses (Macquarie Funds Group, Corporate and Asset Finance, and Banking and Financial
Services) continued to perform well with 1H15 combined net profit contribution1 up 18% on 1H14 and up 3% on 2H14 • Macquarie’s capital markets facing businesses’ (Macquarie Securities and Fixed Income, Currencies and Commodities)
combined net profit contribution up 4% on 1H14 and down 54% on a 2H14 which benefited from strong results in the Energy Markets business
• Operating expenses $A2.1b, up 9% on 1H14 and in line with 2H14 • Effective tax rate 41.8% up from 36.3% in 1H14 and down from 50.7% in 2H14
1H15 Result
1. Net profit contribution is management accounting profit before unallocated corporate costs, profit share and income tax.

PAGE 44
1H15 $Am
2H14 $Am
1H14 $Am
1H15 v 1H14
Net operating income 2,840 2,930 2,556 11%
Total operating expenses (2,145) (2,124) (1,967) 9%
Operating profit before income tax 695 806 589 18%
Income tax expense (290) (408) (213) 36%
Profit attributable to non-controlling interests (2) (2) (2)
Distribution paid or provided for on: Macquarie Income Securities (9) (9) (9)
Profit attributable to ordinary equity holders of MBL 394 387 365 8%
1H15 Result

PAGE 45
Wholesale issued paper 14%
Deposits - corporate and wholesale 4%
Deposits - retail 42%
Other loans 1% Structured notes 2%
Secured funding 7%
Net trade creditors 1%
Bonds 15%
Loan capital 3%
Equity & Hybrids 11%
Well diversified funding sources
1. There are no undrawn term facilities in the Bank Group.
MBL term funding (drawn and committed but undrawn1) maturing beyond one year (including
equity and hybrids)
• Well diversified funding sources • Minimal reliance on short term wholesale funding markets • Deposit base represents 46% of total funding sources
Diversity of MBL funding sources
• Term funding beyond one year (excluding equity) has a weighted average term to maturity of 3.7 years
$Ab
0.0
2.0
4.0
6.0
8.0
10.0
12.0
14.0
16.0
1-2yrs <3yrs <4yrs <5yrs 5yrs +
Equity and hybrids Loan capital Debt

B Appendix: Australian Economy
Presentation to Debt Investors November 2014
PAGE 47
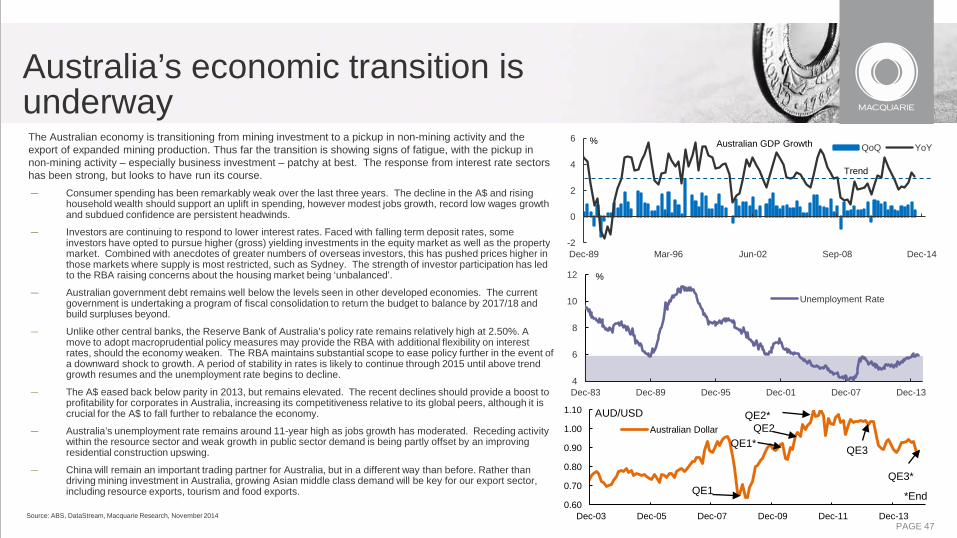
The Australian economy is transitioning from mining investment to a pickup in non-mining activity and the export of expanded mining production. Thus far the transition is showing signs of fatigue, with the pickup in non-mining activity – especially business investment – patchy at best. The response from interest rate sectors has been strong, but looks to have run its course. — Consumer spending has been remarkably weak over the last three years. The decline in the A$ and rising
household wealth should support an uplift in spending, however modest jobs growth, record low wages growth and subdued confidence are persistent headwinds.
— Investors are continuing to respond to lower interest rates. Faced with falling term deposit rates, some investors have opted to pursue higher (gross) yielding investments in the equity market as well as the property market. Combined with anecdotes of greater numbers of overseas investors, this has pushed prices higher in those markets where supply is most restricted, such as Sydney. The strength of investor participation has led to the RBA raising concerns about the housing market being ‘unbalanced’.
— Australian government debt remains well below the levels seen in other developed economies. The current government is undertaking a program of fiscal consolidation to return the budget to balance by 2017/18 and build surpluses beyond.
— Unlike other central banks, the Reserve Bank of Australia’s policy rate remains relatively high at 2.50%. A move to adopt macroprudential policy measures may provide the RBA with additional flexibility on interest rates, should the economy weaken. The RBA maintains substantial scope to ease policy further in the event of a downward shock to growth. A period of stability in rates is likely to continue through 2015 until above trend growth resumes and the unemployment rate begins to decline.
— The A$ eased back below parity in 2013, but remains elevated. The recent declines should provide a boost to profitability for corporates in Australia, increasing its competitiveness relative to its global peers, although it is crucial for the A$ to fall further to rebalance the economy.
— Australia’s unemployment rate remains around 11-year high as jobs growth has moderated. Receding activity within the resource sector and weak growth in public sector demand is being partly offset by an improving residential construction upswing.
— China will remain an important trading partner for Australia, but in a different way than before. Rather than driving mining investment in Australia, growing Asian middle class demand will be key for our export sector, including resource exports, tourism and food exports.
Australia’s economic transition is underway
Source: ABS, DataStream, Macquarie Research, November 2014
4
6
8
10
12
Dec-83 Dec-89 Dec-95 Dec-01 Dec-07 Dec-13
Unemployment Rate
%
-2
0
2
4
6
Dec-89 Mar-96 Jun-02 Sep-08 Dec-14
QoQ YoY % Australian GDP Growth
Trend
0.60
0.70
0.80
0.90
1.00
1.10
Dec-03 Dec-05 Dec-07 Dec-09 Dec-11 Dec-13
Australian Dollar
AUD/USD
QE1
QE3
QE2 QE1*
QE2*
*End
QE3*

PAGE 48
A weaker A$ will help boost profits in both the resource and non-resource sectors
Source: DataStream, ABS, Macquarie Research, November 2014.
0
10
20
30
40
50
60
0
10
20
30
40
50
60
Dec-98 Dec-01 Dec-04 Dec-07 Dec-10 Dec-13
Total Profits
Profits Excluding Mining
$A bn $A bn
Quarterly 0.60
0.70
0.80
0.90
1.00
1.10
Dec-03 Dec-05 Dec-07 Dec-09 Dec-11 Dec-13
Australian Dollar
AUD/USD
QE1
QE3
QE2
QE1*
QE2*
*End
QE3*

PAGE 49 Source: ABS, Macquarie Research, November 2014
Strong population growth supports demand for housing but households remain cautious
-2
0
2
4
6
8
10
12
14
16
18
Dec-83 Dec-88 Dec-93 Dec-98 Dec-03 Dec-08 Dec-13
Household Savings Rate
%
100
150
200
250
300
350
400
450
500
Sep-83 Sep-89 Sep-95 Sep-01 Sep-07 Sep-13 100
150
200
250
300
350
400
450
500
Dwelling Completions
Population growth
000's Population Growth and Housing Supply (Rolling annual total)

PAGE 50
Australian policy makers remain very well positioned to address global weakness
Source: RBA, DataStream, IMF, Macquarie Research, November 2014
The RBA has further scope to cut rates and the government maintains low levels of debt compared to its peers
0
20
40
60
80
100
120
140
160
Australia Euro area Japan United States United Kingdom
% of Net Debt to GDP 2012-2019
0
2
4
6
8
10
12
Jun-94 Jun-98 Jun-02 Jun-06 Jun-10 Jun-14
RBA Cash Rate FED Funds Rate
BoJ Policy Rate RBNZ Cash Rate
ECB Policy Rate BoE Repo Rate
PBoC Policy Rate
%

C Appendix: Funding
Presentation to Debt Investors November 2014
PAGE 52
0
5
10
15
20
25
1-2 yrs <3 yrs <4 yrs <5 yrs 5 yrs+
Debt Loan capital Equity and hybrids
Funding for the Group 30 September 2014
Sep 14 $Ab
Mar 14 $Ab
Sep 13 $Ab
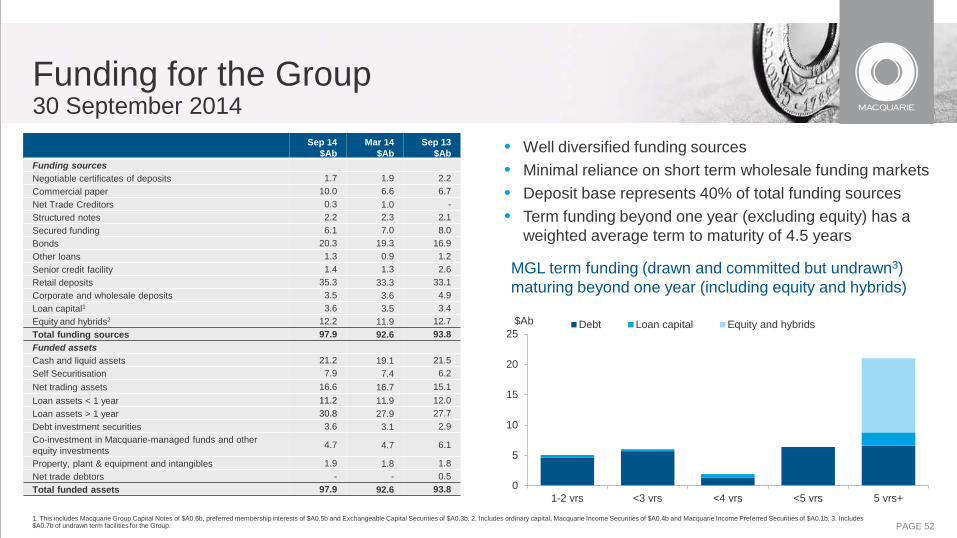
Funding sources Negotiable certificates of deposits 1.7 1.9 2.2 Commercial paper 10.0 6.6 6.7 Net Trade Creditors 0.3 1.0 - Structured notes 2.2 2.3 2.1 Secured funding 6.1 7.0 8.0 Bonds 20.3 19.3 16.9 Other loans 1.3 0.9 1.2 Senior credit facility 1.4 1.3 2.6 Retail deposits 35.3 33.3 33.1 Corporate and wholesale deposits 3.5 3.6 4.9 Loan capital1 3.6 3.5 3.4 Equity and hybrids2 12.2 11.9 12.7 Total funding sources 97.9 92.6 93.8 Funded assets Cash and liquid assets 21.2 19.1 21.5 Self Securitisation 7.9 7.4 6.2 Net trading assets 16.6 16.7 15.1 Loan assets < 1 year 11.2 11.9 12.0 Loan assets > 1 year 30.8 27.9 27.7 Debt investment securities 3.6 3.1 2.9 Co-investment in Macquarie-managed funds and other equity investments 4.7 4.7 6.1
Property, plant & equipment and intangibles 1.9 1.8 1.8 Net trade debtors - - 0.5 Total funded assets 97.9 92.6 93.8
• Well diversified funding sources • Minimal reliance on short term wholesale funding markets • Deposit base represents 40% of total funding sources • Term funding beyond one year (excluding equity) has a
weighted average term to maturity of 4.5 years
MGL term funding (drawn and committed but undrawn3) maturing beyond one year (including equity and hybrids)
1. This includes Macquarie Group Capital Notes of $A0.6b, preferred membership interests of $A0.5b and Exchangeable Capital Securities of $A0.3b. 2. Includes ordinary capital, Macquarie Income Securities of $A0.4b and Macquarie Income Preferred Securities of $A0.1b. 3. Includes $A0.7b of undrawn term facilities for the Group.
$Ab
PAGE 53
Funding for the Bank Group 30 September 2014
Sep 14 $Ab
Mar 14 $Ab
Sep 13 $Ab
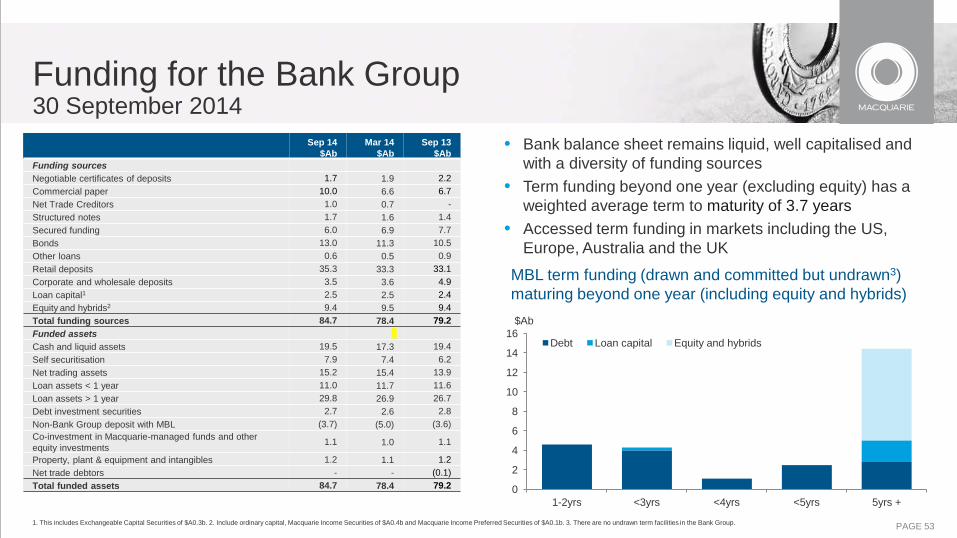
Funding sources Negotiable certificates of deposits 1.7 1.9 2.2 Commercial paper 10.0 6.6 6.7 Net Trade Creditors 1.0 0.7 - Structured notes 1.7 1.6 1.4 Secured funding 6.0 6.9 7.7 Bonds 13.0 11.3 10.5 Other loans 0.6 0.5 0.9 Retail deposits 35.3 33.3 33.1 Corporate and wholesale deposits 3.5 3.6 4.9 Loan capital1 2.5 2.5 2.4 Equity and hybrids2 9.4 9.5 9.4 Total funding sources 84.7 78.4 79.2 Funded assets Cash and liquid assets 19.5 17.3 19.4 Self securitisation 7.9 7.4 6.2 Net trading assets 15.2 15.4 13.9 Loan assets < 1 year 11.0 11.7 11.6 Loan assets > 1 year 29.8 26.9 26.7 Debt investment securities 2.7 2.6 2.8 Non-Bank Group deposit with MBL (3.7) (5.0) (3.6) Co-investment in Macquarie-managed funds and other equity investments 1.1 1.0 1.1
Property, plant & equipment and intangibles 1.2 1.1 1.2 Net trade debtors - - (0.1) Total funded assets 84.7 78.4 79.2
• Bank balance sheet remains liquid, well capitalised and with a diversity of funding sources
• Term funding beyond one year (excluding equity) has a weighted average term to maturity of 3.7 years
• Accessed term funding in markets including the US, Europe, Australia and the UK
MBL term funding (drawn and committed but undrawn3) maturing beyond one year (including equity and hybrids)
1. This includes Exchangeable Capital Securities of $A0.3b. 2. Include ordinary capital, Macquarie Income Securities of $A0.4b and Macquarie Income Preferred Securities of $A0.1b. 3. There are no undrawn term facilities in the Bank Group.
$Ab
0
2
4
6
8
10
12
14
16
1-2yrs <3yrs <4yrs <5yrs 5yrs +
Debt Loan capital Equity and hybrids

PAGE 54
0
2
4
6
8
1-2 yrs <3 yrs <4 yrs <5 yrs 5 yrs+
Debt Loan capital Equity
Funding for the Non-Bank Group 30 September 2014
Sep 14 $Ab
Mar 14 $Ab
Sep 13 $Ab
Funding sources Net Trade Creditors (0.7) 0.3 -
Structured notes 0.5 0.7 0.7
Secured funding 0.1 0.1 0.3
Bonds 7.3 8.0 6.4
Other loans 0.7 0.4 0.3
Senior credit facility 1.4 1.3 2.6
Loan capital1 1.1 1.0 1.0
Equity 2.8 2.4 3.3
Total funding sources 13.2 14.2 14.6
Funded assets
Cash and liquid assets 1.7 1.8 2.1
Non-Bank Group deposit with MBL 3.7 5.0 3.6
Net trading assets 1.4 1.3 1.2
Loan assets < 1 year 0.2 0.2 0.4
Loan assets > 1 year 1.0 1.0 1.0
Debt investment securities 0.9 0.5 0.1
Co-investment in Macquarie-managed funds and other equity investments 3.6 3.7 5.0
Property, plant & equipment and intangibles 0.7 0.7 0.6
Net trade debtors - - 0.6
Total funded assets 13.2 14.2 14.6
• Non-Bank Group is predominantly term funded
• Term funding beyond one year (excluding equity) has a weighted average term to maturity of 5.8 years
Non-Bank Group term funding (drawn and committed but undrawn2) maturing beyond one year (including equity)
1. Includes Macquarie Group Capital Notes of $A0.6b and Preferred Membership Interests of $A0.5b. 2. Includes $A0.7b of undrawn term facilities for the Non-Bank Group.
$Ab

PAGE 55
Funded balance sheet reconciliation • The Group’s statement of financial position is prepared based on generally accepted accounting principles which do not
represent actual funding requirements
• A funded balance sheet reconciliation has been prepared to reconcile the reported assets of the consolidated Group to the assets that require funding
Sep 14 $Ab
Mar 14
$Ab Sep 13
$Ab
Total assets per Statement of Financial Position 162.3 153.9 154.6 Deductions:
Self funded trading assets (16.2) (17.9) (16.7) Derivative revaluation accounting gross ups (14.3) (11.6) (13.9) Life investment contracts and other segregated assets (5.6) (5.7) (5.2) Outstanding trade settlement balances (7.1) (7.2) (7.0) Short-term working capital assets (5.7) (5.5) (5.3)
Less non-recourse funded assets: Securitised assets and non-recourse warehouses (15.5) (13.4) (12.7)
Total assets per Funded Balance Sheet 97.9 92.6 93.8

PAGE 56
• Self funded trading assets: Macquarie enters into stock borrowing and lending as well as repurchase agreements and reverse repurchase agreements in the normal course of trading activity that it conducts with its clients and counterparties. Also as part of its trading activities, Macquarie pays and receives margin collateral on its outstanding derivative positions. These trading related asset and liability positions are presented gross on the statement of financial position but are viewed as being self funded to the extent that they offset one another and, therefore, are netted as part of this adjustment.
• Derivative revaluation accounting gross ups: Macquarie’s derivative activities are mostly client driven with client positions hedged by off-setting positions with a variety of counterparties. The derivatives are largely matched and this adjustment reflects that the matched positions do not require funding.
• Life investment contracts and other segregated assets: These represent the assets and liabilities that are recognised where Macquarie provides products such as investment-linked policy contracts or where Macquarie holds segregated client monies. The policy (contract) liability and client monies will be matched by assets held to the same amount and hence does not require funding.
• Outstanding trade settlement balances: At any particular time Macquarie will have outstanding trades to be settled as part of its brokering business and trading activities. These amounts (payables) can be offset in terms of funding by amounts that Macquarie is owed on other trades (receivables).
• Short-term working capital assets: As with the outstanding trade settlement balances above, Macquarie through its day-to-day operations generates working capital assets (e.g. receivables and prepayments) and working capital liabilities (e.g. creditors and accruals) that produce a ‘net balance’ that either requires or provides funding.
• Securitised assets and non-recourse warehouses: These represent assets that are funded by third parties with no recourse to Macquarie including lending assets (mortgages and leasing) sold down into external securitisation entities.
Explanation of Funded Balance Sheet reconciling items

D Appendix: Other Financial Information
Presentation to Debt Investors November 2014

PAGE 58
Category Sep 14
$Ab Mar 14
$Ab Sep 13
$Ab Mortgages:
Australia 12.6 10.5 8.4
Canada, United States and other regions 5.2 5.7 6.8
Total mortgages 17.8 16.2 15.2 Structured investments 2.3 3.8 4.3
Banking 4.9 4.2 4.1
Real Estate 2.9 2.5 2.6
Resources and commodities 2.6 2.4 2.1
Finance leases 4.7 5.0 4.9
Corporate lending 6.5 6.0 5.5
Other lending 2.2 1.4 1.5
43.9 41.5 40.2 Operating leases 6.0 5.7 5.7
Total loan assets per funded balance sheet2 49.9 47.2 45.9
Loan portfolio1 growth – Funded Balance Sheet
1 . Loan assets are reported on a funded balance sheet basis and therefore exclude certain items such as assets that are funded by third parties with no recourse to Macquarie. In addition, loan assets at amortised cost per the statutory balance sheet of $A64.4b at 30 Sep 14 ($A58.7b at 31 Mar 14) are adjusted to include fundable assets not classified as loans on the statutory balance sheet (for example, assets subject to operating leases which are recorded in Property, Plant and Equipment in the statutory balance sheet). 2. Total loan assets per funded balance sheet includes self securitisation assets.

PAGE 59
10yr history of loan performance
1. Loans assets exclude securitised mortgages, securitised Macquarie Capital loans/leases, segregated futures funds and receivables in the form of fees. 2. Net impaired assets and net losses excludes investment securities. 3. Collective provision is intended to cover losses inherent in the existing overall credit portfolio which are not yet specifically identifiable. 4. Net credit losses represent total P&L impact in the stated period due to additional specific provisions and direct write-offs net of any write-backs.
0.0%
1.0%
2.0%
3.0%
4.0%
5.0%
2004 2005 2006 2007 2008 2009 2010 2011 2012 2013 Sep-13 Mar-14 Sep-14
Ratio of Provisions and Impaired Assets to Loans, Advances and Leases
Collective provision to loans, advances and leases (Balance sheet)
Net impaired assets to loans, advances and leases (Balance sheet)
Net Credit losses to loans, advances and leases (Income statement)
PAGE 60
Category
Carrying value2 Sep 14
$Am
Carrying value2 Mar 14
$Am Description
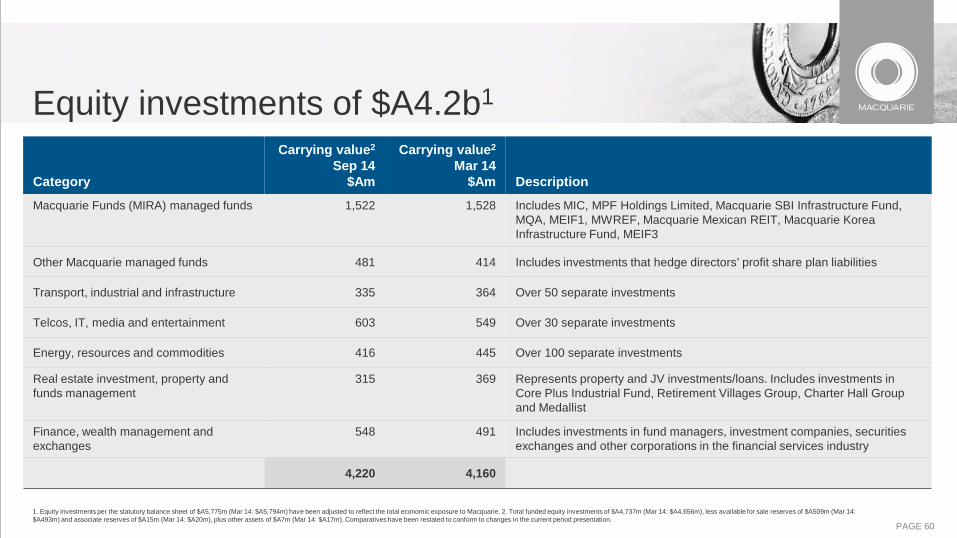
Macquarie Funds (MIRA) managed funds 1,522 1,528 Includes MIC, MPF Holdings Limited, Macquarie SBI Infrastructure Fund, MQA, MEIF1, MWREF, Macquarie Mexican REIT, Macquarie Korea Infrastructure Fund, MEIF3
Other Macquarie managed funds 481 414 Includes investments that hedge directors’ profit share plan liabilities
Transport, industrial and infrastructure 335 364 Over 50 separate investments
Telcos, IT, media and entertainment 603 549 Over 30 separate investments
Energy, resources and commodities 416 445 Over 100 separate investments
Real estate investment, property and funds management
315 369 Represents property and JV investments/loans. Includes investments in Core Plus Industrial Fund, Retirement Villages Group, Charter Hall Group and Medallist
Finance, wealth management and exchanges
548 491 Includes investments in fund managers, investment companies, securities exchanges and other corporations in the financial services industry
4,220 4,160
Equity investments of $A4.2b1
1. Equity investments per the statutory balance sheet of $A5,775m (Mar 14: $A5,794m) have been adjusted to reflect the total economic exposure to Macquarie. 2. Total funded equity investments of $A4,737m (Mar 14: $A4,656m), less available for sale reserves of $A509m (Mar 14: $A493m) and associate reserves of $A15m (Mar 14: $A20m), plus other assets of $A7m (Mar 14: $A17m). Comparatives have been restated to conform to changes in the current period presentation.

PAGE 61
Equity investments The equity investment portfolio is well diversified
• Total face value of equity investments as at 30 September 2014 was $4.2b1
‒ The portfolio is diversified across industries and countries as shown in the charts below
• The average economic capital held behind these investments is 51%
1. Equity investments per the statutory balance sheet of $A5,775m have been adjusted to reflect the total economic exposure to Macquarie. Total funded equity investments of $A4,737m, less available for sale reserves of $A509m and associate reserves of $A15m, plus other assets of $A7m.
Australia & New Zealand
23%
Asia 18%
North America 29%
Africa & Middle East
5%
Europe & UK 24%
South America 1%
Operations across several continents
3%
MGL Equity Risk Exposure by Region Real Estate
Investments, 12%
Diversified Infrastructure and
Utilities, 33%
Diversified Financials, 6%
Energy, 9% Materials, 3%
Road and Rail Transport, 3%
Media, 7%
Road and Rail Transport, 5%
Consumer, Commerical and
Software Services & Supplies, 9%
Other, 16%
MGL Equity Investments by Industry
PAGE 62
• Macquarie’s entitlement to receive performance fees on its unlisted funds typically occurs once investors have received repayment of their initial capital invested as well as their preferential return
• The performance fee structure is typically a percentage of the fund’s return once a fund has surpassed the investors’ agreed return
• For unlisted funds, Macquarie’s policy is to recognise a performance fee only once the fee can be reliably measured and the risk of not receiving the fee is highly improbable. Factors that are taken into consideration when determining the quantum and timing of the performance fee recognised include:
– The proportion of assets already realised
– Returns on assets realised to date
– Downside valuation on remaining assets and reliability of these estimates
– Nature of investments and volatility of investment returns
• Accordingly, the quantum and timing of performance fees recognised in the income statement require significant judgement and will vary depending on the specific factors relevant for each fund
• As performance fees are recognised, Macquarie will update the market to the extent that they will impact any guidance previously provided
Recognition of performance fees from unlisted funds
PAGE 63
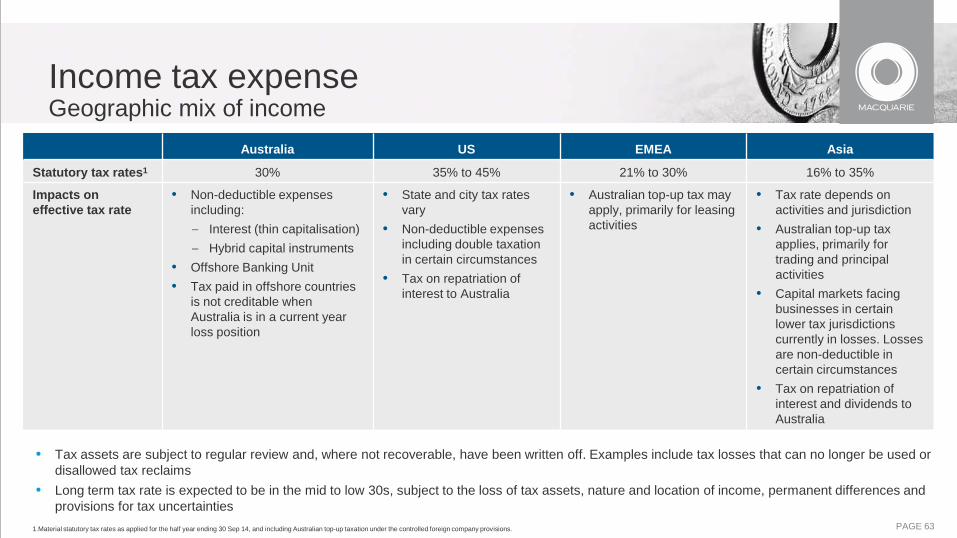
Australia US EMEA Asia
Statutory tax rates1 30% 35% to 45% 21% to 30% 16% to 35%
Impacts on effective tax rate
• Non-deductible expenses including: – Interest (thin capitalisation) – Hybrid capital instruments
• Offshore Banking Unit • Tax paid in offshore countries
is not creditable when Australia is in a current year loss position
• State and city tax rates vary
• Non-deductible expenses including double taxation in certain circumstances
• Tax on repatriation of interest to Australia
• Australian top-up tax may apply, primarily for leasing activities
• Tax rate depends on activities and jurisdiction
• Australian top-up tax applies, primarily for trading and principal activities
• Capital markets facing businesses in certain lower tax jurisdictions currently in losses. Losses are non-deductible in certain circumstances
• Tax on repatriation of interest and dividends to Australia
• Tax assets are subject to regular review and, where not recoverable, have been written off. Examples include tax losses that can no longer be used or disallowed tax reclaims
• Long term tax rate is expected to be in the mid to low 30s, subject to the loss of tax assets, nature and location of income, permanent differences and provisions for tax uncertainties
1.Material statutory tax rates as applied for the half year ending 30 Sep 14, and including Australian top-up taxation under the controlled foreign company provisions.
Income tax expense Geographic mix of income

PAGE 64
Income tax expense Tax uncertainties
• Macquarie carries a provision for tax uncertainties • Reviews of the tax uncertainties are conducted periodically and may be adjusted where there is a change in
circumstances or disagreement with the relevant revenue authorities arising out of a risk review or audit:
• Macquarie has considered its position with respect to unresolved matters and other tax claims, including seeking advice,
and considers that it holds appropriate provisions • Macquarie is seeking to enter into an Advance Pricing Arrangement with various tax authorities in relation to its
international income
Non Australian revenue authorities
– Reviews and audits tend to be real time or periodic
– No significant matters outstanding
Australian revenue authorities
– ATO has historically conducted reviews and audits some years after the relevant tax year
– Currently a small number of matters are unresolved or under review from prior years
– For more recent years, the ATO has undertaken a process of real time review with any areas of potential uncertainty addressed using tax rulings where possible
Macquarie Group Limited Presentation to Debt Investors
November 2014