Embed Size (px)
DESCRIPTION
Swiss Re’s Enterprise Risk Management in the context of Solvency II and the Swiss Solvency Test (SST). Presentation to ASSAL-OECD-IAIS Conference 29 April 2009 Robert Peduto, Head Business Risk Review. ASSAL ERM @ Swiss Re 29 April 2009. Agenda. - PowerPoint PPT Presentation
Citation preview

Swiss Re’s Enterprise RiskManagement in the contextof Solvency II and the Swiss Solvency Test (SST)
Presentation to ASSAL-OECD-IAIS Conference
29 April 2009
Robert Peduto, Head Business Risk Review
ASSALERM @ Swiss Re29 April 2009

Slide 2
Agenda
Motivation and elements of European Solvency regimes
ERM framework of Swiss Re
Summary
ASSAL-OECD-IAISERM @ Swiss Re29 April 2009

Slide 3
Recent events accelerated the development of Enterprise Risk Management in the (re)insurance industry
2001 2002 2003 2004 2005 2006
Solvency II/SST1
S&P’s ERM2
Equity market crash
9/11
1 Swiss Solvency Test
2 Standard & Poor’s Enterprise Risk Management
Weaker balance sheets of (re)insurers
Most prominent reactionsGeneral change in risk perception in light of experienced loss accumulation potential
20001999
Solvency I regime
P&C:
Max of % of net claims (avg
of past 3 years) % of net premiums
Life:Sum of % of net reserves % of unit linked % of sum assured
Liquidity crisis
2007 2008 2009

Slide 4
The comprehensive concept of Solvency II will improve the risk culture in different ways
Consideration of entire risk landscape and individual exposure
Greater integration of risk models
Quantitative requirements
Pillar I
Supervisory reviewPillar II
Market transparencyPillar III
Three pillar approach to Solvency II
Holistic risk management
Governance and internal control
Increased transparency improving stakeholder confidence by enforcing market discipline
Increased comparability of risk exposures
ASSAL-OECD-IAISERM @ Swiss Re29 April 2009

Slide 5
Swiss Solvency Test (SST) preceded the European Solvency II
2009 2010 2011 2012200820072006. . .
1.1.2006 Enactment of the Swiss Solvency Test
Two year grace period for implementation
31.7.2008 First official SST Reportsdelivered by insurers and groups
Start of Solvency II development in 2001/02
Directive Adoption by Council & Parliament
Implementing measures and Implementation in member states
QIS 4
200520042003
Fieldtest ‘04
Fieldtest ‘05
Fieldtest ‘06
Fieldtest ‘07
SST target capitalrequirements in force
Start of SSTdevelopment
QIS 3QIS 2Prestudy and QIS 1
QIS 5 Solvency II implementedQIS 4bis

Slide 6
Regulators allow two options to implement pillar one requirements
14
SST Standard Model
Scenarios
Standard Models or Internal Models
Mix of predefined and company specific scenarios
Target Capital SST Report
Market Consistent Data
Market Risk
Credit Risk
Life
P&C
Market Value Assets
Risk Models Valuation Models
Best Estimate Liabilities
MVM
Output of analytical models (Distribution)
Health
Aggregation Method
1. Application of a standard model defined by the regulator
2. Application of an internal model accepted by the regulator
All models have to follow important design principles:
Economic/market consistent valuation standards
Appropriate risk factor and exposure models
Aggregation has to consider dependencies between risks
Factors influencing the choices of companies:
Cost and effort of application and development
Individual company risk profile
Options for pillar one:Example: Design of the SST standard model
For the SST, reinsurance companies, groups and conglomerates must develop internal models since their risk profiles are considered too complex for the standard model
* MVM = Market Value Margin
*

Slide 7
The example of the Swiss Solvency Test provided useful lessons for the implementation of Solvency II
Effort for small and medium enterprises (SMEs) is not prohibitive
After initial pushback, SMEs feedback was very positive
Lack of recognition under Solvency I of certain large risks
Move to a risk-based system will lead to better risk management
No standard formula can capture all the risks of a company
A principles-based approach is needed
SST only partially captures concentration risk and liquidity risk, and operational risk is outside its scope
Companies need strong risk management and corporate governance in addition to SST
ASSAL-OECD-IAISERM @ Swiss Re29 April 2009

Slide 8
Solvency II: Quantitative Impact Studies
Geographical diversification in P&C Calibration of SCR and MCR Comparison of Internal Model with Standard Formula Capital adequacy at Solo and Group level
Practicability of Framework and impact on balance sheet
Calibration SCR & MCR Standard formulae for groups
Technical provision (extended analysis) Calculation of SCR and MCR (proposed methodology for
the standard formula)
Testing the level of prudence in technical provisions under several hypotheses
Testing the practicability of the calculation
Life insurance companies are asked to deliver data on best estimate calculation for assets and liabilities as well as available stress test on balance sheets
Countries: 20
Companies: 84
2. Quarter 2005Pre-Study
Countries: 30
Companies: 1412 (incl. SR)
2. Quarter 2008QIS 4
Countries: 28
Companies: 1027 (incl SR)
2. Quarter 2007QIS 3
Countries: 23
Companies: 514 (incl SR)
2. Quarter 2006QIS 2
Countries: 19
Companies: 312 (incl SR)
4. Quarter 2005QIS 1
Timeline Assessed topics Participation

Slide 9
Agenda
Motivation and elements of European Solvency regimes
ERM framework of Swiss Re
Summary
ASSAL-OECD-IAISERM @ Swiss Re29 April 2009

Slide 10
Three pillars of risk management at Swiss Re mirror the three pillars of Solvency II
Quantitative risk management
Risk transparency
Clearly defined responsibilities for risk taking and risk management
Sound and well documented:
− risk management policies and guide-lines
− operating, reporting, limit monitoring, and control procedures
Regulatory compliance
Internal and external audits of processes and figures
Sound valuation and risk measurement
Quantitative risk limit monitoring system
Reliable capital adequacy framework
Risk governance
Internal Risk reporting Peer reviews Independent
internal validation
External Financial and risk
disclosure External
validation
ASSAL-OECD-IAISERM @ Swiss Re29 April 2009

Slide 11
Economic Value Management (EVM) framework and internal models have a long history at Swiss Re
EVM
1999-2001: Development of EVM framework
2001: outstanding review of EVM framework by the Wharton School and approval by Executive Committee
2002: implementation of EVM framework
2004: first full EVM report 2008: public disclosure of
EVM figures
Internal model
1994: first internal model 1996: first risk report for
Swiss Re Zurich 1998: first model review by
Swiss Federal Institute of Technology
1999: first full Group Risk Report
2002: second model review by Swiss Federal Institute of Technology
2004: first public disclosure of risk figures
2008: inclusion of group effects
ASSAL-OECD-IAISERM @ Swiss Re29 April 2009

Slide 12
Economic income measures change in economic net worth over a 1-year period
Market-consistent
value
of
assets
Market-consistent
value
of in-force
liabilities
Economic net worth
Assets Liabilities
Start of year
Market consistent
value
of
assets
Market consistent
value
of in-force
liabilities
Economic net worth
Assets Liabilities
Economic income
End of year
+ premiums+ investment income+ value of assets value of liabilities- claims- expenses______________EVM income
P&L
During the year
ASSAL-OECD-IAISERM @ Swiss Re29 April 2009

Slide 13
Economic income forms the basis for risk measurement
Economic profit and loss distribution for Swiss Re (one-year horizon)
Market consistent value ofin-force liabilities
Available capital
Market value of assets
−
+
Available capital is the total capital exposed to risk and is broadly equal to the difference between the market value of assets and the market-consistent value of in-force liabilities
Risk is quantified by modelling the change in available capital for Swiss Re over a one-year horizon
Assets
Liabilities
ASSAL-OECD-IAISERM @ Swiss Re29 April 2009
Slide 14
Economic profit or loss for each set of risk factor simulations collected as a distribution
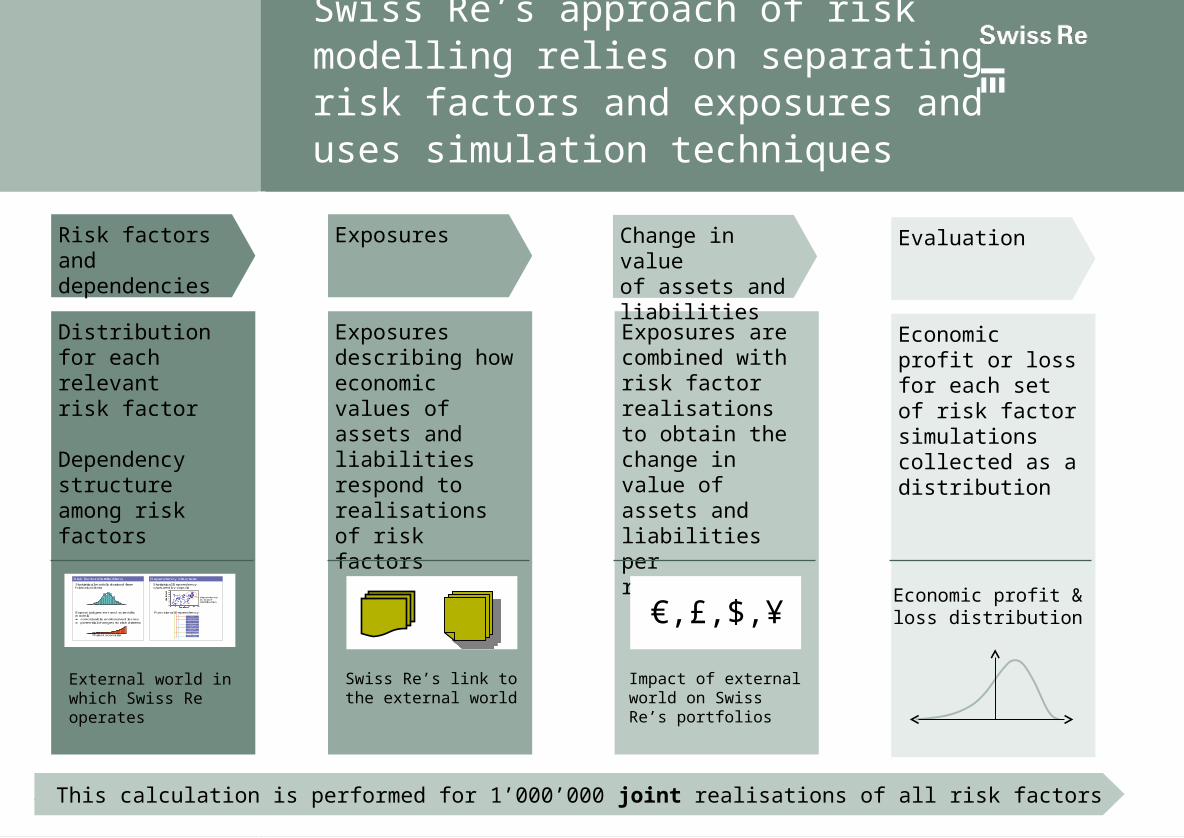
Swiss Re’s approach of risk modelling relies on separating risk factors and exposures and uses simulation techniques
Exposures are combined with risk factor realisations to obtain the change in value of assets and liabilities per realisation
Change in value of assets and liabilities
Exposures describing how economic values of assets and liabilities respond to realisations of risk factors
Exposures
Swiss Re’s link to the external world
Impact of external world on Swiss Re’s portfolios
Distribution for each relevantrisk factor
Dependency structure among risk factors
Risk factors and dependencies
This calculation is performed for 1’000’000 joint realisations of all risk factors
€,£,$,¥Statistical models derived from historical data
Threat scenario
Expert judgement and scientificmodels conceivable unobserved losses potential changes to risk drivers
Risk factor distributions Dependency structure
Statistical Dependency captured by copula
dependency in tail of distribution
0
2
4
6
8
10
12
14
0 2 4 6 8 10 12risk factor 1
risk facto
r 2
0
2
4
6
8
10
12
14
0 2 4 6 8 10 12risk factor 1
risk facto
r 2
0
2
4
6
8
10
12
14
0 2 4 6 8 10 12risk factor 1
risk facto
r 2
Functional DependencyDAX
10 Y € Swap Rate
CHF / USD
WindstormLothar
Ford MotorCompany
TerrorismMarket Loss
Lethal Pandemicexcess mortality
Risk FactorNo 348534
…
Evaluation
Economic profit & loss distribution
External world in which Swiss Re operates

Slide 15
Various risk measures can be used to articulate internal capital adequacy measures
Tail VaR (expected shortfall)99% shortfall represents the difference between the expected result and the average adverse result with a frequency of less than once in one hundred years
Value at Risk (VaR)99% VaR represents the difference between the expected result and an adverse result with a frequency of once in one hundred years
Economic profit and loss distribution(one year horizon)
Expected result
− +1 in 100 year loss
99% Tail VaR
99% VaR
Likelihood
−
+
ASSAL-OECD-IAISERM @ Swiss Re29 April 2009

Slide 16
Three pillars of risk management at Swiss Re mirror the three pillars of Solvency II
Quantitative risk management
Risk transparency
Clearly defined responsibilities for risk taking and risk management
Sound and well documented:
− risk management policies and guide-lines
− operating, reporting, limit monitoring, and control procedures
Regulatory compliance
Internal and external audits of processes and figures
Sound valuation and risk measurement
Quantitative risk limit monitoring system
Reliable capital adequacy framework
Risk governance
Internal Risk reporting Peer reviews Independent
internal validation
External Financial and risk
disclosure External
validation
ASSAL-OECD-IAISERM @ Swiss Re29 April 2009

Slide 17
Swiss Re’s risk governance is articulated in a series of documents
Risk governance documentation pyramid
Grouprisk policy
Group riskmanagement
guidelines
Group risk category guidelines
Business and corporate function guidelines
Risk attitudeSwiss Re actively takes risk in both insurance and financial markets, provided that these risks can be adequately controlled. Non-core, including operational, risks are limited based on cost-benefit considerations
Risk toleranceOverall risk is limited mainly to ensure that Swiss Re is able to continue to operate following an extreme loss event
Risk appetiteThe central goal in risk taking is to maximise shareholder value added, measured according to Economic Value Management
Risk strategy

Slide 18
Swiss Re’s risk tolerance defines two distinct requirementsCapital adequacy versus liquidity risk
Risk tolerance definition of the Board:
“To be able to continue to operate following an extreme loss event.”
Do we hold enough capital
(survival)?
Can we meet all our obligations as
they fall due (operation)?
Regulatorycapital
Ratingcapital
Internalcapital
Liquidity stress test
“Extreme loss event”:100 year annual aggregate Group loss
Capital adequacy requirements
Related liquidity
risk
ASSAL-OECD-IAISERM @ Swiss Re29 April 2009

Slide 19
Funding liquidity stress testsScenarios driven by stress events
Assumption Insurance loss Financial market crisis Extreme loss
Event descriptionAtlantic hurricane and
operational failuremarket crash and banking crisis
combined insurance and financial market loss
Time horizon 90 days 90 days 90 days and 1 year
Loss amount 200-year periodplus operational loss
credit and financial market aggregate stress loss
99%, 1 year aggregate shortfall
Ratings downgrade none downgrade significant downgrade
Asset sales not considered not considered allowed for over 1 yearsubject to haircuts
External funding only on secured basis subject to haircuts
Intragroup funding only if contractually provided for or with unregulated entities
Funding from new reinsurance business
no impact decrease significant decrease
Commitments normal conditions stressed conditions stressed conditions
Discretionary funding pipeline
continued continued discontinued
Liquidity is integrated into relevant management processes at Swiss Re
Swiss Re considers a number of different scenarios and key assumptions

Slide 20
Measuring funding liquidity risk
Liquidity risk measured comparing stressed requirements and sourcesMeasured under normal and stressed conditions
Net funding liquidityDefined as the difference between sources of cash and collateral and requirements of cash and collateral
Funding liquidity ratioDefined as the ratio of sources to requirements of cash and collateral
These measures are determined– both in normal and stressed
operating conditions, and– over predetermined future time
intervals (90 days, one year)– for key legal entity groupings within
which funds are freely transferable
Measures used
sources of cash and collateral
requirements of cash and collateral
Illustrative
Surplus liquidity
Slide 21
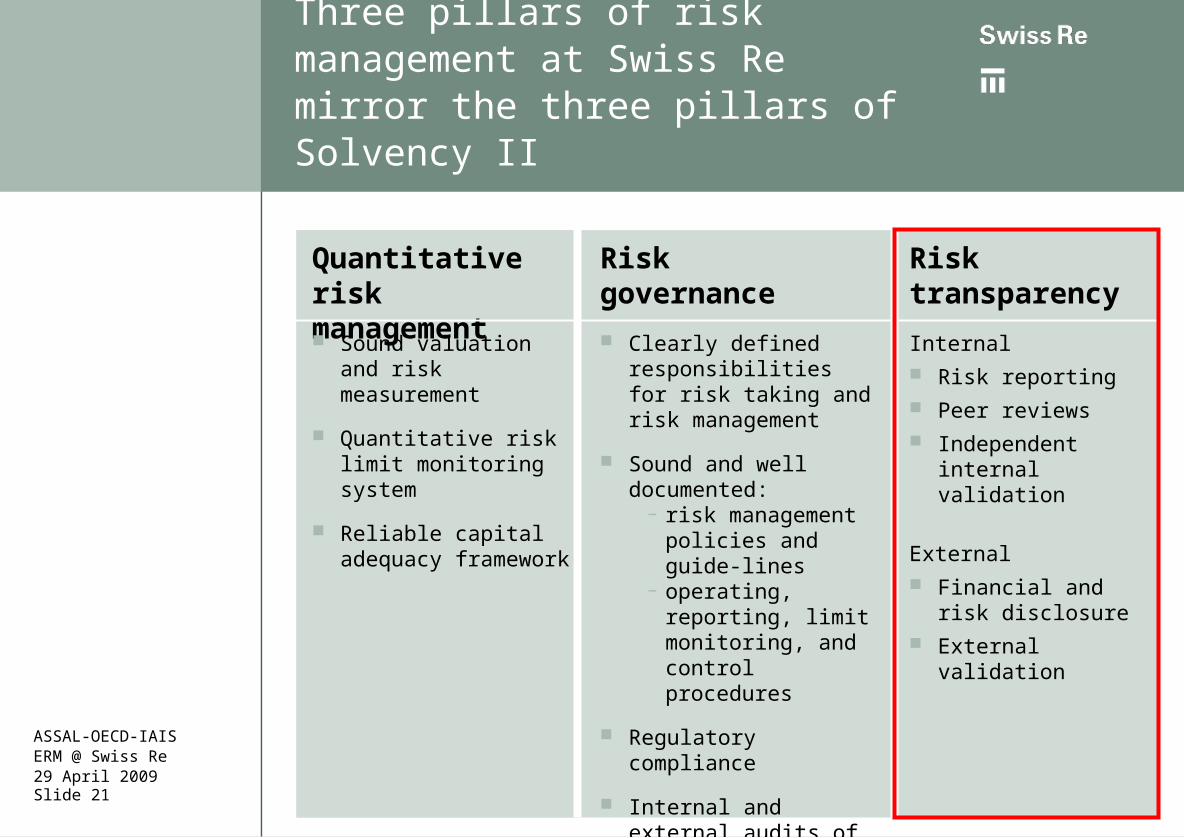
Three pillars of risk management at Swiss Re mirror the three pillars of Solvency II
Quantitative risk management
Risk transparency
Clearly defined responsibilities for risk taking and risk management
Sound and well documented:
− risk management policies and guide-lines
− operating, reporting, limit monitoring, and control procedures
Regulatory compliance
Internal and external audits of processes and figures
Sound valuation and risk measurement
Quantitative risk limit monitoring system
Reliable capital adequacy framework
Risk governance
Internal Risk reporting Peer reviews Independent
internal validation
External Financial and risk
disclosure External
validation
ASSAL-OECD-IAISERM @ Swiss Re29 April 2009

Slide 22
Internal management information needs to be tailored to the recipient
Integrated reporting Integrated risk reports Credit and financial
market risk report incl. ALM
Lower level risk reporting
Property and casualty Life and health Financial market Credit Operational risk
Management units Lines of business Products
Business unit andfunctional reporting
Group (integrated)
Riskcategories
Business units
Board of Directors Executive Board Senior leadership
team of the Group
Senior leadership team of the Group
Risk management community of the Group
Senior leadership teams of management units and business functions
Risk information Audience

Slide 23
Swiss Re’s external risk dialogue started in 2004 and is now integral part of our regular disclosure
2004 2005 2006 2007
Investor Days
Annual Reports
2008
Institute of ActuariesERM @ Swiss ReTokio, 26 September 2008
2009

Slide 24
Agenda
Motivation and elements of European Solvency regimes
ERM framework of Swiss Re
Summary
ASSAL-OECD-IAISERM @ Swiss Re29 April 2009

Slide 25
Summary
Enterprise Risk Management is about much more than just quantification and also includes
– risk governance
– transparency and communication
To consider its different nature, the assessment of funding liquidity risk is consistent but separate from the capital adequacy model
Swiss Re has been using an integrated approach to Risk Management for more than a decade which is deeply embedded in its steering processes
Swiss Re welcomes and supports regulatory frameworks that are better aligned with the actual risks of the insurance business and their management
ASSAL-OECD-IAISERM @ Swiss Re29 April 2009

Slide 26
Contact Information
ASSAL-OECD-IAISERM @ Swiss Re29 April 2009
Robert M. Peduto Managing DirectorRisk Management
Swiss Re America Holding Corporation5200 Metcalf AveOverland Park, KS 66202-1265Direct: +1 913-676-3246 Fax: +1 [email protected]

Slide 27
Appendix
ASSAL-OECD-IAISERM @ Swiss Re29 April 2009
Slide 28
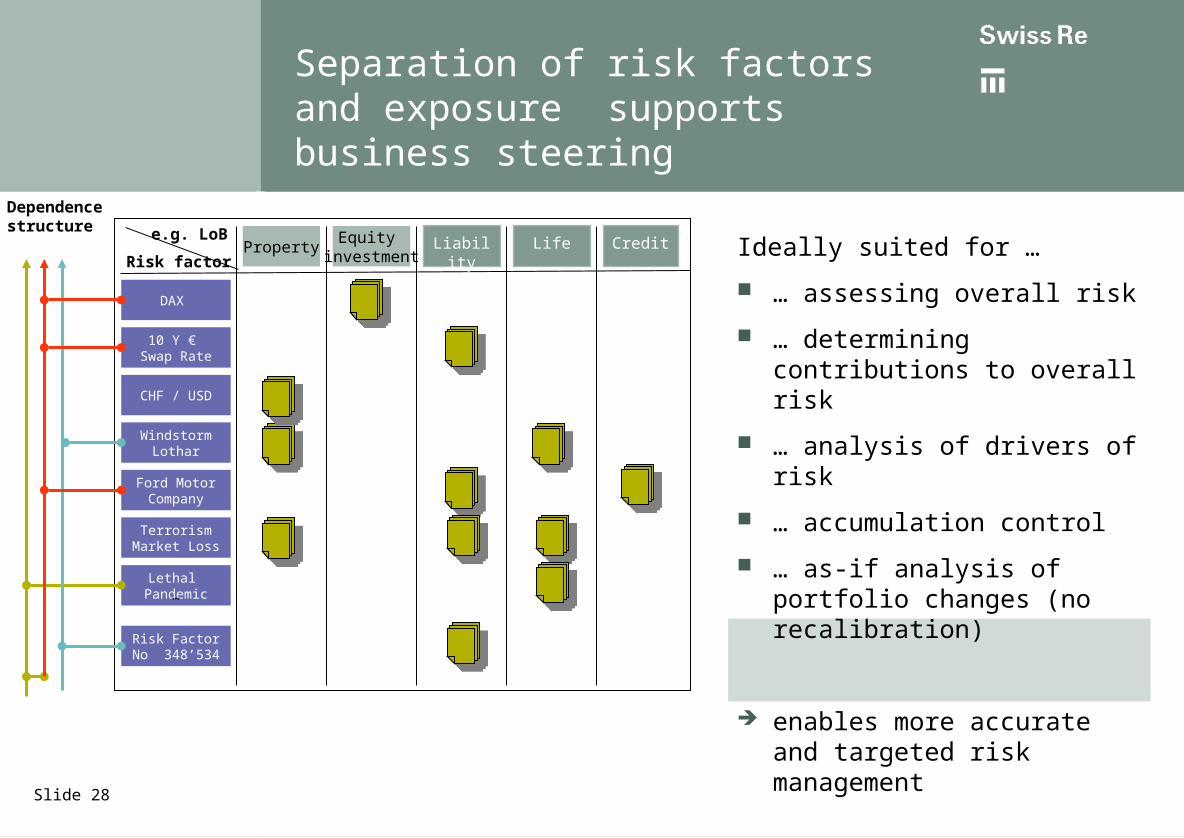
Separation of risk factors and exposure supports business steering
Ideally suited for …
… assessing overall risk
… determining contributions to overall risk
… analysis of drivers of risk
… accumulation control
… as-if analysis of portfolio changes (no recalibration)
enables more accurate and targeted risk management
DAX
10 Y € Swap Rate
CHF / USD
WindstormLothar
Ford MotorCompany
TerrorismMarket Loss
PropertyEquity
investmentLiability Life Credite.g. LoB
Risk factor
Dependencestructure
Lethal Pandemic
Risk FactorNo 348’534
…

Slide 29
Modelling risk factors requires statistical analysis and expert judgement
Statistical models derived from historical data
Threat scenario
Expert judgement and scientific
models conceivable losses potential changes to risk
drivers
Risk factor distributions Dependency structure
Statistical dependencies captured by copulas
dependency in tail of distribution
0
2
4
6
8
10
12
14
0 2 4 6 8 10 12
risk factor 1
risk
fact
or
2
Functional dependencyDAX
10 Y € Swap Rate
CHF / USD
WindstormLothar
Ford MotorCompany
TerrorismMarket Loss
Lethal Pandemicexcess mortality
Risk FactorNo 348534
…ASSAL-OECD-IAISERM @ Swiss Re29 April 2009

Slide 30
Looking at the consolidated view only ignores important group effects
Modelling of intragroup risk and capital transfer instruments
Assessment of intragroup credit risk
Consideration of limited liability towards subsidiaries
Consideration of knock-on effects resulting from economic insolvencies
++
+
Swiss Re Group consolidated
Risk-bearing Capital Required Capital
Internal Capital Adequacyconsolidated
Risk-bearing CapitalRequired Capital
Internal Capital Adequacy per financial reporting entity (SRZ,
ERZ, etc.)
…
Swiss Re Groupas a network of legal entities
+ Historically, most groups took a
consolidated view to determine their capital adequacy
This view is appropriate under the assumption that capital can be transferred freely
In reality there is however the threat that local regulators will restrict capital flows between subsidiaries in times of distress to best protect the interests of their local policy holders

Slide 31
Exposures are combined with risk factor realisations to obtain the change in value of assets and liabilities per realisation
Group effects require extending the evaluation part of the simulation model
Gross change in value of assets and liabilities
Intragroup transactions
All losses are ceded according to network of intragroup transactions and booked on the relevant balance sheets as profits or losses
Closing balance sheets
Economic net worth of all financial reporting entities is calculated including participation values
Exposures describing how economic values of assets and liabilities respond to realisations of risk factors
Gross exposures
Swiss Re’s link to the external world
Impact of external world on Swiss Re’s portfolios
Network of intragroup transactions
Network of legal entities belonging to the Group
Distribution for each relevantrisk factor
Dependency structure among risk factors
Risk factors and dependencies
This calculation is performed for 1’000’000 joint realisations of all risk factors
€,£,$,¥Statistical models derived from historical data
Threat scenario
Expert judgement and scientificmodels conceivable unobserved losses potential changes to risk drivers
Risk factor distributions Dependency structure
Statistical Dependency captured by copula
dependency in tail of distribution
0
2
4
6
8
10
12
14
0 2 4 6 8 10 12risk factor 1
risk facto
r 2
0
2
4
6
8
10
12
14
0 2 4 6 8 10 12risk factor 1
risk facto
r 2
0
2
4
6
8
10
12
14
0 2 4 6 8 10 12risk factor 1
risk facto
r 2
Functional DependencyDAX
10 Y € Swap Rate
CHF / USD
WindstormLothar
Ford MotorCompany
TerrorismMarket Loss
Lethal Pandemicexcess mortality
Risk FactorNo 348534
…
External world in which Swiss Re operates

Slide 32
Thus an internal model needs to reflect the impact of ownership and transaction relations
100
40
40
90
90
50
40
Parent
Subsidiary
80
70
20
Subsidiary
10
10
Ownership relation Economic net worth of subsidiary appears as participation value in parents balance sheet
Transaction relation Ceding risk to the parent is an asset to the subsidiary and a liability to the parent
100%
ASSAL-OECD-IAISERM @ Swiss Re29 April 2009

Slide 33
Consistent limit frameworkLimits fully aligned with the Group’s overall risk tolerance
Group risk tolerance
Available capital
Annual Group Plan
Group shortfall of Plan
P&C L&H FM
Nat Cat
TC NA
WS EU
EQ California
EQ Japan
EQ New Madrid
Mortality
Critical Illness
Longevity
Equity
Hedge Funds
Interest Rate
Real Estate
Foreign exchange
Credit (spread &default) C
ap
aci
ty m
easu
re, eg
str
ess
te
st
Cap
aci
ty m
easu
re, eg
SA
R
Cap
aci
ty m
easu
re, eg
sh
ort
fall
Risk appetite derived by optimisation procedures
Risk tolerance criteria of the Board
Actual situation from all capital perspectives
Group Risk Model as basis for limit setting
ASSAL-OECD-IAISERM @ Swiss Re29 April 2009