Embed Size (px)
Citation preview

NYSE: PSX
www.phillips66.com
Bayway Refinery, Linden, NJ
Investor UpdateAugust 2018

Cautionary Statement
1
This presentation contains certain forward-looking statements. Words and phrases such as “is anticipated,” “is estimated,” “is expected,” “is
planned,” “is scheduled,” “is targeted,” “believes,” “intends,” “objectives,” “projects,” “strategies” and similar expressions are used to identify such
forward-looking statements. However, the absence of these words does not mean that a statement is not forward-looking. Forward-looking
statements relating to the operations of Phillips 66 and Phillips 66 Partners LP (including their respective joint venture operations) are based on
management’s expectations, estimates and projections about these entities, their interests and the energy industry in general on the date this
presentation was prepared. These statements are not guarantees of future performance and involve certain risks, uncertainties and assumptions
that are difficult to predict. Therefore, actual outcomes and results may differ materially from what is expressed or forecast in such forward-looking
statements. Factors that could cause actual results or events to differ materially from those described in the forward-looking statements can be
found in filings that Phillips 66 and Phillips 66 Partners LP make with the Securities and Exchange Commission. Phillips 66 and Phillips 66
Partners LP are under no obligation (and expressly disclaim any such obligation) to update or alter these forward-looking statements, whether as
a result of new information, future events or otherwise.
This presentation includes non-GAAP financial measures. You can find the reconciliations to comparable GAAP financial measures at the end of
the presentation materials or in the “Investors” section of the websites of Phillips 66 and Phillips 66 Partners LP.

Diversified Downstream Company
2
RefiningMidstream ChemicalsMarketing &
Specialties
Integrated Midstream
Network
Pursue Organic and M&A
Opportunities
PSXP as a Growth Vehicle
50% Interest in CPChem
Location Advantaged
Chemicals Portfolio
USGC Petchem Project
Complete
Diversified Refining Portfolio
Investing in Quick Payout
Projects
Footprint Offers Opportunities
for Midstream Growth
Stable, High-return
Businesses
Enhancing U.S. Fuels
Brands

3
Leading Operating Excellence
Growth
CPChem USGC petrochemicals assets
Gray Oak Pipeline
Sweeny Hub
Beaumont Terminal
Returns
Refinery yield and feedstock flexibility projects
U.S. Marketing re-imaging
Distributions
27% dividend CAGR since 2012
$14.1 B in total share repurchases/exchanges
High-Performing Organization
Executing Strategy
Vacuum Tower, Billings Refinery, Billings, MT
See appendix for footnotes.

Operating Excellence
4
93% 94% 91% 96% 95% 94%
3% 4% 5% 2% 5% 6%
2013 2014 2015 2016 2017 1H 2018
Planned Maintenance & Turnarounds
Industry Average
Total Recordable Rates(Incidents per 200,000 Hours Worked)
Refining Environmental Metrics(No. of events)
Refining Capacity Utilization(%)
Operating Costs and SG&A($B)
Phillips 66 CPChem DCP Midstream
5.4 5.8 5.5 5.5 5.82.9
2013 2014 2015 2016 2017 1H 2018
Adjusted Op. Costs and SG&A Turnaround Costs
317 302 279 264 242123
2013 2014 2015 2016 2017 1H 2018
’13 ’14 ’15 ’16 ’17 ’18
See appendix for footnotes.

Environmental, Social, Governance
5
Board engaged in setting company ESG
strategy
Extensive ESG engagement
Record low reportable environmental events
Investing in forward-looking research and
development technology
Promoting inclusive and diverse workforce
Committed to corporate and local
philanthropic programs
See appendix for footnotes.
Industry Safety Metrics(Incidents per 200,000 Hours Worked)
0
2
4
6
Agricul.,CropProd.
FoodManufact.
AllManufact.
Construction Prof.& Bus.
Services
PetroleumRefining
Petchem.Manufact.
Phillips 66
15
20
25
30
2012 2013 2014 2015 2016 2017
Phillips 66 SOx, NOx, PM Emissions(Thousand tonnes)

Source: BTU Analytics, July 2018 6
U.S. Crude Oil and Gas Plant NGL Production
0
2
4
6
8
2012 2014 2016 2018 2020 2022
Permian
0
2
4
6
8
2012 2014 2016 2018 2020 2022
Rockies
0
2
4
6
8
2012 2014 2016 2018 2020 2022
Bakken
0
2
4
6
8
2012 2014 2016 2018 2020 2022
Midcontinent
0
2
4
6
8
2012 2014 2016 2018 2020 2022
Eagle Ford
0.0
0.6
1.2
2012 2013 2014 2015 2016 2017 2018
Propane Butane
0.0
0.5
1.0
1.5
2.0
2.5
2012 2013 2014 2015 2016 2017 2018
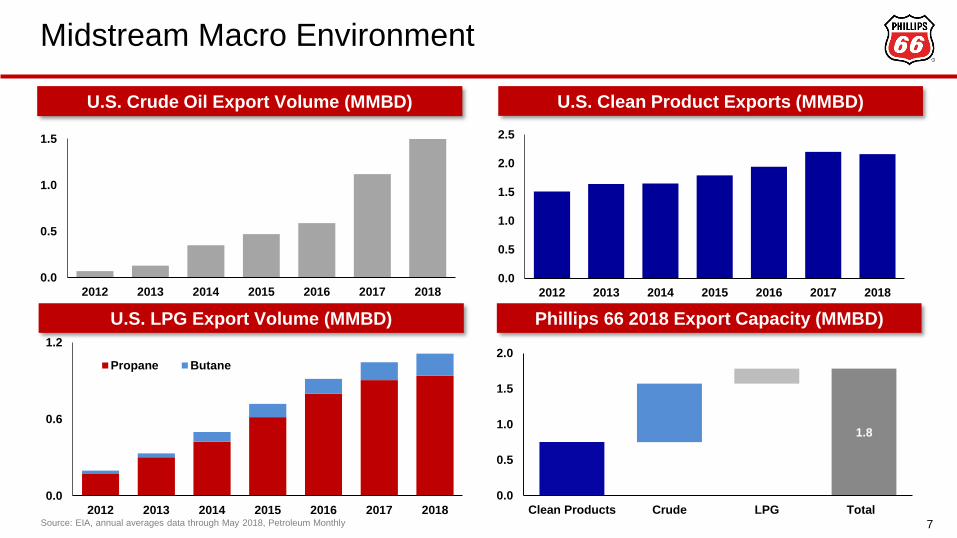
Midstream Macro Environment
U.S. LPG Export Volume (MMBD)
U.S. Crude Oil Export Volume (MMBD) U.S. Clean Product Exports (MMBD)
Source: EIA, annual averages data through May 2018, Petroleum Monthly 7
Phillips 66 2018 Export Capacity (MMBD)
1.8
0.0
0.5
1.0
1.5
2.0
Clean Products Crude LPG Total
Th
ou
sa
nds
0.0
0.5
1.0
1.5
2012 2013 2014 2015 2016 2017 2018

0
50
100
150
2012 2013 2014 2015 2016 2017 2018 2019 2020 2021 2022
Capacity
Demand
Chemicals Macro Environment
Global PE Capacity and Demand(MMTA)
Source: I.H.S., Ethane Demand as of May 2018.
U.S. Ethane Demand(MMBD)
8
0.0
0.5
1.0
1.5
2.0
2.5
2012 2013 2014 2015 2016 2017 2018 2019 2020 2021 2022
Exports
Base Ethane Petchem & Price-sensitiveFlexible Feedstock
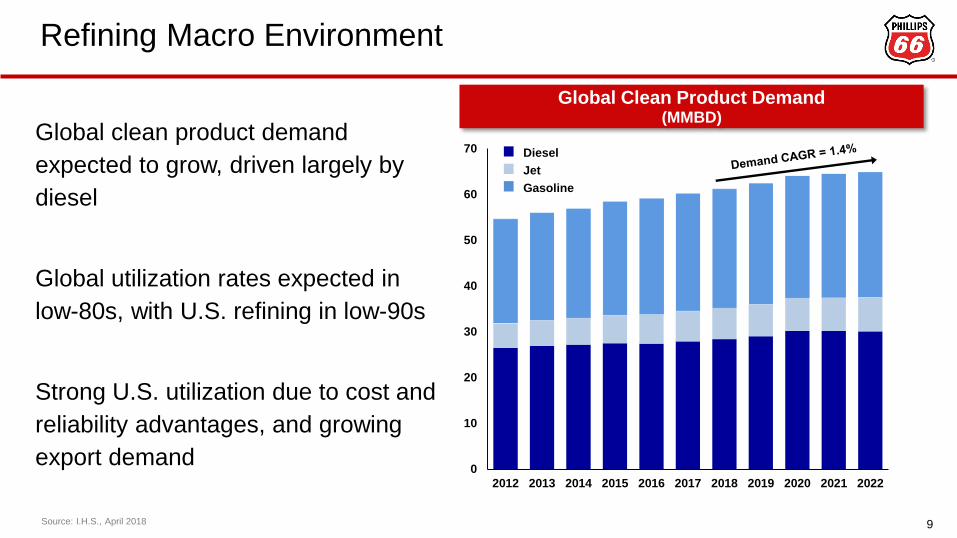
Refining Macro Environment
Global clean product demand
expected to grow, driven largely by
diesel
Global utilization rates expected in
low-80s, with U.S. refining in low-90s
Strong U.S. utilization due to cost and
reliability advantages, and growing
export demand
Global Clean Product Demand (MMBD)
9Source: I.H.S., April 2018
0
10
20
30
40
50
60
70
2012 2013 2014 2015 2016 2017 2018 2019 2020 2021 2022
Diesel
Jet
Gasoline

Integrated Midstream Network
10

Midstream
11
Transportation
21,000 miles of US pipeline systems
40 finished product terminals
38 storage locations
19 crude oil terminals
5 LPG terminals and 1 petroleum coke exporting facility
NGL and Other
200,000+ BPD fractionation capacity
200,000 BPD LPG export capacity
2,600+ miles of pipelines
125,000 BPD vacuum distillation capacity
DCP Midstream
61 natural gas processing facilities with 7.8 BCFD net capacity
63,000 miles of natural gas pipeline systems
Beaumont Terminal, Nederland, TX

Midstream Growth
12
Platform for growth
Sweeny Hub
Gray Oak Pipeline
South Texas Gateway Terminal
Beaumont Terminal
Sand Hills Pipeline expansion
Bayou Bridge Pipeline
Lake Charles Pipeline Project
Lake Charles Isomerization Unit
See appendix for map key.

Sweeny Hub Expansion
13
$1.5 B expansion of Sweeny Hub
2 x 150 MBD NGL fractionators
6 MM bbls expansion of PSXP’s NGL
storage capacity
Y-grade NGL feedstock supply
agreements with firm volume
commitments secured
Purified products will be marketed via
Freeport LPG Terminal
New assets leverage and enhance
existing infrastructure
Freeport LPG Terminal, Sweeny, TX

Phillips 66 Partners
14
Achieved 2018E annualized run-rate
$1.1 B adjusted EBITDA in 2Q18
Organic growth opportunities
30% distribution CAGR 2013-2018
Top quartile growth post-2018
Distribution Growth(cents/common unit)
21.3 22.527.4
30.2 31.7 34.037.0
40.042.8
45.8 48.1 50.553.1
55.858.6
61.564.6
67.871.4
75.2
See appendix for footnotes.

DCP Midstream
15
Well positioned in low-cost supply basins
Strong growth projects around existing footprint
Sand Hills NGL Pipeline expansions to 425 MBD in 2Q
2018, 485 MBD by the end of 2018
DJ Basin gathering and processing infrastructure
expansions of 200 MMCFD in Aug. 2018 with another
200 MMCFD in service 2Q 2019
Gulf Coast Express Permian ~2 BCFD natural gas JV
pipeline expected in service 4Q 2019
Stable distributions to LP unit holders and
resumed distributions to owners
DJ Basin
0.8 Bcf/d
processing
capacity
Mid-continent
1.8 Bcf/d
processing
capacity
Permian
1.3 Bcf/d
processing
capacity
South
2.3 Bcf/d
processing
capacity
See appendix for footnotes.
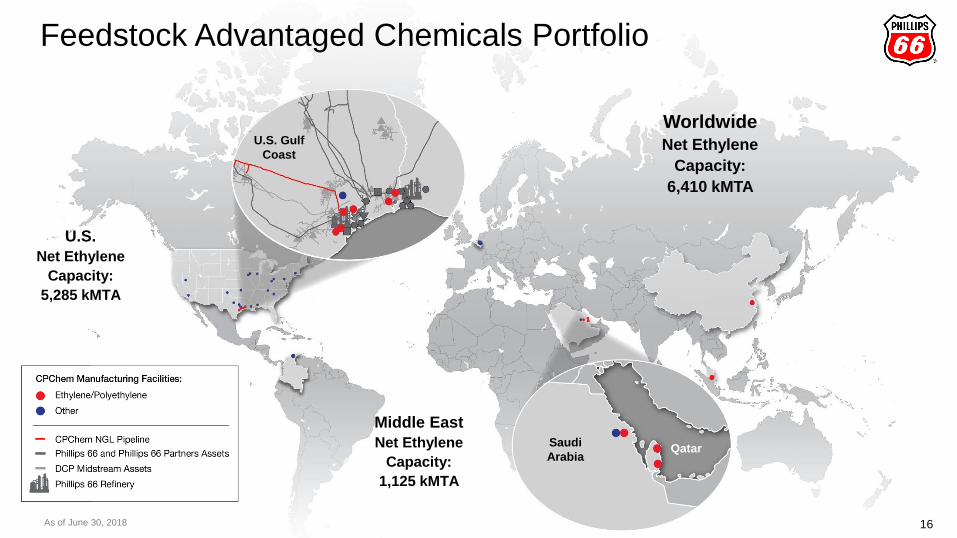
Feedstock Advantaged Chemicals Portfolio
16
Worldwide Net Ethylene
Capacity:
6,410 kMTA
U.S.
Net Ethylene
Capacity:
5,285 kMTA
U.S. Gulf
Coast
Saudi
ArabiaQatar
Middle East
Net Ethylene
Capacity:
1,125 kMTA
As of June 30, 2018

CPChem
17
Olefins and Polyolefins
11,245 kMTA/year North America capacity
2,510 kMTA/year Middle East capacity
USGC Petrochemicals assets started up
Specialties, Aromatics and Styrenics
2,710 kMTA/year North America capacity
1,050 kMTA/year Middle East capacity
15 North American facilities
5 Middle East facilities
As of June 30, 2018
CPChem USGC Ethane Cracker, Cedar Bayou, TX

Chemicals Outlook
Source: I.H.S., July 2018.
Middle East ethane and North
America NGLs remain positioned at
the low end of the cost curve
Ethylene demand growth outpacing
global GDP
Expect demand growth to rapidly
balance new capacity additions
2018E Average Ethylene Production Cost Curve($/Tonnes)
M.E. Ethane
N.A. Ethane
W. Europe LPG
N.A. LPG
M.E. LPG
Asia LPG
Asia Naphtha W. Europe
Naphtha
N.A. Naphtha
Asia Coal
M.E. Naphtha
0
500
1,000
0 50 100 150 200
Cumulative Production - Million Metric Tons
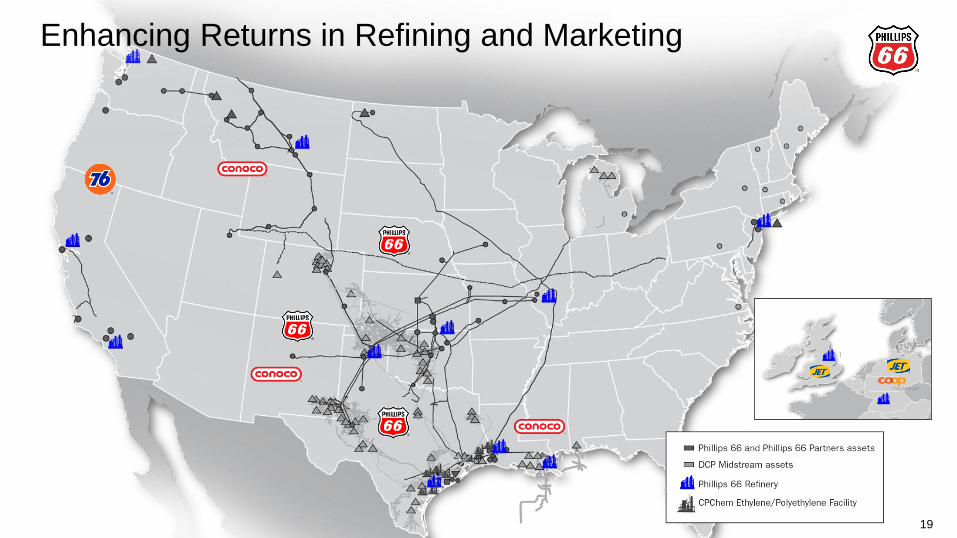
Enhancing Returns in Refining and Marketing
19

Refining and Marketing
20
Refining
13 refineries in U.S. and Europe
In 5 U.S. PADDs
2,146 MBD crude capacity
35% heavy, 30% light, 35% medium crude mix
Marketing
9,000+ global sites, including 5,700 wholesale
outlets
1,700+ re-imaged sites since 2015
Sweeny Refinery, Sweeny, TX

Enhancing Refining Returns
21
Improving returns projects
Wood River FCC modernization (complete)
Bayway FCC modernization (complete)
Lake Charles crude flexibility (4Q 2018)
Lake Charles isomerization unit (3Q 2019)*
Sweeny FCC optimization (2Q 2020)
~ 25 other low-cost, high-return projects
Increasing clean product yield
Top tier refinery utilization rates
*PSXP asset
See appendix for footnotes.
88% 90% 91% 90% 91% 91%93% 94% 91% 96% 95% 94%
U.S. Industry Average Phillips 66
U.S. Refining Capacity Utilization
84.6% 84.1% 84.4% 84.6%85.5%
83.6%
2013 2014 2015 2016 2017 1H 2018
PSX Global Clean Product Yield
2014 2015 20172013 2016 1H 2018

Source: 2018 Oil and Gas Journal. Phillips 66 includes Humber, 18.75% MiRO, and 50% WRB.
IMO 2020 Preparedness
22
Global Coking Capacity (MBD) and Coking as % CDU
Existing PSX portfolio well
positioned for IMO 2020
High distillate production
Industry leading coking capacity
Industry leading coking capacity
as a percent of crude unit capacity
2017 Distillate Production as % Total Throughput
38.3% 37.8% 37.1% 36.4%
33.0%
VLO PSX ANDV HFC MPC
423
281
182146 39
20%
10% 10%
13%
8%
PSX VLO MPC ANDV HFC

Canadian Imports
23
PSX is the largest U.S.
importer of Canadian crude
Averaged 508 MBD of
imports in 2017
Processed Canadian crude
in 9 U.S. refineries
2017 Average Canadian Imports (MBD)
508
343
100
21 16
PSX MPC HFC ANDV VLO
Source: E.I.A, May 2018.

Stable, High Return Marketing and Specialties Network
24
Marketing
Enhancing U.S. fuels brands
Adding 25-30 European sites per year
Expanding brand licensing
Providing ratable refinery off-take
Specialties
Increasing value through integration,
optimization, and product innovation
Adjusted EBITDA ($B)
1.4 1.4 1.5 1.41.2
2013 2014 2015 2016 2017
$1.4 B Average

22.4 22.0
23.9 23.7
27.4
25.0
6.1
8.6 8.910.1 10.1
11.421%
28%
27%
30%
27%
31%
22%25%
26%
22%
27%
Capital Structure
Investment-grade credit ratings
PSX – BBB+ / A3
PSXP – BBB / Baa3
Total liquidity, as of June 30, 2018
PSX – $6.7 B
PSXP – $0.9 B
~3.5x Debt/EBITDA target at PSXP
25
Equity and Debt
PSX Equity $B PSX Debt $B
PSX Noncontrolling Interest
Attributable to PSXP $BPSXP Third-party Debt $B
Consolidated Debt-to-Capital
PSX Debt-to-Capital, excluding PSXP
2013 2014 2015 2016 2017 2Q 2018

Financial Flexibility
26
Maintain financial strength, strong
investment-grade credit rating
Fund sustaining capital expenditures
Pay a secure, competitive, and growing
dividend
60% reinvestment and 40% shareholder
distributions
Distributions
Reinvestment
2015 – 2017
See appendix for footnotes.

2015 consolidated capital expenditures of $5.8 billion include $1.5 billion investment in DCP Midstream.
Capital Expenditures
2018E Consolidated – $2.30 B
Phillips 66 2018E – $1.55 B
$0.70 B Growth
$0.85 B Sustaining
Phillips 66 Partners 2018E – $0.75 B
27
Consolidated Capital Expenditures($B)
1.8
3.8
5.8
2.8
1.8
2.3
2013 2014 2015 2016 2017 2018E
PSX PSXP

Distributions
Important source of shareholder value
Secure, competitive, and growing
dividend
14% increase to $0.80 per quarter
27% CAGR with eight increases since
May 2012
Committed to share repurchases
Repurchased/exchanged 181 MM shares,
29% of shares initially outstanding
28See appendix for footnotes.
1.331.89 2.18 2.45 2.73
3.10
2013 2014 2015 2016 2017 2018E
Annual Dividend ($/share)
Cumulative Distributions ($B)
3.7
8.411.1
13.416.4
20.8
2013 2014 2015 2016 2017 1H 2018
Share Repurchases and Exchanges Dividends

Creating Value
~ $1.5 B long-term expected
adjusted EBITDA growth from
projects coming online 2017-2018
Shifted from heavy-investment
period to increasing net cash
generation
Continued investment in higher-
valued businesses generating
strong returns
29See appendix for footnotes.
Midstream Chemicals Refining M&S Total
Mid-Cycle Incremental Run-Rate Adjusted EBITDA($B)
~ $1.5

Delivering Shareholder Returns
Integrated portfolio
Disciplined capital allocation
Returns focused
Value-added growth
Strong balance sheet
Compelling investment
30See appendix for footnotes.
Total Shareholder Return
-20%
20%
60%
100%
140%
180%
220%
260%
300%
340%
380%
May-12 May-13 May-14 May-15 May-16 May-17 May-18
PSX +342%
S&P 100 +124%
Peers +243%
July-18

Investor UpdateAugust 2018
NYSE: PSXP
www.phillips66partners.com

Phillips 66 Partners Ownership Structure
Phillips 66 Partners GP LLC
(PSXP General Partner)
General Partner Units
IDRs
Operating Subsidiaries
PSXP Public
Common
Unitholders
(NYSE: PSX)
(NYSE: PSXP)
100% ownership
interest
43% limited partner
interest
Joint Ventures
2% general
partner interest
55% limited partner
interest
As of June 30, 2018.
Public also owns 13.8 million perpetual convertible preferred units.32

Phillips 66 Partners
Strong alignment with Phillips 66
Highly integrated assets
Stable and predictable cash flows
Strong growth potential
Financial flexibility
Pecan Grove Marine Dock
33
Sweeny Fractionator, Sweeny, TX

Phillips 66 Partners
Pecan Grove Marine Dock
34

Financial Growth
Adjusted EBITDA ($MM)
Percentages are 2014 – 2017 compounded annual growth rate; 2013 is partial year.
Adjusted EBITDA and Distributable Cash Flow shown are attributable to PSXP.35
33
141
285
471
754
2013 2014 2015 2016 2017
30128
228
380
572
2013 2014 2015 2016 2017
Distributable Cash Flow ($MM)
29116
194301
461
2013 2014 2015 2016 2017
Earnings ($MM)
Annual performance highlights since 2014
58% growth in Earnings
75% growth in Adjusted EBITDA
65% growth in Distributable Cash Flow

21.3 22.527.4 30.2 31.7 34.0 37.0 40.0 42.8 45.8 48.1 50.5 53.1 55.8 58.6 61.5 64.6 67.8 71.4 75.2
3Q13 4Q13 1Q14 2Q14 3Q14 4Q14 1Q15 2Q15 3Q15 4Q15 1Q16 2Q16 3Q16 4Q16 1Q17 2Q17 3Q17 4Q17 1Q18 2Q18
Distribution Growth
3Q 2013 distribution represents the minimum quarterly distribution, actual distribution of 15.48 cents equal to MQD prorated.
Distribution / Common LP Unit(cents)
36
Co
vera
ge
Rati
o
1.13x 1.10x 1.10x 1.44x 1.32x 1.28x 1.14x 1.17x 1.39x 1.45x 1.14x 1.20x 1.24x 1.48x 1.31x 1.35x 1.12x 1.33x 1.40x 1.38x

Phillips 66 Partners Capital Expenditures
2018E Capex of $750 MM
$665 MM Growth
Gray Oak Pipeline
South Texas Gateway Terminal
Bayou Bridge Pipeline
Sand Hills Pipeline
Lake Charles Isomerization Unit
Sacagewea Gas Pipeline
$85 MM Sustaining
PSXP Capital Expenditures($MM)
4 66
205
461
352
750
2013 2014 2015 2016 2017 2018E
37See appendix for footnotes.

Gray Oak Pipeline
38
Crude oil pipeline from West Texas to
Corpus Christi and Sweeny/Freeport
markets
800 MBD initial pipeline capacity
Expandable to 1,000 MBD
75% PSXP and 25% ANDV
ownership*
Operated by Phillips 66
Expected in service end of 2019
*If outstanding options are exercised, PSXP would own 42.25%

$750 MM 2018 Organic Growth Plan
Gray Oak Pipeline
Transports crude from West Texas to Corpus Christi and Sweeny Freeport, in service by end of 2019
800 MBD and may be expanded up to 1,000 MBD based on shipper interest
South Texas Gateway Terminal
3.4 MM barrel storage with two docks capable of berthing VLCC tankers connecting to Gray Oak Pipeline, in service by end of 2019
Sand Hills Pipeline
Adding lateral connections and increasing pumping capacity
Bayou Bridge Pipeline
Lake Charles, LA to St. James, LA pipeline extension, complete 4Q 2018
Lake Charles Pipeline Project
Developing a new pipeline into the Clifton Ridge Marine Terminal to expand export capacity for Lake Charles Refinery
Lake Charles Isomerization Unit
Developing new 25 MBD unit to increase premium gasoline production
Clemens Caverns
6 MM bbls expansion to 15 MM bbls upon completion of NGL storage capacity, in service by end of 2020
Sacagawea Gas Pipeline
Constructing 24-mile raw natural gas pipeline in Bakken in joint venture
39

40
0.3
0.5 0.5 0.5 0.5
0.60.8
2018 2020 2022 2024 2026 2028 2030 2032 2034 2036 2038 2040 2042 2044 2046
PSXP Revolving CreditFacility
$2.9 B Total Debt as of June 30, 2018
$2.9 B Senior Notes, weighted-average cost of 3.97%
$100 MM MSLP Tax-exempt Bonds
BBB / Baa3 Credit Rating
PSXP Debt Profile
Weighted average cost excludes revolving credit facility.
Total debt is net of $29 MM new issuance premiums and discounts.
Senior Notes Maturity Profile($B)
Year Due Principal ($MM) Coupon
PSXP 2020 $300 2.646%
PSXP 2025 $500 3.605%
PSXP 2026 $500 3.550%
PSXP 2028 $500 3.750%
PSXP 2045 $450 4.680%
PSXP 2046 $625 4.900%
Total $2,875 3.970%
Senior Notes ($MM)

Financial Flexibility
Investment-grade credit rating
Financial targets:
30% distribution CAGR 2013-2018
3.5x debt / EBITDA
1.1x annual coverage ratio
Support Phillips 66 Midstream growth
41

-50%
0%
50%
100%
150%
200%
250%
300%
Jul-13 Oct-13 Jan-14 Apr-14 Jul-14 Oct-14 Jan-15 Apr-15 Jul-15 Oct-15 Jan-16 Apr-16 Jul-16 Oct-16 Jan-17 Apr-17 Jul-17 Oct-17 Jan-18 Apr-18 Jul-18
Closed $340
MM acquisition
Total Return Since IPO
Closed $700 MM
acquisition
PSXP +177%
Alerian MLP Index -15%
IPO
Closed $1.0 B
acquisition
Closed $70 MM
acquisition
Chart reflects total unitholder return July 22, 2013 to July 31, 2018. Distributions assumed to be reinvested in units. Source: Bloomberg.
See appendix for further footnotes.
Closed $236 MM
acquisition
Closed $775 MM
acquisition
Closed $1.3 B
acquisition
42
Closed $2.4 B
acquisition

Appendix
Freeport LPG Export Terminal

Corporate Strategy
Operating
Excellence
Growth
Returns
Distributions
High-Performing
Organization
Committed to safety, reliability and environmental stewardship while
protecting shareholder value
Reshaping our portfolio by capturing growth opportunities in Midstream
and Chemicals
Enhancing returns by maximizing earnings from existing assets and
investing capital efficiently
Committed to dividend growth, share repurchases and financial strength
Building capability, pursuing excellence and doing the right thing
44
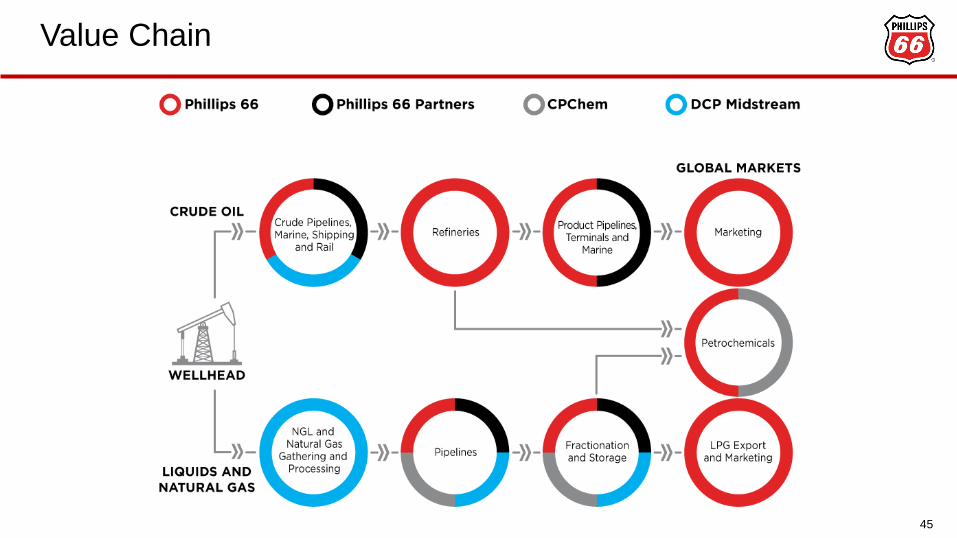
Value Chain
45

West Coast
46

Midcontinent
47

Western Gulf
48

Eastern Gulf
49

Atlantic Basin
50

Adjusted Free Cash Flow2012–1H 2018 Average
0.9
1.6
1.0 (0.3)
Adjusted CFO & PSXPContributions
Sustaining Capex Available Cash Flow
1.00.8
(0.2)
Adjusted CFO Sustaining Capex Adjusted FCF
Midstream ($B) Chemicals ($B)
Adjusted CFO excludes working capital. Sustaining capex excludes capital leases.
Midstream adjusted CFO excludes PSXP. PSXP contributions are calculated as consideration paid by PSXP to PSX in dropdown transactions plus quarterly cash distributions paid from PSXP to PSX.
Midstream sustaining capex excludes PSXP.
Phillips 66’s share of DCP Midstream, CPChem and WRB adjusted CFO reflects that portion of those entities’ cash flow over which Phillips 66 has significant influence over reinvestment/distribution
decisions. DCP Midstream, CPChem and WRB free cash flow calculated based on Phillips 66’s share of after tax cash flow at the enterprise level.
2.71.9
(0.8)
Adjusted CFO Sustaining Capex Adjusted FCF
Refining ($B) Marketing & Specialties ($B)
PSXP
Contributions
0.9 0.8
(0.1)
Adjusted CFO Sustaining Capex Adjusted FCF
51

24%
18%
12%
6%
M&S
Chemicals
Refining
Midstream
$32
-15%
0%
15%
30%
Average Capital Employed ($B)
Corporate
2012–1H 2018 Average Adjusted ROCE
52
PSX Total
11%
0
(8%)
2 4 6 8 10 12 14 16 18 20 22 24 26 28 30 32

53
0.3 0.5
2.0
0.8 1.01.5 1.7
0.5 0.5
0.5
0.5 0.6
0.8
2018 2020 2022 2024 2026 2028 2030 2032 2034 2036 2038 2040 2042 2044 2046
PSX Senior Notes
PSXP Senior Notes
PSX Term Loan
.
Total debt includes capital leases and is net of new issuance premiums and discounts.
Senior Notes Maturity Profile($B)
Consolidated Debt and Liquidity
5.0
0.8
Phillips 66, excluding PSXP Phillips 66 Partners
$8.5 B Total Debt as of June 30, 2018
$8.1 B Senior Notes
$6.7 B Total liquidity ($5.0 B RCF)
BBB+ / A3 Credit Rating
$2.9 B Total Debt as of June 30, 2018
$2.9 B Senior Notes
$0.9 B Total liquidity ($0.8 B RCF)
BBB / Baa3 Credit Rating

2018 Sensitivities
Sensitivities shown above are independent and are only valid within a limited price range.
54
Annual Net Income $MM
Midstream - DCP (net to Phillips 66)
10 cents/Gal Increase in NGL price 5
10 cents/MMBtu Increase in Natural Gas price 1
$1/BBL Increase in WTI price 1
Chemicals - CPChem (net to Phillips 66)
1 cent/Lb Increase in Chain Margin (Ethylene, Polyethylene, NAO) 45
Worldwide Refining
$1/BBL Increase in Gasoline Margin 260
$1/BBL Increase in Distillate Margin 230
Impacts due to Actual Crude Feedstock Differing from Feedstock Assumed in Market Indicators:
$1/BBL Widening WTI / WCS Differential (WTI less WCS) 50
$1/BBL Widening LLS / Maya Differential 40
$1/BBL Widening LLS / Medium Sour Differential 30
$1/BBL Widening LLS / WCS Differential 25
$1/BBL Widening WTI / WTS Differential 15
$1/BBL Widening LLS / WTI Differential 10
$1/BBL Widening ANS / WTI Differential 10
10 cent/MMBtu Increase in Natural Gas price (15)
1.0% increase in clean product yield 140

Phillips 66 Outlook
55
3Q 2018
Global Olefins & Polyolefins utilization Mid-90%
Refining crude utilization Mid-90%
Refining turnaround expenses (pre-tax) $60 MM - $80 MM
Corporate & other costs (after-tax) $170 MM - $190 MM
2018
Refining turnaround expenses (pre-tax) $520 MM - $570 MM
Corporate & Other costs (after-tax) $640 MM - $680 MM
Depreciation and amortization $1.4 B
Effective income tax rate Low-to-Mid-20%

2018 Capital Budget
56
Millions of Dollars
Sustaining Growth Capital
Capital Capital Program
Midstream
Phillips 66 133$ 335$ 468$
Phillips 66 Partners 85 665 750
218 1,000 1,218
Chemicals - - -
Refining 541 286 827
Marketing and Specialties 65 75 140
Corporate and Other 116 - 116
Phillips 66 Consolidated 940 1,361 2,301
DCP 55 350 405
CPChem 247 151 398
WRB 77 66 143
Selected Equity Affiliates 379 567 946
Total Capital Program 1,319$ 1,928$ 3,247$

2,701 Total U.S. Coking Capacity (MBD)
57
350
304
281
182 177 176 175
150 146 146 131
90
65 54 51
41 39 36 36 29 21 18 6
0
50
100
150
200
250
300
350
400
Source: 2018 Oil and Gas Journal. Phillips 66 includes 50% WRB.

5,034 Total Global Coking Capacity (MBD)
58Source: 2018 Oil and Gas Journal. Phillips 66 includes Humber, 18.75% MiRO, and 50% WRB.
423
304281
263263
198191182177155150146146
12511510992 90 84 79 72 65 61 56 54 51 50 43 41 40 39 39 37 36 36 36 33 30 29 29 26 26 26 25
485
0
50
100
150
200
250
300
350
400
450
500

Footnotes
59
Slide 3
Total share repurchases and exchanges include the PSPI share exchange in 2014. Dividend CAGR
calculated from initial dividend of $0.20 per share in 3Q 2012 to last increase of $0.80 per share in 2Q
2018.
Slide 4
Industry averages are from: Phillips 66 – American Fuel & Petrochemical Manufacturers (AFPM) refining
data, Chevron Phillips Chemical Company LLC (CPChem) – American Chemistry Council (ACC), DCP
Midstream, LLC (DCP Midstream) – Gas Processors Association (GPA).
Slide 5
Industry safety metrics as of 2016. Source: Bureau of Labor Statistics.
Sulfur oxides (SOx), nitrous oxides (NOx) and particulate matter (PM).

Footnotes
60
Slide 12: Map Key
Slide 14
3Q 2013 distribution represents the minimum quarterly distribution (MQD); actual distribution of 15.48 cents
equal to MQD prorated
Slide 15
Volumes exclude potential by-pass volumes

Footnotes
61
Slide 21
To enhance comparability to current operating assets, clean product yield shown excludes impacts from
Whitegate and Melaka prior to their sales. U.S. Industry average from U.S. Energy Information
Administration (EIA) updated through May 2018.
Slide 26
Reinvestment excludes Phillips 66’s portion of self-funded capital spending by DCP, CPChem and WRB.
Includes $1.5 B equity contribution to DCP in 2015.
Slide 28
Annual dividend reflects sum of declared quarterly dividends. 2018 reflects one quarterly dividend of
$0.70 and three quarterly dividends of $0.80. Dividend CAGR calculated from initial dividend of $0.20 per
share in 3Q 2012 to last increase of $0.80 per share in 2Q 2018. 2014 share repurchases/exchanges
include the PSPI share exchange.
Slide 29
Chart reflects estimated mid-cycle run-rate adjusted EBITDA contribution of projects coming online in
2017 and 2018.

Footnotes
62
Slide 30
Chart reflects total shareholder return May 1, 2012 to July 31, 2018. Dividends assumed to be reinvested
in stock. Source: Bloomberg.
Peer average includes Delek US Holdings, Inc., HollyFrontier Corporation, Marathon Petroleum
Corporation, PBF Energy Inc., Andeavor (formerly Tesoro Corporation), Valero Energy Corporation,
Enterprise Products Partners L.P., ONEOK, Inc., Targa Resources Corp., Celanese Corporation, Eastman
Chemical Company, Huntsman Corporation, LyondellBasell Industries, and Westlake Chemical
Corporation.
Slide 37
Capital expenditures attributable to the Partnership. Excludes predecessor capital spending
Slide 42
$2.4 B transaction closed as of October 6, 2017, includes $625 MM non-recourse Bakken JV debt and
$100 MM of Merey Sweeny, L.P. (MSLP) debt.
Maps, images, and drawings are all for informational purposes only and may not be to scale.

Footnotes
63
1H 2018
1H 2018 is as of June 30, 2018, or the six-month period ended June 30, 2018, as applicable; except as
otherwise noted.
Forecasted and Estimated EBITDA and Maps
We are unable to present reconciliations of various forecasted and estimated EBITDA included in this
presentation, because certain elements of net income, including interest, depreciation and income taxes,
are not reasonably available. Together, these items generally result in EBITDA being significantly greater
than net income.
Maps, images, and drawings are all for informational purposes only and may not be to scale.

Non-GAAP Reconciliation (slide 4)
64
2013 2014 2015 2016 2017 1H 2018
Production and operating expenses 4,206$ 4,435$ 4,294$ 4,275$ 4,699$ 2,389$
Selling, general and administrative expenses 1,478 1,663 1,670 1,638 1,695 818
5,684 6,098 5,964 5,913 6,394 3,207
Plus:
Sentinel operating expenses* 81 90 88 94 - -
Total expenses 5,765 6,188 6,052 6,006 6,394 3,207
Less:
Turnaround expenses** 368 424 516 506 598 323
Adjusted Operating Costs and SG&A 5,397$ 5,764$ 5,536$ 5,500$ 5,796$ 2,884$
*Sentinel Transportation, LLC became a wholly-owned subsidiary of Phillips 66 on 12/31/16. Costs for 2013 - 2016 are included for comparison purposes.
** Turnaround expenses are reported under Operating expenses in the Income Statement
Millions of Dollars

Non-GAAP Reconciliation (slide 24)
65
Millions of Dollars
2013 2014 2015 2016 2017
Reconciliation of Marketing and Specialties Net Income to Adjusted EBITDA
Marketing and Specialties net income 894 1,034 1,187 891 686
Plus:
Income tax expense 433 441 465 370 334
Interest revenue - - (2) - -
Depreciation and amortization 103 95 97 107 112
Marketing and Specialties EBITDA 1,430 1,570 1,747 1,368 1,132
Special Item Adjustments (pre-tax):
Asset dispositions (40) (125) (242) - -
Pending claims and settlements (25) (44) - - -
Exit of a business line 54 - - - -
Tax law impacts (6) - - - -
Hurricane-related costs - - - - 1
Pension settlement expense - - 11 - 11
Marketing and Specialties EBITDA, Adjusted for Special Items 1,413 1,401 1,516 1,368 1,144
Other Adjustments (pre-tax):
Proportional share of selected equity affiliates income taxes - - - - -
Proportional share of selected equity affiliates net interest 9 6 6 - 1
Proportional share of selected equity affiliates depreciation and amortization 12 11 11 12 11
Marketing and Specialties Adjusted EBITDA 1,434 1,418 1,533 1,380 1,156

PSXP Non-GAAP Reconciliation (Slide 35)
66
Millions of Dollars
2013 2014 2015 2016 2017 2Q 2018
Reconciliation to Net Income Attributable to the Partnership
Net income attributable to the Partnership 29 116 194 301 461 186
Plus:
Net income attributable to Predecessors 145 129 112 107 63 -
Net income 174 245 306 408 524 186
Plus:
Depreciation 43 46 61 96 116 29
Net interest expense - 5 34 52 99 29
Income tax expense 2 1 - 2 4 -
EBITDA 219 297 401 558 743 244
Proportional share of equity affiliates’ net interest, taxes and depreciation - - 31 45 66 28
Expenses indemnified or prefunded by Phillips 66 - 2 2 6 8 1
Transaction costs associated with acquisitions 1 3 2 4 4 3
EBITDA attributable to Predecessors (187) (161) (151) (142) (67) -
Adjusted EBITDA 33 141 285 471 754 276
Plus:
Deferred revenue impacts*† - 2 4 11 6 (5)
Less:
Equity affiliate distributions less than proportional EBITDA - - 19 28 29 18
Maintenance capital expenditures† 3 12 8 22 50 10
Net interest expense - 3 34 52 100 29
Preferred unit distributions - - - - 9 10
Distributable cash flow 30 128 228 380 572 204
Adjusted EBITDA for all prior periods has been retrospectively adjusted to present our proportional share of equity affiliates’ EBITDA, rather than cash distributions
received.
*Difference between cash receipts and revenue recognition.† Excludes MSLP capital reimbursements and turnaround impacts.

PSXP Non-GAAP Reconciliation (Slide 35)
67
Millions of Dollars
2013 2014 2015 2016 2017 2Q 2018
Reconciliation to Net Cash Provided by Operating Activities
Net cash provided by operating activities 199 296 392 492 724 226
Plus:
Net interest expense - 5 34 52 99 29
Income tax expense 2 1 - 2 4 -
Changes in working capital 18 (3) (12) 28 (30) (10)
Undistributed equity earnings - - - (1) 1 (1)
Deferred revenues and other liabilities - (2) (11) (9) (43) 5
Other - - (2) (6) (12) (5)
EBITDA 219 297 401 558 743 244
Proportional share of equity affiliates’ net interest, taxes and depreciation - - 31 45 66 28
Expenses indemnified or prefunded by Phillips 66 - 2 2 6 8 1
Transaction costs associated with acquisitions 1 3 2 4 4 3
EBITDA attributable to Predecessors (187) (161) (151) (142) (67) -
Adjusted EBITDA 33 141 285 471 754 276
Plus:
Deferred revenue impacts*† - 2 4 11 6 (5)
Less:
Equity affiliate distributions less than proportional EBITDA - - 19 28 29 18
Maintenance capital expenditures† 3 12 8 22 50 10
Net interest expense - 3 34 52 100 29
Preferred unit distributions - - - - 9 10
Distributable cash flow 30 128 228 380 572 204
Adjusted EBITDA for all prior periods has been retrospectively adjusted to present our proportional share of equity affiliates’ EBITDA, rather than cash distributions
received.
*Difference between cash receipts and revenue recognition.† Excludes MSLP capital reimbursements and turnaround impacts.

Non-GAAP Reconciliations (Slide 51)
68
FCF Reconcilition
Cash From Operations GAAP 905 392 2,596 964
Change in Non-Cash Working Cap. 12 - 151 (97)
Cash From Operations (excluding WC) 917 392 2,747 867
Less: P66 Equity affiliate cash from ops 170 392 516 -
Add: Equity look through cash from ops 361 966 477 -
Less: PSXP's portion of CFO* 226 - - -
Adjusted FCF (excl WC) 882 966 2,708 867
Total Capex GAAP 1,636 - 921 187
Less: Growth Capex 1,241 - 227 127
Sustaining Capex 395 - 694 60
Less: P66 Equity affiliate sustaining capex 231 - - -
Add: Equity look through sustaining capex 107 208 113 -
Less: PSXP's portion of sustaining capex 18 - - -
Adjusted Sustaining Capex 253 208 807 60
PSXP Contributions* 994 - - -
Adjusted Free Cash Flow 1,623 758 1,901 807
*PSXP formed in 2013, values of 0 included for 2012
Millions of Dollars
Average 2012 - 2018 1H
Midstream Chemicals Refining
Marketing &
Specialties

Non-GAAP Reconciliations (Slide 52)
69
Phillips 66** Midstream Chemicals Refining M&S Corporate
Phillips 66 ROCE
Numerator
Net Income 3,974$ 360 848 1,837 870 (67)
After-tax interest expense 219 - - - - 219
GAAP ROCE earnings 4,193 360 848 1,837 870 152
Special Items (433) 84 68 4 (61) (402)
Adjusted ROCE earnings 3,760$ 444 916 1,841 809 (250)
Denominator
GAAP average capital employed* 34,025 7,243 5,099 15,085 3,378 3,066
Discontinued Operations (71) - - - - -
Adjusted average capital employed* 33,954$ 7,243 5,099 15,085 3,378 3,066
*Total equity plus debt.
GAAP ROCE (percent) 12% 5% 17% 12% 26% 5%
Adjusted ROCE (percent) 11% 6% 18% 12% 24% -8%
** Phillips 66 consolidated includes discontinued operations.
Millions of Dollars
Average 2012-1H 2018