Embed Size (px)
Citation preview

1
November 1, 2017 Presentation Script and Slides The following script should be read in conjunction with the accompanying slide presentation, which contains, among other information, source data for certain information set forth in the script. Thank you for joining us. We’ll start with an overview of XPO Logistics today — our company, our technology and our value propositions for customers and investors. We’ll discuss our operations in depth. And then we’ll share our strong third quarter results, including the highest revenue, net income and cash flow of any quarter in our history, and an EBITDA performance that beat expectations. XPO is a top ten global logistics company with approximately $15 billion of revenue, operating as a highly integrated network of people, technology and physical assets. We use our network to help customers manage their goods more efficiently throughout their supply chains. We run our business under the single brand of XPO Logistics. As context, we have two reporting segments: transportation and logistics. Approximately 63% of our revenue comes from transportation. The other 37% is logistics, which we sometimes refer to as “supply chain” or “contract logistics.” We’re not reliant on the economy of any one country, region or industry. About 60% of our revenue is generated in the United States, 13% comes from France and 12% from the UK. Of the balance, Spain is the next largest at 4% of revenue. In total, we operate in 32 countries with 1,444 locations and over 91,000 employees. Our customer base is also highly diversified. The more than 50,000 customers we serve are in every major industry and touch every part of the economy. Retail and e-commerce accounts for the largest portion of our revenue at 26%, followed by food and beverage at 14% and industrial manufacturing at 10%. These are the key factors driving our high growth and returns:
• Solid organic revenue growth supported by numerous tailwinds
• Leadership positions in the fastest growing areas of transportation and logistics
• $1 trillion addressable opportunity, of which we hold less than 1.5% market share
• A strong presence in the high-growth e-commerce sector
• Cutting-edge technology that differentiates each line of business
• Numerous company-specific margin improvement opportunities
• Low maintenance capex requirements
• Organizational track record of creating value through M&A integrations
• World-class operators who are laser-focused on driving results

2
In addition, we have a major opportunity to increase our profitability through the cross-fertilization of best practices. This is already paying dividends given the high caliber of our operations on both sides of the Atlantic. We’re sharing knowledge across all of our service offerings and geographies, with an emphasis on large-impact areas such as customer service, sales, safety, warehouse management, cross-dock operations, equipment maintenance, training and HR. The veteran operators who lead our business units are adept at integrating these practices into daily operations. Our sales strategy is two-fold: earn a greater share of wallet with our existing customer base, and penetrate high-growth verticals where companies have a need for multiple XPO services. We’ve made sizable investments in a world-class sales force that transforms how we go to market. We’ve more than tripled the number of strategic account managers, hired over 200 local account executives and established growth-based incentives. Our salespeople use a global CRM system that puts them in a strong position to serve our customers and drive returns. The $2.1 billion of sales we closed through September was up 49% over last year, and our pipeline continues to exceed $3 billion globally. In addition to sales initiatives, we have a large number of company-specific actions we’re taking to increase our adjusted EBITDA margin. We’re well on the way to increasing our margin by 200 basis points from about 8% in 2016 to 10% in 2018. Some of the larger opportunities are related to cost rationalization in centralized procurement, back office operations, workplace automation, labor productivity and other efficiencies. Company Overview We’ve meticulously built our global network to provide exceptional value for customers while generating high returns for our shareholders. The components are:
• An intense customer service culture and a highly engaged employee base;
• Best-in-class operators with specific strengths in each area of our business;
• Cutting-edge, proprietary technology integrated on a cloud-based platform across all business offerings;
• Ground transportation assets of 16,000 owned tractors; 39,000 trailers; 10,000 53-ft. intermodal boxes; and 5,400 chassis;
• A non-asset transportation network of 11,000 trucks contracted via independent owner-operators, and more than 1 million brokered trucks;
• 440 cross-docks and 767 contract logistics facilities;
• A business model that is asset-light overall, with assets accounting for just under a third of our revenue. Our estimated annual net capex is only about 3% of revenue; and
• The ability to optimize entire supply chains through the utilization of multiple solutions. Our industry is large, growing and fragmented, with underpenetrated market sectors and trends toward outsourcing. Many companies are seeking to consolidate their supply chain relationships. This is particularly true of large companies with multiple end-markets or multinational footprints.

3
All of these industry attributes play directly to our strengths of scale, density, service range and technology. We offer not only the convenience of a single source, but also the strength and stability of a global leader. XPO is the:
• Largest last mile logistics provider for heavy goods in the U.S., a more than $13 billion sector that’s estimated to be growing at five to six times GDP;
• Largest manager of expedited shipments in North America by ground, air and TMS technology;
• Second largest contract logistics provider worldwide, with the largest outsourced e-fulfillment platform in Europe;
• Second largest provider of less-than-truckload transportation in North America, and a leading LTL provider in Western Europe;
• Second largest freight broker worldwide, with the largest owned road fleet in Europe;
• Third largest provider of intermodal and drayage services in North America, a $22 billion opportunity.
In addition, we’re a top five global provider of managed transportation and a global freight forwarder with an integrated network of ocean, air, ground and border services.
Looking solely at the industry sectors addressed by our service range, we have a total addressable opportunity of $1 trillion or more. Now let’s take a deeper look into XPO, starting with our technology. Transformative Technology XPO empowers its employees to deliver world-class service through technology, which is a pillar of our strategy. We place massive importance on innovation because we believe that great technology in the hands of well-trained employees is the ultimate competitive advantage in our industry. Our focus is on using innovation to differentiate our services and deliver tangible value to our customers and investors. Our annual technology budget is approximately $425 million. We’ve built a highly scalable and integrated system on a cloud-based platform that speeds up innovation, with a global team of more than 1,600 IT professionals, including over 100 data scientists. We concentrate our efforts in four areas of innovation: automation; visibility and customer service; business-specific analytics; and far-reaching new capabilities. We have exciting developments underway in all major areas of logistics. We view our technology as being critical to continuously improving customer service and leveraging our scale. In transportation, we’re constantly enhancing our Freight Optimizer and Rail Optimizer systems and rolling out new capabilities for LTL. In our last mile operations, we hold patents on industry-leading software for real-time workflow visibility and customer experience management. This gives us a competitive advantage in the last mile space, because it documents our ability to ensure a quality, on-time consumer experience with superior satisfaction ratings. Recently, we enhanced our applications to handle complex in-home installations, a trend in last mile.

4
In LTL, we rolled out 14,000 new handhelds and inspection tablets for drivers and dockworkers to enhance productivity and revenue collection from accessorials and ancillary services. We also rolled out new RFP and pricing systems for LTL, including robust pricing algorithms and profitability monitoring. These have improved the business intelligence we use for pricing, workforce planning and network optimization. In logistics, the warehouses we run are becoming high-tech hubs with advanced robotics, drones for inventory management and sophisticated predictive analytics for e-commerce. By predicting the flow of goods and future returns, we’re able to help our customers sell more successfully online. Our proprietary technology also facilitates omnichannel distribution, lean manufacturing support, aftermarket support, supply chain optimization and transportation management. The logistics space is wide open for the development of exciting technologies, and our position as the industry’s leading champion of technology has led to important new advantages for our customers. We’re designing a next-generation logistics facility in collaboration with a blue chip customer in the consumer packaged goods space. It’s a testing ground where we’re bringing together, in a highly integrated way, all the things we do extremely well and using that as a launch pad for innovation. We’ll push each technology success out to our 755-plus logistics facilities around the world.
Logistics Operations
Contract Logistics Contract logistics is an asset-light business characterized by long-term contractual relationships, low cyclicality and a high-value-add component that minimizes commoditization. It has low capex requirements as a percentage of revenue, which leads to strong free cash flow conversion and ROIC. As the second largest logistics provider worldwide, we’re at the forefront of a $120 billion sector that’s estimated to grow at two to three times GDP. Globally, we have approximately 166 million square feet of logistics facility space. Our expansive network makes us particularly attractive to multinational customers, as do our vertical expertise, technology and engineering capabilities. When we secure a new logistics contract, the initial tenure is approximately five years on average, with a historical renewal rate of over 95%. These relationships can lead to cross-selling and a wider use of our services, such as inbound and outbound logistics. Our logistics teams provide a range of services to customers, including highly engineered solutions and high-value-add services. We perform e-commerce fulfillment, order personalization, reverse logistics, packaging and labeling, distribution and managed transportation. We also collaborate with our larger customers to optimize their production flows. Many of our customers are the preeminent names in retail and e-commerce, food and beverage, aerospace, technology, wireless, manufacturing, chemical, agribusiness, life sciences and healthcare. We also have strong positions in fast-growing sub-verticals: for example, XPO is the number one provider of fashion logistics in Italy. We also have complementary strengths in different verticals in Europe and North America. For example, in Europe we’re a specialist in cold chain logistics, which includes some sectors that

5
are less sensitive to economic cycles, such as food and beverage. This is helping us build our cold chain business in North America. In the U.S., we’re strong in aerospace and other high tech verticals, which is opening new doors in Europe. We’ve built a global pipeline of approximately $1.7 billion of active logistics bids. A number of the wins we had in late 2016 and early 2017 are ramping up now and will start driving revenue growth when they come online in early 2018. Our operations performance team collaborates between North America and Europe to optimize our warehouses. The team is helping management at every site understand the gaps between average performance and great performance, and devise action plans for improvements. Workforce productivity is a huge lever for cost savings in our warehouse operations. Managed Transportation XPO is a top five global provider of managed transportation, with approximately $2.7 billion of freight under management. Managed transportation is a non-asset service provided to shippers who want to outsource some or all of their transportation modes, together with associated activities. These activities can include freight handling such as consolidation and deconsolidation, labor planning, inbound and outbound shipment facilitation, documentation and customs management, claims processing and 3PL supplier management, among other services. Transportation Operations Our other segment — transportation — includes our lines for truck brokerage and transportation, LTL, last mile, intermodal and drayage, expedite and global forwarding. Truck Brokerage and Transportation XPO utilizes a blended transportation model of brokered, owned and contracted capacity for truck transportation in North America and Europe. The non-asset portion of our model is variable cost and gives us extensive flexibility. It includes our brokerage operations, as well as contracted capacity with independent owner-operators. Brokerage is compelling to us for a number of reasons. In addition to being variable cost, it has high free cash flow conversion and minimal capex requirements, with tailwinds from outsourcing and supplier consolidation. Brokerage is also valuable to most of our customers who use XPO for other lines of business. We’ve built a powerful truckload management system called Freight Optimizer that drives our brokerage operations in both North America and Europe. In North America, our brokerage network includes approximately 38,000 independent carriers representing over a million trucks. That’s a big deal to shippers — they value our ability to find them trucks under all kinds of market conditions. Examples of brokered freight include industrial flows of raw materials and finished goods, consumer goods, sensitive freight, and freight that is high-value or high-security. In Europe, the largest components of our transportation operations are LTL, dedicated transport and brokerage. These three service lines generate about three-quarters of our European transport EBITDA. We also have a non-dedicated truckload business that provides on-demand capacity for our customers.

6
Less-Than-Truckload (LTL) LTL is a major success story for us in both North America and Europe. Our LTL business in North America is asset-based; it utilizes employee drivers, a fleet of tractors and trailers for line-haul, pick-up and delivery of pallets, and a network of terminals. In Western Europe, where we’re a leading LTL provider, we typically contract with independent carriers for some or most of the transportation, depending on the country. These relationships are supported by our terminals and staff. Our LTL team has a laser focus on on-time, damage-free performance. We have the second largest LTL network in the U.S., covering 99% of all zip codes, and one of the industry’s most modern fleets delivering nearly 20 billion pounds of freight a year. We’ve significantly increased the number of salespeople dedicated to serving our LTL customer base. The LTL team in North America ramped up volume again in the third quarter, and increased adjusted operating income from $233 million in 2015, when we owned the operation for two months, to $433 million for the trailing 12 months through September 2017. We’ve also continued to take significant costs out of our LTL network — we’re up to a $190 million run rate of savings. This success with cost control is a big reason why our LTL business is on track to generate over $1 billion of EBITDA within five years. We have a large number of initiatives underway in LTL to generate new business, increase yield, improve trailer utilization, and continue strict cost controls, among other initiatives. The next big efficiency for us is workforce utilization aligned with engineered standards. Our transformation and big data teams are using labor analytics to model an optimal solution for any given day based on the amount of work forecasted. They look at things like pick-up and delivery hours, dock hours, overtime, part-time labor and full-time labor. This is being executed in our European transport businesses as well. Last Mile Logistics Last mile is another asset-light operation, and an outsized performer in our service range. We manage the final delivery of goods to homes, using a network of contract carriers and white glove technicians for assembly and installation. XPO is by far the largest U.S. facilitator for the home delivery of heavy goods. Our last mile customers include most of the big-box retailers in North America who sell heavy goods — items such as appliances, furniture, exercise equipment and large electronics. We facilitated over 13 million last mile deliveries in the past 12 months, and yet we hold just 7% share in the last mile space. Our last mile business is an exciting combination of expertise, technology and scale that generates industry-leading consumer satisfaction ratings. We use our proprietary, state-of-the-art technology to enable real-time performance monitoring: consumers are surveyed within minutes of delivery to capture feedback and escalate any issues for prompt resolution. While goods are in transit, user-friendly mobile and web-based tracking tools let buyers self-monitor their orders while receiving automated appointment verifications by phone, email or text. The result is a consistently best-in-class home delivery experience at a national level. E-commerce is an immense tailwind for last mile, and one that’s predicted to grow globally at double-digit rates through at least 2020. Within e-commerce, there’s an ongoing shift toward

7
customers buying large, heavy items online. Given our specialization in heavy goods, this represents tremendous growth potential for us. This year, we’ve won significant new contracts for the home delivery of appliances and mattresses. In North America, we’re expanding our last mile network to a planned total of 85 hubs by the end of 2018. This will position our last mile footprint within approximately 90% of the U.S. population, further reducing transit times. Our eight hub openings this year brought us to 53 hubs through September, and we’ve deployed new technology tools for route planning to drive increasing efficiency as the network grows in scale. We’ve integrated last mile with our contract logistics and LTL networks to create a powerful value proposition that differentiates XPO in the retail and e-commerce sectors. In Europe, which is another fragmented last mile landscape, there’s a large opportunity for us to apply our last mile technology and best practices. We recently established last mile operations in the UK, Ireland and the Netherlands. Intermodal and Drayage Intermodal and drayage are additional growth opportunities for us in North America. Both are asset-light operations involved in the long-haul portion of containerized freight movements. Services include rail brokerage, local drayage by independent trucking contractors, and on-site operational services. XPO has one of the largest drayage networks in the U.S., with more than 2,300 independent owner-operators and access to another 25,000 drayage trucks. We’ve been able to increase our intermodal bidding activity and our sales trends have been improving. Right now the market is favorable and our proprietary Rail Optimizer technology is a growth engine and a differentiator — earlier this year it helped us win the largest contract in XPO’s history. The nature of intermodal is that demand is influenced by external factors such as tight or loose truck capacity, and we see this mode as a longer-term opportunity. Importantly for our customers, Rail Optimizer is also helping us achieve our best-ever intermodal on-time performance record, reduce empty miles, improve customer service levels and increase visibility across the network. Expedite We offer expedited transportation, a non-asset business, as part of our freight brokerage operations in North America. Expedited shipments are time-critical goods or raw materials that have to get somewhere very quickly, typically on little notice. We use a network of contracted owner-operators to handle expedited ground transportation, and an electronic bid platform to assign air charter loads. A large and separate component of our expedite operations is our proprietary transportation management platform, which awards loads electronically based on carriers’ online bids. These transactions primarily happen on a machine-to-machine basis. Our technology initiates a new auction on the internet every 12 minutes, and we take a fee for facilitating the entire process. One secular driver of expedite demand is the trend toward just-in-time (JIT) urgent shipments. JIT is a supply chain strategy that requires 3PL support for both manufacturing production and inventory management. As the largest manager of expedited shipments in North America, we can pivot very quickly, often saving our customers from disastrous monetary loss.
8
Our expedite group serves our other service lines as well. For example, if a track repair stalls a rail container, we can off-load those goods to an expedite ground carrier in our network or put them on a chartered aircraft. This ability to find solutions to almost any challenge is a major advantage of our integrated organization. Global Forwarding We provide non-asset global forwarding services in a $150 billion sector where customers depend on our domestic, cross-border and international expertise. The shipments we forward may have origins and destinations within the same country, or move between countries or continents. They may travel by ground, air, ocean, or some combination of these modes. XPO has a network of independent market experts and licensed customs brokers who provide local oversight in thousands of key trade areas worldwide, and we hold OTI and NVOCC licenses. We believe that we can use our volume to purchase transportation more effectively for our global forwarding customers. Service-Driven, Results-Oriented Culture The common denominator across all areas of transportation and logistics is that customers want results. A zero-fail mindset is part of our DNA, dating back a quarter century to our roots in expedite. Anything less than stellar service is not an option for us. Transportation customers want on-time pickup and delivery. Contract logistics customers want their goods to flow smoothly through the supply chain.All customers want visibility into flows, accurate documentation and damage-free handling. If a disruption does occur, customers expect to know about it right away and hear a solution. If you walk into an XPO office or facility, you’ll see that our people are trained to be professional, efficient and on top of things. We see an opportunity to continue to differentiate XPO on the basis of phenomenal customer service in each of our service offerings. The litmus test is always our customer. Is the customer thrilled to have chosen XPO? Are we constantly improving the value we deliver? When we receive awards for operational excellence and performance from world-class companies such as Diebold, Navistar, Nissan, Nordstrom and Whirlpool, we know we’re doing our job. We also want to continue to build on our leadership position in sustainability. XPO owns the largest natural gas truck fleet in Europe. We launched government-approved mega-trucks in Spain in 2016, which are expected to reduce CO2 emissions by over 25%. XPO has been named a Top 75 Green Supply Chain Partner by Inbound Logistics for two consecutive years, and in 2016 was awarded the label “Objectif CO2” for outstanding environmental performance of transport operations in Europe by the French Ministry of the Environment and the French Environment and Energy Agency. Next year, we’ll lower the carbon footprint of trucking in Paris for the road transport portion of France's first intermodal urban logistics shuttle. The Paris shuttle project is truly exciting. We’re proud to partner in this landmark collaboration, which will provide economical and environmentally responsible service to the heart of Paris. Each Eurorail train shuttle will transport 60 container cars of goods. From there, goods will move on XPO trucks that use alternative fuels such as natural gas instead of diesel.

9
Many of our logistics facilities are ISO14001-certified, which ensures environmental and other regulatory compliances. We monitor fuel emissions from forklifts, and we have systems in place to take immediate corrective action if needed. XPO packaging engineers ensure that the optimal carton size is used for each product slated for distribution, and when feasible, we purchase recycled packaging. As a byproduct of our reverse logistics operations, we recycle millions of electronic components and batteries each year. That sums up our many opportunities for value creation. Now it’s about operational excellence and further accelerating returns. Financial Highlights We started 2017 on a positive note and rapidly built momentum throughout the year. Our record third quarter results1 were our strongest showing yet:
• $3.89 billion of revenue • $57.5 million of net income attributable to common shareholders; $0.44 per diluted share • $369.6 million of adjusted EBITDA • $76.7 million of adjusted net income • $293.7 million of cash flow from operations • $183.2 million of free cash flow
We’ve reaffirmed our targets for adjusted EBITDA of at least $1.365 billion for this year, and at least $1.6 billion for 2018. These numbers don’t include any benefit from future acquisitions. For 2017–2018 combined, our target for cumulative free cash flow is approximately $900 million, including at least $350 million of free cash flow generated this year.
High Growth and High Returns In summary, we’re continuing to execute our strategy for high growth and high returns from a position of considerable financial and operational strength. XPO is on the radar in every industry that requires transportation or logistics. Our ability to drive efficiencies in so many parts of the supply chain is a value proposition that clearly resonates with customers. This is particularly true in the e-commerce sector, where we can provide integrated transportation and logistics solutions that help manage demand. Most important, we have a deep bench of seasoned operators who know how to achieve results. Our goal is always to help customers operate more efficiently and reduce their costs. We work closely with all types of companies to look at the entire supply chain, from point of origin to the end-consumer. This collaborative approach and our proprietary technology are major reasons why 65 of Fortune 100 companies use XPO. Our customers trust us with an average of 160,000 shipments and over seven billion inventory units every day.
1Reconciliationsofnon-GAAPfinancialmeasuresusedinthisdocumentareprovidedintheaccompanyingslidepresentation.

10
We expect our performance to continue to outpace the industry. Our sales organization is much larger and more integrated than it was a year ago. We’re maintaining a pipeline of over $3 billion, while closing a record amount of new business. In addition, we have initiatives underway around the globe to continuously improve our performance and lower our procurement costs. Our global procurement team has already achieved an annual run rate of over $105 million in savings, and we’re using our technology to better utilize our labor and capacity — all while helping our customers manage their supply chains more efficiently. In 2016, we made the Fortune 500 list for the first time, and this year we’re ranked as the Fortune 500’s fastest-growing transportation company. Forbes has named us the top-performing U.S. company on its Global 2000 list and one of America’s best employers. As we move toward 2018, we have a thirst to create even more value for our customers and our shareholders. We grew XPO into a global leader in four years primarily through acquisitions; then took 20 months to focus on growth through integration and optimization. Now we’re looking at M&A as a way to augment our momentum. With all the positive news we have to report, we still see the vast majority of our growth ahead. Thank you for your interest! Non-GAAP Financial Measures
This document contains certain non-GAAP financial measures as defined under the rules of the Securities and Exchange Commission ("SEC"), including earnings before interest, taxes, depreciation and amortization (“EBITDA”) and adjusted EBITDA for the three and nine-month periods ended September 30, 2016, and September 30, 2017, on a consolidated basis; free cash flow for the three and nine-month periods ended September 30, 2016 and September 30, 2017; adjusted net income attributable to common shareholders and adjusted earnings per share (basic and diluted) (“adjusted EPS”) for the three and nine-month periods ended September 30, 2016, and September 30, 2017; and adjusted operating income for our North American less-than-truckload business for the three and nine-month periods ended September 30, 2016 and September 30, 2017. We believe that the above adjusted financial measures facilitate analysis of our ongoing business operations because they exclude items that may not be reflective of, or are unrelated to, XPO and its business segments’ core operating performance, and may assist investors with comparisons to prior periods and assessing trends in our underlying businesses. In particular, adjusted EBITDA, adjusted net income and adjusted EPS include adjustments for acquisition costs and related integration, transformation and rebranding initiatives as well as other adjustments that management has determined are not reflective of its business segments’ core operating activities. Transaction and integration adjustments are generally incremental costs that result from an acquisition and include transaction costs, restructuring costs, acquisition and integration consulting fees, internal salaries and wages (to the extent the individuals are assigned full-time to integration and transformation activities) and certain costs related to integrating and converging IT systems. Rebranding adjustments relate primarily to the rebranding of the XPO Logistics name on our truck fleet and buildings. These adjustments are

11
consistent with how management views our businesses. Management uses these non-GAAP financial measures in making financial, operating and planning decisions and evaluating XPO’s and each business segment’s ongoing performance.
We believe that free cash flow is an important measure of our ability to repay maturing debt or fund other uses of capital that we believe will enhance stockholder value. We believe that EBITDA and adjusted EBITDA improve comparability from period to period by removing the impact of our capital structure (interest and financing expenses), asset base (depreciation and amortization), tax impacts and other adjustments as set out in the attached tables that management has determined are not reflective of normalized operating activities.
We believe that adjusted net income attributable to common shareholders and adjusted EPS improve the comparability of our operating results from period to period by removing the impact of certain costs and gains that management has determined are not reflective of our core operating activities. We believe that adjusted operating income for our North American less-than-truckload business improves the comparability of our operating results from period to period by removing the impact of certain transaction, integration and rebranding costs and amortization and depreciation expenses incurred in the reporting period as set out in the attached tables.
Other companies may calculate EBITDA and adjusted EBITDA differently, and therefore our measure may not be comparable to similarly titled measures of other companies. Free cash flow, EBITDA, adjusted EBITDA, adjusted net income attributable to common shareholders, adjusted EPS and adjusted operating income for our North American less-than-truckload business are not measures of financial performance or liquidity under GAAP and should not be considered in isolation or as an alternative to revenue, net income, operating income for our North American less-than-truckload business, cash flows provided (used) by operating activities and other measures determined in accordance with GAAP. Items excluded from EBITDA and adjusted EBITDA are significant and necessary components of the operations of our business, and, therefore, EBITDA and adjusted EBITDA should only be used as a supplemental measure of our operating performance.
As required by SEC rules, we provide reconciliations of these historical measures to the most directly comparable measure under United States generally accepted accounting principles ("GAAP"), which are set forth in the financial tables attached to this document. With respect to our 2017 and 2018 financial targets of adjusted EBITDA and our 2017 and 2017-2018 cumulative targets for free cash flow, each of which is a non-GAAP measure, a reconciliation of the non-GAAP measure to the corresponding GAAP measure is not available without unreasonable effort due to the variability and complexity of the reconciling items described below that we exclude from the non-GAAP target measure. The variability of these items may have a significant impact on our future GAAP financial results and, as a result, we are unable to prepare the forward-looking balance sheet, statement of income and statement of cash flow, prepared in accordance with GAAP that would be required to produce such a reconciliation.
Forward-looking Statements

12
This document includes forward-looking statements within the meaning of Section 27A of the Securities Act of 1933, as amended, and Section 21E of the Securities Exchange Act of 1934, as amended, including our financial targets. All statements other than statements of historical fact are, or may be deemed to be, forward-looking statements. In some cases, forward-looking statements can be identified by the use of forward-looking terms such as "anticipate," "estimate," "believe," "continue," "could," "intend," "may," "plan," "potential," "predict," "should," "will," "expect," "objective," "projection," "forecast," "goal," "guidance," "outlook," "effort," "target," “trajectory” or the negative of these terms or other comparable terms. However, the absence of these words does not mean that the statements are not forward-looking. These forward-looking statements are based on certain assumptions and analyses made by us in light of our experience and our perception of historical trends, current conditions and expected future developments, as well as other factors we believe are appropriate in the circumstances.
These forward-looking statements are subject to known and unknown risks, uncertainties and assumptions that may cause actual results, levels of activity, performance or achievements to be materially different from any future results, levels of activity, performance or achievements expressed or implied by such forward-looking statements. Factors that might cause or contribute to a material difference include the risks discussed in our filings with the SEC and the following: economic conditions generally; competition and pricing pressures; our ability to align our investments in capital assets, including equipment, service centers and warehouses, to our customers’ demands; our ability to successfully integrate and realize anticipated synergies, cost savings and profit improvement opportunities with respect to acquired companies; our ability to develop and implement suitable information technology systemsand prevent failures in or breaches of such systems; our substantial indebtedness; our ability to raise debt and equity capital; our ability to maintain positive relationships with our network of third-party transportation providers; our ability to attract and retain qualified drivers; litigation, including litigation related to alleged misclassification of independent contractors; labor matters, including our ability to manage our subcontractors, and risks associated with labor disputes at our customers and efforts by labor organizations to organize our employees; risks associated with our self-insured claims; risks associated with defined benefit plans for our current and former employees; fluctuations in currency exchange rates; fluctuations in fixed and floating interest rates; our ability to execute our growth strategy through acquisitions; fuel price and fuel surcharge changes; issues related to our intellectual property rights; governmental regulation, including trade compliance laws; and governmental or political actions, including the United Kingdom's likely exit from the European Union. All forward-looking statements set forth in this document are qualified by these cautionary statements and there can be no assurance that the actual results or developments anticipated by us will be realized or, even if substantially realized, that they will have the expected consequences to or effects on us or our business or operations. Forward-looking statements set forth in this document speak only as of the date hereof, and we do not undertake any obligation to update forward-looking statements to reflect subsequent events or circumstances, changes in expectations or the occurrence of unanticipated events, except to the extent required by law.

XPO Investor Presentation
November 2017

Disclaimers
Non-GAAP Financial Measures This document contains certain non-GAAP financial measures as defined under the rules of the Securities and Exchange Commission ("SEC"), including earnings before interest, taxes, depreciation and amortization (“EBITDA”) and adjusted EBITDA for the three and nine-month periods ended September 30, 2016, and September 30, 2017, on a consolidated basis; free cash flow for the three and nine-month periods ended September 30, 2016 and September 30, 2017; adjusted net income attributable to common shareholders and adjusted earnings per share (basic and diluted) (“adjusted EPS”) for the three and nine-month periods ended September 30, 2016, and September 30, 2017; and adjusted operating income for our North American less-than-truckload business for the three and nine-month periods ended September 30, 2016 and September 30, 2017. We believe that the above adjusted financial measures facilitate analysis of our ongoing business operations because they exclude items that may not be reflective of, or are unrelated to, XPO and its business segments’ core operating performance, and may assist investors with comparisons to prior periods and assessing trends in our underlying businesses. In particular, adjusted EBITDA, adjusted net income and adjusted EPS include adjustments for acquisition costs and related integration, transformation and rebranding initiatives as well as other adjustments that management has determined are not reflective of its business segments’ core operating activities. Transaction and integration adjustments are generally incremental costs that result from an acquisition and include transaction costs, restructuring costs, acquisition and integration consulting fees, internal salaries and wages (to the extent the individuals are assigned full-time to integration and transformation activities) and certain costs related to integrating and converging IT systems. Rebranding adjustments relate primarily to the rebranding of the XPO Logistics name on our truck fleet and buildings. These adjustments are consistent with how management views our businesses. Management uses these non-GAAP financial measures in making financial, operating and planning decisions and evaluating XPO’s and each business segment’s ongoing performance. We believe that free cash flow is an important measure of our ability to repay maturing debt or fund other uses of capital that we believe will enhance stockholder value. We believe that EBITDA and adjusted EBITDA improve comparability from period to period by removing the impact of our capital structure (interest and financing expenses), asset base (depreciation and amortization), tax impacts and other adjustments as set out in the attached tables that management has determined are not reflective of normalized operating activities. We believe that adjusted net income attributable to common shareholders and adjusted EPS improve the comparability of our operating results from period to period by removing the impact of certain costs and gains that management has determined are not reflective of our core operating activities. We believe that adjusted operating income for our North American less-than-truckload business improves the comparability of our operating results from period to period by removing the impact of certain transaction, integration and rebranding costs and amortization and depreciation expenses incurred in the reporting period as set out in the attached tables. Other companies may calculate EBITDA and adjusted EBITDA differently, and therefore our measure may not be comparable to similarly titled measures of other companies. Free cash flow, EBITDA, adjusted EBITDA, adjusted net income attributable to common shareholders, adjusted EPS and adjusted operating income for our North American less-than-truckload business are not measures of financial performance or liquidity under GAAP and should not be considered in isolation or as an alternative to revenue, net income, operating income for our North American less-than-truckload business, cash flows provided (used) by operating activities and other measures determined in accordance with GAAP. Items excluded from EBITDA and adjusted EBITDA are significant and necessary components of the operations of our business, and, therefore, EBITDA and adjusted EBITDA should only be used as a supplemental measure of our operating performance. As required by SEC rules, we provide reconciliations of these historical measures to the most directly comparable measure under United States generally accepted accounting principles ("GAAP"), which are set forth in the financial tables attached to this document. With respect to our 2017 and 2018 financial targets of adjusted EBITDA and our 2017 and 2017-2018 cumulative targets for free cash flow, each of which is a non-GAAP measure, a reconciliation of the non-GAAP measure to the corresponding GAAP measure is not available without unreasonable effort due to the variability and complexity of the reconciling items described below that we exclude from the non-GAAP target measure. The variability of these items may have a significant impact on our future GAAP financial results and, as a result, we are unable to prepare the forward-looking balance sheet, statement of income and statement of cash flow, prepared in accordance with GAAP that would be required to produce such a reconciliation. Forward-looking Statements This document includes forward-looking statements within the meaning of Section 27A of the Securities Act of 1933, as amended, and Section 21E of the Securities Exchange Act of 1934, as amended, including our financial targets. All statements other than statements of historical fact are, or may be deemed to be, forward-looking statements. In some cases, forward-looking statements can be identified by the use of forward-looking terms such as "anticipate," "estimate," "believe," "continue," "could," "intend," "may," "plan," "potential," "predict," "should," "will," "expect," "objective," "projection," "forecast," "goal," "guidance," "outlook," "effort," "target," “trajectory” or the negative of these terms or other comparable terms. However, the absence of these words does not mean that the statements are not forward-looking. These forward-looking statements are based on certain assumptions and analyses made by us in light of our experience and our perception of historical trends, current conditions and expected future developments, as well as other factors we believe are appropriate in the circumstances. These forward-looking statements are subject to known and unknown risks, uncertainties and assumptions that may cause actual results, levels of activity, performance or achievements to be materially different from any future results, levels of activity, performance or achievements expressed or implied by such forward-looking statements. Factors that might cause or contribute to a material difference include the risks discussed in our filings with the SEC and the following: economic conditions generally; competition and pricing pressures; our ability to align our investments in capital assets, including equipment, service centers and warehouses, to our customers’ demands; our ability to successfully integrate and realize anticipated synergies, cost savings and profit improvement opportunities with respect to acquired companies; our ability to develop and implement suitable information technology systems and prevent failures in or breaches of such systems; our substantial indebtedness; our ability to raise debt and equity capital; our ability to maintain positive relationships with our network of third-party transportation providers; our ability to attract and retain qualified drivers; litigation, including litigation related to alleged misclassification of independent contractors; labor matters, including our ability to manage our subcontractors, and risks associated with labor disputes at our customers and efforts by labor organizations to organize our employees; risks associated with our self-insured claims; risks associated with defined benefit plans for our current and former employees; fluctuations in currency exchange rates; fluctuations in fixed and floating interest rates; our ability to execute our growth strategy through acquisitions; fuel price and fuel surcharge changes; issues related to our intellectual property rights; governmental regulation, including trade compliance laws; and governmental or political actions, including the United Kingdom's likely exit from the European Union. All forward-looking statements set forth in this document are qualified by these cautionary statements and there can be no assurance that the actual results or developments anticipated by us will be realized or, even if substantially realized, that they will have the expected consequences to or effects on us or our business or operations. Forward-looking statements set forth in this document speak only as of the date hereof, and we do not undertake any obligation to update forward-looking statements to reflect subsequent events or circumstances, changes in expectations or the occurrence of unanticipated events, except to the extent required by law.
2 Investor Presentation November 2017

Key Factors Driving High Growth and Returns
Solid organic revenue growth supported by numerous tailwinds
– Leadership positions in fast-growing areas of transportation and logistics
– $1 trillion addressable opportunity, of which we hold less than 1.5% market share
– Strong presence in high-growth e-commerce sector
Cutting-edge technology differentiates XPO
Numerous company-specific margin improvement initiatives
Low maintenance capex requirements
Organizational track record of creating value through M&A integrations
World-class operators who are laser-focused on driving results
3 Investor Presentation November 2017
Fortune 500 ranked XPO the fastest-growing transportation company Forbes named XPO the top-performing U.S. company on its Global 2000 list,
and one of America's best employers

63% of Revenue
§ Truckload, Brokerage and Expedite
§ Less-Than-Truckload
§ Last Mile
§ Intermodal and Drayage
§ Global Forwarding
LOGISTICS Warehousing with High-Value-Add Services
TRANSPORTATION Moving Freight Using Optimal Modes
37% of Revenue
§ E-Commerce and Omnichannel Fulfillment
§ Customized Warehousing and Distribution
§ Returns Management (Reverse Logistics)
§ Supply Chain Optimization
§ Managed Transportation
65% of Fortune 100 companies trust XPO with their business
4
Top 10 Global Provider of Supply Chain Services
We use our highly integrated network of people, technology and assets to help customers manage their goods more efficiently throughout their supply chains
Investor Presentation November 2017

By Country of Operation
By Customer Vertical
Global Scale with Well-Diversified Business Mix
Customers Over 50,000
Employees 91,000
Locations 1,444
Countries of Operation 32
Contract Logistics Facilities 166 million sq. feet (15.4 million sq. meters)
5
Key Metrics Gross Revenue Profile
United States (60%)
France (13%)
United Kingdom (12%)
Spain (4%)
Other (11%)
Retail / E-Commerce (26%) Food & Beverage (14%) Industrial / Manufacturing (10%) Automotive (9%) Consumer Goods (9%) Agriculture / Chemicals (7%) Logistics & Transportation (6%) Building Materials / Hardware (6%) Technology / Telecom (4%) Business / Professional Services (2%) Energy / Oil & Gas (2%) Aerospace / Defense (3%) Home Furnishings / Furniture (2%)
Investor Presentation November 2017
Note: Gross revenue profile reflects FY2016 total revenue, excluding North American truckload business divested in 2016

Optimal Network Mix Creates Value
Ground transportation assets: 16,000 owned tractors; 39,000 trailers; 10,000 53-ft. intermodal boxes; and 5,200 chassis
Non-asset transportation network: 11,000 trucks contracted via independent owner-operators; and more than 1 million brokered trucks
Facility assets: 440 cross-docks; and 767 contract logistics facilities
Investor Presentation November 2017 6
Note: Revenue mix for FY 2016, excluding divested North American truckload unit
Attractive Revenue Mix
Asset-Light (68%)
Asset-Based (32%)
Global network with optimal mix of non-asset and asset capabilities enhances customer service while generating high returns for shareholders

Investor Presentation November 2017 7
XPO Leads the Industry in Rapid Technology Development
► Leading-edge software driven by $425 million of annual technology spend
► Global technology team of over 1,600 professionals, including over 100 data scientists
► Cloud-based platform supports agile product development
► XPO’s ongoing innovations include:
– Advanced robotics and automation
– Predictive analytics using big data and advanced algorithms
– Proprietary Freight Optimizer for truck brokerage and intermodal systems
– Drones for inventory management
– Patented last mile applications for real-time delivery performance management
Our proprietary technology is a major reason why customers trust us each day with 160,000 ground shipments and more than 7 billion inventory units

Highly Skilled Management Team
Investor Presentation November 2017 8
Partial list, in alphabetical order
Bradley Jacobs Chief Executive Officer United Rentals, United Waste
Josephine Berisha Senior Vice President–Global Compensation and Benefits Morgan Stanley
Tony Brooks President–Less-Than-Truckload Sysco, Dean Foods, Frito-Lay, Roadway
Richard Cawston Managing Director–Supply Chain, Europe Asda, Norbert Dentressangle
Ashfaque Chowdhury President–Supply Chain, Americas and Asia Pacific New Breed
Troy Cooper Chief Operating Officer United Rentals, United Waste
Bill Fraine Chief Operating Officer–Supply Chain, Americas and Asia Pacific New Breed, FedEx
Luis Angel Gómez Managing Director–Transport, Europe Norbert Dentressangle
John Hardig Chief Financial Officer Stifel Nicolaus, Alex. Brown
Mario Harik Chief Information Officer Oakleaf Waste Management
Christophe Haviland Senior Vice President–Transport Sales, Europe DHL, American Express, Staples
Meghan Henson Chief Human Resources Officer Chubb Group, PepsiCo

Highly Skilled Management Team (Cont’d)
Investor Presentation November 2017 9
Charles Hitt President–Last Mile 3PD, Affinity Logistics, GeoLogistics
Russell Hoch Senior Vice President–Strategic Account Management Cisco, Lucent Technologies, AT&T
Erin Kurtz Senior Vice President–Communications Thomson Reuters, AOL
Scott Malat Chief Strategy Officer Goldman Sachs, UBS, JPMorgan Chase
John Mitchell Chief Information Officer–Supply Chain, Americas and Asia Pacific New Breed, Pep Boys, Lowe’s
Will O’Shea Senior Vice President–Sales Solutions, Last Mile 3PD, Ryder, Cardinal Logistics
Greg Ritter Chief Customer Officer Knight Transportation, C.H. Robinson
Sanjib Sahoo Chief Information Officer–Transport, North America tradeMONSTER
Christopher Synek President–Transportation, North America Republic Services, Cintas
Monica Thurman Chief Compliance Officer Halliburton, U.S. Department of Labor
Mark Wilkinson Senior Vice President–Supply Chain Sales, Europe DHL
Malcolm Wilson Chief Executive Officer–XPO Logistics Europe Norbert Dentressangle, NYK Logistics
Partial list, in alphabetical order
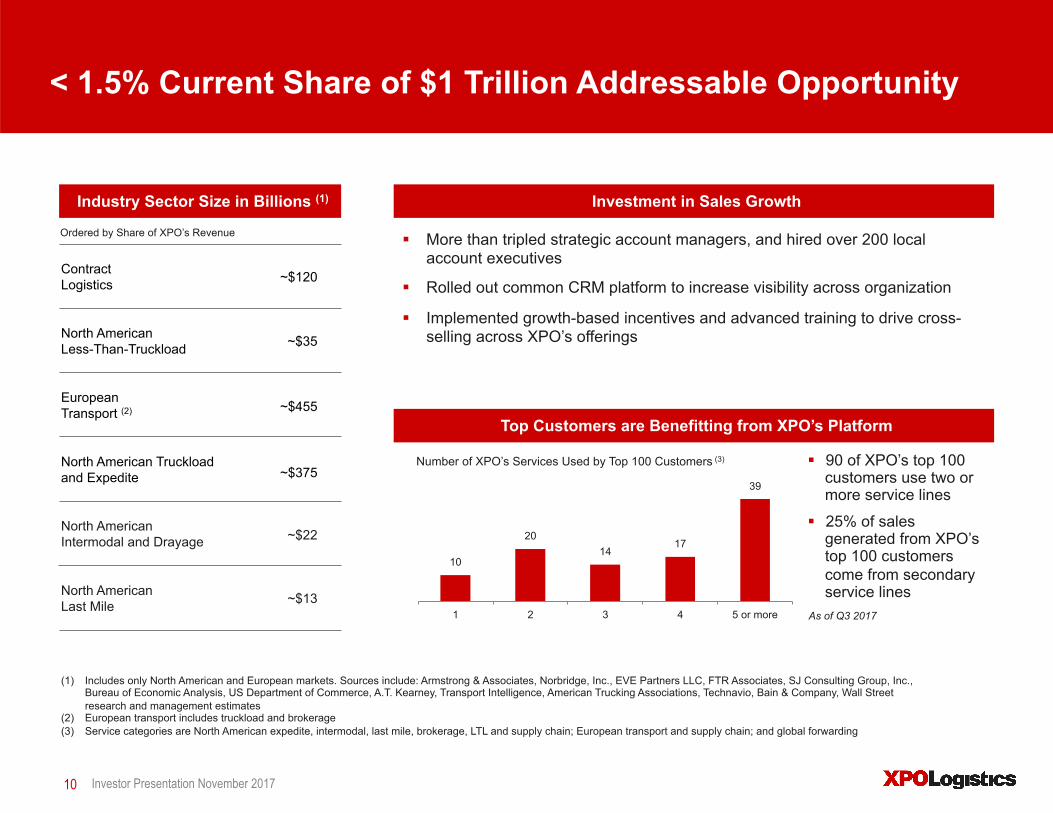
< 1.5% Current Share of $1 Trillion Addressable Opportunity
Investor Presentation November 2017 10
Investment in Sales Growth
§ More than tripled strategic account managers, and hired over 200 local account executives
§ Rolled out common CRM platform to increase visibility across organization
§ Implemented growth-based incentives and advanced training to drive cross-selling across XPO’s offerings
Industry Sector Size in Billions (1)
(1) Includes only North American and European markets. Sources include: Armstrong & Associates, Norbridge, Inc., EVE Partners LLC, FTR Associates, SJ Consulting Group, Inc., Bureau of Economic Analysis, US Department of Commerce, A.T. Kearney, Transport Intelligence, American Trucking Associations, Technavio, Bain & Company, Wall Street research and management estimates
(2) European transport includes truckload and brokerage (3) Service categories are North American expedite, intermodal, last mile, brokerage, LTL and supply chain; European transport and supply chain; and global forwarding
Contract Logistics ~$120
North American Less-Than-Truckload ~$35
European Transport (2) ~$455
North American Truckload and Expedite ~$375
North American Intermodal and Drayage ~$22
North American Last Mile ~$13
Ordered by Share of XPO’s Revenue
Top Customers are Benefitting from XPO’s Platform
Number of XPO’s Services Used by Top 100 Customers (3) § 90 of XPO’s top 100 customers use two or more service lines
§ 25% of sales generated from XPO’s top 100 customers come from secondary service lines
As of Q3 2017
10
20 14
17
39
1 2 3 4 5 or more

Leading Positions in Fast-Growing Industry Sectors
Investor Presentation November 2017 11
(1) Revenue mix for FY 2016, excludes North American truckload business divested in 2016 (2) Sources: Armstrong & Associates, Norbridge, Inc., EVE Partners LLC, FTR Associates, SJ Consulting Group, Inc., Bureau of Economic Analysis, US Department of
Commerce, A.T. Kearney, Transport Intelligence, American Trucking Associations, Technavio, Wall Street Research and management estimates
As Percent of XPO’s Gross Revenue (1)
Projected Industry Growth Rate X GDP (2)
§ Second largest provider of contract logistics globally § Largest outsourced e-fulfillment provider in Europe
Contract Logistics 37% 2 – 3x
§ Second largest LTL provider in North America § More same-day and next-day lanes than any other provider
North American Less-Than-Truckload 24% 1 – 1.5x
§ Second largest freight brokerage firm globally § Largest manager of expedited shipments in North America, with largest
web-based auction TMS for expedite
Truck Brokerage, Expedite, Forwarding 10% 2 – 4x
§ Third largest intermodal provider in North America and a drayage leader § A leader in cross-border Mexico freight movements by rail
Intermodal and Drayage 6% 3 – 5x
§ Largest last mile logistics provider for heavy goods in North America § Expanding U.S. network hubs to 55 in 2017 and a targeted 85 in 2018
Last Mile Logistics 6% 5 – 6x
§ Largest provider of truck brokerage and largest owned fleet in Europe § Leading provider of LTL in Western Europe
European Transport 17% 1 – 1.5x

Investor Presentation November 2017 12
Global Player in High-Growth E-Commerce Sector
► Largest e-fulfillment provider in Europe and a leading provider in North America
► Omnichannel and reverse logistics / returns management leader in North America
► Customers include many of the largest e-tailers and retailers
► Last mile business propelled by e-commerce tailwinds
– Rolling out service in the UK, Ireland and the Netherlands
– Grew third quarter 2017 revenue by 14% year-over-year
► Cutting-edge technology propels leadership position
– Proprietary technology enables best-in-class customer experience
– Demand forecasting optimizes fulfillment and returns
– Automated e-commerce sortation facilities

Steady Margin Improvement 2016–2018E
Investor Presentation November 2017 13
Note: Excludes impact of North American truckload unit: 2016 revenue of $431.9 million and adjusted EBITDA of $80.1 million, see Supplemental Materials for reconciliation
Steady Margin Improvement 2016–2018E
Investor Presentation December 201713
$1,168
At least $1,365
At least $1,600
~8.2%
~9.0%
~10.0%
6%
7%
8%
9%
10%
11%
600
800
1,000
1,200
1,400
1,600
1,800
2016 2017E 2018E
Adj EBITDA EBITDA Margin
Adjusted EBITDA and EBITDA Margin %
Note: Excludes impact of North American truckload unit: 2016 revenue of $431.9 million and adjusted EBITDA of $80.1 million, see Supplemental Materials for reconciliation
$ in millions

Clear Path to 10% Adjusted EBITDA Margin
Investor Presentation November 2017 14
Focused on $13 billion of spend across purchased services, shared services, technology infrastructure, labor and real estate
Opportunities for improvement include:
– Centralized procurement across global organization
– Price optimization initiatives
– Optimization of shared services such as HR, IT and finance
– Better management of overtime and temporary labor through workforce planning
– Cross-fertilization of best practices in warehouse operations and cross-dock facilities
– Route optimization in transport for pick-ups and deliveries
– Increase line-haul trailer utilization

15
Creating Dramatic Shareholder Value through M&A
► Disciplined process to find acquisitions that are strategically and financially compelling
– Primary focus on North America and Europe in existing or complementary lines of business
– Sensible valuation and terms
► Potential opportunities to improve the profitability of acquired businesses through:
– Operational efficiencies through cost-out initiatives and best practices
– Cross-selling with existing businesses and customers
– Optimizing headcount and organizational structure
– Economies of scale, including global procurement
– Better utilization of labor and capacity through technology
– Instilling a culture of employee engagement and accountability
Investor Presentation November 2017
Investor Presentation November 2017 16
Strong Track Record of Executing Acquisitions
► October 2015 acquisition of Con-way
– Grew adjusted operating income in LTL by 86% from FY 2015 to TTM Sept. 30, 2017
– Realized approximately $190 million of cost improvements to date through global procurement and operational efficiencies, with more to come
– Launched cross-selling with growth-based incentives and advanced training
– Instilled a culture of accountability by focusing employees on results that matter
► June 2015 acquisition of Norbert Dentressangle
– Achieved record revenue and profits in both transport and logistics post-acquisition
– Closed $672 million of European sales for the nine months ended Sept. 30, 2017, up 41% versus the same period in 2016
– Transformed sales organization to collaborate on strategic opportunities across countries and integrated service lines
– Improved margins by cross-fertilizing best practices and addressing loss makers

Key Lines of Business

Contract Logistics Long-Term Recurring Revenue
Investor Presentation November 2017 18
Asset-light business characterized by long-term contractual relationships, low cyclicality and a high-value-add component that minimizes commoditization
Deep expertise in high-growth sectors that trend toward outsourcing: retail, e-commerce, industrial, high tech, aerospace, telecom, food and beverage, healthcare and agriculture
Largest provider of outsourced e-fulfillment in Europe
Advanced warehouse robotics and automation
Low capex requirements as a percentage of revenue lead to strong free cash flow conversion and ROIC
Five-year average contract tenure with a historical renewal rate of over 95%
Global sales pipeline of about $1.7 billion
Global Footprint

Truck Brokerage Broad Cross-Selling Opportunity
Investor Presentation November 2017 19
Non-asset business that places shippers’ freight with qualified carriers through brokers that match capacity with shipper demand
High free cash flow conversion and minimal capex
Fragmented market with opportunity to expand
Outsourcing trends drive industry growth
Continuously improving productivity through technology and the tenure of the sales force
Pricing accuracy enabled by XPO’s proprietary algorithms
Variable cost model performs well through cycles
Global Footprint

Last Mile Demand Propelled by E-Commerce and Omnichannel
Investor Presentation November 2017 20
Asset-light business that arranges the final stage of heavy goods delivery from distribution centers or retail stores to end consumers’ home or business
Customers include nearly all of the top 30 big-box retailers and e-tailers in the U.S.
Facilitated over 13 million deliveries TTM
Best-in-class proprietary customer experience technology for deliveries and in-home installations
Integrated with contract logistics and LTL networks to create powerful value proposition for retail and e-commerce customers
Rolling out last mile service in the UK, Ireland and the Netherlands
Grew third quarter 2017 revenue by 14% year-over-year, propelled by e-commerce
Global Footprint

North American Less-Than-Truckload Major Success Story
Investor Presentation November 2017 21
Asset-based business utilizing employee drivers, a fleet of tractors and trailers for line-haul, pick-up and delivery of pallets, and a network of terminals
Second largest LTL carrier, covering 99% of all U.S. zip codes
Laser focused on on-time, damage-free performance
One of the industry’s most modern fleets delivering nearly 20 billion pounds of freight a year
Nearly doubled adjusted operating income from $233 million in 2015 to $433 million in the trailing 12 months through September 2017
North American Footprint

Intermodal and Drayage Long-term Sales Potential for Truck-to-Rail Conversion
Investor Presentation November 2017 22
Asset-light business that arranges the long-haul portion of containerized freight, including rail brokerage, local drayage and on-site operational services
Third largest intermodal provider
10,000 53-ft. intermodal boxes and 5,200 chassis
Leading U.S. drayage capacity of 2,300 independent owner-operators, with access to over 25,000 additional drayage trucks
Proprietary Rail Optimizer IT is a competitive advantage: enables constant communication with railroads for door-to-door movements of long-haul freight with high visibility
Increasing customer satisfaction by achieving best-ever on-time performance
North American Footprint
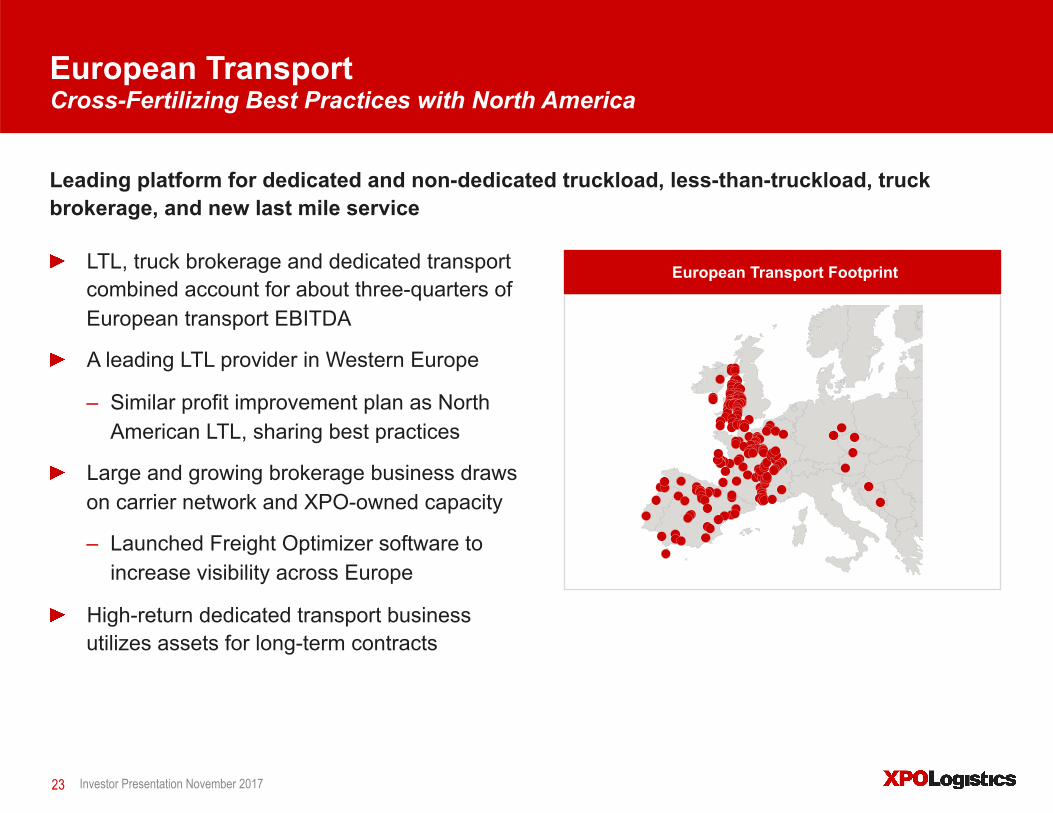
European Transport Cross-Fertilizing Best Practices with North America
Investor Presentation November 2017 23
Leading platform for dedicated and non-dedicated truckload, less-than-truckload, truck brokerage, and new last mile service
LTL, truck brokerage and dedicated transport combined account for about three-quarters of European transport EBITDA
A leading LTL provider in Western Europe
– Similar profit improvement plan as North American LTL, sharing best practices
Large and growing brokerage business draws on carrier network and XPO-owned capacity
– Launched Freight Optimizer software to increase visibility across Europe
High-return dedicated transport business utilizes assets for long-term contracts
European Transport Footprint

Global Forwarding Integrated Global Network
Investor Presentation November 2017 24
Non-asset logistics solution for domestic, cross-border and international shipments, including customs brokerage
Freight forwarding is a $150 billion industry, of which XPO has less than a 1% share
157,000 TEUs and 58,000 tons of freight moved for customers annually
Leverages ground, air and ocean carrier relationships to provide differentiated service
Operates a subsidiary as a non-vessel operating common carrier (“NVOCC”)
Opportunity to grow market share through network of dedicated offices on four continents
Global Footprint

Financial Performance

Investor Presentation November 2017 26
Industry-Leading Growth in Revenue and EBITDA
Revenue
2,357
7,533
14,188
0
4,000
8,000
12,000
16,000
2014 2015 2016
Adjusted EBITDA
81
474
1,168
0
250
500
750
1,000
1,250
2014 2015 2016
$ in millions $ in millions
Note: Excludes impact of North American truckload unit: 2016 revenue of $431.9 million and adjusted EBITDA of $80.1 million; and 2015 revenue of $90.2 million and adjusted EBITDA of $18.8 million

1,365
430-455
910-935
0
500
1,000
1,500
Flexible Asset / Non-Asset Business Mix
Investor Presentation November 2017 27
Enhances customer service and financial returns
%
~3.0
1.3
7.1 7.3
11.4
14.4
0
4
8
12
16
XPO Brokers Parcel LTL TL Rail
Low Net Capex as a % of Revenue vs. Competitor Groups
Note: Brokers include CH Robinson, Echo Global Logistics and Expeditors International; Parcel includes FedEx and UPS; LTL includes Old Dominion Freight Line, YRC Worldwide, ArcBest and Saia; TL includes Swift Transportation, Werner Enterprises, Knight Transportation and Heartland Express; Rail includes CSX Rail Corp, Norfolk Southern, Union Pacific, Kansas City Southern, Canadian Pacific Railway and Canadian National Railway Company
2017 Targets
Adjusted EBITDA Net Capex Adjusted EBITDA Minus Capex
$ in millions

$625 million of cash flow from operations in 2016
$211 million of free cash flow in 2016
Targeting $350 million of free cash flow in 2017
Targeting $900 million of cumulative free cash flow in 2017-2018 through:
– EBITDA growth
– Lower interest expense
– Lower transaction, integration and rebranding costs
Annual net capex spend likely in $430 million to $455 million range
Investor Presentation November 2017 28
Accelerating Free Cash Flow Generation
Note: See Supplemental Materials for reconciliation of free cash flow to cash flow from operations

Third Quarter 2017 Highlights
Investor Presentation November 2017 29
$3.89 billion of revenue
$57.5 million of net income; $0.44 per diluted share
$369.6 million of adjusted EBITDA
$76.7 million of adjusted net income
$293.7 million of cash flow from operations
$183.2 million of free cash flow
Generated the highest revenue, net income and cash flow of any quarter in XPO’s history, and delivered record third quarter adjusted EBITDA
Note: Net income is attributable to common shareholders; net capex is defined as payment for purchases of property and equipment less proceeds from sale of assets

Guidance
Investor Presentation November 2017 30
Financial targets reaffirmed November 1, 2017
2017: adjusted EBITDA of at least $1.365 billion
2018: adjusted EBITDA of at least $1.6 billion
2017–2018: cumulative free cash flow target of approximately $900 million
– Includes at least $350 million of free cash flow generated in 2017

Results Matter: Proven Credentials for Value Creation
Investor Presentation November 2017 31
Leading global positions in the fastest-growing areas of transportation and logistics
Differentiated, end-to-end range of supply chain services
Accelerating top-line growth
Approximately 26% of revenue comes from retail and e-commerce
Robust free cash flow growth
Industry-leading commitment to technology innovation
Highly integrated organization with culture of accountability
Management team laser-focused on creating shareholder value
Upside from future acquisitions

Supplemental Materials

A Strong and Global Commitment to Sustainability
Investor Presentation November 2017 33
Owns one of the most modern and environmental-friendly fleets in Europe
– 97% compliant with Euro V, EEV and Euro VI standards, with average truck age of 2.5 years
Owns the largest natural gas truck fleet in Europe
– Introduced the first LNG-powered tractors in Europe in 2015
– Will lower the carbon footprint of trucking in Paris by using natural gas trucks for the road transport portion of France's first intermodal urban rail shuttle
Launched government-approved mega-trucks in Spain, expected to reduce CO2 emissions by over 25%
Honored for excellence in environmental improvement by SmartWay®
Named a Top 75 Green Supply Chain Partner by Inbound Logistics

XPO Is a Leader in Sustainability (Cont’d)
Investor Presentation November 2017 34
Awarded the label “Objectif CO2” for outstanding environmental performance of transport operations in Europe by the French Ministry of the Environment and the French Environment and Energy Agency
Large capex investment in 2017 in fuel-efficient Freightliner Cascadia tractors in North America (EPA 2013-compliant and GHG14-compliant SCR technology), and Euro 6-compliant tractors in Europe
ISO14001-certified logistics facilities ensure environmental compliance
Fuel emissions from forklifts monitored in supply chain sites, and systems in place to take immediate corrective action if needed
Reverse logistics operations in supply chain sites recycle millions of electronic components and batteries each year
Energy efficiency evaluations performed on all warehouses prior to selecting sites to lease, and energy efficient equipment purchased when feasible

XPO Is a Leader in Sustainability (Cont’d)
Investor Presentation November 2017 35
Packaging engineers ensure that the optimal carton size is used for each product slated for distribution
Recycled packaging purchased when feasible
Reusable kitting tools utilized for the installation of parts in customer operations, manufactured by XPO
Measures instilled in daily operations to reduce paper, such as electronic waybills and documentation, and waste mitigation policies
Drivers trained in responsible eco-driving and fuel usage reduction techniques
Experimenting with diesel alternatives such as diesel-electric hybrids
Reports annually on European compliance with the United Nations Global Compact
We are committed to operating our business in a way that demonstrates a high regard for the environment and all our stakeholders

Business Glossary
Investor Presentation November 2017 36
Contract Logistics: An asset-light, technology-enabled business characterized by long-term contractual relationships with high renewal rates, low cyclicality and a high-value-add component that minimizes commoditization. Contracts are typically structured as either fixed-variable, cost-plus or gain-share. XPO services include highly engineered solutions, e-fulfillment, reverse logistics, packaging, factory support, aftermarket support, warehousing and distribution for customers in aerospace, manufacturing, retail, life sciences, chemicals, food and beverage, and cold chain.
Expedite: A non-asset business that facilitates time-critical, high-value or high-security shipments, usually on very short notice. Revenue is either contractual or transactional, primarily driven by unforeseen supply chain disruptions or just-in-time inventory demand for raw materials, parts or goods. XPO provides three types of expedite service: ground transportation via a network of independent contract carriers; air charter transportation facilitated by proprietary, web-based technology that solicits bids and assigns loads to aircraft; and a managed transportation network that is the largest web-based expedite management technology in North America.
Freight Brokerage: A variable cost business that facilitates the trucking of freight by procuring carriers through the use of proprietary technology. Freight brokerage net revenue is the spread between the price to the shipper and the cost of purchased transportation. In North America, XPO has a non-asset freight brokerage business, with a network of 38,000 independent carriers. In Europe, XPO generates over €1 billion in freight brokerage revenue annually, with capacity provided by an asset-light mix of owned fleet and independent carriers.
Global Forwarding: A non-asset business that facilitates freight shipments by ground, air and ocean. Shipments may have origins and destinations within North America, to or from North America, or between foreign locations. Services are provided through a network of market experts who provide local oversight in thousands of key trade areas worldwide. XPO’s global forwarding service can arrange shipments with no restrictions as to size, weight or mode, and is OTI and NVOCC licensed.

Business Glossary (Cont’d)
Intermodal: An asset-light business that facilitates the movement of long-haul, containerized freight by rail, often with a drayage (trucking) component at either end. Intermodal is a variable cost business, with revenue generated by a mix of contractual and spot market transactions. Net revenue equates to the spread between the price to the shipper and the cost of purchasing rail and truck transportation. Two factors are driving growth in intermodal in North America: rail transportation is less expensive and more fuel efficient per mile than long-haul trucking, and rail is a key mode of transportation in and out of Mexico, where the manufacturing base is booming due to a trend toward near-shoring.
Last Mile: A non-asset business that facilitates the delivery of goods to their final destination, most often to consumer households. XPO specializes in two areas of last mile service: arranging the delivery and installation of heavy goods such as appliances, furniture and electronics, often with a white glove component; and providing logistics solutions to retailers and distributors to support their e-commerce supply chains and omni-channel distribution strategies. Capacity is sourced from a network of independent contract carriers and technicians.
Less-Than-Truckload (LTL): The transportation of a quantity of freight that is larger than a parcel, but too small to require an entire truck, and is often shipped on a pallet. LTL shipments are priced according to the weight of the freight, its commodity class (which is generally determined by its cube/weight ratio and the description of the product), and mileage within designated lanes. An LTL carrier typically operates a hub-and-spoke network that allows for the consolidation of multiple shipments for different customers in single trucks.
Managed Transportation: A service provided to shippers who want to outsource some or all of their transportation modes, together with associated activities. This can include freight handling such as consolidation and deconsolidation, labor planning, inbound and outbound shipment facilitation, documentation and customs management, claims processing, and 3PL supplier management, among other things.
Truckload: The ground transportation of cargo provided by a single shipper in an amount that requires the full limit of the trailer, either by dimension or weight. Cargo typically remains on a single vehicle from the point of origin to the destination, and is not handled en route. See Freight Brokerage on the prior page for additional details.
Investor Presentation November 2017 37

Financial Reconciliations
The following table reconciles XPO’s net income (loss) attributable to common shareholders for the periods ended September 30, 2017 and 2016 to adjusted EBITDA for the same periods.
Refer to the “Non-GAAP Financial Measures” section on page 2 of this document. Adjusted EBITDA was prepared assuming 100% ownership of XPO Logistics Europe.
38 Investor Presentation November 2017
[1] The sum of quarterly net income attributable to common shareholders and distributed and undistributed net income may not equal year-to-date amounts due to the impact of the two-class method of calculating earnings per share.
Change % Change %
Net income attributable to common shareholders[1] $ 57.5 $ 13.8 $ 43.7 -316.7% $ 124.5 $ 35.8 $ 88.7 247.8%Distributed and undistributed net income [1] (5.0) (1.3) (3.7) 284.6% (11.2) (3.4) (7.8) 229.4%Noncontrolling interests (8.5) (6.2) (2.3) 37.1% (17.4) (13.2) (4.2) 31.8%Net income 71.0 21.3 49.7 -233.3% 153.1 52.4 100.7 192.2%Loss on conversion of convertible senior notes 0.1 - 0.1 n/a 0.5 0.2 0.3 150.0%Loss on debt extinguishment 4.6 53.2 (48.6) -91.4% 13.6 53.2 (39.6) -74.4%Other interest expense 72.4 93.0 (20.6) -22.2% 221.9 280.6 (58.7) -20.9%Income tax provision 30.4 2.7 27.7 1025.9% 48.4 20.0 28.4 142.0%Depreciation & amortization expense 167.3 161.8 5.5 3.4% 489.1 485.4 3.7 0.8%Unrealized loss (gain) on foreign currency option and forward contracts 9.6 0.9 8.7 966.7% 48.7 (3.0) 51.7 -1723.3%EBITDA $ 355.4 $ 332.9 22.5 6.8% $ 975.3 $ 888.8 86.5 9.7%Transaction & integration costs 13.4 13.8 (0.4) -2.9% 37.3 55.6 (18.3) -32.9%Rebranding costs 0.8 6.0 (5.2) -86.7% 17.8 12.7 5.1 40.2%Adjusted EBITDA $ 369.6 $ 352.7 $ 16.9 4.8% $ 1,030.4 $ 957.1 $ 73.3 7.7%
$ Variance
Reconciliation of Non-GAAP MeasuresXPO Logistics, Inc.
Consolidated Reconciliation of Net Income to Adjusted EBITDA(Unaudited)(In millions)
Nine Months Ended September 30,2017 20162017 2016
Three Months Ended September 30,$ Variance

Financial Reconciliations (Cont’d)
39 Investor Presentation November 2017
The table reconciles XPO’s GAAP net income attributable to common shareholders for the periods ended September 30, 2017 and 2016 to adjusted net income attributable to common shareholders for the same periods.
Refer to the “Non-GAAP Financial Measures” section on page 2 of this document.
GAAP net income attributable to common shareholders $ 57.5 $ 13.8 $ 124.5 $ 35.8 Loss on conversion of convertible senior notes [1] 0.1 - 0.5 0.2 Loss on debt extinguishment [1] 4.6 53.2 13.6 53.2 Unrealized loss (gain) on foreign currency option and forward contracts[1] 9.6 0.9 48.7 (3.0) Depreciation & amortization from updated purchase price allocation of acquired assets [1] - - - (5.8) Transaction & integration costs [1] 13.4 13.8 37.3 55.6 Rebranding costs [1] 0.8 6.0 17.8 12.7 Income tax associated with the adjustments above [1] (7.1) (28.1) (39.4) (42.2) Acquisition-related tax benefit - (6.1) - (6.1) Discrete and other tax-related adjustments [2] - - (5.8) - Impact of noncontrolling interests on above adjustments (0.5) (0.3) (2.0) (2.4) Allocation of undistributed earnings (1.7) (3.4) (5.9) (5.4)
Adjusted net income attributable to common shareholders $ 76.7 $ 49.8 $ 189.3 $ 92.6
Adjusted basic earnings per share $ 0.65 $ 0.45 $ 1.67 $ 0.84 Adjusted diluted earnings per share $ 0.59 $ 0.41 $ 1.50 $ 0.76
Weighted-average common shares outstanding Basic weighted-average common shares outstanding 117.5 110.3 113.5 110.0 Diluted weighted-average common shares outstanding 129.8 122.9 126.2 122.3
Benefit/(expense)Loss on conversion of convertible senior notes $ - $ - $ 0.1 $ 0.1 Loss on debt extinguishment 1.3 20.5 4.6 20.5 Unrealized loss (gain) on foreign currency option and forward contracts 2.2 0.4 16.3 (1.1) Depreciation & amortization from updated purchase price allocation of acquired assets - - - (2.2) Transaction & integration costs 3.9 4.9 12.5 20.2 Rebranding costs (0.3) 2.3 5.9 4.7
$ 7.1 $ 28.1 $ 39.4 $ 42.2
2017 2016 2017 2016
Reconciliation of Non-GAAP MeasuresXPO Logistics, Inc.
Consolidated Reconciliation of GAAP Net Income and Net Income Per Share to Adjusted Net Income and Adjusted Net Income Per Share
(Unaudited)(In millions, except per share data)
Three Months Ended Nine Months EndedSeptember 30, September 30,
[1] This line item reflects the aggregate tax effect of all non-tax related adjustments reflected in the table above. The detail by line item is as follows:
[2] Adjustments consist of $2.5 million release of reserves related to uncertain tax positions and $3.3 million release of a valuation allowance related to state tax matters for the nine months ended September 30, 2017.
The Company has evaluated the guidance in accordance with Compliance and Disclosure Interpretations (C&DI) of the U.S. Securities and Exchange Commission table to calculate the non-GAAP Adjusted Net Income (Loss) and Adjusted Net Income (Loss) Per Share. The table above includes the U.S. GAAP financial statement items that have been reconciled to arrive at Adjusted Net Income (Loss) and Adjusted Net Income (Loss) per share. The adjusted performance metrics are based on the GAAP annual effective rate, excluding discrete items. A corresponding noncontrolling interest has been calculated for those reconciling items reported within the acquired Norbert Dentressangle SA legal entities.
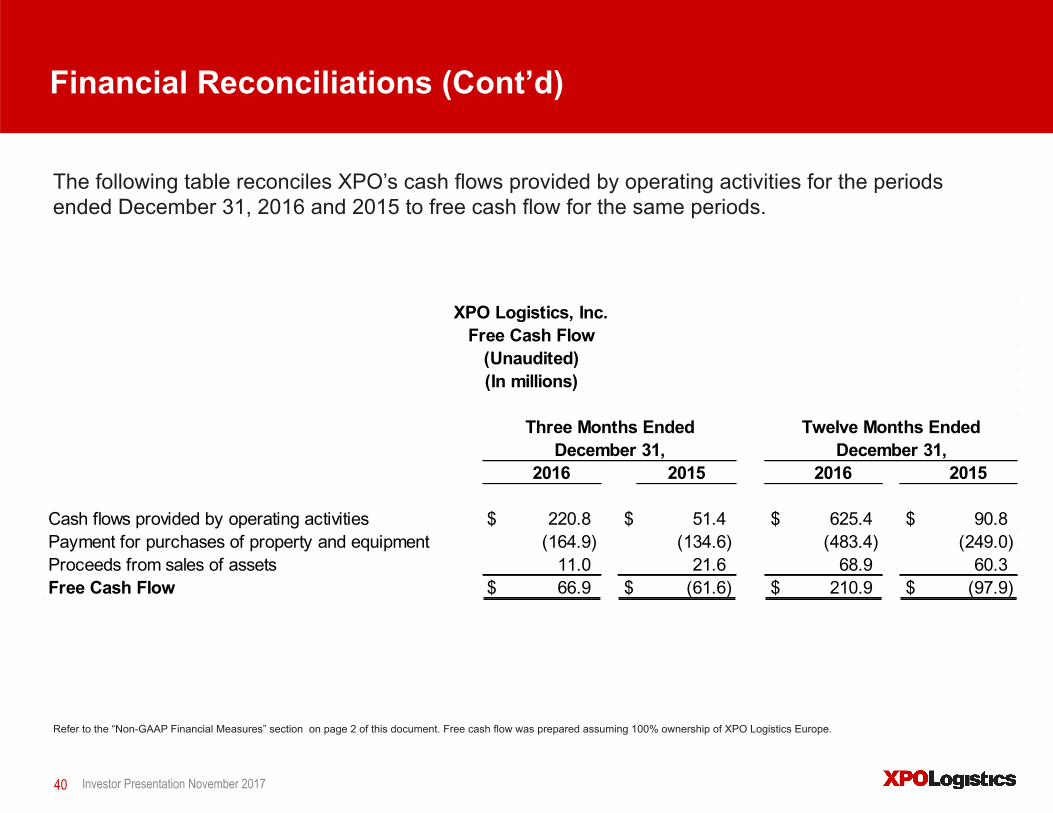
Financial Reconciliations (Cont’d)
Refer to the “Non-GAAP Financial Measures” section on page 2 of this document. Free cash flow was prepared assuming 100% ownership of XPO Logistics Europe.
40
The following table reconciles XPO’s cash flows provided by operating activities for the periods ended December 31, 2016 and 2015 to free cash flow for the same periods.
Investor Presentation November 2017
2016 2015 2016 2015
Cash flows provided by operating activities $ 220.8 $ 51.4 $ 625.4 $ 90.8Payment for purchases of property and equipment (164.9) (134.6) (483.4) (249.0)Proceeds from sales of assets 11.0 21.6 68.9 60.3Free Cash Flow $ 66.9 $ (61.6) $ 210.9 $ (97.9)
December 31, December 31,Twelve Months EndedThree Months Ended
XPO Logistics, Inc.
(Unaudited)(In millions)
Free Cash Flow

Financial Reconciliations (Cont’d)
41
The following table reconciles XPO’s cash flows provided by operating activities for the periods ended September 30, 2017 and 2016 to free cash flow for the same periods.
Investor Presentation November 2017
Refer to the “Non-GAAP Financial Measures” section on page 2 of this document. Free cash flow was prepared assuming 100% ownership of XPO Logistics Europe.
2017 2016 2017 2016
Cash flows provided by operating activities $ 293.7 $ 137.0 $ 524.7 $ 404.6Payment for purchases of property and equipment (127.9) (94.5) (389.9) (318.5)Proceeds from sales of assets 17.4 22.3 59.6 57.9Free Cash Flow $ 183.2 $ 64.8 $ 194.4 $ 144.0
September 30, September 30,Nine Months EndedThree Months Ended
XPO Logistics, Inc.
(Unaudited)(In millions)
Free Cash Flow

Financial Reconciliations (Cont’d)
42 Investor Presentation November 2017
The following table reconciles XPO’s revenue attributable to its North American less-than-truckload business for the periods ended September 30, 2017 and 2016 to adjusted operating ratio for the same periods.
Refer to the “Non-GAAP Financial Measures” section on page 2 of this document.
Change % Change %
Revenue (excluding fuel surcharge revenue) $ 800.9 $ 775.2 $ 25.7 3.3% $ 2,384.9 $ 2,285.8 $ 99.1 4.3%Fuel surcharge revenue 115.2 98.3 16.9 17.2% 334.5 274.2 60.3 22.0%Revenue 916.1 873.5 42.6 4.9% 2,719.4 2,560.0 159.4 6.2%Salaries, wages and employee benefits 426.1 426.1 0.0 0.0% 1,266.1 1,249.9 16.2 1.3%Purchased transportation 114.0 110.9 3.1 2.8% 330.0 332.0 (2.0) -0.6%Fuel and fuel-related taxes 56.7 49.7 7.0 14.1% 170.0 139.4 30.6 22.0%Depreciation and amortization 59.6 49.5 10.1 20.4% 176.9 147.9 29.0 19.6%Other operating expenses 118.5 104.0 14.5 13.9% 342.4 317.9 24.5 7.7%Maintenance 25.8 25.6 0.2 0.8% 82.4 72.1 10.3 14.3%Rents and leases 10.4 9.8 0.60 6.1% 31.5 30.6 0.9 2.9%Purchased labor 3.8 2.4 1.4 58.3% 9.9 6.7 3.2 47.8%Operating income 101.2 95.5 5.7 6.0% 310.2 263.5 46.7 17.7%Operating ratio 89.0% 89.1% 88.6% 89.7%Transaction, integration and rebranding costs 4.2 5.8 (1.6) -27.6% 18.1 9.1 9.0 98.9%Amortization expense 8.4 9.0 (0.6) -6.7% 25.3 23.7 1.6 6.8%Depreciation adjustment from updated purchase price allocation of acquired assets - - - 0.0% - (1.8) 1.8 -100.0%Adjusted operating income $ 113.8 $ 110.3 $ 3.5 3.2% $ 353.6 $ 294.5 $ 59.1 20.1%Adjusted operating ratio 87.6% 87.4% 87.0% 88.5%
XPO Logistics North American Less-Than-TruckloadAdjusted Operating Ratio
(Unaudited)
20162017 2017 2016$ Variance
(In millions)
Three Months Ended September 30,$ Variance
Nine Months Ended September 30,

Financial Reconciliations (Cont’d)
43 Investor Presentation November 2017
The following table reconciles XPO’s operating income attributable to its North American less-than-truckload business for the trailing twelve months ended September 30, 2017 to adjusted operating income for the same period.
Refer to the “Non-GAAP Financial Measures” section on page 2 of this document.
Operating income $ 202.4 $ 54.7 $ 310.2 $ 364.9 Transaction, integration and rebranding costs 20.4 25.2 18.1 43.3 Amortization expense 10.0 - 25.3 25.3 Adjusted operating income $ 232.8 $ 79.9 $ 353.6 $ 433.5
XPO Logistics North American Less-Than-TruckloadReconciliation of Adjusted Operating Income
(Unaudited)(In millions)
Three Months Ended Nine Months EndedYear EndedDecember 31, 2015
Trailing Twelve Months EndedSeptember 30, 2017December 31, 2016 September 30, 2017

Financial Reconciliations (Cont’d)
44 Investor Presentation November 2017
The following table reconciles XPO’s net income (loss) attributable to common shareholders for the periods ended December 31, 2016, 2015, and 2014, to adjusted EBITDA excluding the North American truckload business divested in 2016.
Refer to the “Non-GAAP Financial Measures” section on page 2 of this document Adjusted EBITDA was prepared assuming 100% ownership of XPO Logistics Europe
Net income (loss) attributable to common shareholders $ 63.1 $ (245.9) $ (107.4) Preferred stock beneficial conversion charge - (52.0) (40.9) Distributed and undistributed net income (5.9) (2.8) (2.9) Noncontrolling interests (15.5) 0.5 - Net income (loss) 84.5 (191.6) (63.6) Debt commitment fees - 19.7 14.4 Loss on conversion of convertible senior notes 0.2 10.0 5.5 Loss on debt extinguishment 69.7 - - Other interest expense 360.9 187.0 28.1 Income tax provision (benefit) 22.3 (90.9) (26.1) Accelerated amortization of trade names - 2.4 3.3 Depreciation & amortization expense 643.4 362.5 95.0 Unrealized loss (gain) on foreign currency option and forward contracts (36.0) 2.5 - EBITDA $ 1,145.0 $ 301.6 $ 56.6 Transaction & integration costs 73.1 188.6 23.6 Rebranding costs 30.1 12.4 1.2 Gain on sale of intermodal equipment - (9.5) - Adjusted EBITDA $ 1,248.2 $ 493.1 $ 81.4
Divested North American truckload business 80.1 18.8 -
Adjusted EBITDA excluding truckload $ 1,168.1 $ 474.3 $ 81.4
Reconciliation of Non-GAAP MeasuresXPO Logistics, Inc.
Consolidated Reconciliation of Net Income (Loss) to Adjusted EBITDA Excluding Truckload(Unaudited)(In millions)
Twelve Months Ended December 31,2016 2015 2014