Embed Size (px)
Citation preview


3
Report Authoring With Microsoft SQL Server 2008 Reporting Services
Shane BartlePrincipal ConsultantMicrosoft New Zealand
Session Code:

Session Takeaways
Report Authoring in SQL 2008 has taken a significant step forward
Flexible tabular displayData visualisationData bound rich text
Unified report design for developers and business users

5
END USER TOOLS AND PERFORMANCE MANAGEMENT APPS
ExcelPerformancePoint
Server
BI PLATFORM
SQL Server Reporting Services
SQL Server Analysis Services
SQL Server DBMS
SQL Server Integration Services
SharePoint Server
DELIVERY
Reports Dashboards Excel Workbooks
AnalyticViews Scorecards Plans
Integrated End-to-End BI Offering

6
SQL Reporting 2008 Design Goals
Unify Report Designer and Report BuilderMore flexible tabular displayExtreme Charting MakeoverRich text supportUsability enhancements(Zoom, Snaplines, Tokens)New Property Dialogs

7
Basic Authoring Experience
demo

8
2001 2002 Total
1,115 1,331 2,446
152 642 794
11,156 13,312 24,468
1,523 6,421 7,944
13,946 21,706 35,653
Retail Acme
Nadir, Inc.
Wholesale ABC Corp.
XYZ, Ltd.
Grand Total
Customer
Retail
Acme
Nadir, Inc.
Wholesale
ABC Corp.
XYZ, Ltd.
Grand Total
Growth
19%
322%
19%
322%
56%
Tabl ixe + Matr

9
Tablix = Best of Both Worlds ++
Matrix plusMultiple parallel row/column members at each levelEach member may be dynamic or staticOptional omission of member headers
Table plusDynamic, nested column groupsMultiple parallel row groupsStatic rowsOptional spanning row headers
10
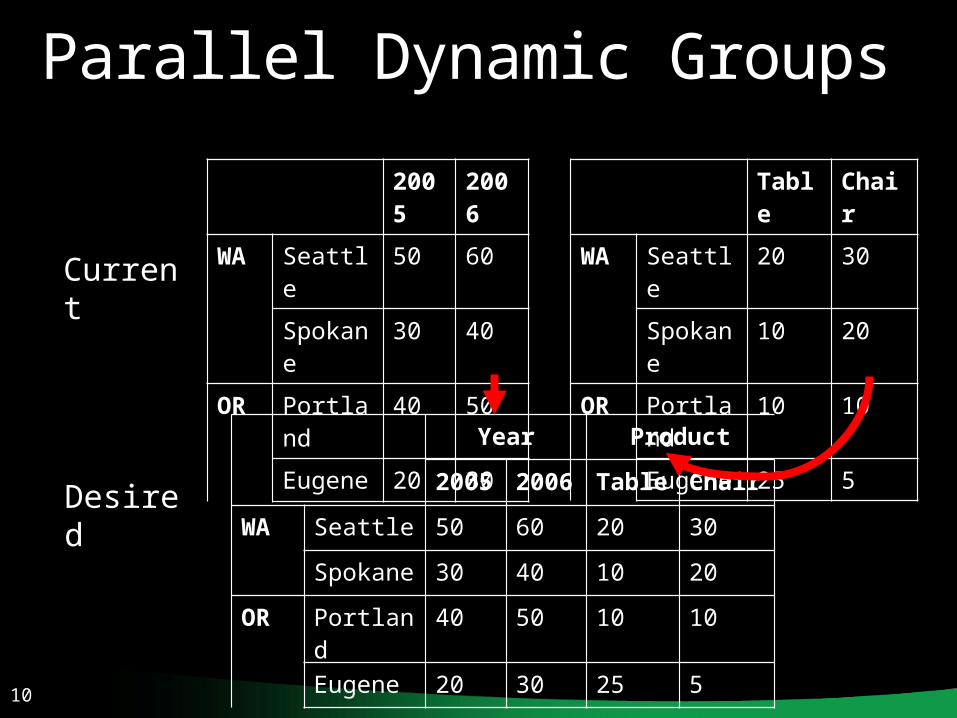
Table Chair
WA Seattle 20 30
Spokane 10 20
OR Portland 10 10
Eugene 25 5
2005 2006
WA Seattle 50 60
Spokane 30 40
OR Portland 40 50
Eugene 20 30
Current
Desired
Year Product
2005 2006 Table Chair
WA Seattle 50 60 20 30
Spokane 30 40 10 20
OR Portland 40 50 10 10
Eugene 20 30 25 5
Parallel Dynamic Groups

11
Mixing Dynamic And Static Columns
State City Pop Area
WA Seattle 20 30
WA Spokane 10 20
OR Portland 10 10
OR Eugene 25 5
State City 2005 2006 Pop Area
WA Seattle 50 60 20 30
Spokane
30 40 10 20
OR Portland 40 50 10 10
Eugene 20 30 25 5
2005 2006
WA Seattle 50 60
Spokane 30 40
OR Portland 40 50
Eugene 20 30
Current
Desired

12
2005 2006
West Total 140 180
Washington Total 80 100
Seattle 50 60
Spokane 30 40
Oregon Total 60 80
Portland 40 50
Eugene 20 30
East Total 200 220
2005 2006
West 140 180Washington 80 100
Seattle 50 60Spokane 30 40
Oregon 60 80Portland 40 50Eugene 20 30
East 200 220
Current Desired
...
...
Hierarchical Rows With Dynamic Headers

13
Non-aggregate details in subtotals Non-detail aggregates in subtotals
Scope-specific aggregates in subtotals
Q1 Q2 Total
Prof Enroll Prof Enroll
Calculus Galt 25 Rand 30 55
Physics Ellis 14 Chan 21 35
Yoga Zehn 42 Tau 53 95
Biology Rasa 31 Starr 35 66
2005 2006
NY Joe 50 60
Sue 80 100
Total Count 2 2
Sales 130 160
Avg 65 80
...
2005 2006 Total
Jan-Jun
Jul-Dec
Total Jan-Jun
Jul-Dec
Total
$ Gr $ Gr
Cog 10 15 25 - 11 20 31 6 56
Sprocket 20 25 45 - 22 30 52 7 97
Other Tablix Examples

14
Tablix
demo

15
Data Visualisation

16
Data Visualisation Improvements
Additional Chart TypesStock, Funnel, Range, Boxplot, Funnel, Pyramid,Pie (Call Out)
Additional Chart FunctionalityMultiple Chart Areas (+ Custom Positioning),Titles and LegendsCalculated SeriesScale BreakSecondary Axis
GaugeLinear and Radial

17
Chart Examples
Scale Breaks
Frame Effects
Drawing Styles

18
Chart Examples

19
Chart Examples
Multiple Chart Areas
Calculated Series
Striplines
Multiple Legends

20
Introducing Gauge
Gauge is a new data region in SQL Server Reporting Services 20082 Gauge Types
Radial and LinearScenarios
Typically bound to a single or a few data points (value, target, goal, etc.)Perfect for Analysis Services KPIsStand-alone or embedded in a tablix (bullet graph)

21
Gauge Samples
Radial Gauge Linear Gauge

22
Chart And Gauge
demo
23
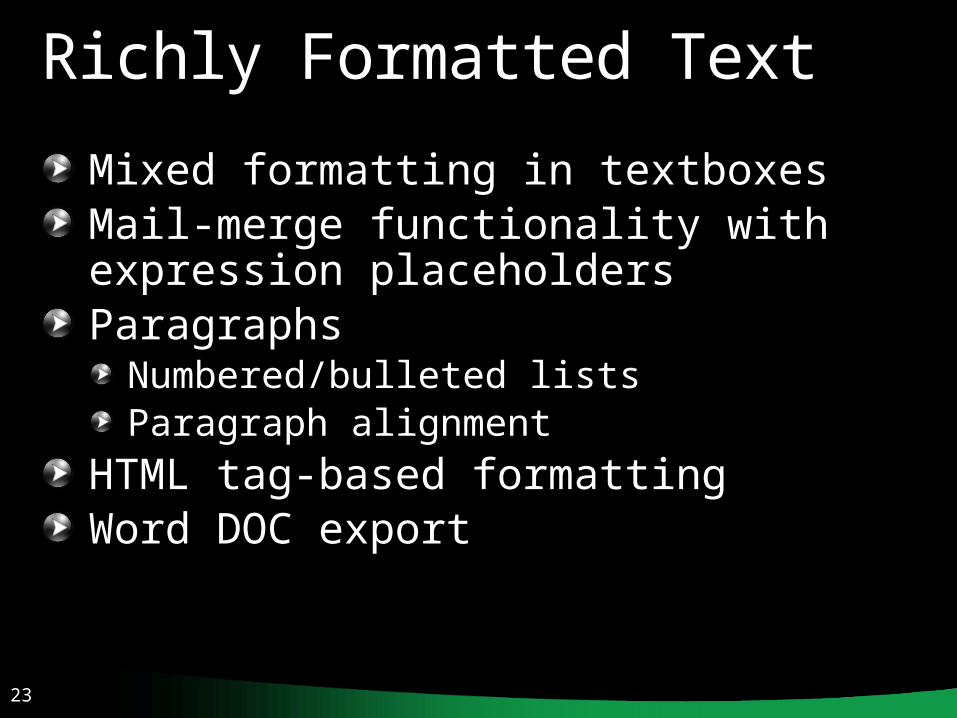
Richly Formatted Text
Mixed formatting in textboxesMail-merge functionality withexpression placeholdersParagraphs
Numbered/bulleted listsParagraph alignment
HTML tag-based formattingWord DOC export

24
Richly Formatted Text
demo

25
Report Builder 2.0 will replace Report Builder 1.0 and will encompass all of its functionalityCurrently in RC1Support for report models will continue and will be enhancedPost-SQL Server 2008: Report Builder 2.0 will encompass all functionality in Report Builder 1.0
Report Builder 2.0 Positioning

26
Deployment SummaryUsage Scenario Support Statement
RS 2005 RDL,RS 2000 RDL
Can publish directly to 2008 Server using Report Manager or SOAP API2005 RDL will be preserved (not upgraded)
Report Designer (2000) Not supported – cannot deploy reports to a 2008 server
Report Builder 2005 (in 2005 and 2008)
Authors 2005 RDLsCan deploy reports to a 2008 Server
Report Designer (2005) Authors 2005 RDLsCan deploy reports to 2008 Server
Report Designer (2008) Will upgrade 2000 and 2005 RDLs to 2008Authors 2008 RDLsDeploy to 2008 server only
Report Builder 2008 (Stand alone)
Will upgrade 2000 and 2005 RDLs to 2008Authors 2008 RDLsDeploy to 2008 server only
VS 2005 Viewer and VS 2008 Viewer
Can view 2008 server reports2008 RDLs are not supported in local mode
VS 2005 and VS 2008 RDLC Designer
Authors SQL 2005 RDLsDoes not support 2008 RDLs
27
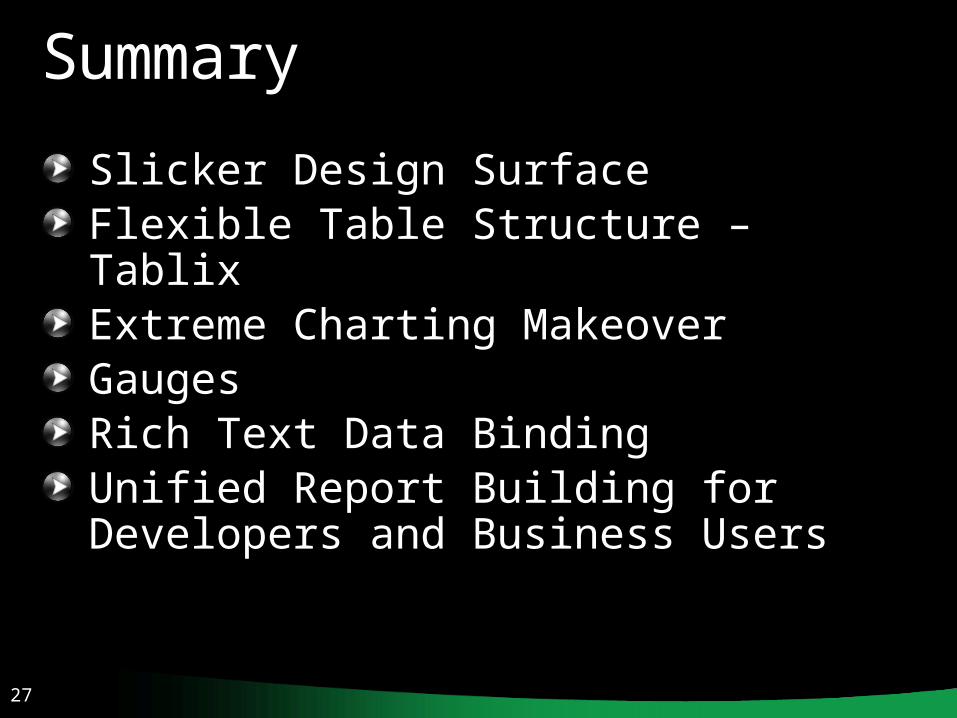
Summary
Slicker Design SurfaceFlexible Table Structure – TablixExtreme Charting MakeoverGaugesRich Text Data BindingUnified Report Building for Developers and Business Users

28
Q & A

30
Resources
www.microsoft.com/teched Tech·Talks Tech·Ed BloggersLive Simulcasts Virtual Labs
http://microsoft.com/technet
Evaluation licenses, pre-released products, and MORE!
http://microsoft.com/msdn
Developer’s Kit, Licenses, and MORE!
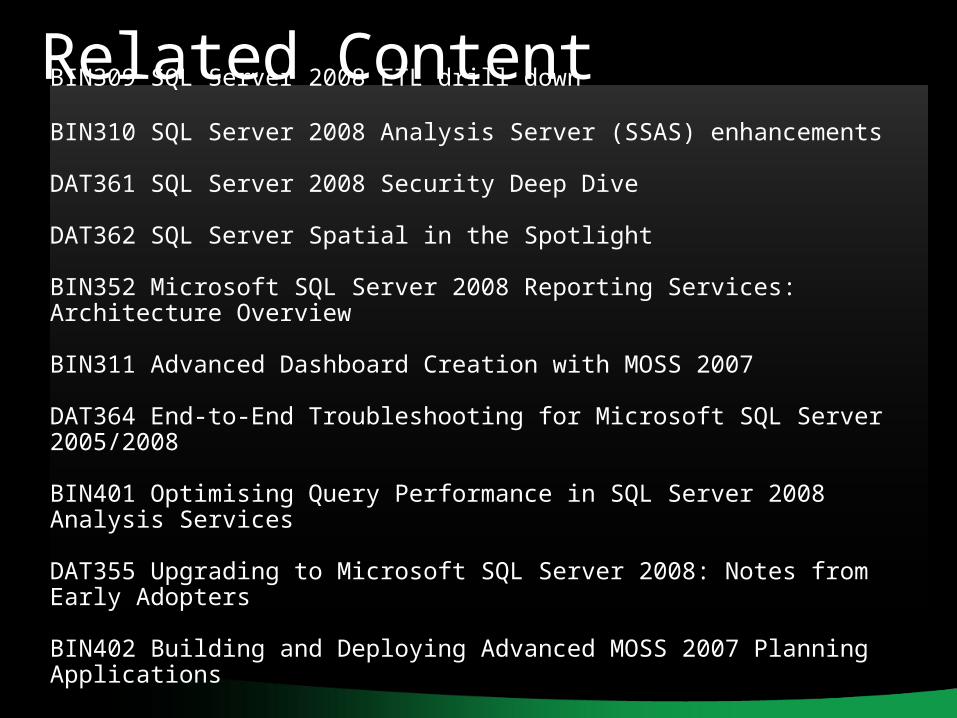
Related ContentBIN309 SQL Server 2008 ETL drill down
BIN310 SQL Server 2008 Analysis Server (SSAS) enhancements
DAT361 SQL Server 2008 Security Deep Dive
DAT362 SQL Server Spatial in the Spotlight
BIN352 Microsoft SQL Server 2008 Reporting Services: Architecture Overview
BIN311 Advanced Dashboard Creation with MOSS 2007
DAT364 End-to-End Troubleshooting for Microsoft SQL Server 2005/2008
BIN401 Optimising Query Performance in SQL Server 2008 Analysis Services
DAT355 Upgrading to Microsoft SQL Server 2008: Notes from Early Adopters
BIN402 Building and Deploying Advanced MOSS 2007 Planning Applications

Track Resources
Resource 1
Resource 2
Resource 3
Resource 4

33
Please complete anevaluation

34
© 2008 Microsoft Corporation. All rights reserved. Microsoft, Windows, Windows Vista and other product names are or may be registered trademarks and/or trademarks in the U.S. and/or other countries.The information herein is for informational purposes only and represents the current view of Microsoft Corporation as of the date of this presentation. Because Microsoft must respond to changing market conditions, it should not be interpreted to be a commitment on the part of Microsoft, and Microsoft cannot guarantee the accuracy of any information provided after the date of this presentation. MICROSOFT MAKES NO WARRANTIES, EXPRESS, IMPLIED
OR STATUTORY, AS TO THE INFORMATION IN THIS PRESENTATION.