Embed Size (px)
Citation preview
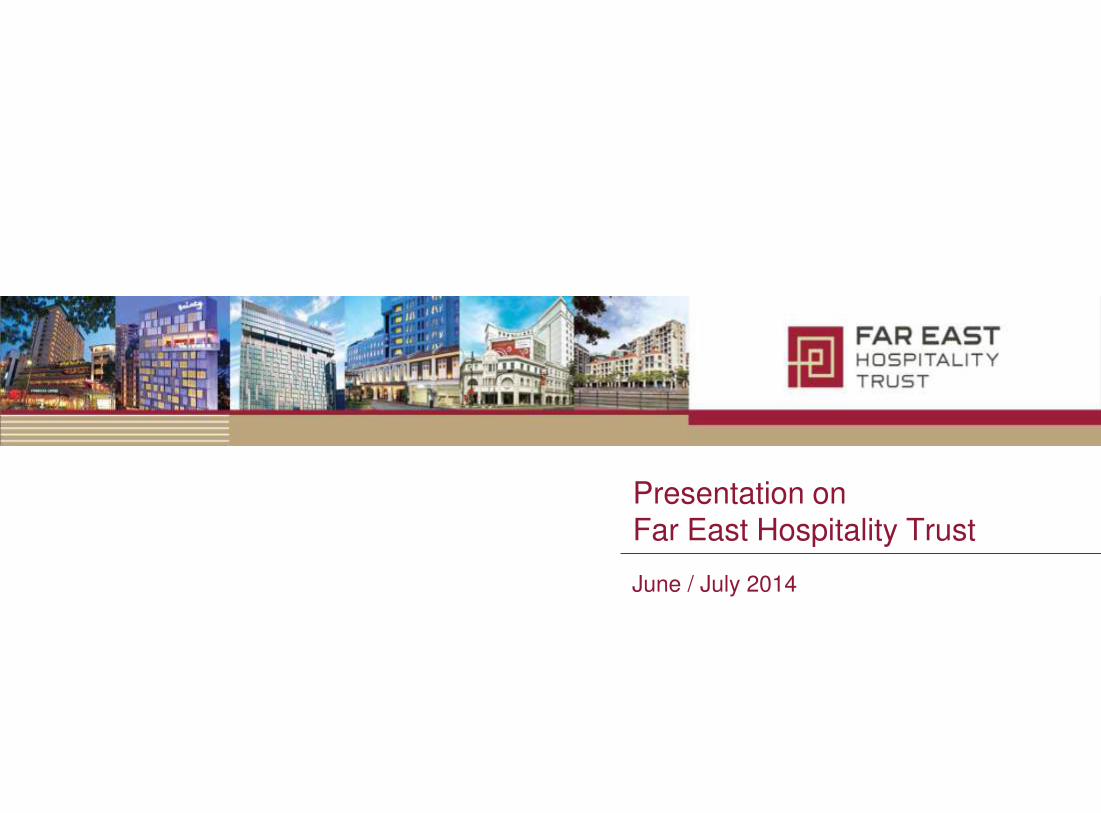
Presentation on Far East Hospitality Trust
June / July 2014

Important Notice
Information contained in this presentation is intended solely for your personal reference and is strictly confidential. The information and opinions in this presentation are subject to change without notice, its accuracy is not guaranteed and it may not contain all material information concerning Far East Hospitality Trust (the “Trust”), a stapled group comprising Far East Hospitality Real Estate Investment Trust and Far East Hospitality Business Trust. Neither FEO Hospitality Asset Management Pte. Ltd. (the “Manager”), FEO Hospitality Trust Management Pte. Ltd. (the “Trustee-Manager”, and together with the Manager, the “Managers”), the Trust nor any of their respective affiliates, advisors and representatives make any representation regarding, and assumes no responsibility or liability whatsoever (in negligence or otherwise) for, the accuracy or completeness of, or any errors or omissions in, any information contained herein nor for any loss howsoever arising from any use of these materials. By attending or viewing all or part of this presentation, you are agreeing to maintain confidentiality regarding the information disclosed in this presentation and to be bound by the restrictions set out below. Any failure to comply with these restrictions may constitute a violation of applicable securities laws.
The information contained in these materials has not been independently verified. No representation or warranty, expressed or implied, is made as to, and no reliance should be placed on, the fairness, accuracy, completeness or correctness of, the information or opinions contained herein. None of the Trust, the Managers, DBS Trustee Limited (as trustee of Far East Hospitality Real Estate Investment Trust), Far East Organization, controlling persons or affiliates, nor any of their respective directors, officers, partners, employees, agents, advisers or representatives shall have any liability whatsoever (in negligence or otherwise) for any loss howsoever arising, whether directly or indirectly, from any use, reliance or distribution of this presentation or its contents or otherwise arising in connection with this presentation. It is not the intention to provide, and you may not rely on these materials as providing a complete or comprehensive analysis of the Trust's financial or trading position or prospects. The information and opinions contained in these materials are provided as at the date of this presentation and are subject to change without notice. Nothing contained herein or therein is, or shall be relied upon as, a promise or representation, whether as to the past or the future and no reliance, in whole or in part, should be placed on the fairness, accuracy, completeness or correctness of the information contained herein. Further, nothing in this document should be construed as constituting legal, business, tax or financial advice. None of the Joint Bookrunners or their subsidiaries or affiliates has independently verified, approved or endorsed the material herein.
Nothing in this presentation constitutes an offer of securities for sale in Singapore, United States or any other jurisdiction where it is unlawful to do so.
The information in this presentation may not be forwarded or distributed to any other person and may not be reproduced in any manner whatsoever. Any forwarding, distribution or reproduction of this information in whole or in part is unauthorised. Failure to comply with this directive may result in a violation of the Securities Act or the applicable laws of other jurisdictions.
This presentation contains forward-looking statements that may be identified by their use of words like “plans,” “expects,” “will,” “anticipates,” “believes,” “intends,” “depends,” “projects,” “estimates” or other words of similar meaning and that involve assumptions, risks and uncertainties. All statements that address expectations or projections about the future and all statements other than statements of historical facts included in this presentation, including, but not limited to, statements about the strategy for growth, product development, market position, expenditures, and financial results, are forward-looking statements. Such forward-looking statements are based on certain assumptions and expectations of future events regarding the Trust's present and future business strategies and the environment in which the Trust will operate, and must be read together with those assumptions. The Managers do not guarantee that these assumptions and expectations are accurate or will be realized. Actual future performance, outcomes and results may differ materially from those expressed in forward-looking statements as a result of a number of risks, uncertainties and assumptions. Although the Managers believe that such forward-looking statements are based on reasonable assumptions, it can give no assurance that such expectations will be met. Representative examples of these risks, uncertainties and assumptions include (without limitation) general industry and economic conditions, interest rate trends, cost of capital and capital availability, competition from other companies, shifts in customer demands, customers and partners, changes in operating expenses including employee wages, benefits and training, governmental and public policy changes and the continued availability of financing in the amounts and the terms necessary to support future business. Predictions, projections or forecasts of the economy or economic trends of the markets are not necessarily indicative of the future or likely performance of the Trust. Past performance is not necessarily indicative of future performance. The forecast financial performance of the Trust is not guaranteed. You are cautioned not to place undue reliance on these forward-looking statements, which are based on the Managers’ current view of future events. The Managers do not assume any responsibility to amend, modify or revise any forward-looking statements, on the basis of any subsequent developments, information or events, or otherwise.
This presentation is for information purposes only and does not constitute or form part of an offer, solicitation or invitation of any offer, to buy or subscribe for any securities, nor should it or any part of it form the basis of, or be relied in any connection with, any contract or commitment whatsoever. Any decision to invest in any securities issued by the Trust or its affiliates should be made solely on the basis of information contained in the prospectus to be registered with the Monetary Authority of Singapore (the “MAS”) after seeking appropriate professional advice, and you should not rely on any information other than that contained in the prospectus to be registered with the MAS.
These materials may not be taken or transmitted into the United States, Canada or Japan and are not for distribution, directly or indirectly, in or into the United States, Canada or Japan.
These materials are not an offer of securities for sale into the United States, Canada or Japan. The securities have not been and will not be registered under the Securities Act and, subject to certain exceptions, may not be offered or sold within the United States. The securities are being offered and sold outside of the United States in reliance on Regulation S under the United States Securities Act of 1933, as amended. There will be no public offer of securities in the United States and the Managers do not intend to register any part of the proposed offering in the United States.
This presentation has not been and will not be registered as a prospectus with the MAS under the Securities and Futures Act, Chapter 289 of Singapore and accordingly, this document may not be distributed, either directly or indirectly, to the public or any member of the public in Singapore.
1

Table of Contents
I. Overview of Far East Hospitality Trust
II. Investment Highlights
III. Financial Highlights
Appendix
2

I. Overview of Far East Hospitality Trust

Issuer Far East Hospitality Trust
Sponsor Far East Organization group of companies
REIT Manager
FEO Hospitality Asset Management Pte. Ltd.
Investment Mandate
Hospitality and hospitality-related assets in Singapore
Portfolio
12 properties valued at approximately S$2.47 billion
8 hotel properties (“Hotels”) and 4 serviced residences (“SR” or “Serviced Residences”)
Hotel and SR Operator
Far East Hospitality Management (S) Pte Ltd
Master Lessees
Sponsor companies, part of the Far East Organization group of companies
Hotel Portfolio
SR Portfolio
Public
REIT Manager
Far East H-REIT
Far East H-BT
Trustee-Manager
Far East
Far East H-Trust
REIT Business
Trust1
46.7% 53.3%
Hotel and SR Operator &
Property Manager
Master Lessees
1 Dormant at Listing Date and master lessee of last resort
Overview of Far East H-Trust
Excluded Commercial
Premises
4

Unique Position Among Singapore REITs
1 Singapore-Focused REITs include Suntec REIT, Mapletree Commercial Trust, Mapletree Industrial Trust, Capitamall Trust and SPH REIT, all of which have total assets of more than S$2.0 billion. Market data as at June 2014. 2 Ascott Residence Trust’s portfolio also has exposure to the European Serviced Residences market
Retail Office Industrial Hospitality
2
Singapore only
Asia Pacific
Far East H-Trust’s unique pure-play Singapore hospitality exposure
5

II. Investment Highlights

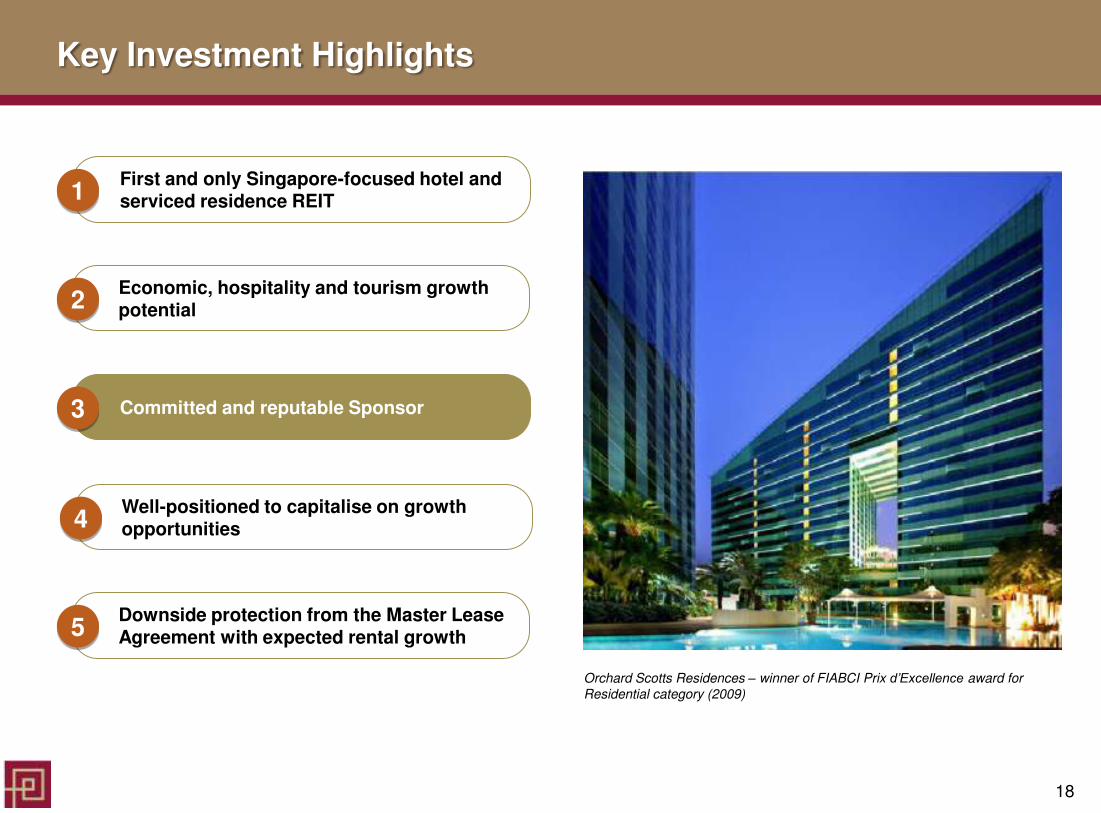
Key Investment Highlights
First and only Singapore-focused hotel and serviced residence REIT 1
Economic, hospitality and tourism growth potential 2
Committed and reputable Sponsor 3
Well-positioned to capitalise on growth opportunities 4
Downside protection from the Master Lease Agreement with expected rental growth 5
Lobby of The Quincy Hotel
7
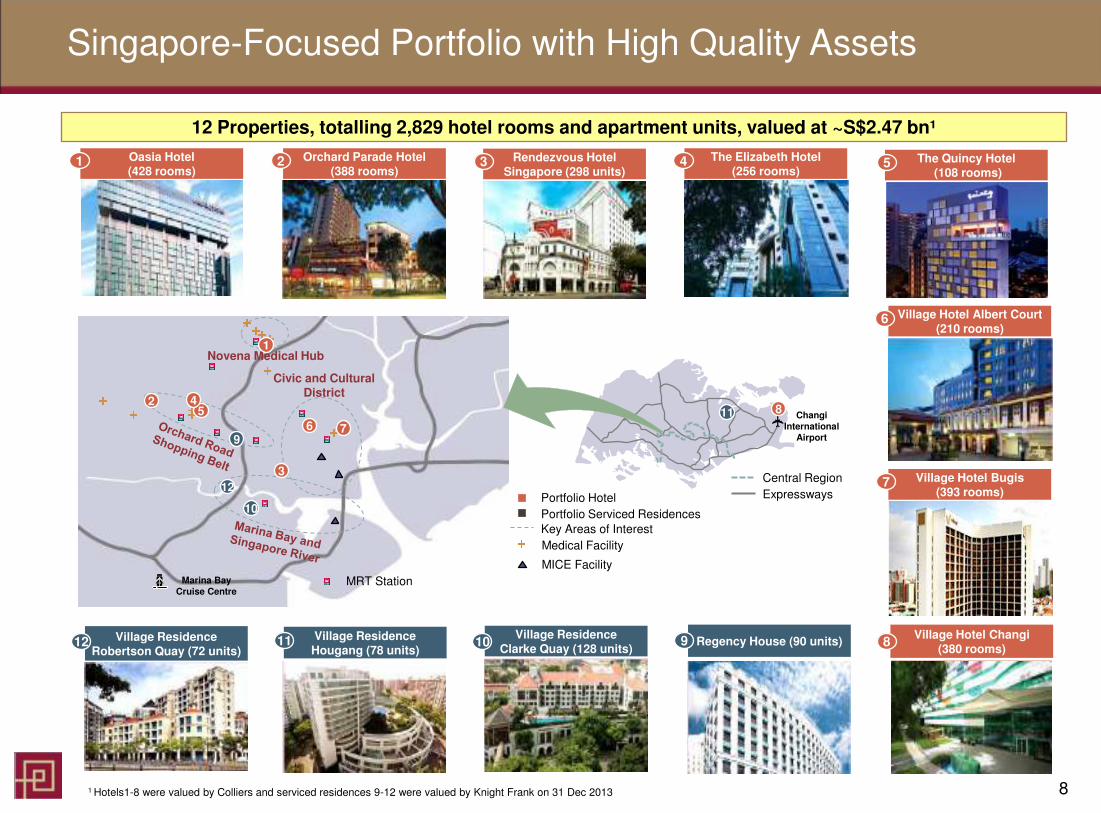
Singapore-Focused Portfolio with High Quality Assets
12 Properties, totalling 2,829 hotel rooms and apartment units, valued at ~S$2.47 bn¹
1 Hotels1-8 were valued by Colliers and serviced residences 9-12 were valued by Knight Frank on 31 Dec 2013
Central Region
Novena Medical Hub
Changi International
Airport
Civic and Cultural District
Expressways
Marina Bay Cruise Centre
Portfolio Hotel
Portfolio Serviced Residences
Key Areas of Interest
Medical Facility
MICE Facility
MRT Station
2 5
4 11
1
6 7
8
10
12
9
3
The Quincy Hotel (108 rooms)
5
Village Hotel Albert Court (210 rooms)
6
Village Hotel Changi (380 rooms)
8
The Elizabeth Hotel (256 rooms)
4
Village Hotel Bugis (393 rooms)
7
Oasia Hotel (428 rooms)
1 Orchard Parade Hotel (388 rooms)
2 Rendezvous Hotel Singapore (298 units)
3
Village Residence Clarke Quay (128 units)
10 Village Residence Robertson Quay (72 units)
12 Village Residence Hougang (78 units)
11 Regency House (90 units) 9
8

Market Segmentation 1Q 2014 - Hotels
Hotels (by Region)
• The Corporate segment contributed 45.0% of 1Q 2014 hotel revenue, compared to 47.2% in the previous quarter.
• The stronger Singapore Dollar continued to affect bookings from India and Malaysia. Japan was the fastest growing market in 1Q 2014.
Hotels (by Revenue)
Leisure/ Independent
55.0%
Corporate 45.0%
SE Asia 24.3%
Europe 23.9%
N Asia 20.8%
S Asia 9.4%
Oceania 8.8%
N America 8.7%
Others 4.1%
9

Market Segmentation 1Q 2014 – Serviced Residences
Serviced Residences (by Revenue) Serviced Residences (by Industry)
• The Corporate segment contributed 76.8% of revenue for Serviced Residences in 1Q 2014, compared to 81.2% in the previous quarter.
• Guest profile by industry remained relatively unchanged for the Serviced Residences.
Leisure/ Independent
23.2%
Corporate 76.8%
Services 27.2%
Banking & Finance 24.2% Oil & Gas
14.7%
Elect & Manufacturing
7.1%
FMCG 4.6%
Logistics 2.9%
Others 19.3%
10

Asset Mix and Market Segmentation
Far East H-Trust Revenue by Market Segment Far East H-Trust Hotel Properties by Market Segment
Mid-tier 50%
Mid-Tier/Upscale
33%
Upscale 17%
Total: 2,461 Rooms
Hotels 67.4%
Serviced Residences
13.9%
Excluded Commercial
Premises 18.7%
11

Key Investment Highlights
First and only Singapore-focused hotel and serviced residence REIT 1
Economic, hospitality and tourism growth potential 2
Committed and reputable Sponsor 3
Well-positioned to capitalise on growth opportunities 4
Downside protection from the Master Lease Agreement with expected rental growth 5
Photo Montage of Existing and Upcoming Tourist Attractions in Singapore
12

Singapore as a Global Premier Business Destination
Source: Singapore Tourism Board, Tourism Sector Performance 2013, 17 Feb 2014 Asiaone, “STB plans to boost MICE sector”, 25 Sep 2013
An award-winning meeting city
Steady growth in business travel arrivals Business travel to contribute 36% of total tourism receipts by 2020
2.91
2.59
3.14 3.23 3.36
2.64
2008 2009 2010 2011 2012 YTD Q3 2013
(millions)
+6%
33
36
2011 2020
% of Singapore’s Tourism Receipts
TTG Travel Awards 2013 Best BT MICE City
Business Traveller Asia-Pacific Travel Awards 2013
Best Business City in Southeast Asia
The influx of business travellers will continue to contribute to Singapore’s tourism market given Singapore’s positioning as a key regional business hub and its increased profile as a MICE destination
World Travel Awards 2013 Asia’s Leading Meetings &
Conference Destination
International Congress and Convention Association Global Rankings 2012
Top Convention City in Asia for the 11th consecutive year
Union of International Associations Global
Rankings 2012 Top International Meeting City
for the 6th consecutive year
13

Transformation of Tourism Landscape – Upcoming Developments
*Opening Dates may be subject to change
Singapore Sports Hub (2014) Hosting world-class concerts,
entertainment and sports events
Novena Health City (2018*) Integrating health services, research
and education, commercial and leisure facilities
Changi Terminal 4 (2017*) & Project Jewel (2018*)
Catering for greater air traffic and creating a unique airport hub experience
Creating Unique Tourist Experiences & Driving MICE
$15 mil Association Development Fund and MICE 2020 Roadmap to develop
capabilities and engage visitors
National Gallery Singapore (2015*) The largest gallery to showcase
Singaporean and Southeast Asian arts
14

Key Events in 2014
Opened in June 2014
Food & Hotel Asia Exhibition
Biennial Events New and Regular Events
15

Source : Jones Lang LaSalle
Hotel supply is expected to increase at a CAGR of 3.6% from 2013 to 2016
Hotel Room Supply in Singapore
51,622
3,340
2,572 3,004 532 61,070
2013 2014 2015 2016 Total 2016
Current Estimated Hotel Supply Estimated Future New Hotel Supply Estimated Hotel Supply by End-2016
54,962
16

• Visitor arrivals are projected to grow at a CAGR of 5.5% from 2012 to 2015
Sources : IPO Prospectus dated 16 Aug 2012 (2002 to 2011 visitor arrivals) Singapore Tourism Board, International Visitor Arrivals Statistics, 10 Dec 2013 (2012 visitor arrivals) and 3 May 2014 (2013 visitor arrivals) Business Times, “STB sees up to 16.8m visitor arrivals in 2014”, 7 Mar 2014 Singapore Tourism Board, “Singapore sets out to triple tourism receipts to S$30 billion by 2015, 11 Jan 2005 (2015E visitor arrivals)
Historical and Forecast Visitor Arrivals in Singapore
7,567
6,127
8,329 8,943
9,751 10,285
10,116 9,681
11,640
13,169
14,496
15,568
16,300 to 16,800
17,000
2002 2003 2004 2005 2006 2007 2008 2009 2010 2011 2012 2013 2014E 2015E
Sep 11 and SARS Sub-Prime
Visitor arrival umbers are in ‘000s.
17
Key Investment Highlights
First and only Singapore-focused hotel and serviced residence REIT 1
Economic, hospitality and tourism growth potential 2
Committed and reputable Sponsor 3
Well-positioned to capitalise on growth opportunities 4
Downside protection from the Master Lease Agreement with expected rental growth 5
Orchard Scotts Residences – winner of FIABCI Prix d’Excellence award for
Residential category (2009)
18
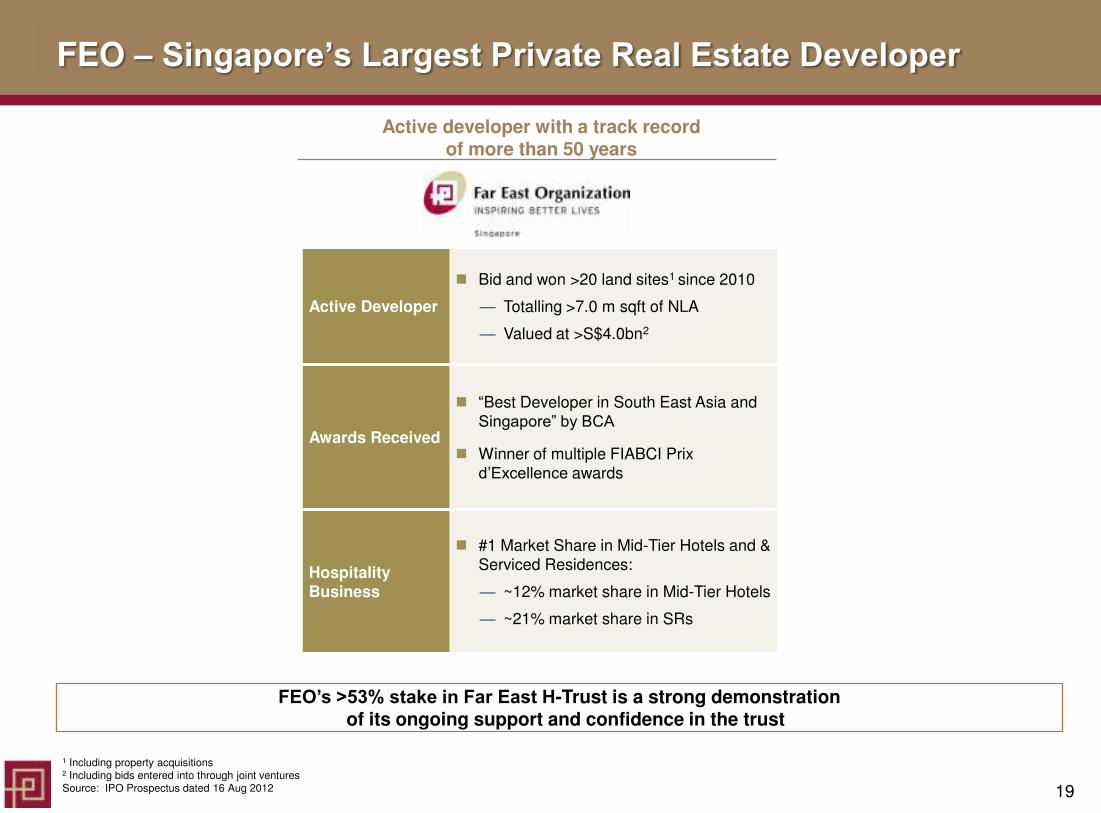
FEO – Singapore’s Largest Private Real Estate Developer
1 Including property acquisitions 2 Including bids entered into through joint ventures Source: IPO Prospectus dated 16 Aug 2012
Active Developer
Bid and won >20 land sites1 since 2010
— Totalling >7.0 m sqft of NLA
— Valued at >S$4.0bn2
Awards Received
“Best Developer in South East Asia and Singapore” by BCA
Winner of multiple FIABCI Prix d’Excellence awards
Hospitality Business
#1 Market Share in Mid-Tier Hotels and & Serviced Residences:
— ~12% market share in Mid-Tier Hotels
— ~21% market share in SRs
FEO’s >53% stake in Far East H-Trust is a strong demonstration of its ongoing support and confidence in the trust
Active developer with a track record of more than 50 years
19

Proven Track Record in Hospitality Ownership and Operations
Since 1987, FEO has on average added to their portfolio a new hotel or serviced residence every 1.5 years
1980s and Before 1990s 2000s and Beyond
1 Located in Kuala Lumpur, Malaysia Source: IPO Prospectus dated 16 Aug 2012
Village Residence
Robertson Quay
Village Residence West Coast
Village Hotel Albert Court
Orchard Parksuites
Village Residence
Clarke Quay
The Elizabeth Hotel
The Quincy Hotel
Orchard Scotts Residences
Regency House
Village Hotel Katong
Hospitality Brands
Orchard Parade Hotel
Village Hotel Changi
Far East Plaza
Village Hotel Bugis
Sri Tiara Residences1
Oasia Hotel
Village Residence Hougang
20

Key Investment Highlights
First and only Singapore-focused hotel and serviced residence REIT 1
Economic, hospitality and tourism growth potential 2
Committed and reputable Sponsor 3
Well-positioned to capitalise on growth opportunities 4
Downside protection from the Master Lease Agreement with expected rental growth 5
This picture is an artist’s impression of Oasia Downtown Hotel and may differ
from the actual view of Oasia Downtown Hotel
21
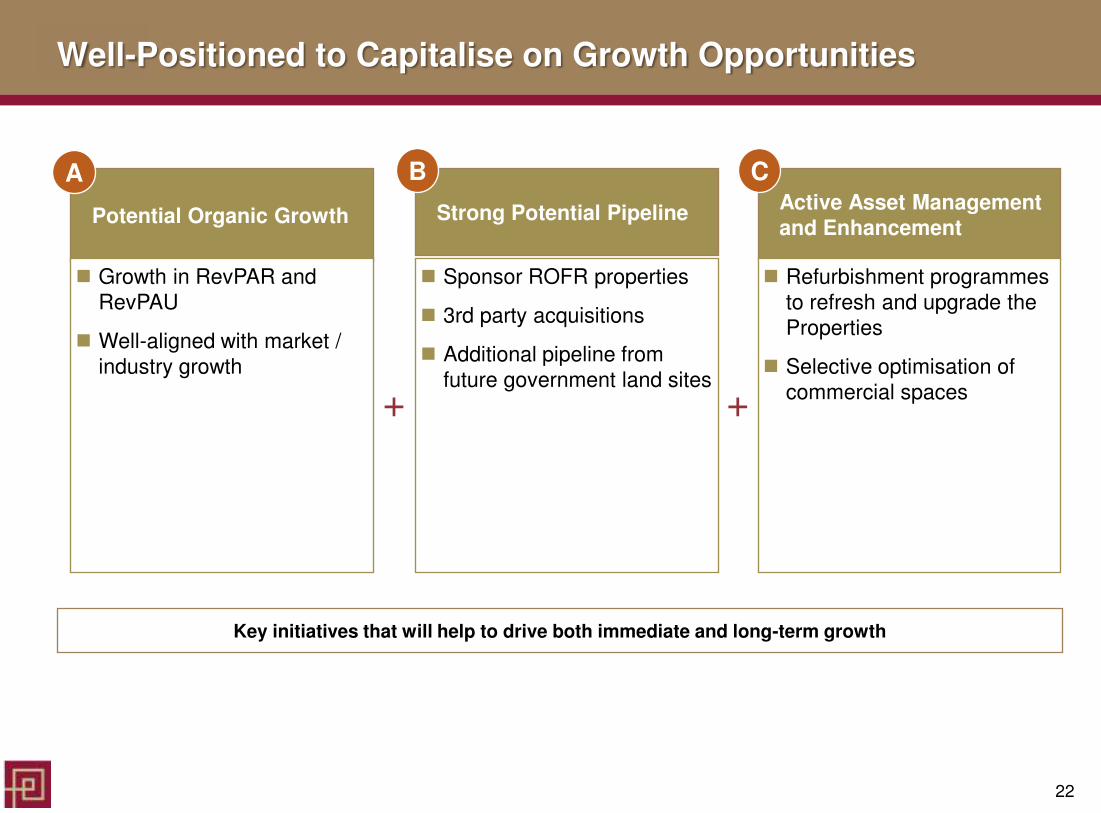
Well-Positioned to Capitalise on Growth Opportunities
Key initiatives that will help to drive both immediate and long-term growth
Potential Organic Growth
Growth in RevPAR and RevPAU
Well-aligned with market / industry growth
Strong Potential Pipeline
Sponsor ROFR properties
3rd party acquisitions
Additional pipeline from future government land sites
+ +
A B Active Asset Management and Enhancement
Refurbishment programmes to refresh and upgrade the Properties
Selective optimisation of commercial spaces
C
22

Organic Growth Opportunities
Potential to extract significant organic growth going forward
Increased level of MICE activities
Completion of future developments e.g. South Beach, M+S Pte Ltd
$105m expansion of Raffles Hospital: +20,612sqm (+72%) V
illa
ge H
ote
l B
ug
is
Orc
hard
Pa
rad
e
Ho
tel Prime Orchard Road location
Continued focus on corporate customers
Re
ge
nc
y
Ho
us
e Prime location
Optimisation of commercial space
Oa
sia
Ho
tel
Stabilisation of Mount Elizabeth Novena Hospital in 2013
Ramping up of Novena Specialist Centre
Active brand marketing
Oasia Hotel
Novena Medical Center
Novena Specialist
Center
Tan Tock Seng
Hospital Mount Elizabeth Novena Hospital
Novena MRT Station
A
23

Novena Medical Hub
4
5
1
3 2
Civic and Cultural District
1This picture is an artist’s impression of the property and may differ from the actual view of the property 2 Novena Specialist Center is part of the Oasia Hotel building Source: STB, CBRE Hotels
Five of FEHT’s properties are strategically located within close proximity to reputable hospitals and medical
centres in Singapore, placing it in prime position to benefit from a medical tourism boom
Hospital
Oasia Hotel 1
The Elizabeth Hotel 2
The Quincy Hotel 3
Orchard Parade Hotel 4
Village Hotel Bugis 5
24
Thomson Medical Center
Beds: 190
Novena Medical Centre
144 Medical Suites
Mount Elizabeth Hospital
Beds: 357
Paragon Medical
>60 Private Practices
Gleneagles Hospital
Beds: 272
Thomson Medical Center
Beds: 190
Novena Specialist Centre2
69 Medical Suites
Raffles Hospital
Beds: 380
Mount Elizabeth Novena1
Beds: 333
Camden Medical Centre
>65 Private Practices
Kandang Kerbau Hospital
Beds: 830
Tan Tock Seng Hospital
Beds: 1,400
Proximity to Key Medical Facilities A

(1) This picture is an artist’s impression of the property and may differ from the actual view of the property
Completed
Under Development
Central Region
2 1
3
Orchard Parksuites
Number of Units: 225
1 Orchard Scotts Residences
Number of Units: 207
2 Village Residence West Coast
Number of Units: 51
3
7
The Outpost Hotel1
Number of Rooms: 292
8 Oasia Downtown Hotel1
Number of Rooms: 314
6
6 8
4
Oasia West Residences1
Number of Units: 116
7
Name of ROFR Property Expected
Completion Date
Est. No of Rooms / Units
Orchard Parksuites Completed 225 Orchard Scotts Residences Completed 207
West Coast Village Residences Completed 51
The Amoy Hotel (Phase 1) Completed 37
Completed Subtotal 520
Under Development
AMOY Hotel (Phase 2) 2H2015 60 Oasia Downtown Hotel 1H2016 314 Oasia West Residences 1H2016 116 The Outpost Hotel 1H2017 292 Under Development Subtotal 782
Total
Hotel Rooms 703 Serviced Residence Units 599 Grand Total 1,302
1
2 3
4
5
7 6
3
AMOY Hotel (Phase 1)
Number of Units: 37
4
8
2,829
46.0%
growth
4,133 1,302
Existing Portfolio ROFR Properties Enlarged Portfolio
AMOY Hotel (Phase 2)
Number of Rooms: 60
5
Acquisition from Sponsor
5
B
25

Master Lessee
Serene Land Pte Ltd
Term 20 years + 20 years
Fixed Rent $6.5m p.a.
Variable Rent
33% of GOR + 25% of GOP less Fixed Rent(2)
Retail Net Floor Area
2,295 sqm
Purchase Price
$264.3m (Hotel: S$216.6m / Retail: S$47.7m)(1)
Colliers Valuation
as at 31 Dec 2013
$277.0m (Hotel: S$220.0m / Retail: S$57.0m)
Acquisition from Third Party – Rendezvous Hotel Singapore
Source: Circular dated 15 May 2013 Notes (1) Based on the average proportion of hotel and retail valuations by Colliers and JLL (2) If the calculation of the Variable Rent yields a negative figure, the Variable Rent will be deemed to be zero
Completion 1 Aug 2013
Leasehold Tenure
70 years from Completion Date
Market Segment
Upscale
Rooms 298
B
26

Rendezvous Hotel Singapore
The property has completed the refurbishment of its reception lobby, lobby bar and club rooms to reposition it as an art-inspired hotel.
Asset Enhancement Initiatives – Completed in Jan 2014 C
27

Village Hotel Albert Court
Upgrade of 136 Superior and Deluxe Rooms and all corridors.
Be
fore
Afte
r Asset Enhancement Initiatives – Completed in Jun 2014
C
28

Regency House
Planned upgrade of 41 Studio Apartments and breakfast lounge.
Expected completion in 3Q 2014.
Be
fore
Afte
r Asset Enhancement Initiatives – Ongoing Refurbishments
C
29
Be
fore
Afte
r
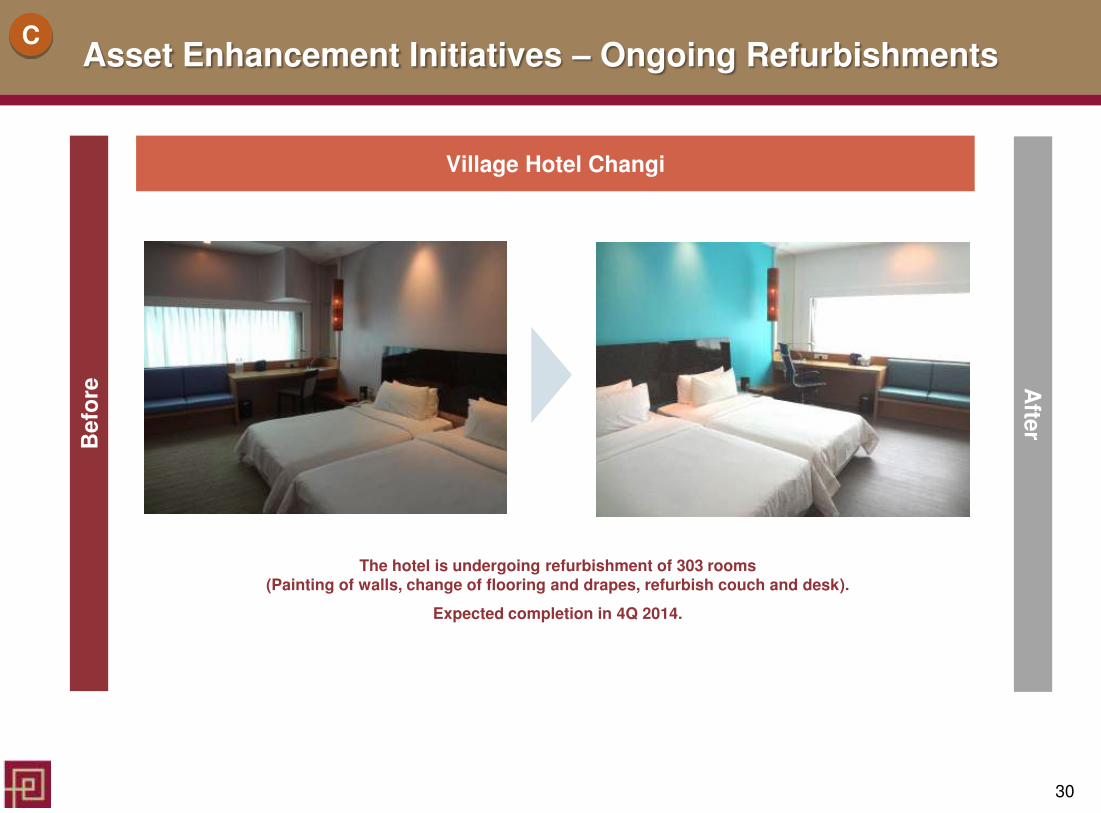
The hotel is undergoing refurbishment of 303 rooms (Painting of walls, change of flooring and drapes, refurbish couch and desk).
Expected completion in 4Q 2014.
Village Hotel Changi
Asset Enhancement Initiatives – Ongoing Refurbishments C
30

Key Investment Highlights
First and only Singapore-focused hotel and serviced residence REIT 1
Economic, hospitality and tourism growth potential 2
Committed and reputable Sponsor 3
Well-positioned to capitalise on growth opportunities 4
Downside Protection from the Master Lease Agreement with expected rental growth 5
Orchard Parade Hotel
31

Attractive Master Lease Structure: Upside Sharing with Downside Protection
% of GOR component contributes > 60% of Far East H-Trust’s Gross Revenue, ensuring less sensitivity to cost increases
Key Terms of the Master Lease Agreement
Tenure 20 years with the option to renew for an
additional 20 years
FFE Reserve 2.5% of GOR1
Lease Terms
Total rent =
33% of GOR (Hotels and SRs)
plus
23 – 37% of GOP (Hotels) or
38 – 41% of GOP (SRs)
Variable rent = Total rent – Fixed rent
Master Lessees Sponsor companies, part of the Far East
Organization group of companies
1 Except for Oasia Hotel which is 1% for the first three years and 2.5% thereafter 2 2013 data includes acquisition of Rendezvous Hotel Singapore & Rendezvous Gallery on 1 Aug 2013 Source: IPO Prospectus dated 16 Aug 2012 and Circular dated 15 May 2013
2
2012 2013 2013
45.9%
Fixed and Variable Rent Composition of Total Master Lease Rental2
36.3%
54.1%
63.7%
32
III. Financial Highlights
1Q 2014* 1Q 2013 Variance
$ $ %
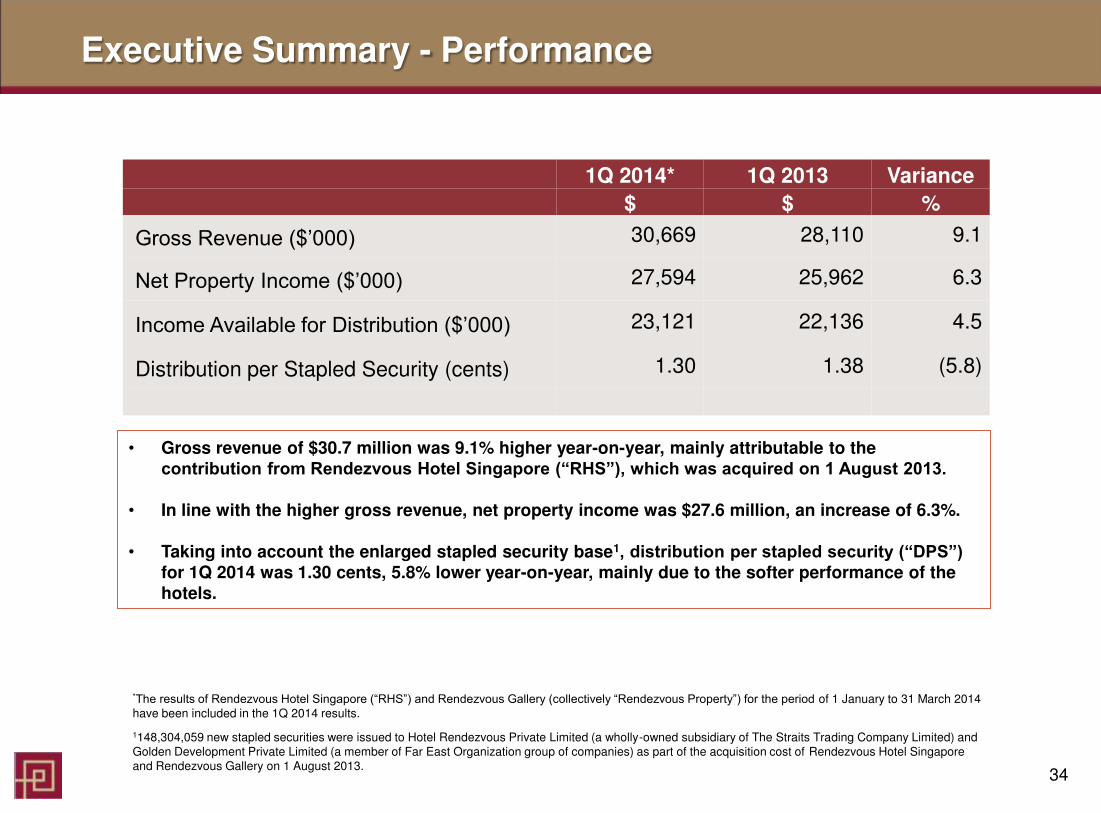
Gross Revenue ($’000) 30,669 28,110 9.1
Net Property Income ($’000) 27,594 25,962 6.3
Income Available for Distribution ($’000) 23,121 22,136 4.5
Distribution per Stapled Security (cents) 1.30 1.38 (5.8)
Executive Summary - Performance
• Gross revenue of $30.7 million was 9.1% higher year-on-year, mainly attributable to the contribution from Rendezvous Hotel Singapore (“RHS”), which was acquired on 1 August 2013.
• In line with the higher gross revenue, net property income was $27.6 million, an increase of 6.3%.
• Taking into account the enlarged stapled security base1, distribution per stapled security (“DPS”)
for 1Q 2014 was 1.30 cents, 5.8% lower year-on-year, mainly due to the softer performance of the hotels.
*The results of Rendezvous Hotel Singapore (“RHS”) and Rendezvous Gallery (collectively “Rendezvous Property”) for the period of 1 January to 31 March 2014 have been included in the 1Q 2014 results.
1148,304,059 new stapled securities were issued to Hotel Rendezvous Private Limited (a wholly-owned subsidiary of The Straits Trading Company Limited) and Golden Development Private Limited (a member of Far East Organization group of companies) as part of the acquisition cost of Rendezvous Hotel Singapore and Rendezvous Gallery on 1 August 2013.
34

Financial Results From 1 January to 31 March 2014
1Q 2014* 1Q 2013 Variance Change +/(-)
S$’000 S$’000 S$’000 %
Master lease rental 24,935 23,471 1,464 6.2
Retail and office revenue 5,734 4,639 1,095 23.6
Gross revenue 30,669 28,110 2,559 9.1
Property tax (2,107) (1,693) (414) (24.4)
Property insurance (45) (17) (28) (164.7)
MCST contribution (14) (12) (2) (16.7)
Retail and office expenses (767) (297) (470) (158.2)
Property manager fees (134) (120) (14) (11.7)
Other property expenses (8) (9) 1 11.1
Property expenses (3,075) (2,148) (926) (43.1)
Net property income 27,594 25,962 1,632 6.3
REIT Manager’s fees (2,979) (2,680) (299) (11.1)
Trustee’s fees (78) (69) (9) (13.0)
Other trust expenses (180) (160) (20) (12.5)
Trust level expenses (3,237) (2,909) (328) (11.3)
Total finance costs (4,192) (3,732) (460) (12.3)
Net income before tax and fair value changes 20,165 19,321 844 4.4
Fair value change in interest rate swap 177 (139) N.M. N.M.
Total return for the period before income tax 20,342 19,182 1,160 6.0
*The results of Rendezvous Property for the period of 1 January to 31 March 2014 have been included in the 1Q 2014 results. 35

Statement of Distribution to Stapled Securityholders
1Q 2014* 1Q 2013 Variance Change +/(-)
S$’000 S$’000 S$’000 %
Total return for the period before income tax 20,342 19,182 1,160 6.0
Income tax expense - - - -
Total return for the period after income tax 20,342 19,182 1,160 6.0
Add/(less) non tax deductible/(chargeable) items :
REIT Manager’s fees paid/payable in stapled securities 2,682 2,144 538 25.1
Amortisation of debt upfront cost 200 168 32 19.0
Trustee’s fees 78 69 9 13.0
Other Adjustment (4) 25 N.M. N.M.
Amortisation of realised interest rate swap cost - 409 N.M. N.M.
Fair value change in interest rate swap (177) 139 N.M. N.M.
Net tax adjustment 2,779 2,954 (175) (5.9)
Income available for distribution 23,121 22,136 985 4.5
*The results of Rendezvous Property for the period of 1 January to 31 March 2014 have been included in the 1Q 2014 results. 36

Portfolio Performance – Key Highlights for 1Q 2014
• The average occupancy of the hotel portfolio was 83.4%, 2.1pp lower than 1Q 2013,
mainly due to the softer average occupancy in January 2014, which was in line with the
overall weakness in the upscale and mid-tier segments of the Singapore hotel industry.
• The average daily rate (“ADR”) of $190.0 was a 1.0% increase over the previous year. This was attributable to the more favourable room rates in February 2014 due to the
Singapore Airshow, which helped to neutralize the lower room rates in January 2014.
• RevPAR for 1Q 2014 was $158.6, a decrease of 1.3% year-on-year.
Hotels
37

Portfolio Performance – Key Highlights for 1Q 2014
38
Excluded Commercial Premises
• The excluded commercial premises (i.e. retail and office spaces) continued to provide
steady income stream to the portfolio. The rental revenue was $5.7 million, or 23.6%
increase from 1Q 2013.
• Serviced residences achieved a marginally higher revenue per available serviced
residence unit (“RevPAU”) of $221.3 in 1Q 2014, representing an increase of 1.2% year-on-year. The improvement in the RevPAU was due to the higher average occupancy
achieved offset by the lower ADR.
Serviced Residences

Portfolio Performance 1Q 2014 - Hotels
83.4 85.5
0.0
20.0
40.0
60.0
80.0
100.0
1Q 2014 1Q 2013
% Average Occupancy
190.0 188.1
0.0
40.0
80.0
120.0
160.0
200.0
1Q 2014 1Q 2013
$ Average Daily Rate (ADR)
158.6 160.7
0.0
40.0
80.0
120.0
160.0
200.0
1Q 2014 1Q 2013
$ Revenue Per Available Room (RevPAR)
1Q 2014 1Q 2013 Variance
Average Occupancy (%)
83.4 85.5 -2.1 pp
ADR ($) 190.0 188.1 +1.0%
RevPAR($) 158.6 160.7 -1.3%
Note: Charts for 1Q 2014 include RHS 39

1Q 2014 1Q 2013 Variance
Average Occupancy (%)
87.3 84.5 +2.8 pp
ADR ($) 254.2 259.7 -2.1%
RevPAU ($) 221.3 218.6 +1.2%
Portfolio Performance 1Q 2014 – Serviced Residences
87.3 84.5
0.0
20.0
40.0
60.0
80.0
100.0
1Q 2014 1Q 2013
% Average Occupancy
254.2 259.7
0.0
40.0
80.0
120.0
160.0
200.0
240.0
280.0
1Q 2014 1Q 2013
$ Average Daily Rate (ADR)
221.3 218.6
0.0
40.0
80.0
120.0
160.0
200.0
240.0
280.0
1Q 2014 1Q 2013
$
Revenue Per Available Unit (RevPAU)
40

Floating $300 38%
Fixed $482 62%
m
$300m
$250m
$132m
$100m
2013 2014 2015 2016 2017 2018 2019
Total debt $782m
Available revolving facility $75 m
Gearing ratio 30.9%
Unencumbered asset as % total asset
100%
Proportion of fixed rate 62%
Weighted average debt maturity
3.1 years
Average cost of debt 2.2%
Debt Maturity Profile
Interest Rate Profile
Fixed interest rate Floating interest rate
m
Capital Management
41

Thank You Key Contacts:
Gerald Lee
Chief Executive Officer
Tel: +65 6833 6600
Email: [email protected]
Gregory Sim
Chief Financial Officer
Tel: +65 6833 6677
Email: [email protected]
Denise Wong
Analyst
Tel: +65 6833 6607
Email:
42

Appendix

1 As at 31 Dec 2013 2 Date of acquisition by Sponsor, as property was not developed by Sponsor
Village Hotel Albert Court
Village Hotel Changi
The Elizabeth Hotel
Village Hotel Bugis
Oasia Hotel
Orchard Parade Hotel
The Quincy Hotel
Rendezvous Hotel & Gallery
Total / Weighted Average
Market Segment Mid-tier Mid-tier Mid-tier Mid-tier Mid-tier / Upscale
Mid-tier / Upscale
Upscale Upscale NA
Address 180 Albert
Street, S’pore189971
1 Netheravon Road,
S’pore 508502
24 Mount Elizabeth,
S’pore 228518
390 Victoria Street, S’pore
188061
8 Sinaran Drive, S’pore 307470
1 Tanglin Road, S’pore 247905
22 Mount Elizabeth Road, S’pore 228517
9 Bras Basah Road, S’pore
189559
Date of Completion 3 Oct 1994 30 Jan 19902 3 May 1993 19 Oct 1988 2 June 2011 20 June 19872 27 Nov 2008 5 June 20002
# of Rooms 210 380 256 393 428 388 108 298 2,461
Lease Tenure1 74 years 64 years 74 years 65 years 91 years 49 years 74 years 70 years NA
GFA/Strata Area (sq m) 11,426 22,826 11,723 21,676 22,457 34,072 4,810 19,720
Retail NLA (sq m) 1,003 778 583 1,164 NA 3,761 NA 2,824 10,113
Office NLA (sq m) NA NA NA NA NA 2,509 NA NA 2,509
Master Lessee / Vendor First Choice
Properties Pte Ltd
Far East Organization
Centre Pte. Ltd.
Golden Development
Private Limited
Golden Landmark Pte
Ltd
Transurban Properties Pte.
Ltd.
Orchard Parade Holdings Limited
Golden Development
Private Limited
Serene Land Pte Ltd
Valuation (S$ ‘mil)1 128.0 255.0 193.0 230.0 330.0 428.0 86.0 277.0 1,927.0
Hotels
Far East H-Trust Asset Portfolio Overview
44

Village Residence
Clarke Quay Village Residence
Hougang Village Residence Robertson Quay
Regency House
Total / Weighted Average
Market Segment Mid-tier Mid-tier Mid-tier Upscale NA
Address 20 Havelock Road,
S’pore 059765 1 Hougang Street 91,
S’pore 538692 30 Robertson Quay,
S’pore 238251 121 Penang House,
S’pore 238464
Date of Completion 19 Feb 1998 30 Dec 1999 12 July 1996 24 Oct 2000
# of Rooms 128 78 72 90 368
Lease Tenure1 79 years 80 years 77 years 80 years NA
GFA/Strata Area (sq m) 17,858 14,635 10,570 10,723 53,808
Retail NLA (sq m) 2,213 NA 1,179 539 3,931
Office NLA (sq m) Office: 1,474
Serviced Office: 696 NA NA 2,307 4,477
Master Lessee / Vendor OPH Riverside Pte Ltd Serene Land Pte Ltd Riverland Pte Ltd
Oxley Hill Properties Pte Ltd
Valuation (S$ ‘mil) 1 202.2 67.3 114.7 163.5 547.7
1 As at 31 Dec 2013
Serviced Residences
Far East H-Trust Asset Portfolio Overview
45