Embed Size (px)
Citation preview

Presentation of the annual
results 2011
Palais de la Bourse
Paris, 8 March 2012

SAPMER in brief
Yannick Lauri – General Manager, member of the Board of Directors

3
SAPMER’s expertise
• Tuna fishing
• Fleet: Tuna purse seiner -40°C
• Yellowfin, Skipjack, and Big eye fishing
• Fishing products:
• Whole tuna (< 3,5 kg at -40°C and
brine)
• Processed tuna (> 3,5 kg at
- 40°C)
• Storage at -40°C at Port-Louis
• Processing factory at Port-Louis
• Processed end products: Loins, Steaks,
Kirimi, Saku, under-belly, Colars
• Main markets:
• International markets including Japan
for Sashimi products and Europe and
the USA for steaks
• Mauritian markets for canning
industries for whole tuna
• The main clients are import/export
companies and wholesalers.
No activity
• Main markets:
• Japan, China, the USA
• Main clients are wholesalers; part of
the sales are done via brokers
• Toothfish fishing
• Fleet : Longliner
• Headed and gutted toothfish, packaged
on board.
• Rock Lobster fishing
• Fleet : freezer pot lobster vessel
• Rock Lobster prepared and packaged
on board.
Tuna
Toothfish
Rock Lobster
Fishing Processing and
value enhancing
Exportation and
sales
Southern seas fishing in the Economic Zones of the Southern and Antarctic Territories (TAAF)

Our fishing zones and the main species we catch
Indian Ocean
Yellowfin tuna/ Thunnus albacares
Skipjack/ Katsuwonus pelamis
On board deep freeze at -40oC
Continuous fishing activity which
began in 2009
No quota
Economic zone of the French and
Antarctic Territories
Rock Lobster/ Jasus paulensis
Quotas 2011/2012 : 400 T
Toothfish/ Dissostichus eleginoides
Quotas 2011/2012 : 3 220 T
4
SAPMER’s historic Activity

Our logistics: at sea
Toothfish Rock Lobster Tuna
Ships’ capacity 270 tons 240 tons
1 000 tons including
700 T in the hold at
-40°C
300 T in brine
Number of fishing trips
per ship 3 2 Continuous sailing
Number of ships 4 longliners 1 pot lobster vessel 3 tuna purse seiners
5

Our logistics: shore based
Storage capacity
Processing and value enhancing of halieutic resources : loins, steaks, slices,
… without thawing during process
Production capacity of 9 000 tons/year
Mauritius Island 3 600 tons at -40oC
Reunion Island 2 000 tons at -20oC with labelling
Mer des Mascareignes – Mauritius
Storage at -40oC in Mauritius Island increased
by 2 700 tons in 2011
6
Creation in 2011 of SMS (Sapmer Management Services) which ojective
is to supervise all logistics in Mauritius.

Our main international markets
Tuna Loins
Steak
Saku
Tataki
Tuna steak
Tuna steak
Tuna steak
Tuna steak
Kirimi, Carry
Toothfish
Toothfish
Rock Lobster
7

Active participant, alongside the TAAF administration and the French National Natural History Museum of
Paris in the handling of halieutic resources in the southern seas.
Group process for MSC certification (Marine Stewardship Council) with other French ship-
owners is underway
‘Responsible Fishing’ recognition from Bureau Veritas in April 2010
Joined the ‘Dolphin Safe’ international program from the Earth Island Institute in August 2011
A ‘Friends of the Sea’ certification is currently underway (certification expected for July 2012)
Strong commitment to ‘responsible fishing’
Southern seas fishing
Tuna fishing
8

2011, major developments
Yannick Lauri General Manager, member of the Board of Directors

SAPMER reaches its CAP 2012 objectives a year in advance
2011 revenues at 77 M€ with an increase of 29 M€ compared to 2010
33,048.0
77.0
2009 2010 2011
Good fishing campaign
Rapid expansion of the Tuna fleet
(3 ships in operation)
Important work on value enhancing of
selected tuna
Rising prices
+ 60%
20% operational
profitability
10% net
profitability
10 Offer of payment of a dividend of 0.4 € per share during the Annual General Meeting
of 26 April 2012

11
Southern seas fishing
Tuna fishing
Toothfish & Rock Lobster: Catch quotas for the
2010/2011 campaign were completed,
2011/2012 quotas, slight increase for Toothfish at
3 220 tons/year
Franche Terre and Manapany : Good handling of the
resource and continued fishing optimized
Bernica : 1st unloading in February, rapid expansion
Increase in targeted species for process.
Goog fishing campaign
11
12
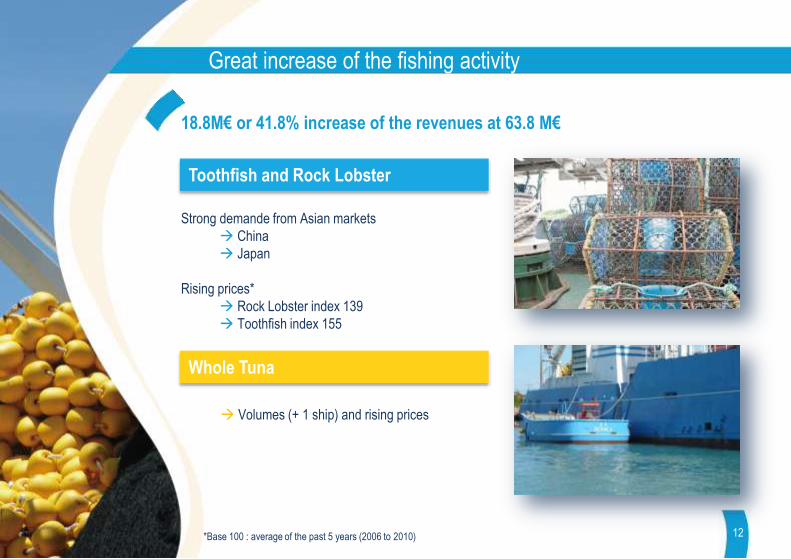
Great increase of the fishing activity
Toothfish and Rock Lobster
Strong demande from Asian markets
China
Japan
Rising prices*
Rock Lobster index 139
Toothfish index 155
*Base 100 : average of the past 5 years (2006 to 2010)
18.8M€ or 41.8% increase of the revenues at 63.8 M€
Whole Tuna
Volumes (+ 1 ship) and rising prices
12

13
On going maximization of the Tuna value enhancing & processing activity
Improvement of the process and increase of the productivity
5 300 tons of tuna were processed (frozen fish at -40oC) in 2011, which represents 33% of the total tuna
catch
Top quality products due to well structured process (catching and value enhancing) :
Sashimi quality loins represent 71% of the sales
Increase of the
activity by
340% at 13.2 M€
13

14
Value enhanced tuna revenues analysis
Breakdown of Revenues per Product in %
71%
15%
14%
Loins Steaks Other*
Breakdown of Revenues per country in %
72%
20%
4%2% 2%
Japan EuropeAfrica Mauritius/ReunionOther Asia
14
*Saku, Kirimi, Ventrèche, Collet and other

Breakdown of staff at 31 December 2011
On 31 December 2011, headcount was of 461 persons
169
154
63
48
19 8
Southern seas fishing Tuna fishing 50% MDM factory staff
Shore based Temporary STS/SMS
MDM : Mer des Mascareignes 15 15

Order of two new tuna sisterships
On going construction of two new tuna purse seiners at the Construction
SEAS PIRIOU vietnamese shipyards.
Contract signed in December 2011
Total amount of the investment : 54 M€ (construction and fitting out)
Delivery of DOLOMIEU : End of March 2012
Delivery of SEAS 44 expected end of August 2012
16
Creation in 2011
of STS (Sapmer
Technical Services)
which objective is to
supervise all ship
buildings.

Summary 2011
Financial results
Harald Chabot de L’Allier
Deputy General Manager Finance

18 18
M€ S1 2011 S2 2011 2011
12 months
2010
12 months
Revenues 42.2 34.8 77.0 48.0
Gross operating income (EBITDA) 10.0 9.4 19.4 7.7
Operating income (EBIT) 7.0 8.2 15.2 3.4
% EBIT / Revenues 17% 23% 20% 7%
Financial income (1.4) (2.0) (3.4) (3.0)
Income taxes (1.0) (3.1) (4.0) 0.2
Net income, Group share 4.6 3.1 7.7 0.6
% Net income / Revenues 11% 9% 10% 1%
Income Statement
IFRS Consolidated income statement (1st January – 31st December)
Operating income increased by 11.8 M€, and was multiplied by 4.4 between 2010 and 2011
The financial income is made of debt interests related to the tuna ships.
Total tax expenses amount to 4 M€, of which 3 M€ relates to income tax. This increase is due
to financial results increase on the one hand and tax regulation change on the other hand
(third allowance abolition).
Net income amounts to 7.7 M€, i.e. above 10% of revenues.

19 19
Fishing activity (M€)
S1 2010 S2 2010 S1 2011 S2 2011
1,02,0
4,5
8,7
Value-enhancing and
processing (M€)
Revenues origin (M€)
Southern seas fishing
Gross tuna Other activities
49,3
13,8
0,7
70%
18%
5%
2%5%
Japan & Asia
Reunion& Mauritius
North America
Europe
Other19
Revenues analysis

20
Fishing activity Value enhancing and processing
M€ S1
2011
S2
2011 2011 2010 Var.
S1
2011
S2
2011 2011 2010 Var.
Revenues 37.7 26.1 63.8 45.0 42% 4.5 8.7 13.2 3.0 345%
Operating
income 6.8 7.0 13.7 3.5 290% 0.3 1.2 1.5 (0.1) +1812%
% Revenues 18.0% 26.6% 21.5% 7.8% - 5.7% 13.9% 11.1% -2.9% -
20
Operating segments contribution to EBIT
Fishing income in 2011 at 13.7 M€ , i.e. up +10.2 M€.
Increase mainly due to rise in Rock Lobster and Toothfish prices and gross tuna volume
(10.8 Kt in 2011 vs 5 Kt in 2010).
Value-enhancing and processing activity yielded a positive income during 2011 (vs a loss in
2010).

21 21 * Change in evaluation of deferred tax
IFRS Simplified Balance sheet at 31 December 2011
M€ 31/12/11 31/12/10 31/12/11 31/12/10
Net fixed assets and
other non-current assets
97.2 95.5 Shareholders’ equity* 38.4 31.8
Long and medium term
financial debt
64.5 69.3
Other non-current
liabilities*
17.0 15.2
Current assets 26.2 18.5 Short-term financial debt 5.0 6.2
Cash and cash
equivalents
18.7 19.3 Other current liabilities 17.2 10.7
TOTAL ASSETS 142.1 133.2 TOTAL LIABILITIES 142.1 133.2
• Change in fixed assets: investments for 6.3 M€,
provision for vessel repairing recorded in assets for
0.8 M€, amortisation for -5.3 M€.
• Increase in current assets +7.7 M€ related to increase in
receivables (December sales of toothfish).
• Slight decrease in cash -0.6 M€.
• Decrease in financial debt: loan disbursement for
5.6 M€.
• Increase in other non-current liabilities because of the
negative valuation of hedging contracts (-1 M€) and
increase in deferred taxes (-0.6 M€).
• Increase in other current liabilities linked to business
acceleration and uppermost tax income liability(3 M€)

22
Other liabilities 17.0
Other liabilities 15.2
Net financial debt 50.9
Net financial debt 56.2
Shareholders’ equity 38.4
Shareholders’ equity 31.8
31/12/2011 31/12/2010
Liabilities
WC 9.0 WC 7.7
Net fixed assets and other non-
current assets 97.2
Net fixed assets and other non-
current assets 95.5
31/12/2011 31/12/2010
Assets
Tuna ships +
Factory
69.9
Southern seas fishing
27.3
Tuna ships +
Factory
65.8
Southern seas fishing
29.7
Gearing 1.32 1.77
M€
22
Gearing as at 30 December 2011
WC = Working Capital

23
Net debt31/12/10
56.2 M€
Net debt31/12/11
50.9 M€
Change in
financial debt
-5.9 M€
Change in cash
0.6 M€
23
Change in Net debt at 31 December 2011

24
M€ Dec. 2011 Dec. 2010
24
Cash flow statement 2011 vs 2010
19.2 15.4
-6.3 -9.8
18.6
11.5 11.0
-24.1
20.8 19.2
Operating cash flow benefits from the rise in profitability.
Investments in 2010 related to the tuna purse seiners Manapany and Bernica. In 2011: down
payments for Dolomieu and SEAS 44.
Financing operations for 2011 : dividends (-0.7 M€), loan disbursements (-5.6 M€) and financial
interests (-3.4 M€) vs positive cash flow in 2010 due to loans received and cash from finance
lease companies’shareholders.

Our projects and objectives for 2012
Yannick Lauri General Manager, member of the Board of Directors

Value enhanced tuna: A niche market for SAPMER
Indian Ocean
Tuna fishing 850 Kt
Purse seiner
Brine
270 Kt
26
Pacific
Ocean
3 500 Kt
Atlantic
Ocean
450 Kt Purse seiner
-40°C
SAPMER
2013
30 Kt
Longliners
-60°C and
fresh
150 Kt
Pole & line
Fresh
400 Kt
Value enhanced and processed at -
40°C in MDM factory into loins,
steaks, …
Canning industry Sashimi loins : grade
A+, grade A, grade
B
Frozen
steaks &
other
Market = 4 500 M€
Value enhanced tuna
Niche Markets Gross tuna
Price per kg = f(Quality)
1 € 5 € 10 €
Europe, the USA markets Japan market
Fishing
Value enhancing
and processing
Distribution
Estimated data

A proven success of our “top quality” range
Our current products: Value enhanced ‘Yellowfin’ catches
Our products Types of consumption/Markets Price
LOINS
Loins grade A : raw consumption (sushis,
sashimi…)
Loins grade B : cooked consumption
Main markets : Japan, EU
+++
STEAKS
Products from grade B loins : consumption half-
cooked
Markets : Europe, South-Africa, the USA
++
OTHER TOP
PRODUCTS
Top of the range products- loin central part
Saku block : raw consumption
Kirimi : half-cooked consumption or marinated
Markets : China, Japan, EU, the USA
+++
CO-
PRODUCTS
Under belly, collars, pieces: half-cooked,
marinated or grilled consumption
Markets : Japan, Korea, Spain
+
SAPMER : is one of the few international company offering such a
quality of products 27

Strengthening of our Tuna fleet in 2012
Arrival of DOLOMIEU
Naming ceremony on 22 March 2012
1st unloading expected in June 2012
Arrival of SEAS 44
Naming ceremony expected end of August 2012
Catch objectives after the arrival of the two new tuna ships : 30 000 tons / year
28
At sea
On shore
Optimization of our process and logistics
28
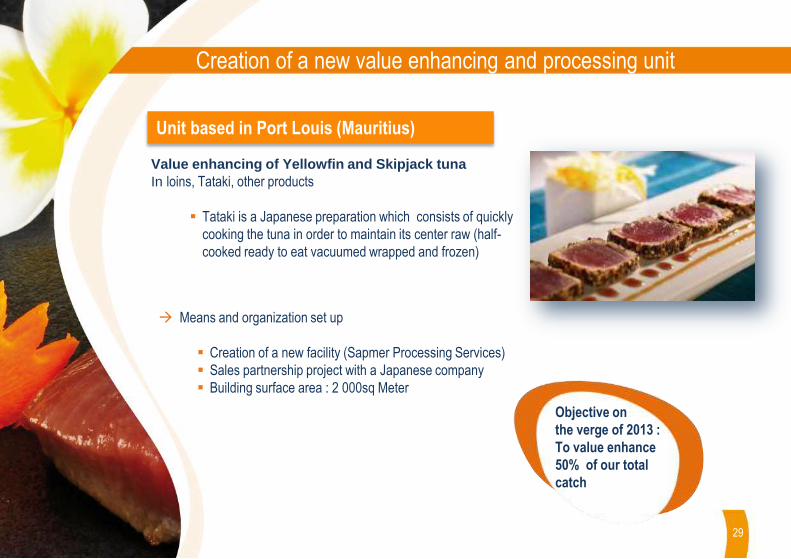
Creation of a new value enhancing and processing unit
Value enhancing of Yellowfin and Skipjack tuna
In loins, Tataki, other products
Tataki is a Japanese preparation which consists of quickly
cooking the tuna in order to maintain its center raw (half-
cooked ready to eat vacuumed wrapped and frozen)
Unit based in Port Louis (Mauritius)
Means and organization set up
Creation of a new facility (Sapmer Processing Services)
Sales partnership project with a Japanese company
Building surface area : 2 000sq Meter
Objective on
the verge of 2013 :
To value enhance
50% of our total
catch
29

A strengthened organisation to accompany its growth
General Manager
Deputy General Manager Naval Operation and Fishing Activity
Deputy General Manager Finance and Value enhancing Activity
STS
SMS
SPS
STS - Sapmer Technical Services – 2 persons
SMS - Sapmer Management Services – 6 persons
SPS – Sapmer Processing Services (on-going)
Simplified organization chart Currently in the process of recruiting
a Deputy General Manager
Hiring of 66 persons in 2012
(crew of the 2 new tuna ships)
30

Our objectives for 2012
31
Revenues: increase by around
10%
Net income : To keep a net profitability
of around 10%

Stockmarket news
Yannick Lauri General Manager, member of the Board of Directors

Breakdown of share capital at 31 December 2011
Total number of shares: 3 467 298
80.0%12.9%
5.0% 2.1%
Jaccar Holdings
Bearer and othershareholders
Oxaco
Directors andemployees
33
Oxaco Holding entered the capital in October 2011

Stock market data
Code ISIN : FR0010776617- ALMER
Share price when first introduced on stock market: 15 €/share
Highest share price over 1 year : 16.01 €
Lowest share price over 1 year : 11.05 €
Share price on 06/03/2012 : 16 €
Stock market capitalization on 06/03/2012 : 55.5 M€
Shareholders’ schedule
Annual General Shareholders’ Meeting 26 April 2012
H1 2012 Revenues 30 July 2012*
H1 2012 Results 20 September 2012*
SFAF meeting 20 September 2012 at 11:30a.m
Market price
*Press releases available before the opening of the stock market
34

35