Embed Size (px)
Citation preview

Presentation of Results for the year ended 31st March 2000
8th June 2000
Johnson MattheyJohnson Matthey

Johnson Matthey

OverviewOverview
Continuing businesses’ profits up 17% EMD sold for US$655 million Profit before tax up 10% to £143.8 million Double digit growth in all three divisions Earnings and dividend up 7%

StrategyStrategy
Strategy successfully implemented Investment for growth Fuel Cells Refocusing Colours & Coatings

Johnson Matthey

Summary ResultsSummary Results2000 1999
£m £m %
Turnover – Continuing 3,769 2,963 +27
Op. Profit – Continuing 146.5 125.0 +17
– Discontinued (0.3) 22.1
Interest (2.4) (15.9)
Profit before tax* 143.8 131.2 +10
EPS* 47.5p 44.3p +7
EPS 51.4p 49.3p +4
Dividend 20.3p 19.0p +7
* Excluding exceptionals

Operating Profit ContinuingOperating Profit Continuing
2000 1999 2000 at 1999 rates
£m £m % £m %
Catalysts & Chemicals 84.8 74.2 +14 83.6 +13
Precious Metals 45.4 37.3 +22 44.9 +20
Colours & Coatings 27.9 25.1 +11 29.2 +16
Corporate (11.6) (11.6) (11.5)
146.5 125.0 +17 146.2 +17

Return on SalesReturn on Sales
Sales ROS
2000 1999 Growth 2000 1999
£m £m % % %
Catalysts & Chemicals 856 677 +26 9.9 11.0
Precious Metals 2,672 2,041 +31 1.7 1.8
Colours & Coatings 241 244 -1 11.6 10.3
3,769 2,963 +27 3.9 4.2
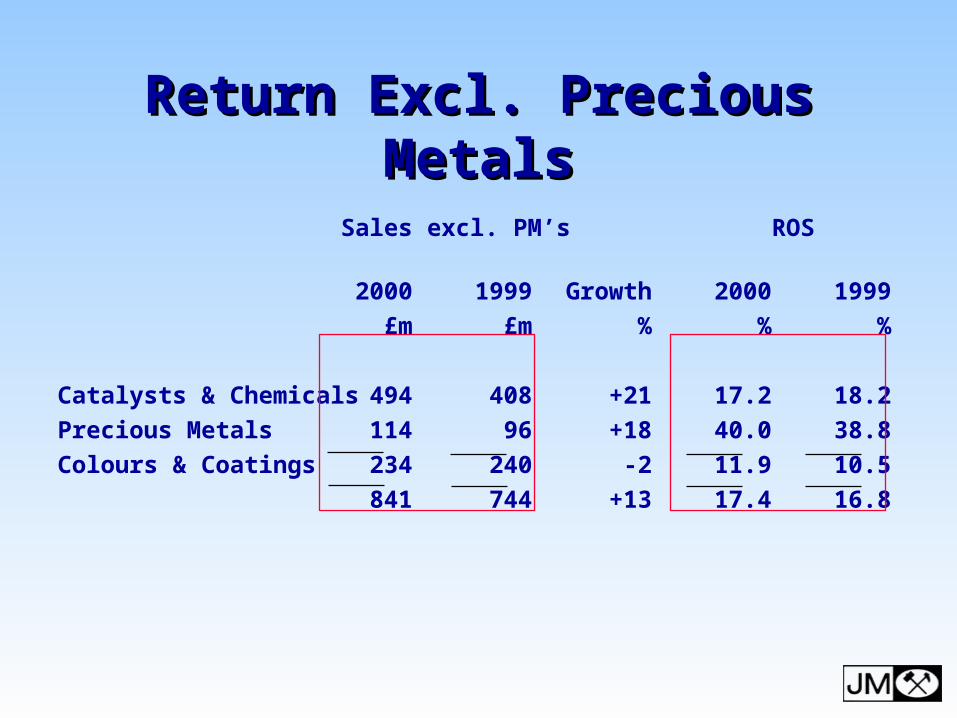
Return Excl. Precious MetalsReturn Excl. Precious Metals
Sales excl. PM’s ROS
2000 1999 Growth 2000 1999
£m £m % % %
Catalysts & Chemicals 494 408 +21 17.2 18.2
Precious Metals 114 96 +18 40.0 38.8
Colours & Coatings 234 240 -2 11.9 10.5
841 744 +13 17.4 16.8

1999£125.0m
58.1
54.1
9.2
3.6
2000£146.5m
52.2
69.3
16.2
8.8
Europe
Rest of World
Asia
North America
Geographical SplitGeographical SplitOperating Profit - Continuing

InterestInterest
2000 2000 2000 1999
1H 2H
£m £m £m £m
Financial (4.1) 3.9 (0.2) (14.6)
Gold & Silver leases (1.1) (1.1) (2.2) (1.3)
(5.2) 2.8 (2.4) (15.9)
Full Year
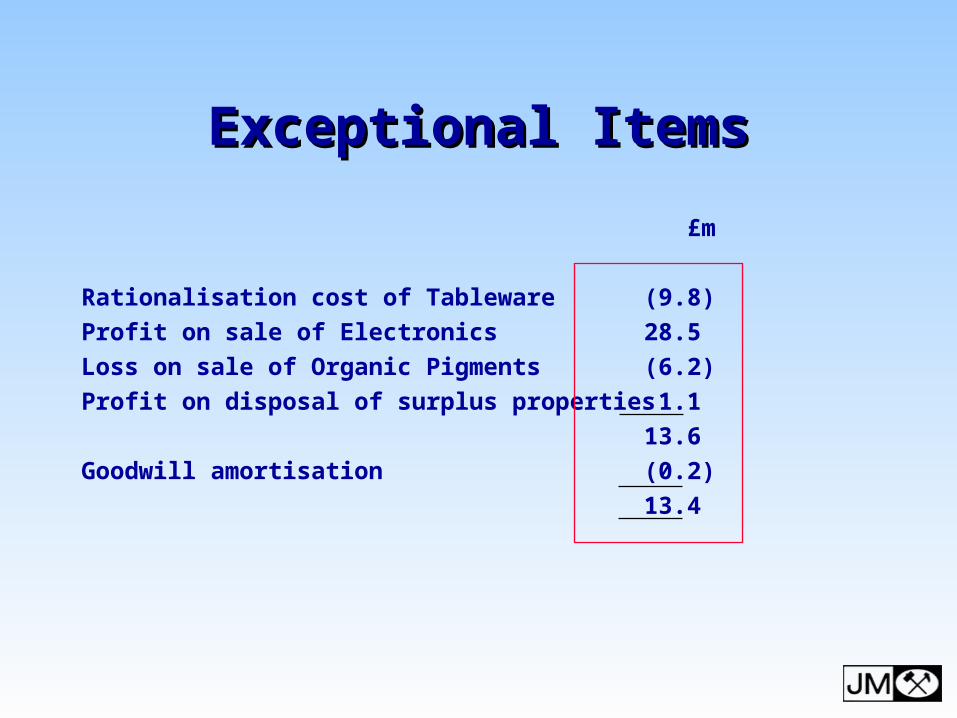
Exceptional ItemsExceptional Items
£m
Rationalisation cost of Tableware (9.8)
Profit on sale of Electronics 28.5
Loss on sale of Organic Pigments (6.2)
Profit on disposal of surplus properties 1.1
13.6
Goodwill amortisation (0.2)
13.4
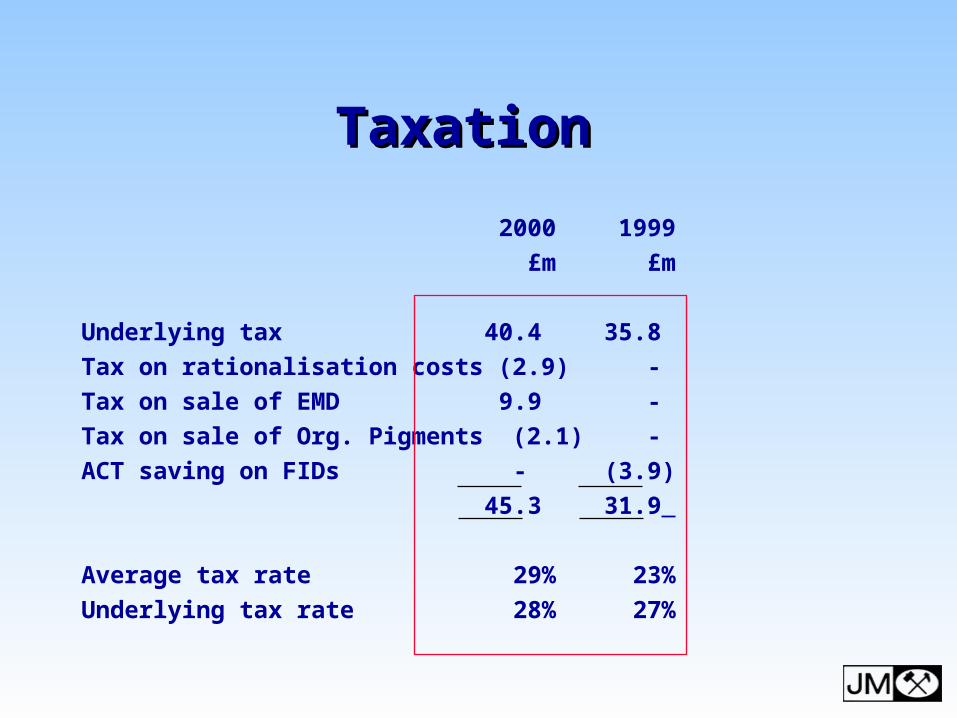
Taxation Taxation
2000 1999
£m £m
Underlying tax 40.4 35.8
Tax on rationalisation costs (2.9) -
Tax on sale of EMD 9.9 -
Tax on sale of Org. Pigments (2.1) -
ACT saving on FIDs - (3.9)
45.3 31.9
Average tax rate 29% 23%
Underlying tax rate 28% 27%

Return on InvestmentReturn on Investment2000 1999
£m £m
Operating profit 146.2 147.1
Average assets:
Equity and minorities 657 521
Cumulative goodwill 109 171
Net (cash) / borrowings 28 223
Total investment 794 915
Pre-tax ROA - continuing 24.2% n/a
- total 18.4% 16.1%
Post-tax ROA 13.2% 11.7%
Economic value added £32m £16m

Free Cash FlowFree Cash Flow
Continuing EMD TOTAL
2000 2000 2000
£m £m £m
Operating profit 136.1 0.1 136.2
Depreciation and amortisation 38.0 8.6 46.6
Working capital / other (54.5) 2.0 (52.5)
Cash flow from operations 119.6 10.7 130.3
Interest / tax / dividends (72.2) (5.9) (78.1)
Capital expenditure (gross) (63.4) (11.4) (74.8)
Sale of fixed assets 8.4 0.7 9.1
Free cash flow (7.6) (5.9) (13.5)
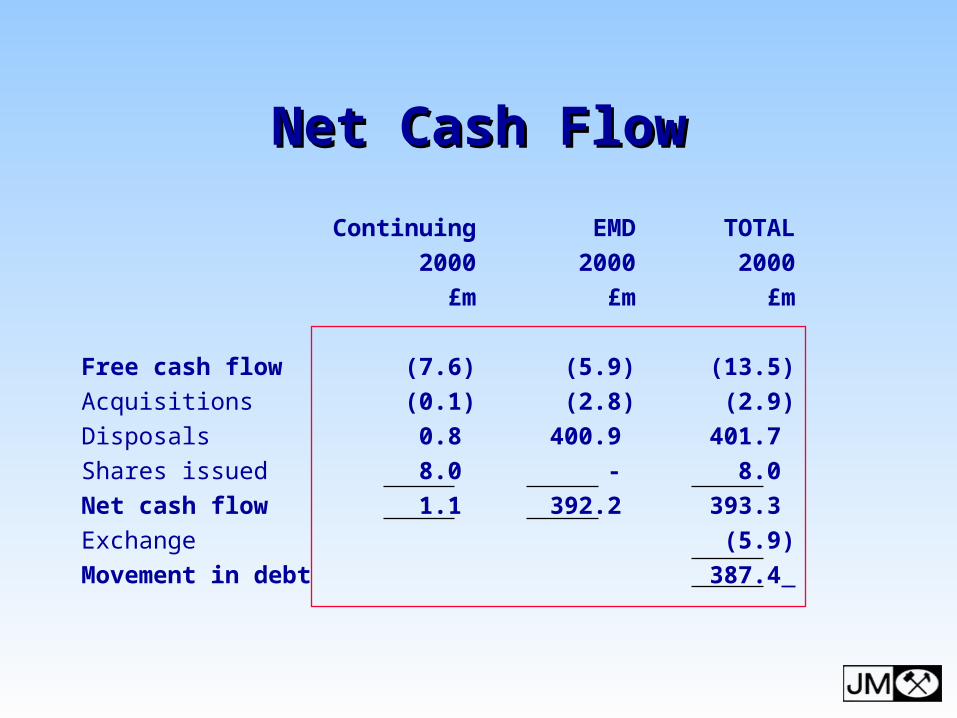
Net Cash FlowNet Cash Flow
Continuing EMD TOTAL
2000 2000 2000
£m £m £m
Free cash flow (7.6) (5.9) (13.5)
Acquisitions (0.1) (2.8) (2.9)
Disposals 0.8 400.9 401.7
Shares issued 8.0 - 8.0
Net cash flow 1.1 392.2 393.3
Exchange (5.9)
Movement in debt 387.4

GearingGearing
Mar 00 Mar 99
£m £m
Net (cash) / debt (166) 222
Equity and minorities 760 559
Capital employed 594 781
Gearing n/a 40%
Interest cover 61x 9x

Catalysts & Chemicals DivisionCatalysts & Chemicals Division
Operating ProfitSales
0
20
40
60
80
100
+14%+26%
1999 20001999 2000
677
856
74.2
84.8
£m £m
0
200
400
600
800
1000
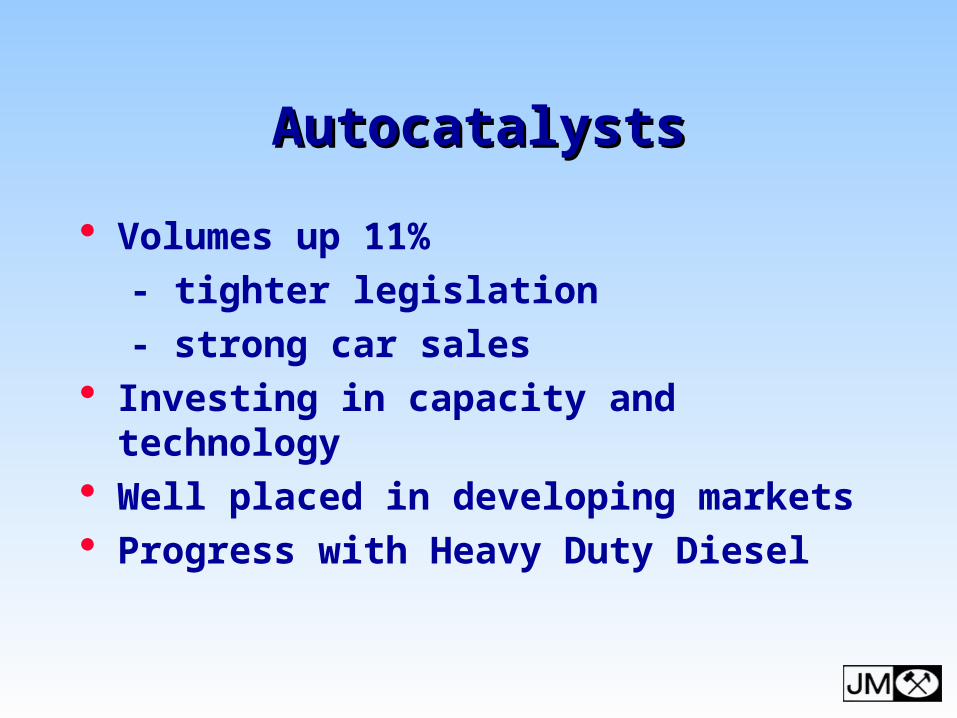
AutocatalystsAutocatalysts
Volumes up 11%
- tighter legislation
- strong car sales Investing in capacity and technology Well placed in developing markets Progress with Heavy Duty Diesel

Major Changes in Emissions LegislationMajor Changes in Emissions Legislation
Europe
USA
Fed 75 and amendments to CAA
Fed 75Fed 75 Tier 1
Euro I
Euro II
Euro III
Euro III(HDD)
Euro IV
Euro “V”(HDD)
Tier 2
LEV I(CAL.)
LEV II(CAL.)
Tier 1
8075 90 009585 051970 2010
Fed 75 USHDD
USHDD
Euro IV(HDD)
CAL.HDDTier 1
“I am very excited about fuel cells. I believe they’re going to be a significant part of our industry a lot sooner than many people think. I think that it’s possible that they could displace the internal combustion engine as the dominant source of power for consumer vehicles within my lifetime.”
William Clay Ford Jr,
Chairman, Ford Motor Company


Fuel CellsFuel Cells
£12 million being invested in development and testing capability
Customer collaborations on plan Securing supply base Fuel Reformer developed for residential
market


Chemicals Chemicals
PGM refining strong on back of higher prices
High throughput screening adding value for customers
Expansion of process catalyst manufacturing
Smoptech acquisition

Pharmaceutical MaterialsPharmaceutical Materials
Methylphenidate prices hit by competition Strong performance from carboplatin and
organics Good progress on new products New facility under way
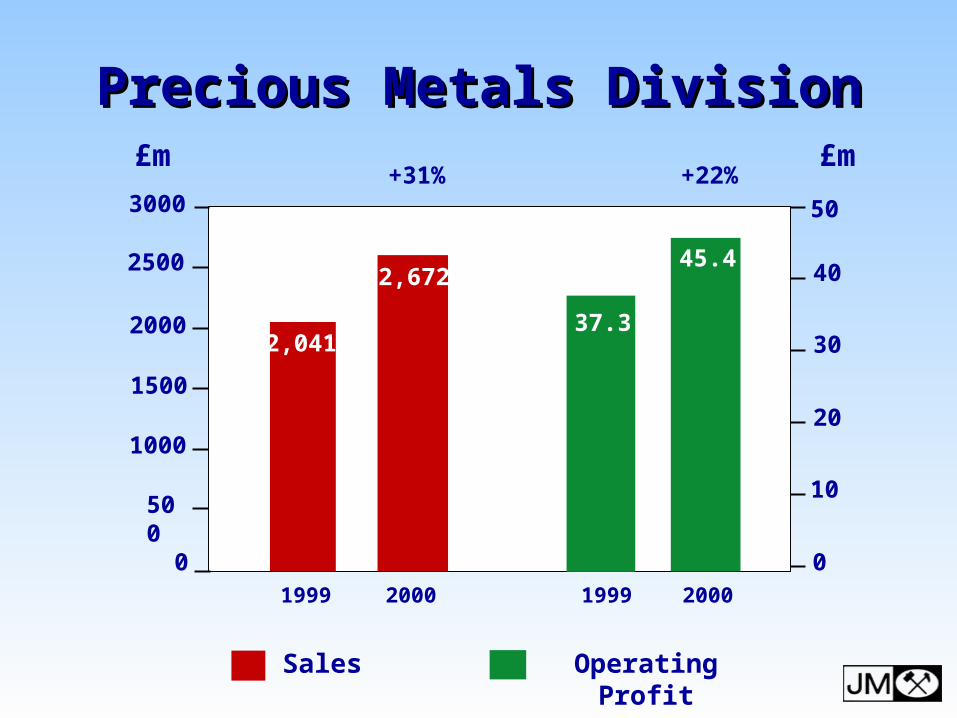
Precious Metals DivisionPrecious Metals Division
Operating ProfitSales
0
10
20
30
40
50
+22%+31%
1999 20001999 2000
2,041
2,672
37.3
45.4
£m£m
0
1000
1500
2000
2500
500
3000

Precious Metals DivisionPrecious Metals Division
Strong demand for pgms 50% growth in China jewellery Robust prices Good growth in fabricated products Outlook strengthening further with
uncertainty over palladium availability Gold satisfactory in difficult markets

Platinum & Palladium PricesPlatinum & Palladium Prices
April1998
$/oz900
800
700
600
500
400
300
200
100
0April2000
April1999
Palladium
Platinum
April1997

Colours & Coatings DivisionColours & Coatings Division
Operating ProfitSales
0
5
10
15
25
30
+11%-1%
1999 20001999 2000
244 241 25.1
27.9
£m £m
0
100
150
200
250
50
300
20

Colours & Coatings DivisionColours & Coatings Division
Underlying sales growth Margins up to 12% Focus on growth businesses Investment in Spain Expansion of facilities at Maastricht Exit from organic pigments complete

Colours & Coatings DivisionColours & Coatings DivisionRationalisation UpdateRationalisation Update
Spent £5.2 million out of £10 million provision Headcount reduced by 113 Singapore and Milan operations closed Closure of Burslem underway Annual savings of £2.8 million already
secured Savings of £4 million in current year and
£7 million p.a. thereafter

e - Commercee - Commerce
Longstanding internet presence Catalogue sales in US Expanding into Europe this year e-Procurement project Developments in car industry

Outlook Outlook
Prospects for growth very encouraging Investing in new technology and new
facilities Acquisition opportunities

Johnson Matthey