Embed Size (px)
Citation preview

SHIFT 2019 –Fusion–
Copyright© SEKISUI CHEMICAL CO., LTD. All Rights Reserved.
SEKISUI CHEMICAL CO., LTD.
Presentation of Financial Resultsfor the Third Quarter of Fiscal Year 2019, ending March 31, 2020
Keita KatoRepresentative Director, Senior Managing Executive Officer
Head of Business Strategy Department
January 30, 2020
Forex RateFY2018 FY2019
3Q 4Q 2H 3Q 4Q 2H
Assumption ¥111/US$¥127/€
¥113/US$¥128/€
¥112/US$¥128/€
¥106/US$¥118/€
¥109/US$¥121/€
¥108/US$¥120/€
Results(Avg. rate for each term)
¥113/US$¥129/€
¥110/US$¥125/€
¥112/US$¥127/€
¥109/US$¥120/€ ‐ ‐
Copyright© SEKISUI CHEMICAL CO., LTD. All Rights Reserved.
Results for 3Q FY2019 and Forecasts for FY2019
1
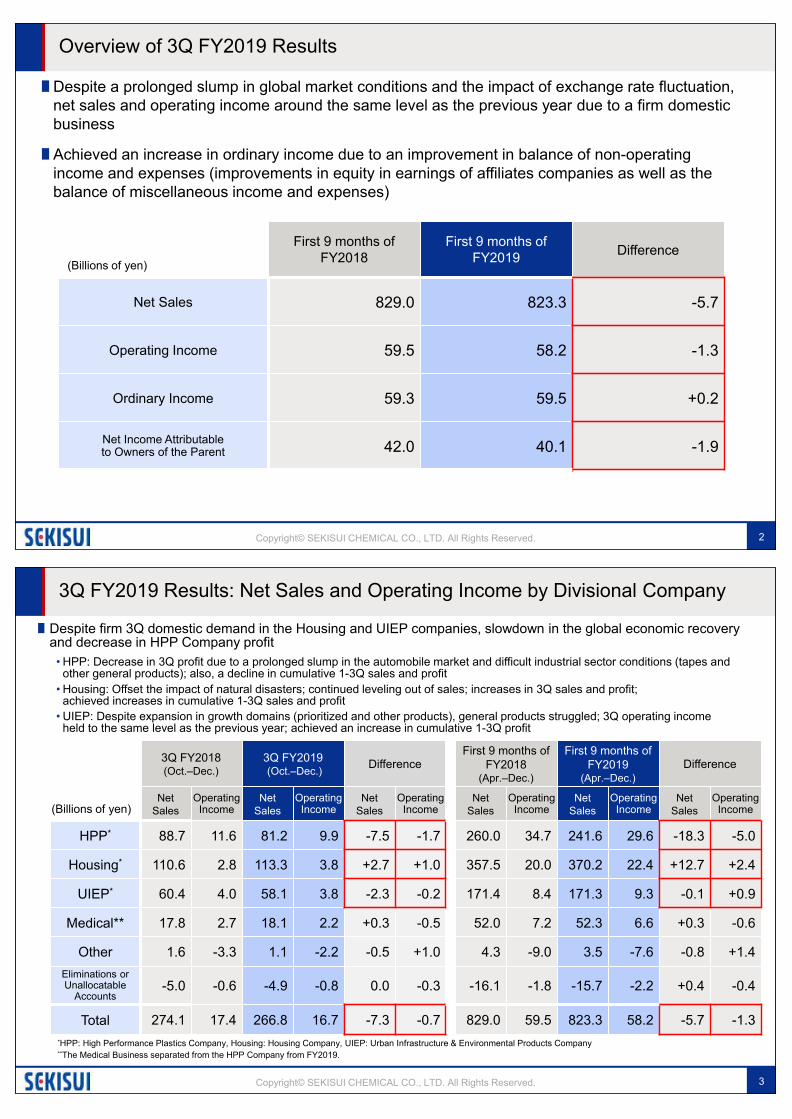
Overview of 3Q FY2019 Results
Copyright© SEKISUI CHEMICAL CO., LTD. All Rights Reserved.
First 9 months of FY2018
First 9 months of FY2019 Difference
Net Sales 829.0 823.3 -5.7
Operating Income 59.5 58.2 -1.3
Ordinary Income 59.3 59.5 +0.2
Net Income Attributable to Owners of the Parent 42.0 40.1 -1.9
∎Despite a prolonged slump in global market conditions and the impact of exchange rate fluctuation, net sales and operating income around the same level as the previous year due to a firm domestic business
∎Achieved an increase in ordinary income due to an improvement in balance of non-operating income and expenses (improvements in equity in earnings of affiliates companies as well as the balance of miscellaneous income and expenses)
(Billions of yen)
2
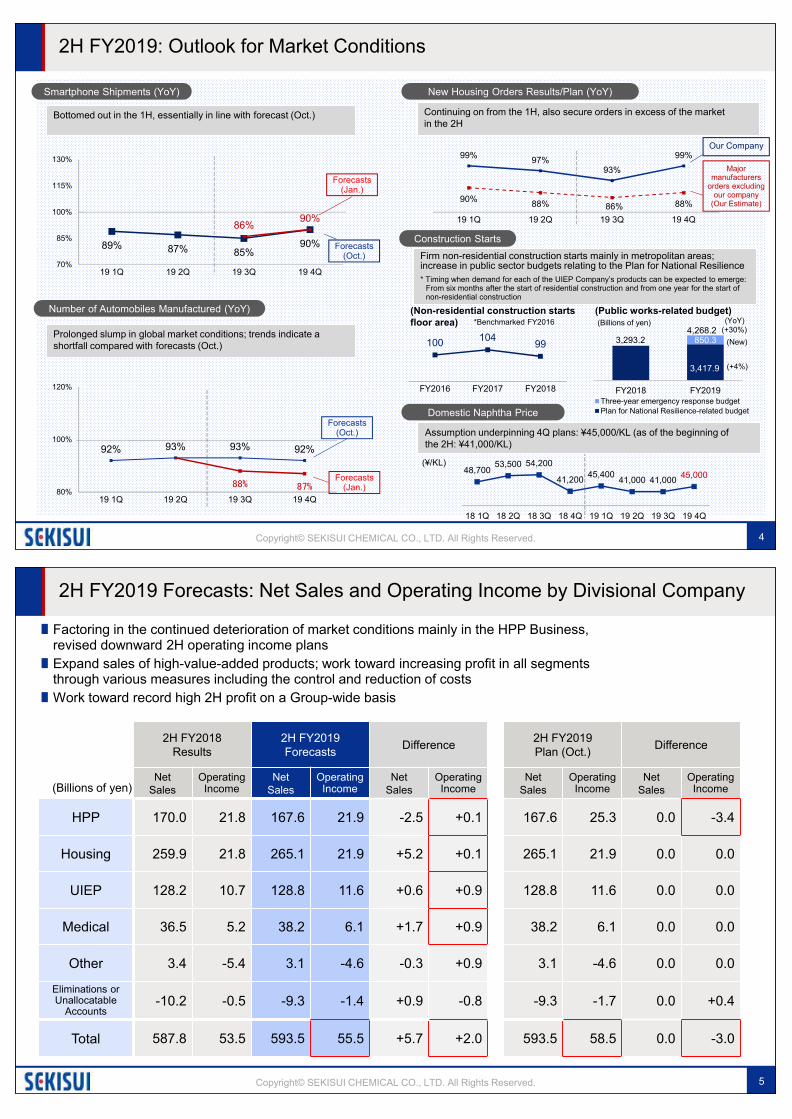
3Q FY2019 Results: Net Sales and Operating Income by Divisional Company
Copyright© SEKISUI CHEMICAL CO., LTD. All Rights Reserved. 3
∎Despite firm 3Q domestic demand in the Housing and UIEP companies, slowdown in the global economic recovery and decrease in HPP Company profit
3Q FY2018 (Oct.–Dec.)
3Q FY2019(Oct.–Dec.) Difference
First 9 months of FY2018
(Apr.–Dec.)
First 9 months of FY2019
(Apr.–Dec.)Difference
Net Sales
Operating Income
Net Sales
Operating Income
Net Sales
Operating Income
Net Sales
Operating Income
Net Sales
Operating Income
Net Sales
Operating Income
HPP* 88.7 11.6 81.2 9.9 -7.5 -1.7 260.0 34.7 241.6 29.6 -18.3 -5.0
Housing* 110.6 2.8 113.3 3.8 +2.7 +1.0 357.5 20.0 370.2 22.4 +12.7 +2.4
UIEP* 60.4 4.0 58.1 3.8 -2.3 -0.2 171.4 8.4 171.3 9.3 -0.1 +0.9
Medical** 17.8 2.7 18.1 2.2 +0.3 -0.5 52.0 7.2 52.3 6.6 +0.3 -0.6
Other 1.6 -3.3 1.1 -2.2 -0.5 +1.0 4.3 -9.0 3.5 -7.6 -0.8 +1.4Eliminations or Unallocatable
Accounts-5.0 -0.6 -4.9 -0.8 0.0 -0.3 -16.1 -1.8 -15.7 -2.2 +0.4 -0.4
Total 274.1 17.4 266.8 16.7 -7.3 -0.7 829.0 59.5 823.3 58.2 -5.7 -1.3
• HPP: Decrease in 3Q profit due to a prolonged slump in the automobile market and difficult industrial sector conditions (tapes and other general products); also, a decline in cumulative 1-3Q sales and profit
• Housing: Offset the impact of natural disasters; continued leveling out of sales; increases in 3Q sales and profit; achieved increases in cumulative 1-3Q sales and profit
• UIEP: Despite expansion in growth domains (prioritized and other products), general products struggled; 3Q operating income held to the same level as the previous year; achieved an increase in cumulative 1-3Q profit
(Billions of yen)
*HPP: High Performance Plastics Company, Housing: Housing Company, UIEP: Urban Infrastructure & Environmental Products Company**The Medical Business separated from the HPP Company from FY2019.
Copyright© SEKISUI CHEMICAL CO., LTD. All Rights Reserved.
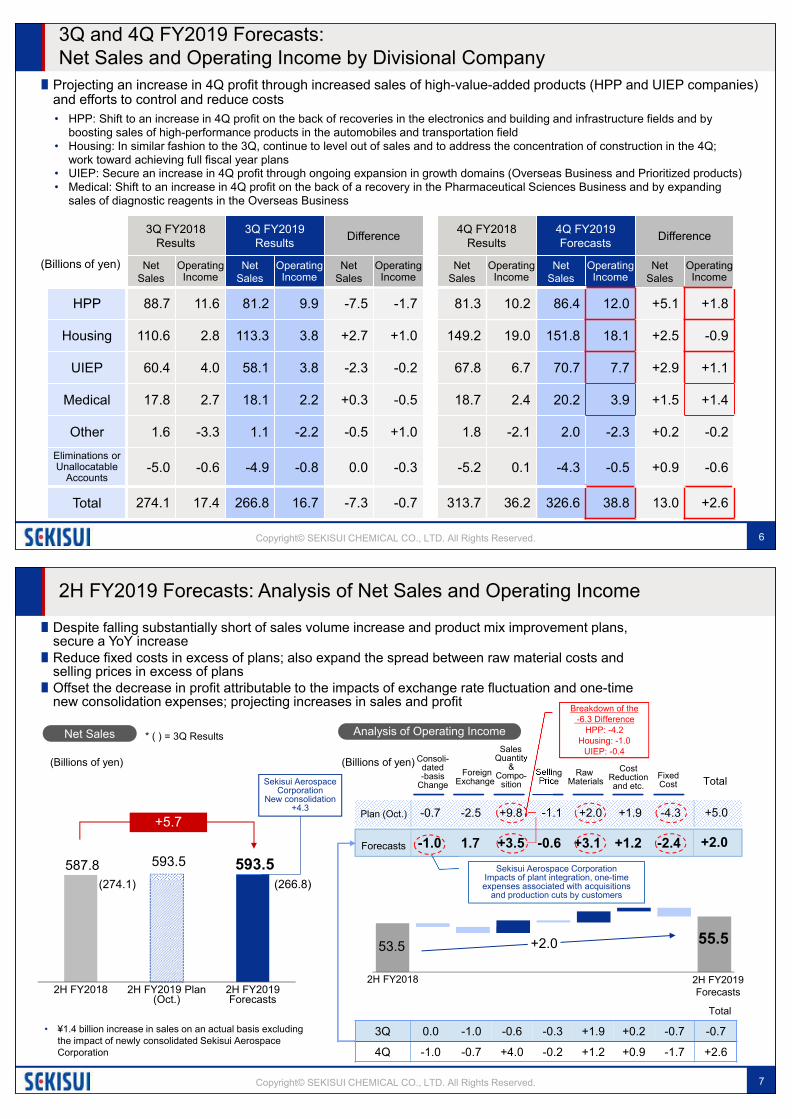
2H FY2019: Outlook for Market Conditions
100 104 99
FY2016 FY2017 FY2018
Bottomed out in the 1H, essentially in line with forecast (Oct.) Continuing on from the 1H, also secure orders in excess of the market in the 2H
Firm non-residential construction starts mainly in metropolitan areas; increase in public sector budgets relating to the Plan for National Resilience* Timing when demand for each of the UIEP Company’s products can be expected to emerge:
From six months after the start of residential construction and from one year for the start of non-residential construction
Assumption underpinning 4Q plans: ¥45,000/KL (as of the beginning of the 2H: ¥41,000/KL)
850.3
FY2018 FY2019Three-year emergency response budgetPlan for National Resilience-related budget
3,417.9
4,268.2 (+30%)
90% 88% 86% 88%
99% 97%93%
99%
19 1Q 19 2Q 19 3Q 19 4Q
3,293.2Prolonged slump in global market conditions; trends indicate a shortfall compared with forecasts (Oct.)
48,700 53,500 54,200
41,200 45,400 41,000 41,000 45,000
18 1Q 18 2Q 18 3Q 18 4Q 19 1Q 19 2Q 19 3Q 19 4Q
(¥/KL)
Smartphone Shipments (YoY)
Number of Automobiles Manufactured (YoY)
New Housing Orders Results/Plan (YoY)
Construction Starts
Domestic Naphtha Price
Our Company
Major manufacturers
orders excluding our company
(Our Estimate)
(Non-residential construction starts floor area) *Benchmarked FY2016
(Public works-related budget)(Billions of yen)
(New)
(+4%)
89% 87% 85%90%
86%90%
70%
85%
100%
115%
130%
19 1Q 19 2Q 19 3Q 19 4Q
Forecasts (Jan.)
Forecasts (Oct.)
92% 93% 93% 92%
88% 87%80%
100%
120%
19 1Q 19 2Q 19 3Q 19 4Q
Forecasts (Oct.)
Forecasts (Jan.)
(YoY)
4
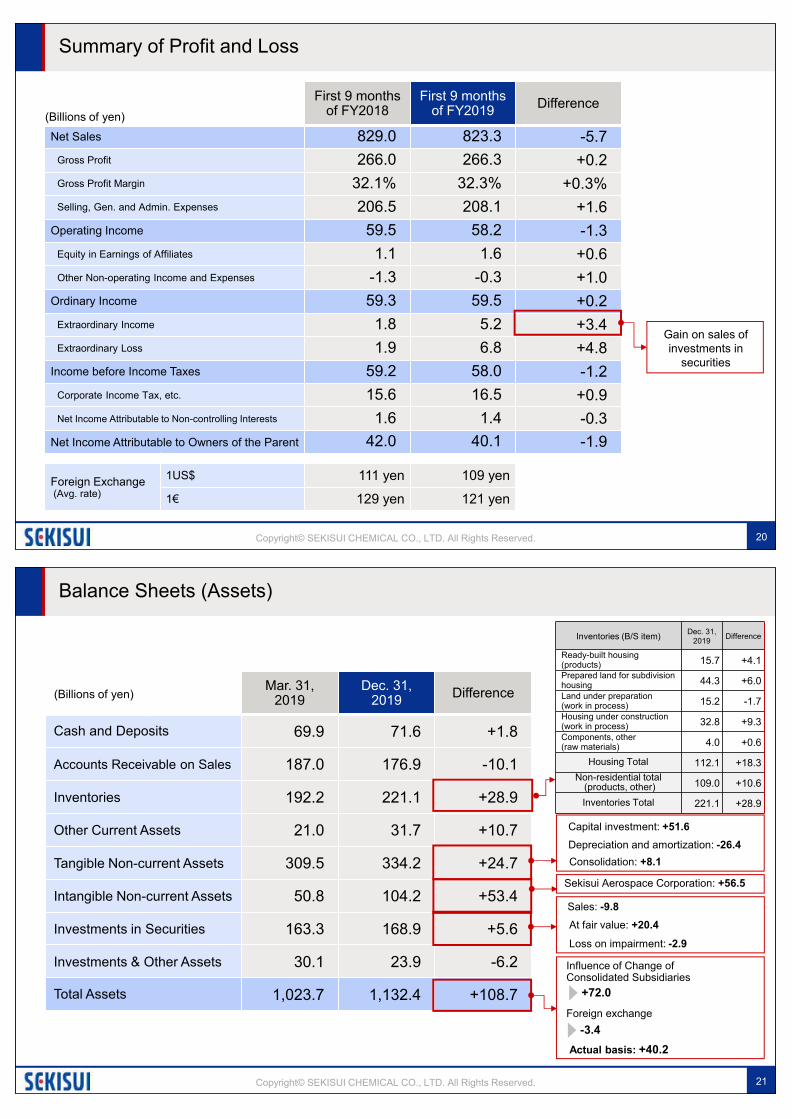
2H FY2019 Forecasts: Net Sales and Operating Income by Divisional Company
Copyright© SEKISUI CHEMICAL CO., LTD. All Rights Reserved.
∎ Factoring in the continued deterioration of market conditions mainly in the HPP Business, revised downward 2H operating income plans
∎ Expand sales of high-value-added products; work toward increasing profit in all segments through various measures including the control and reduction of costs
∎Work toward record high 2H profit on a Group-wide basis
2H FY2018 Results
2H FY2019 Forecasts Difference 2H FY2019
Plan (Oct.) Difference
Net Sales
Operating Income
Net Sales
Operating Income
Net Sales
Operating Income
Net Sales
Operating Income
Net Sales
Operating Income
HPP 170.0 21.8 167.6 21.9 -2.5 +0.1 167.6 25.3 0.0 -3.4
Housing 259.9 21.8 265.1 21.9 +5.2 +0.1 265.1 21.9 0.0 0.0
UIEP 128.2 10.7 128.8 11.6 +0.6 +0.9 128.8 11.6 0.0 0.0
Medical 36.5 5.2 38.2 6.1 +1.7 +0.9 38.2 6.1 0.0 0.0
Other 3.4 -5.4 3.1 -4.6 -0.3 +0.9 3.1 -4.6 0.0 0.0
Eliminations or Unallocatable
Accounts-10.2 -0.5 -9.3 -1.4 +0.9 -0.8 -9.3 -1.7 0.0 +0.4
Total 587.8 53.5 593.5 55.5 +5.7 +2.0 593.5 58.5 0.0 -3.0
(Billions of yen)
5
3Q and 4Q FY2019 Forecasts: Net Sales and Operating Income by Divisional Company
Copyright© SEKISUI CHEMICAL CO., LTD. All Rights Reserved.
∎ Projecting an increase in 4Q profit through increased sales of high-value-added products (HPP and UIEP companies) and efforts to control and reduce costs
3Q FY2018 Results
3Q FY2019 Results Difference 4Q FY2018
Results4Q FY2019 Forecasts Difference
Net Sales
Operating Income
Net Sales
Operating Income
Net Sales
Operating Income
Net Sales
Operating Income
Net Sales
Operating Income
Net Sales
Operating Income
HPP 88.7 11.6 81.2 9.9 -7.5 -1.7 81.3 10.2 86.4 12.0 +5.1 +1.8
Housing 110.6 2.8 113.3 3.8 +2.7 +1.0 149.2 19.0 151.8 18.1 +2.5 -0.9
UIEP 60.4 4.0 58.1 3.8 -2.3 -0.2 67.8 6.7 70.7 7.7 +2.9 +1.1
Medical 17.8 2.7 18.1 2.2 +0.3 -0.5 18.7 2.4 20.2 3.9 +1.5 +1.4
Other 1.6 -3.3 1.1 -2.2 -0.5 +1.0 1.8 -2.1 2.0 -2.3 +0.2 -0.2Eliminations or Unallocatable
Accounts-5.0 -0.6 -4.9 -0.8 0.0 -0.3 -5.2 0.1 -4.3 -0.5 +0.9 -0.6
Total 274.1 17.4 266.8 16.7 -7.3 -0.7 313.7 36.2 326.6 38.8 13.0 +2.6
• HPP: Shift to an increase in 4Q profit on the back of recoveries in the electronics and building and infrastructure fields and by boosting sales of high-performance products in the automobiles and transportation field
• Housing: In similar fashion to the 3Q, continue to level out of sales and to address the concentration of construction in the 4Q; work toward achieving full fiscal year plans
• UIEP: Secure an increase in 4Q profit through ongoing expansion in growth domains (Overseas Business and Prioritized products)• Medical: Shift to an increase in 4Q profit on the back of a recovery in the Pharmaceutical Sciences Business and by expanding
sales of diagnostic reagents in the Overseas Business
(Billions of yen)
6
2H FY2019 Forecasts: Analysis of Net Sales and Operating Income
Copyright© SEKISUI CHEMICAL CO., LTD. All Rights Reserved.
∎Despite falling substantially short of sales volume increase and product mix improvement plans, secure a YoY increase
∎Reduce fixed costs in excess of plans; also expand the spread between raw material costs and selling prices in excess of plans
∎Offset the decrease in profit attributable to the impacts of exchange rate fluctuation and one-time new consolidation expenses; projecting increases in sales and profit
2H FY2018 2H FY2019 Forecasts2H FY2018 2H FY2019 Plan
(Oct.)2H FY2019 Forecasts
587.8 593.5593.5
+5.71.7 -0.6+3.5 -2.4+3.1 +1.2-1.0
+2.0 55.553.5
+2.0
-2.5 -1.1+9.8 -4.3+2.0 +1.9-0.7 +5.0
3Q 0.0 -1.0 -0.6 -0.3 +1.9 +0.2 -0.7 -0.7
4Q -1.0 -0.7 +4.0 -0.2 +1.2 +0.9 -1.7 +2.6
(274.1) (266.8)
* ( ) = 3Q Results
Forecasts
Plan (Oct.)
Sekisui Aerospace Corporation
New consolidation+4.3
• ¥1.4 billion increase in sales on an actual basis excluding the impact of newly consolidated Sekisui Aerospace Corporation
Net Sales
(Billions of yen)
Analysis of Operating Income
(Billions of yen) Consoli-dated-basis
ChangeFixedCost
ForeignExchange
Sales Quantity
&Compo-
sitionSellingPrice
Raw Materials
CostReductionand etc. Total
Total
Breakdown of the-6.3 Difference
HPP: -4.2Housing: -1.0
UIEP: -0.4
Sekisui Aerospace CorporationImpacts of plant integration, one-time expenses associated with acquisitions
and production cuts by customers
7

FY2019 Forecasts: Net Sales and Operating Income by Divisional Company
Copyright© SEKISUI CHEMICAL CO., LTD. All Rights Reserved.
∎ Increase in sales and profit in the Housing and UIEP Companies as well as Medical Business; work toward record high profits in the UIEP Company and Medical Business
∎ Projecting a delay in the global economic recovery as well as the incidence of exchange rate fluctuation and one-time new consolidation expenses; decrease in HPP Company profit
∎ Progress in the selection and concentration of Group-wide R&D themes (Other segment)
FY2018Results
FY2019 Forecasts Difference FY2019
Plan (Oct.) Difference
Net Sales
Operating Income
Net Sales
Operating Income
Net Sales
Operating Income
Net Sales
Operating Income
Net Sales
Operating Income
HPP 341.3 44.9 328.0 41.6 -13.3 -3.3 328.0 45.0 0.0 -3.4
Housing 506.7 39.0 522.0 40.5 +15.3 +1.5 522.0 40.5 0.0 0.0
UIEP 239.2 15.0 242.0 17.0 +2.8 +2.0 242.0 17.0 0.0 0.0
Medical 70.7 9.6 72.5 10.5 +1.8 +0.9 72.5 10.5 0.0 0.0
Other 6.1 -11.1 5.5 -9.9 -0.6 +1.2 5.5 -9.9 0.0 0.0
Eliminations or Unallocatable
Accounts-21.3 -1.7 -20.0 -2.7 +1.3 -1.0 -20.0 -3.1 0.0 +0.4
Total 1,142.7 95.7 1.150.0 97.0 +7.3 +1.3 1,150.0 100.0 0.0 -3.0
(Billions of yen)
8
Overview of FY2019 Forecasts
∎Increase in sales; despite revising down operating income, expected to achieve ordinary income and bottom line plans
∎Projecting record high ordinary income and bottom line
∎Projecting record high bottom line for a seventh consecutive fiscal year
FY2018Results
FY2019Forecast Difference FY2019
Plan (Oct.) Difference
Net Sales 1,142.7 1,150.0 +7.3 1,150.0 0.0
Operating Income 95.7 97.0 +1.3 100.0 -3.0
Ordinary Income 93.1 97.0 +3.9 97.0 0.0
Net Income Attributable to Owners of Parent 66.1 67.0 +0.9 67.0 0.0
(Billions of yen)
Copyright© SEKISUI CHEMICAL CO., LTD. All Rights Reserved. 9

∎ Prolonged downturn in automobile market conditions; impacts also of exchange rate fluctuation and consolidated-basis changes; downward revision of 2H operating income plans
2H FY2018 2H FY2019 Plan (Oct.)
2H FY2019 Forecasts
170.0 167.6167.6
HPP Company
-1.0 +0.3-1.4 -0.3
21.921.8
Fixed Costs
Consolidated-basis
ChangeForeign
Exchange
Sales Quantity
& Compo-
sitionSelling Price
Marginal profit+2.2
Cost Reduction and etc.
Raw Materials
+0.1
-2.5
0.0
Analysis of Operating Income
Net Sales
-0.7 +4.5-2.1 -0.9 +0.7 +0.2 +3.5
2H FY2018 2H FY2019 Forecasts
+1.8
+0.1
Total
+2.3 +0.3
2H FY2019 Forecasts
3Q 0.0 -0.8 -1.7 -0.3 +1.2 -0.2 0.0 -1.7
4Q -0.1 -0.5 +2.0 0.0 +1.0 +0.2 +0.2 +1.8
Forecasts
Plan (Oct.)
Sekisui Aerospace CorporationImpacts of plant integration, one-time expenses associated
with acquisitions and production cuts by customers
Breakdown of the -4.2 DifferenceElectronics: +2.0
Automobiles and Transportation: -3.0Building and Infrastructure: 0.0
Industrial Sector: -1.4
Sekisui Aerospace Corporation
New consolidation+4.3
• ¥6.8 billion decrease in sales on an actual basis excluding the impact of newly consolidated Sekisui Aerospace Corporation.
∎ Progress in the reduction of fixed costs in line with plans; accelerate efforts aimed at rebuilding profit structures and systems with a view to the next fiscal year
∎ Shift to an increase in 2H profit on the back of soft raw material costs as well as recoveries in the electronics and building and infrastructure fields as well as the industrial sector (tapes and other general products)
(Billions of yen)
(Billions of yen)
Total
Copyright© SEKISUI CHEMICAL CO., LTD. All Rights Reserved. 10
7.5 5.8 6.1 7.5 8.1 6.8
10.37.6 7.4
7.5 7.26.8
FY183Q
FY184Q
FY191Q
FY192Q
FY193Q
FY194Q…
FY183Q
FY184Q
FY191Q
FY192Q
FY193Q
FY194Q
Forecast
Three Strategic Fields HPP Company
∎Despite steady recoveries and expansion of the Electronics as well as Building and infrastructure fields, difficult conditions in the Automobiles and Transportation field due to a prolonged slump in the automobile market
FY181Q
FY182Q
FY183Q
FY184Q
FY191Q
FY192Q
FY193Q
FY194Q
Forecast
4.3
FY181Q
FY182Q
FY183Q
FY184Q
FY191Q
FY192Q
FY193Q
FY194Q
Forecast14.4 15.5 16.1 13.1
0.7 1.5 1.70.3
FY181Q
FY182Q
FY183Q
FY184Q
FY191Q
FY192Q
FY193Q
FY194Q
Forecast
Net Sales in the Three Strategic Fields and the Status of Progress
Electronics
Automobiles and Transportation
Building and Infrastructure
(Billions of yen)
17.0 17.815.1 13.4 13.4
29.5 31.029.6 29.7 27.4
16.516.8 16.3
• After bottoming out in the 1H, modest recovery trend mainly in the (5G- and semiconductor-related) non-LCD field
• Expected to secure increases in 2H and full fiscal year profits
• Despite maintaining market share, difficult conditions due to the continued slump in global demand
• Plans for operations to commence at a new production line in Europe from the 1Q of FY2020
• Continued substantial growth of products for HUDs (3Q: +20% or higher*); refocus on expanding 4Q high-performance interlayer film sales (expand sales of products for HUDs in Europe, the U.S., and China; expand points of application on a global basis)
• Continued progress in expanding CPVC sales mainly in India• Thermal insulation and noncombustible materials also firm• Expected to secure increases in 2H and full fiscal year sales and
profits
14.9
28.2
16.7 17.515.9
15.3 13.5
28.333.8
17.7 18.2
* YoY volume basis
* Impact of withdrawal due to low profit marked in red
+6% +3%-9% -3% -5% +4%42% 43%
46%50% 52% 51%
Rate of high-performance interlayer film sales volume YoY growthNon-LCD field sales ratio
Net Sales (Billions of yen)
Liquid crystaldisplay
Non-LCD Standard films
Interlayer film sales volume
【Focus on the non-LCD field】 【High-performance interlayer film sales growth】
Growth Driver
29.5
* Impact of newly consolidated companies marked in red
(Billions of yen)
(Billions of yen)
High-performance
interlayer films
Copyright© SEKISUI CHEMICAL CO., LTD. All Rights Reserved. 11

+0.1
178.6 180.3 181.4
48.3 48.1 47.4
32.9 36.6 36.2
2H FY2018 2H FY2019 Plan(Oct.)
2H FY2019Forecasts
Frontier (Domestic and Overseas)RenovationHousing
∎ Progress essentially in line with 2H plans; projecting record high 2H profit
+2.6 -0.9 -1.6 -0.4 +0.9 -0.5 +0.1 0.0
• Housing: Despite falling short of plans for the number of houses sold, expected to achieve plans on the back of efforts to control costs; offset the impact of natural disasters; continued leveling out 3Qvs4Q sales
• Renovation: Despite the residual effects of the consumption tax rate hike, projecting a gradual recovery
Housing Company
Analysis of Operating IncomeNet Sales by Business
259.9 265.1265.1
+5.2
Fixed Costs
Marginal Profit
+1.2
21.821.9
+0.7 -0.3
Sales Factors
Fixed Costs
Fixed Costs
Marginal Profit
Marginal Profit
Fixed Costs
Marginal Profit
Factors
Housing:
+0.1 bil. yen
Renovation:
- 0.5 bil. yen
Frontier (Domestic): +0.4 bil. yen
Frontier (Overseas):+0.1 bil. yen
0.0
+0.1
0.0
2HFY2018
-1.1 -0.2 +0.1
Total
* ( ) = Rate of YoY growth
(+10%)
(-2%)
(+2%)
(+2%)
-0.1
2HFY2019
Forecasts
-0.3 +0.1
2H FY2019 Forecasts
3Q 4Q 2H Initial plan
Housing Orders (Units) -7% -1% -4% +/- 0%
Renovation Orders -7% +1% -3% +/- 0%
Order results and plan* YoY
3Q +0.4 +0.8 -0.3 -0.3 +0.1 +0.4 0.0 0.0 0.0 +1.0
4Q +0.8 -0.7 -0.8 0.0 -0.3 +0.3 -0.3 0.0 +0.1 -0.9
Total
Forecasts
Plan (Oct.)
Including Town and Community Development Business upfront costs
Number of houses sold+100 units
← +220 units compared with plan
Incidence of natural disaster recovery-related demand in the previous year
(Billions of yen) (Billions of yen)
Copyright© SEKISUI CHEMICAL CO., LTD. All Rights Reserved. 12
3Q 4Q
FY2017
FY2017
Re-accelerate efforts to expand orders for Company-owned land for built-for-sale housing (4Q plan: +24%*)
Ramp up efforts to further expand smart house sales (4Q plan:+31%*)
∎ Secure 4Q orders in line with the previous year’s level on the back of land and subdivision housing strategies as well as efforts to ramp up the expansion of smart house sales
2H Housing Order Plan
Despite a YoY decrease due to the impacts of natural disasters (downturn in the number of visitors, negotiation postponement) and the consumption tax rate hike, downturn held to 7% through efforts to strengthen first buyer subdivision operations (+5%) and an increase in smart houses (+30%)
Housing Company
Housing Oder(Units, YoY)
Detached houses -6%
ApartmentsBuildings -18%
Total 7%
3Q Orders by Type (Units, YoY)
Gradual improvement in consumer sentiment; first buyer demand forecast to remain firm
Number of customers secured in the 3Q in line with the previous year thanks to the diversification of promotion tools aimed at attracting customers (3Q:+/- 0*)
3Q 4Q
New Housing Orders
Overview of 3Q Results and 4Q Market Outlook
-7%+6%+1% -1%+1% +4%
2H Plan: -4%
FY2018
FY2019
FY2018
FY2019
Product Strategies
Land and Subdivision
Housing Strategies
Sales Force
Increase in the number of model home galleries (As of 3Q-end: +1%*) Roll out experience-based showrooms (AR・VR) nationwide
(As of 1H-end: 16 locations → As of 3Q-end: 18 locations → As of FY2019-end: 23 locations)
Strengthen the mainstay zero-energy house (ZEH) product and resilience function (Oct.)
Secure sufficient stock of land (Stock of land currently on sale as 3Q-end: +21%*; of which ready-built houses: +56%*)
Rebuilding/Built-for-sale Housing
Steel-frameNew Smart Power Station
Mainly for Rebuilding NEW DESIO / NEW DOMANI
1H launch of Smart Power Station Urban Oct. launch of New Smart Power Station and other products
78% 74% 74% 77% 78% 80%
24% 21%35%
52% 57% 60%28%
50% 73%
FY2016 FY2017 FY2018 1HFY2019
3QFY2019
2H FY2019Forecast
Smart House-related Indicators* *Installation rate for detached houses
FY2019 ZEH Ratio Target: 80%
ZEH
Solar
Storagebattery
Measure to Acquire Orders in 2H
*YoY
* YoY
Downward revision in 2H order plan: -4% (Plan at the beginning of the period: +/- 0%)
Launch of MIRAI-Class, a package product for the urban market (Jan.)
Detached houses +/- 0%Apartments Buildings -15%
Copyright© SEKISUI CHEMICAL CO., LTD. All Rights Reserved. 13

111.8 111.8 111.8
16.4 17.0 17.0
2H FY2018 2H FY2019 Plan(Oct.)
2H FY2019Forecasts
軸ラ
ベル
Japan Overseas
UIEP Company
Analysis of Operating IncomeNet Sales
∎While general products to struggle as a result of the negative correction in demand following the consumption tax rate hike, sales of prioritized products* are projected to expand steadily; to achieve 2H operating income plan
• Japan: Continued growth in prioritized products* (2H net sales forecast: +10%, YoY)• Japan: Reorganization of the production structure in line with plans; implement measures to constrain
fixed expenses• Overseas: Steady growth in FFU products (railway sleepers), high operating level; steady trends in
sheets for aircraft and medical use
-0.2 +0.7
10.711.6
-0.3+1.20.0 +0.3-0.1 +0.7 -1.0
-1.7
+0.9
0.0 +0.6 +0.9
2H FY2018 2H FY2019 Forecasts
FixedCosts
SalesQuantity
& Composition
SellingPrice
RawMaterials
CostReductionand etc. Total
Consolidated-Basis
ChangeForeign
Exchange
-0.1 +1.6
+0.9
128.2 128.8128.8
+0.6
(Billions of yen)
* Prioritized products:High-value-added products
with the potential for market growth and substitutability
2H FY2019 Forecasts
3Q 0.0 0.0 -0.4 -0.1 +0.4 +0.2 -0.3 -0.2
4Q 0.0 0.0 +1.6 -0.2 +0.4 +0.1 -0.7 +1.1
Total
Forecasts
Plan (Oct.)
Impact of structural
reform:-2.4
• Increase of ¥3.0 billion in net sales on an actual basis excluding the impact of structural reforms
Domestic prioritized products: +1.0Domestic general products: 0.0
(Billions of yen)
Copyright© SEKISUI CHEMICAL CO., LTD. All Rights Reserved. 14
15.6 16.4 17.014.0 13.4 12.3
14.5 13.6 12.9
2H FY2017 2H FY2018 2H FY2019Forecasts
4Q (Forecast)
3Q Restults
26.8 26.8 26.8
29.4 29.3 31.1
2H FY2017 2H FY2018 2H FY2019 Forecasts
4Q (Forecast)
3Q Results
Net Sales in the Three Strategic Fields and the Status of Progress
∎ YoY increase in the Piping and Infrastructure field; secure an increase in sales also in the Advanced Materials field on the back of robust overseas conditions; progress in structural reforms in the Building and Living Environment field
• Despite general product difficulties, prioritized products remain robust• Firm trend in rehabilitation pipe orders in Japan• Despite a slight overseas recovery in the IT sector, plant business dull
rebound in Japan
• Increase in net sales excluding the impact of structural reforms (2H: -2.4)
• Steady growth in prioritized product application
• Sheets: Despite growth for aircraft and medical use, slight difficulties for general use
• FFU products (railway sleeper application): Steady increase in use mainly in Europe and the U.S.
Piping and Infrastructure
Building and Living Environment
Advanced Materials
Three Strategic Fields
Prioritized Product Sales; Overseas Sales* * Including the export of domestic products
• Steady growth of both prioritized products and overseas sales
18.0 19.6 21.6
2H FY2017
Overseas Sales*
15.4 17.1 15.8
16.8 17.4 19.1
2H FY2017 2H FY2018 2H FY2019Forecasts
4Q (Forecast)
3Q Results
56.3 56.1
28.5 27.0
32.2 34.5
57.9
25.2
34.9
2H FY2018 2H FY2019 Forecasts
100109
120Growth index(2H FY17 as a
benchmark)
UIEP Company
Prioritized Product Sales
2H FY2017 2H FY2018 2H FY2019 Forecasts
(Billions of yen)
(Billions of yen)(Billions
of yen)
(Billions of yen) (Billions
of yen)
Copyright© SEKISUI CHEMICAL CO., LTD. All Rights Reserved. 15

• Steady progress in Japan and overseas; projected to achieve substantial increases in 2H sales and profit
• Progress in efforts to strengthen the development structure and systems (U.S. / POC*)
Diagnostics Business
Pharmaceutical Sciences Business (Pharmaceutical and Fine Chemicals, Drug Development Solutions)
∎Despite a decrease in 3Q profit, projected to achieve 2H operating income plan on the back of diagnostic reagent sales growth overseas and a recovery in the pharmaceutical sciences business in the 4Q
Medical Business
Trends in Net Sales by Business and the Status of Progress
2H FY2019 Forecasts
13.1 13.6 14.3 14.2 13.8 14.3 15.0 15.2
FY181Q
FY182Q
FY183Q
FY184Q
FY191Q
FY192Q
FY193Q
FY194Q
Forecast
3.3 4.3 3.5 4.52.4
3.7 3.04.7
FY181Q
FY182Q
FY183Q
FY184Q
FY191Q
FY192Q
FY193Q
FY194Q
Forecast
2H FY2018Results
2H FY2019 Plan (Oct.)
2H FY2019 Forecasts
36.5 38.2
+1.7Net Sales
38.2
Analysis of Operating Income
Foreign Exchange
5.2 6.1
+1.4-0.3
2H FY2018 2H FY2019Forecasts
0.9
+0.9
-0.3
-0.4 +1.5 +0.2 -0.4 0.9
0.0
3Q -0.2 +0.4 -0.3 -0.4 -0.54Q -0.1 +1.0 +0.3 +0.2 +1.4
Forecasts
Plan (Oct.)
* POC: Acronym for Point of Care; refers to timely onsite (clinics, etc.) diagnostics
Marginal Profit (Diagnostics
Business)
Marginal Profit (Pharmaceutical
Sciences Business)
Fixed Costs Total
(Billions of yen)
• Decline in 3Q orders as a result of customers’ circumstances; projecting a recovery in the 4Q
• Expanding orders of new active pharmaceutical ingredients; continued focus on expanding the CDMO* business
* Acronym for Contract Development and Manufacturing Organization; a business format that provides comprehensive services that extend from the development of formulations to the manufacture and commercial production of investigational new drugs
(Billions of yen)
(Billions of yen)
Copyright© SEKISUI CHEMICAL CO., LTD. All Rights Reserved. 16
Copyright© SEKISUI CHEMICAL CO., LTD. All Rights Reserved. 17

Results for 3Q FY2019
Copyright© SEKISUI CHEMICAL CO., LTD. All Rights Reserved. 18
Consolidated Companies
Number of Consolidated Companies
Impact of Change in the Number of Consolidated Companies
Mar. 31, 2019 Dec. 31, 2019 Difference
Consolidated Subsidiaries 153 163 Increased: 15 Subsidiaries*¹
Decreased: 4 Subsidiaries*²
Affiliates (Equity Method) 8 8 Increased: 0 Affiliates
Decreased: 0 Affiliates
First 9 months of FY2019 (YoY) Difference
Net Sales -0.6 bil. yenSEKISUI YOUNGBO HPP (WUXI) CO., LTD.and etc.*3
Operating Income -0.3 bil. yen
*³: Newly Consolidated from 1Q FY2019
*1: Sekisui Town Management Co., Ltd., SEKISUI SEIKEI IZUMO CO., LTD., SEKISUI YOUNGBO HPP (WUXI) CO., LTD., Sekisui Aerospace Corporation, etc. (including subsidiary reorganization)
*²: PT Cayman Limited, Sekisui Engineering Co., Ltd., Sekisui Chemical Singapore (Pte.) Ltd., KYUSHU SEKISUI KOHAN CO., LTD., etc.
Copyright© SEKISUI CHEMICAL CO., LTD. All Rights Reserved. 19
Summary of Profit and Loss
(Billions of yen)
First 9 months of FY2018
First 9 months of FY2019 Difference
Net Sales 829.0 823.3 -5.7Gross Profit 266.0 266.3 +0.2Gross Profit Margin 32.1% 32.3% +0.3%Selling, Gen. and Admin. Expenses 206.5 208.1 +1.6
Operating Income 59.5 58.2 -1.3Equity in Earnings of Affiliates 1.1 1.6 +0.6Other Non-operating Income and Expenses -1.3 -0.3 +1.0
Ordinary Income 59.3 59.5 +0.2Extraordinary Income 1.8 5.2 +3.4Extraordinary Loss 1.9 6.8 +4.8
Income before Income Taxes 59.2 58.0 -1.2Corporate Income Tax, etc. 15.6 16.5 +0.9Net Income Attributable to Non-controlling Interests 1.6 1.4 -0.3
Net Income Attributable to Owners of the Parent 42.0 40.1 -1.9
Foreign Exchange(Avg. rate)
1US$ 111 yen 109 yen1€ 129 yen 121 yen
Gain on sales of investments in
securities
Copyright© SEKISUI CHEMICAL CO., LTD. All Rights Reserved. 20
Balance Sheets (Assets)
(Billions of yen)Mar. 31,
2019Dec. 31,
2019 Difference
Cash and Deposits 69.9 71.6 +1.8
Accounts Receivable on Sales 187.0 176.9 -10.1
Inventories 192.2 221.1 +28.9
Other Current Assets 21.0 31.7 +10.7
Tangible Non-current Assets 309.5 334.2 +24.7
Intangible Non-current Assets 50.8 104.2 +53.4
Investments in Securities 163.3 168.9 +5.6
Investments & Other Assets 30.1 23.9 -6.2
Total Assets 1,023.7 1,132.4 +108.7
Sales: -9.8At fair value: +20.4Loss on impairment: -2.9
Capital investment: +51.6Depreciation and amortization: -26.4Consolidation: +8.1
Inventories (B/S item) Dec. 31, 2019 Difference
Ready-built housing (products) 15.7 +4.1Prepared land for subdivision housing 44.3 +6.0Land under preparation (work in process) 15.2 -1.7Housing under construction (work in process) 32.8 +9.3Components, other (raw materials) 4.0 +0.6
Housing Total 112.1 +18.3Non-residential total
(products, other) 109.0 +10.6
Inventories Total 221.1 +28.9
Foreign exchange-3.4
Influence of Change of Consolidated Subsidiaries
+72.0
Actual basis: +40.2
Sekisui Aerospace Corporation: +56.5
Copyright© SEKISUI CHEMICAL CO., LTD. All Rights Reserved. 21

Balance Sheets (Liabilities & Net Assets)
(Billions of yen)Mar. 31, 2019 Dec. 31, 2019 Difference
Non-interest-bearing Liabilities 337.1 346.3 +9.2Interest-bearing Liabilities 53.8 137.6 +83.8
(Net interest-bearing Liabilities) (-16.0) (65.9) (+82.0)Total Liabilities 391.0 483.9 +92.9Capital Stock etc. 209.2 209.0 -0.2Retained Earnings 408.0 414.3 +6.2Treasury Stock -44.3 -44.2 +0.1Unrealized Holding Gain on Securities 36.8 48.3 +11.5Non-controlling Interests 25.5 25.6 +0.2Other Net Assets -2.4 -4.4 -2.0Total Net Assets 632.7 648.6 +15.8Total Liabilities, Net Assets 1,023.7 1,132.4 +108.7
Equity to Total Assets (%) 59.3% 55.0% -4.3%
Bonds
+30.0
-13.3
Purchases of treasury stock
+12.7
Retirement of treasury stock
40.1
-21.3
Net income
Dividends paid
-12.7
Retirement of treasury stock
(Billions of yen)
Copyright© SEKISUI CHEMICAL CO., LTD. All Rights Reserved. 22
Consolidated Cash Flows
(Billions of yen)
First 9 months of FY2018 Free Cash Flow First 9 months of FY2019 Free Cash Flow(Billions of yen) (Billions of yen)
First 9 months of FY2018
First 9 months of FY2019
Operating Cash Flows 45.7 46.7
Investing Cash Flows -47.4 -83.7
Financing Cash Flows -8.4 36.8
Net Increase in Cash and Cash Equivalents -10.2 -0.9
Cash and Cash Equivalents at the End of Term 66.9 69.4Free Cash Flow=Operating Cash Flows + Investing Cash Flows - Dividends Paid -22.3 -59.4
FreeCashFlow
Working capital
Income taxes paid Other
Net invest-
ments in securities Other
Nettime
deposits
Net PPE,
intangibleassets
Profit after adjustment for depreciation
and Amortization,
etc.
Cash dividends
paid
Free Cash Flow
Operating Cash Flows: 45.7
Investing Cash Flows: -47.4
Working capital
Income taxes paid Other
Cash dividends
paidOther
Nettime
deposits
Net PPE,
intangibleassets
Operating Cash Flows: 46.7
Investing Cash Flows: -83.7
-1.9-50.6 4.3-17.7 5.3-15.373.4 0.8 -20.6 -42.7-40.8 0.8-20.1 5.0-14.876.6 -1.0 -22.4
-59.4-22.3
Profit after adjustment for depreciation
and Amortization,
etc.
Net invest-
ments in securities
Copyright© SEKISUI CHEMICAL CO., LTD. All Rights Reserved. 23

34.5 34.6 35.2 37.4 41.0
2.4 2.4 3.2 4.2 4.7
49.7 43.953.5
73.6 65.0
126.7 133.4 137.7 137.3 142.7
31.7 34.2 37.0 38.8 37.0
FY2015 FY2016 FY2017 FY2018 FY2019 PlanForecasts
Depreciation Goodwill and Other Amortization Capital Expenditures EBITDA Research and Development
First 9 months of FY2018
First 9 months of FY2019 Difference FY2018 FY2019
Forecasts Difference
Depreciation *1 27.1 30.0 +2.9 37.4 41.0 +3.6Goodwill and Other Amortization *2 3.2 3.0 -0.2 4.2 4.7 +0.5Capital Expenditures 57.3 46.8 -10.5 73.6 65.0 -8.6EBITDA *3 89.8 91.2 +1.4 137.3 142.7 +5.4Research and Development Expenditure
29.1 28.0 -1.2 38.8 37.0 -1.8
*1 Depreciation does not include amortization of M&A industrial property rights*2 Goodwill and Other Amortization = Goodwill amortization + Amortization of M&A industrial property rights*3 EBITDA = Operating Income + Depreciation + Goodwill and other amortization
Depreciation and Amortization, Capital Expenditures, Research and Development Expenditure
(Billions of yen)
Depreciation and Amortization, Capital Expenditures, Research and Development Expenditure
(Billions of yen)
Copyright© SEKISUI CHEMICAL CO., LTD. All Rights Reserved. 24
Copyright© SEKISUI CHEMICAL CO., LTD. All Rights Reserved. 25
This slide presentation may contain forward-looking statements. Such forward-looking statements are based on current expectations and beliefs and are subject to a number of factors and uncertainties that could cause actual results to differ materially from those expressed or implied by such statements due to changes in global economic, business, competitive market and regulatory factors.
Copyright© SEKISUI CHEMICAL CO., LTD. All Rights Reserved. 26
Copyright© SEKISUI CHEMICAL CO., LTD. All Rights Reserved. 27

FY2019 FY2018FY2017Full FY1H 2H (plan) Full FY
(plan) 1H 2H Full FY3Q 3Q
CO
NSO
LIDATE
Net Sales (Billions of yen) 256.9 113.3 265.1 522.0 246.9 110.6 259.9 506.7 497.8Housing 174.7 75.2 181.4 356.1 168.6 72.7 178.6 347.2 341.9Renovation 49.4 21.8 47.4 96.8 46.7 22.5 48.3 95.0 95.1Frontier (Domestic) 31.9 15.9 35.1 67.0 30.7 14.9 31.8 62.5 58.8
Real estate 26.8 13.6 29.8 56.6 26.0 12.7 26.7 52.7 49.0Residential Services 5.0 2.3 5.3 10.4 4.7 2.2 5.1 9.8 9.8
Overseas 1.0 0.4 1.1 2.1 0.8 0.6 1.1 2.0 1.9
OTH
ERS
1. Number of houses sold (Housing units) 5,425 2,270 5,720 11,145 5,380 2,200 5,560 10,940 10,820
Detached houses 5,120 2,155 5,340 10,460 5,030 2,120 5,170 10,200 9,880Heim 4,050 1,660 4,260 8,310 4,080 1,690 4,200 8,280 8,270Two-U 1,070 495 1,080 2,150 950 430 970 1,920 1,610
Apartments buildings 305 115 380 685 350 80 390 740 9402. Main dataPrices <Sales subsidiaries: Detached houses>/ Unit (Millions of yen) 31.4 31.9 ‐ ‐ 30.9 32.0 31.5 31.2 31.1
Prices <Sales subsidiaries: Detached houses>/ Tsubo(3.3 Square meter)(10 Thousands of yen) 85.9 87.9 ‐ ‐ 84.1 85.4 85.2 84.6 83.5
Floor space (Square meter) 120.6 119.8 ‐ ‐ 121.3 123.6 122.0 121.7 122.9Exhibition places (Units) 447 445 ‐ 450 429 443 ‐ 430 419Sales staff (Number of person) 2,636 2,544 ‐ 2,488 2,646 2,571 ‐ 2,515 2,367Rebuilding ratio (%)* 24% 23% 23% 24% 28% 27% 28% 28% 29%Referral sales ratio (%)* 33% 33% 33% 33% 33% 35% 36% 34% 33%
* Rebuilding ratio and Referral sales ratio are based on time of orders-received.
Housing Company Results and Plan
1. Main data in Housing business
Copyright© SEKISUI CHEMICAL CO., LTD. All Rights Reserved. 28
FY2019 FY2018 FY2017
1H 2H (plan) Full FY (plan) 1H 2H Full FY 1H 2H Full FY
3Q 3Q 3QYear-start Backlog 219,500 217,320 217,320 - 206,900 213,900 213,900 - 206,000 207,800 207,800 -
Growth Rate +6% +2% +2% - ±0% +3% +3% - ±0% ±0% ±0% -New Orders 203,590 93,241 209,665 413,225 206,423 99,520 217,375 423,798 202,957 92,818 207,061 410,018
Growth Rate -1% -6% -4% -2% +2% +7% +5% +3% ±0% -1% ±0% ±0%Sales of Housing/Renovation 205,770 88,861 211,585 417,355 199,423 87,920 211,775 411,198 201,157 80,618 207,961 409,118
Growth Rate +3% +1% ±0% +1% -1% +9% +2% +1% ±0% -5% ±0% ±0%End-balance 217,320 221,700 215,400 - 213,900 225,500 219,500 - 207,800 220,000 206,900 -
Growth Rate +2% -2% -2% - +3% +3% +6% - ±0% +2% ±0% -
FY2019 FY2018FY2017Full FY1H 2H (plan) Full FY (plan) 1H 2H Full FY
3Q 3QHousing starts* 466,692 225,000 424,000 890,692 491,418 245,907 461,518 952,936 946,396Privately-owned houses* (included in above) =A 152,973 70,500 124,000 276,973 146,498 75,891 141,212 287,710 282,111Detached house sales by our company=B (Unit base) 5,120 2,155 5,340 10,460 5,030 2,120 5,170 10,200 9,880
Our share in Detached houses=B/A 3.3% 3.1% 4.3% 3.8% 3.4% 2.8% 3.7% 3.5% 3.5%
FY2019 FY2018 FY2017Full FY1H 2H (plan) Full FY (plan) 1H 2H Full FY
3Q 3QSolar power generation systems installed 77% 78% 80% 79% 75% 72% 73% 74% 74%
Tiled exterior walls (Heim type JX) 69% 68% 69% 69% 73% 73% 72% 73% 71%Storage battery installed 52% 57% 60% 56% 30% 38% 40% 35% 21%Comfortable Air System 78% 75% 76% 77% 76% 76% 79% 77% 76%
* “Housing starts” and “Privately-owned houses” after 3Q of FY2019 are based on forecasts.
Housing Company Results and Plan
2. Housing orders
(Millions of yen)
3. Housing starts
(Units)
4.The ratio of the houses equipped with the high-performance specifications
Copyright© SEKISUI CHEMICAL CO., LTD. All Rights Reserved. 29


![Shf Viability Guidelines[1]](https://img.pdfslide.us/doc/110x75/5520201b497959892f8b4772/shf-viability-guidelines1.jpg)

