Embed Size (px)
Citation preview

Investor RelationsPresentation

1
Content1. Company Overview2. What We’re Doing Right3. 1H Results & 2H Outlook4. What We're Aiming
* Financial numbers are parent basis unless statedotherwise
* Disclaimer2Q financial numbers included in the presentation represent statements made prior to external review by independent public accountants, and are presented here today solely for the purposeof offering investors an understanding of the company.

Highlights
• On apple-to-apple comparison, OP would have grown 20.7% during ’04~05 • High export growth track of 27% p.a. over the past 3 years• Stronger balance sheet : Net debt/equity ratio from 50% to 35%
• Market Leader in China – No. 1 market share in excavator• Stronger global market leadership : gaining share from major regions
• Developed aspirational vision• Formulated concrete mid-term strategy to realize vision• Solid strategy implementation program in progress
• Proven management capability during Doosan Group’s remarkable turnaround • Deploy internal top talents and hire global new talents• Motivate people by aligning performance with strong incentive scheme
Improvingfinancial
performance
Growth drivenby stronger
global presence
Solid long term strategy
Management capability

Company Overview
4
Overview
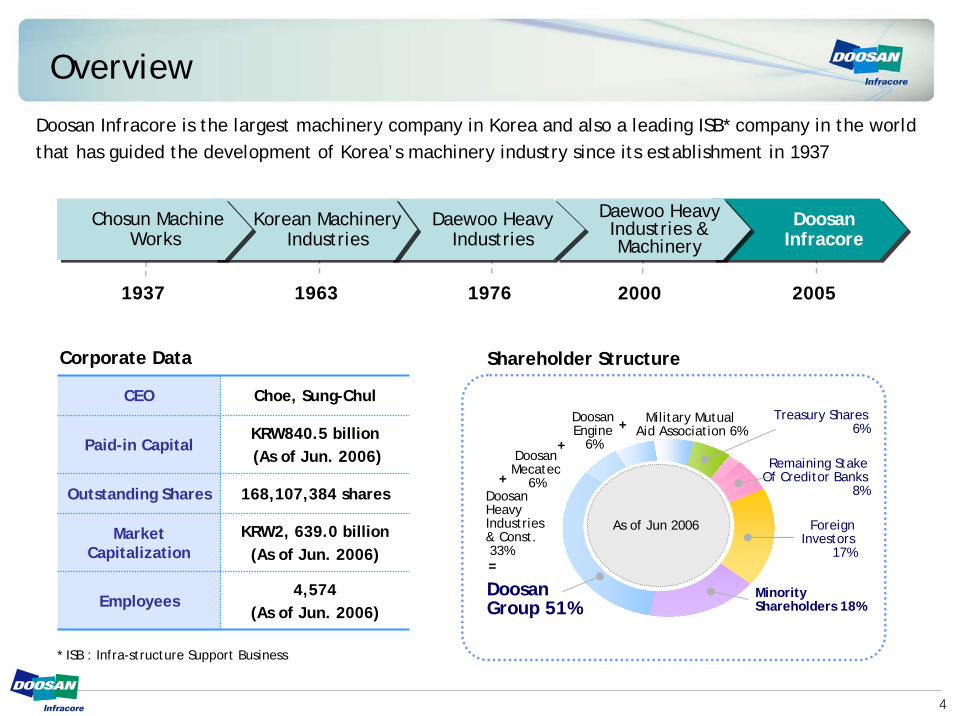
Doosan Infracore is the largest machinery company in Korea and also a leading ISB* company in the worldthat has guided the development of Korea’s machinery industry since its establishment in 1937
* ISB : Infra-structure Support Business
Chosun Machine Works
Korean MachineryIndustries
Daewoo Heavy Industries
Daewoo Heavy Industries & Machinery
Doosan Infracore
1937 1963 1976 2000 2005
Corporate Data
CEO Choe, Sung-Chul
Paid-in CapitalKRW840.5 billion(As of Jun. 2006)
Outstanding Shares 168,107,384 shares
Market Capitalization
KRW2, 639.0 billion (As of Jun. 2006)
Employees4,574
(As of Jun. 2006)
Shareholder Structure
DoosanGroup 51%
Remaining StakeOf Creditor Banks
8%
As of Jun 2006 ForeignInvestors
17%
MinorityShareholders 18%
DoosanHeavyIndustries & Const.33%
DoosanMecatec
6%
DoosanEngine
6%
Military Mutual Aid Association 6%
Treasury Shares6%+
+
+
=

5
Business AreaDiverse business portfolio including construction equipment, machine tools, industrial vehicles, engines and defense industry
Diesel engines,
gas engines
Turning centers, machining centers
Excavators, wheel loaders, tower cranes, concrete pump trucks, skid steer loaders
Sales Breakdown (01~05)
Construction Equipment
Machine Tools
Industrial VehiclesEngines
33%
21%19%
14%12%
0%
10%
20%
30%
40%
'01 '02 '03 '04 '05
OthersDefense industry & A/S
Fork lift trucks

6
Global Business Network
4
364
164
2
205
2
Americas
1
264
판매법인딜러생산법인
1
Europe AsiaOceania
Africa, Middle East
Sales Subsidiary
DealerProductionSubsidiary
3 overseas production facilities and 8 sales subsidiaries & 897 dealership networks
Number of Dealers Per Annum
2003 2004 2005
139 233
145
401
Engines 84 99 118
897
134
376
748
126
Machine Tools 128
Total 709
Industrial Vehicles 371
Construction Equipment
What We’re Doing Right

8
Greater Profitability (Parent + Subsidiaries)
Exclusive of accounting policy change in 2004, salesgrowth would have been higher at CAGR 9%
Unit : KRW billion
Operating Profit ’04~’06Sales ’04~’06
2,000
3,000
4,000
2004 2005 2006E
Without the presence of PMI costs, operating profitwould have been on a steady uptrend
Sales Reflective of Accounting Policy ChangeSales Retroactively Applying Change in Accounting Policy
CAGR 6%
CAGR 9%
285.0
368.1
20.7%
29.2%236.1
2004 2005 2006E
Apple-to-apple comparison – OP inclusive of PMI costs

9
Improved Financials (Parent Basis)
EBITDA & CAPEX TrendNet Debt Trend
105%
124%
152%
50%
21%
71%
16%35%
50%
0%
50%
100%
150%
End-2004 End-2005 End-2006E
Liabilities/Equity Ratio
Debt/Equity Ratio
Net Debt/ Equity Ratio
323.1
295.7263.2
77.389.3
56.2
0
50
100
150
200
250
300
350
2004 2005 2006(E)
Note : Apple-to-apple comparison – EBITDA inclusive of PMI costs
Unit : KRW billion
Note : Not considering M&A activities
EBITDACAPEX

10
Cost Reduction from Operational Innovation
COMPLETED in 2005 IN PROCESS in 2006
173 156
17
123 108
15
298 286
12
168 150
18
Unit : KRW billion
FORK LIFT ENGINE
DIRECT partsMRO / INDIRECT parts
+ +
Operating profit to improve by KRW30 billion in 2006
PROCUREMENTIMPROVEMENT
PROCUREMENTIMPROVEMENT
DESIGNIMPROVEMENT
DESIGNIMPROVEMENT

11
Stronger Market Presence in All Business Areas
Unit : %ConstructionEquipment
MachineTools
IndustrialVehicle Engines
46%
41%43%
39%
4.5%3.9%
4.0% 5.2%
'03 '04 '05 1H06
※ Source : Off Highway Research
26%
33% 34%39%
3.0%3.4%
4.2%
'03 '04 '05 1H06
4.5%
※ Metal working inside report
58%57%
59% 59%
3.7%3.9%
3.7%
4.1%
'03 '04 '05 1H06
※ WITS Shipment Basis (ITA Basis in US)
Daewoo Bus
43%
37% 36%39%
25%
28%26%
TataCommercial
Vehicle
'03 '04 '05 1H06
27%
※ WITS Shipment Basis (ITA Basis in US)
※ Based on registered vehicles by KAMA and data from Daewoo Motor Sales’ competitors
DomesticOverseas
Domestic
Overseas
Domestic
Overseas
Domestic market leader and market share expansion overseas
45%July 06
12
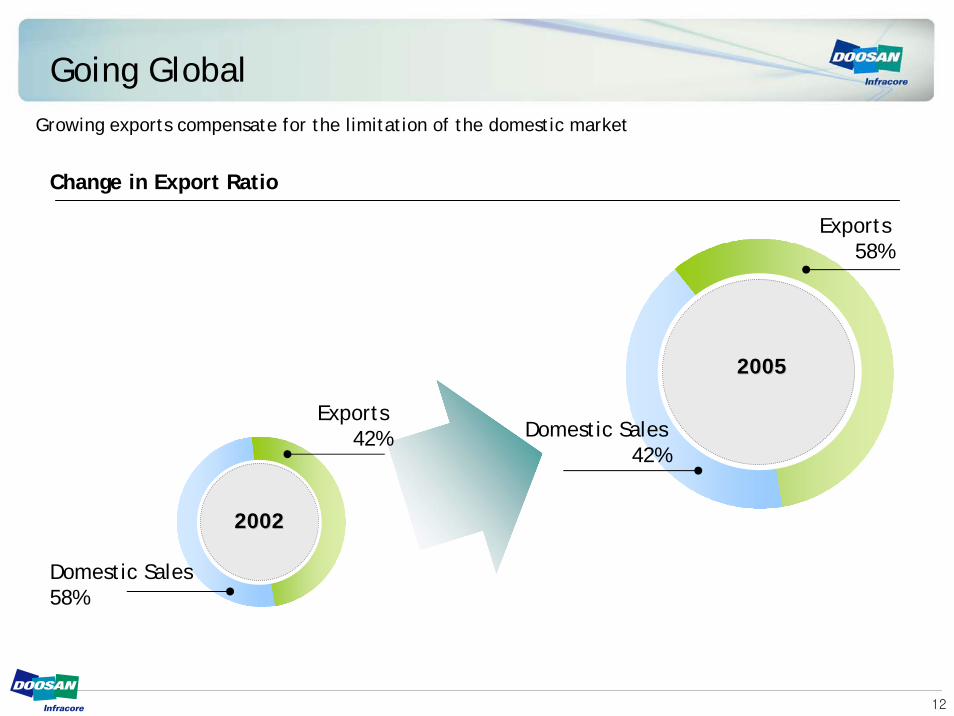
Growing exports compensate for the limitation of the domestic market
Change in Export Ratio
Domestic Sales58%
Exports42%
20022002
Exports58%
20052005
Domestic Sales42%
Going Global

13
Successful Global Business
Export Growth Trend
OthersEngines & MaterialsIndustrial VehicleMachine Tools & F.AConstruction Equipment
500
1,000
1,500
2,000
02 03 04 05
CAGR 27%
* Export growth was even higher at CAGR 35% during 2002~2005 based on US dollar terms
Unit : KRW billion
29%
26%
20%
40%
12%
CAGR

14
Market Leader in China
0%
20%
40%
60%
80%
100%
'03 '04 '05 1H06
HitachiKomatsuCaterpillarHyundaiDoosan
Dominant No. 1 market position in China
18.2% 19.4% 19.6% 19.6%
22.9% 22.4% 20.1% 18.9%
12.1% 9.3%9.3% 8.8%
17.6%13.8% 15.1% 17.4%
14.8%16.2% 15.1% 13.6%
15
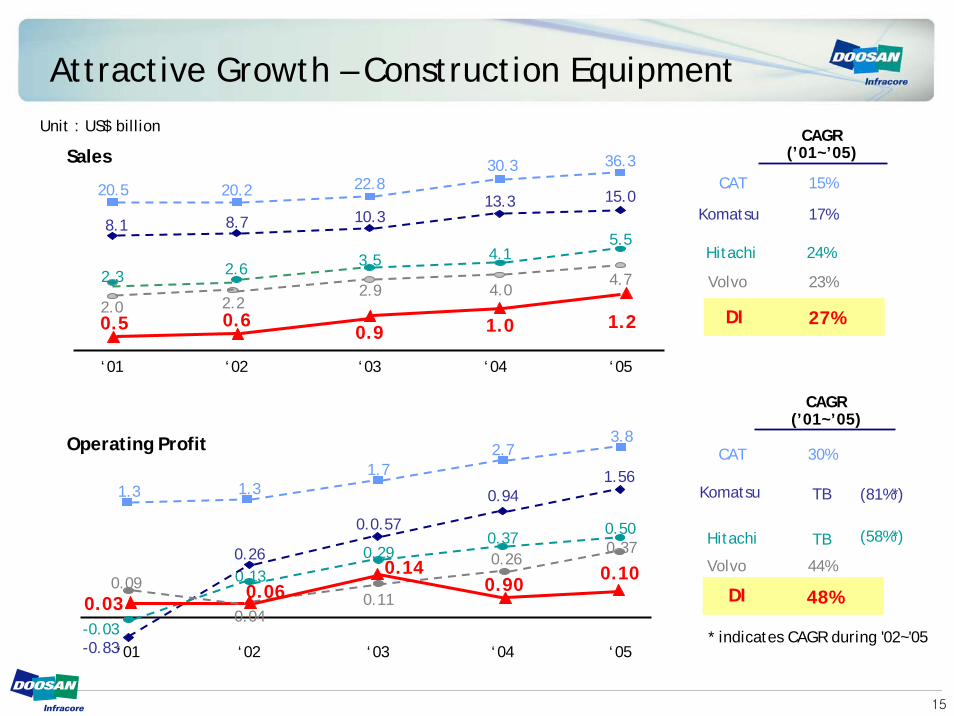
Attractive Growth – Construction Equipment
DI
‘02 ‘04 ‘05
Komatsu
Hitachi
CAT
Sales
‘03
20.2 22.830.3 36.3
1.0 1.2
8.7 10.313.3 15.0
4.04.7
2.92.2
CAGR(’01~’05)
24%
15%
17%
4.15.5
3.52.6Volvo 23%
27%0.9
0.6
‘01
20.5
8.1
2.3
2.00.5
Operating Profit
DI
CAGR(’01~’05)
Hitachi
CAT
Komatsu
TB
30%
TB
Volvo 44%
48%
‘02 ‘04 ‘05‘03
1.31.7
2.7
0.100.26
0.0.57
0.94
0.50
0.29
-0.83
3.8
1.56
0.37
0.900.26
0.37
0.110.04
0.14
‘01
1.3
0.03-0.03
0.130.09 0.06
(81%*)
(58%*)
Unit : US$ billion
* indicates CAGR during '02~'05
16
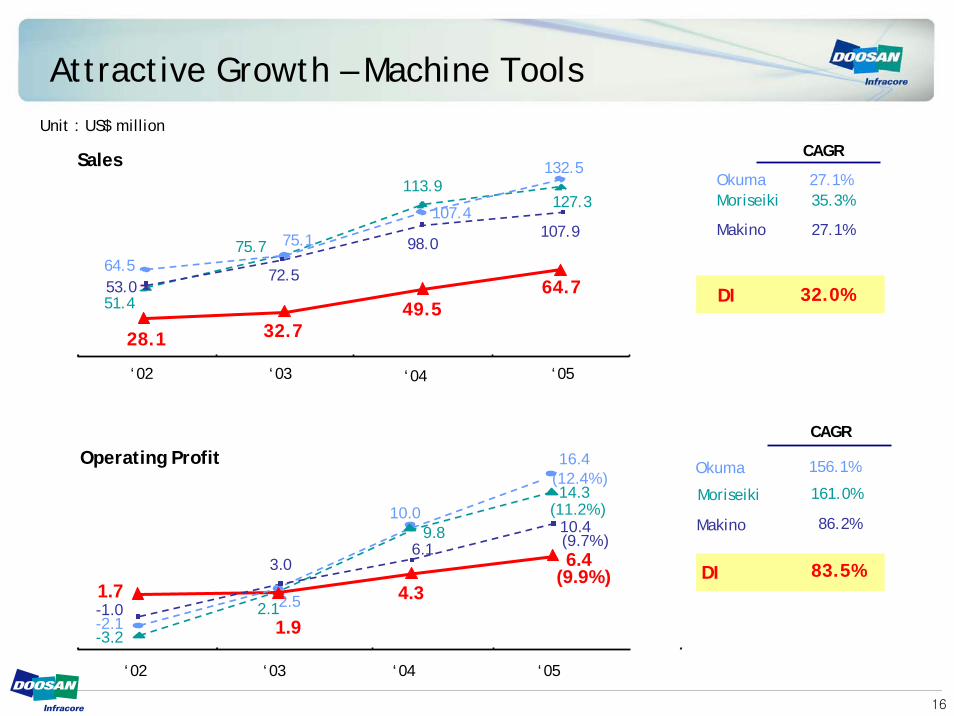
Attractive Growth – Machine Tools
83.5%DI
Unit : US$ million
CAGR
32.0%
Makino 86.2%
Moriseiki 161.0%
Okuma 156.1%
Makino 27.1%
DI
Sales
‘03‘02 ‘04 ‘05
Moriseiki 35.3%Okuma 27.1%
28.1 32.749.5
64.7
127.3
51.4
75.7
113.9
64.5
75.1
107.4
132.5
72.553.0
98.0107.9
CAGR
Operating Profit
‘03‘02 ‘04 ‘05
6.4(9.9%)
4.3
1.9
1.7
9.8
2.1
-3.2
14.3(11.2%)
16.4(12.4%)
10.0
2.5-2.1
10.4(9.7%)6.1
-1.0
3.0

1H Results & 2H Outlook(Financial numbers are parent basis unless stated otherwise)

18
1H06 Key Results (Parent + Overseas Subsidiaries)
Parent Overseas Subsidiaries Parent + Overseas Subsidiaries
ResultRelative
To Target YoY ResultRelative
To Target ResultRelative
To Target YoY
Sales 1,553.3 1.3% 10.3% 876.1 3.1% 1,799.7 0.1% 9.9%
COGS Ratio (%) 76.3% 0.1%p -3.6%p 86.1% -0.7%p 73.1% -0.5%p -2.7%p
Operating Profit 145.3 14.9% 33.3% 41.1 18.1% 183.5 13.8% 20.1%
OP Margin (%) 9.4% 1.1%p 1.6%p 4.7% 0.6%p 10.2% 1.2%p 0.9%p
Recurring Profit 118.7 3.8% -11.2% 37.1 37.9% 126.5 0.0% -13.7%
Unit : KRW billion
On a consolidated basis (parent + overseas subsidiaries), sales grew 9.2% YoY in 2Q on the back of strong construction equipment and machine tool divisions
Consolidated operating margin improved 2.2%p to 11.3% in 2Q
19
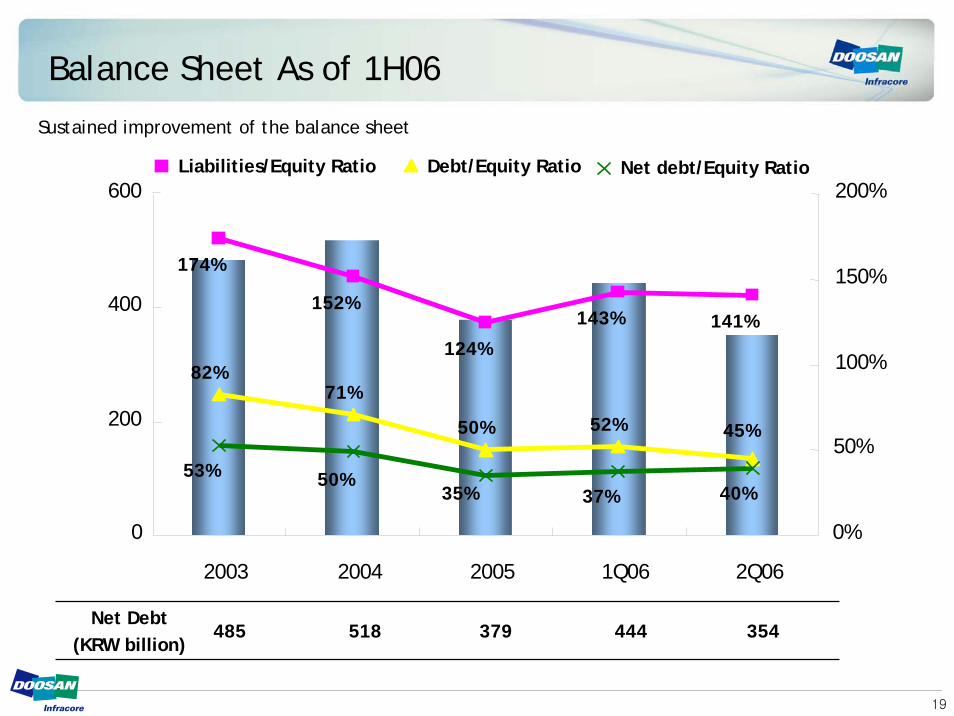
174%
152%
124%
143% 141%
82%71%
50% 52% 45%
40%37%35%50%53%
0
200
400
600
2003 2004 2005 1Q06 2Q06
0%
50%
100%
150%
200%Liabilities/Equity Ratio Debt/Equity Ratio Net debt/Equity Ratio
Net Debt(KRW billion)
485 518 379 444 354
Balance Sheet As of 1H06
Sustained improvement of the balance sheet

20
1H06 & 2H06E Sales
Sales in 1H06 grew 10.3% YoY thanks to strong export growth of construction and machine tool divisionsGreater sales growth in 2H given sustained growth in all divisions as well as 70% of defense sales
0
1,000
1,500
1H06
1,408.8
1,553.3
1H05
10.3% YoY
Unit : KRW billion
500
2,000
0
1,000
1,500
2H06E
1,406.4
1,678.4
2H05
19.3% YoY
Unit : KRW billion
500
2,000

21
1H06 & 2H06E Operating Profit
Operating profit in 1H grew a remarkable 33.3% YoY on the back of higher sales contribution from profitable construction and machine tool divisions2H should be slower due to relatively higher contribution from the low-margined defense division
0
100
200
1H06
109.2
145.6
1H05
33.3% YoY
Unit : KRW billion
0
100
200
2H06E
89.9
112.2
2H05
24.8% YoY
Unit : KRW billion
22
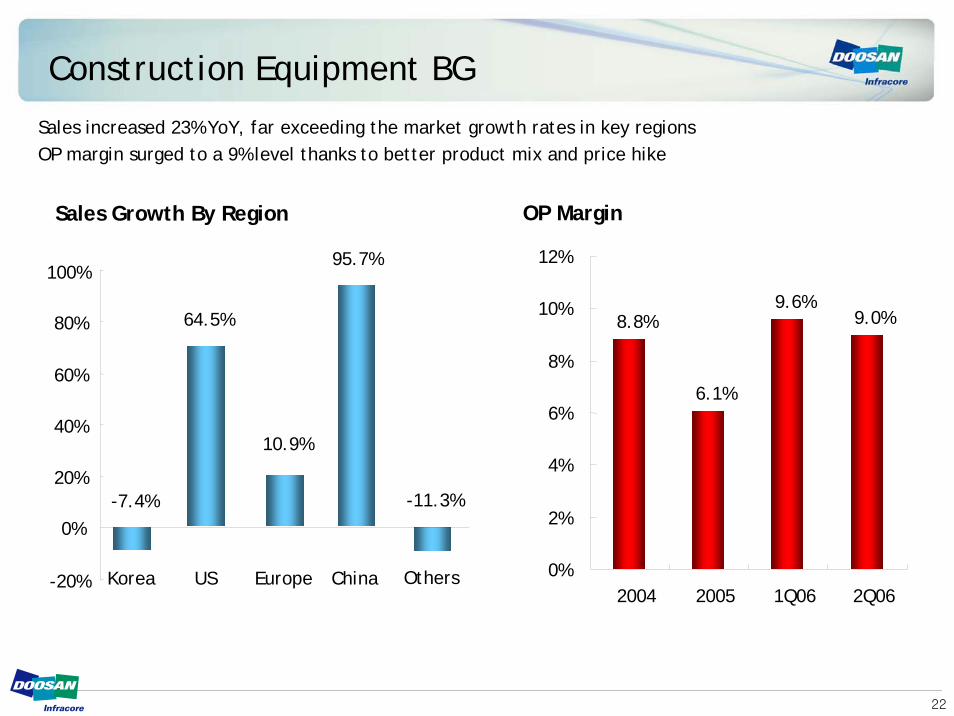
Construction Equipment BG
Sales Growth By Region
-20%
0%
20%
40%
60%
80%
100%
US Europe China Others
64.5%
10.9%
95.7%
-11.3%
Korea
-7.4%
Sales increased 23% YoY, far exceeding the market growth rates in key regionsOP margin surged to a 9% level thanks to better product mix and price hike
OP Margin
8.8%
6.1%
9.6%9.0%
0%
2%
4%
6%
8%
10%
12%
2004 2005 1Q06 2Q06
23
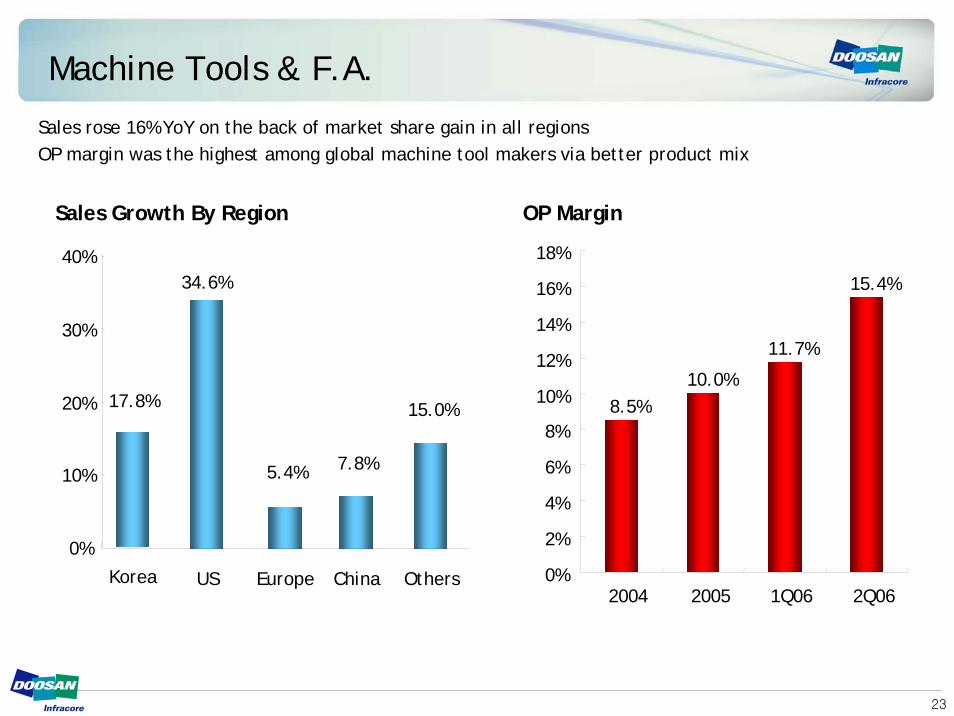
Machine Tools & F.A.
Sales Growth By Region
0%
10%
20%
30%
40%
US Europe China Others
34.6%
5.4% 7.8%
15.0%17.8%
Korea
OP Margin
Sales rose 16% YoY on the back of market share gain in all regionsOP margin was the highest among global machine tool makers via better product mix
8.5%10.0%
11.7%
15.4%
0%
2%
4%
6%
8%
10%
12%
14%
16%
18%
2004 2005 1Q06 2Q06
24
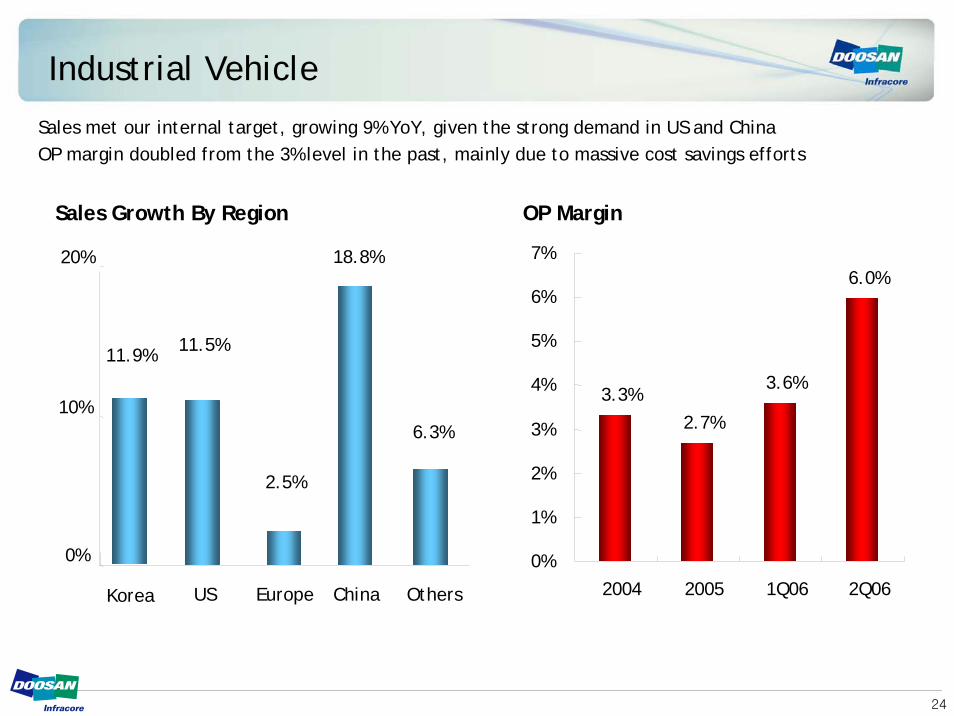
Industrial Vehicle
Sales Growth By Region
0%
10%
20%
US Europe China Others
11.5%
2.5%
18.8%
6.3%
Korea
11.9%
OP Margin
Sales met our internal target, growing 9% YoY, given the strong demand in US and ChinaOP margin doubled from the 3% level in the past, mainly due to massive cost savings efforts
3.3%2.7%
3.6%
6.0%
0%
1%
2%
3%
4%
5%
6%
7%
2004 2005 1Q06 2Q06
25
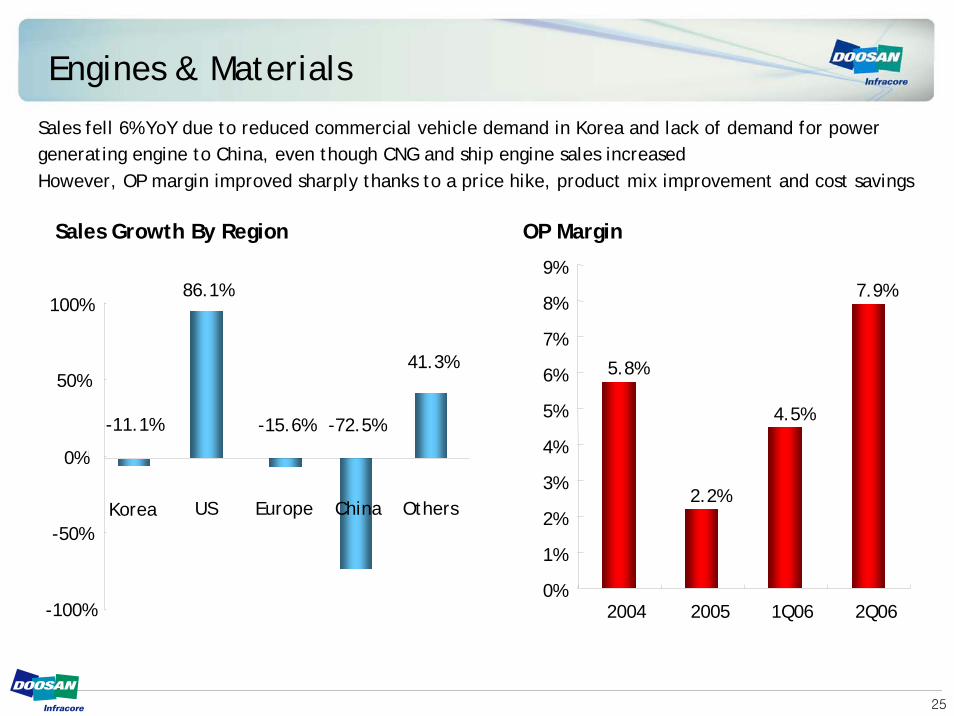
Engines & Materials
Sales Growth By Region
-100%
-50%
0%
50%
100%
US Europe China Others
-15.6% -72.5%
41.3%
Korea
-11.1%
86.1%
OP Margin
Sales fell 6% YoY due to reduced commercial vehicle demand in Korea and lack of demand for power generating engine to China, even though CNG and ship engine sales increasedHowever, OP margin improved sharply thanks to a price hike, product mix improvement and cost savings
5.8%
2.2%
4.5%
7.9%
0%
1%
2%
3%
4%
5%
6%
7%
8%
9%
2004 2005 1Q06 2Q06

26
Others
Sales Growth By Region
-30%
-20%
-10%
0%
10%
20%
30%
40%
US Europe China OthersKorea
-16.1%
32.7%
1.1%
25.5%
-0.8%
OP Margin
Sales dropped 12% YoY as the bulk of defense revenue will be booked during 2HOP margin nearly doubled as the contribution from the lucrative A/S parts sales grew increased
7.9%7.3%
6.7%
12.1%
0%
2%
4%
6%
8%
10%
12%
14%
2004 2005 1Q06 2Q06

Favorable Market
Conditions
Favorable Market
Conditions
Past Success Stemming from…
- Booming global economy
- China emerges as a new market with Doosan Infracore taking a dominant market position
Improved Risk Management
Improved Risk Management
Aggressive Cost
Reduction
Aggressive Cost
Reduction
- Applying stricter Doosan GAAP accounting policies (e.g. reducing receivable period to 90 days)
- Tighter control over bad debts (e.g. high provision for receivables)
- Aggressive hedging policy
- KRW17billion cost reduction from procurement improvement
- KRW15billion cost reduction from design improvement
What We’re Aiming
29
BackgroundBackground
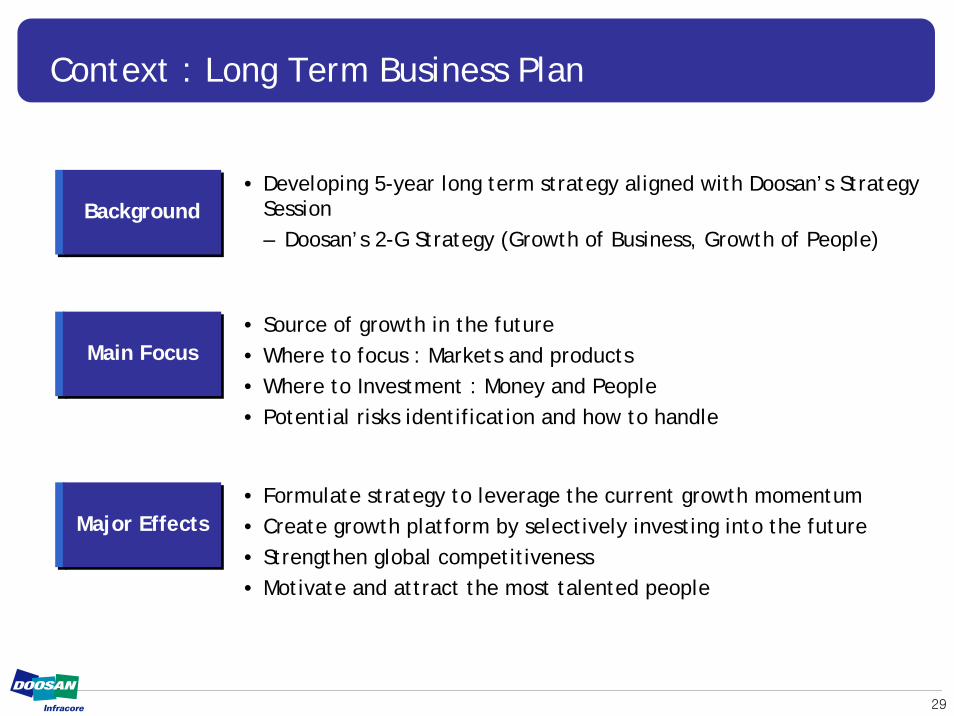
Context : Long Term Business Plan
• Developing 5-year long term strategy aligned with Doosan’s Strategy Session– Doosan’s 2-G Strategy (Growth of Business, Growth of People)
Main FocusMain Focus• Source of growth in the future• Where to focus : Markets and products• Where to Investment : Money and People• Potential risks identification and how to handle
Major EffectsMajor Effects• Formulate strategy to leverage the current growth momentum• Create growth platform by selectively investing into the future• Strengthen global competitiveness• Motivate and attract the most talented people

30
VISION : Global Top 5 ISB* CompanyLeap from a leading Korean machinery company to a globally renowned ISB* (Infrastructure Support Business) company
Annual Average Growth Rate=27%
2005 2010(E)
• Global Top 5 in ISB Industry
• 2010 Business Target of 10-10
– KRW10tr sales & 10% OP margin
Growth Target
(Sales Basis)
KRW3tr
KRW10tr
31
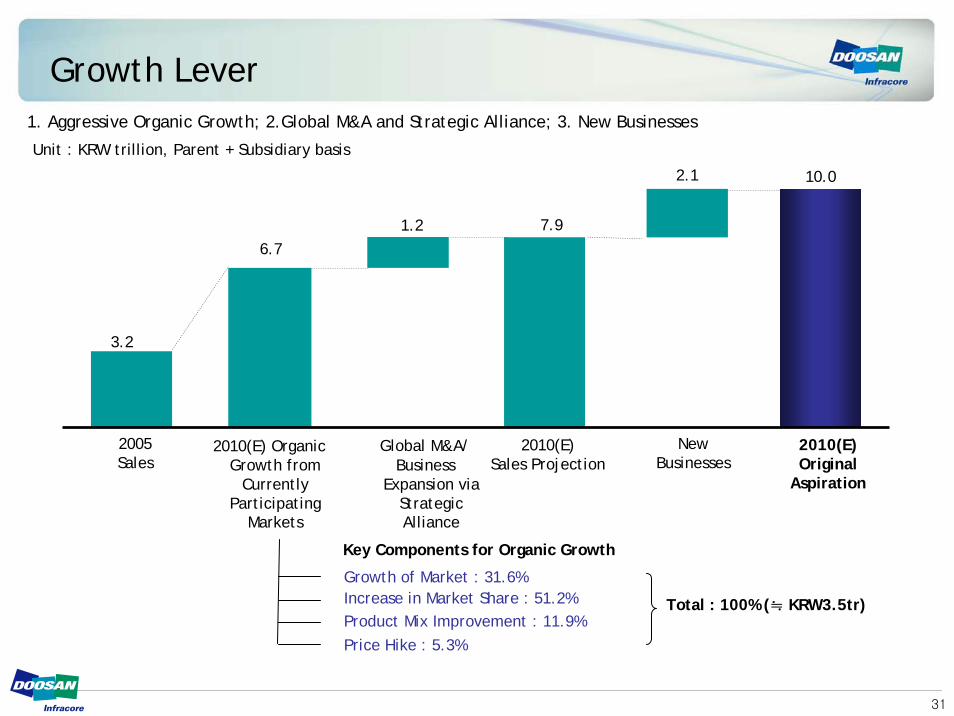
Growth Lever1. Aggressive Organic Growth; 2.Global M&A and Strategic Alliance; 3. New Businesses
Unit : KRW trillion, Parent + Subsidiary basis
2005Sales
2010(E) Organic Growth from
Currently Participating
Markets
2010(E)Sales Projection
2010(E)Original
Aspiration
NewBusinesses
Global M&A/Business
Expansion via Strategic Alliance
2.1 10.0
7.91.26.7
3.2
Increase in Market Share : 51.2% Product Mix Improvement : 11.9%Price Hike : 5.3%
Growth of Market : 31.6%
Key Components for Organic Growth
Total : 100% (≒ KRW3.5tr)

32
Strategies to Boost Global Market Share - 1
`
Introducing next generation models in more markets- Launching DX model in US
Enhanced product line-up- Development and penetration into the mini and zero tail excavator markets
- Introducing track-type SSL
Strategies
7.3%
4.2%
`
3.2%7.4%
‘05 ‘10
‘05 ‘10
Enhanced Product Line-up
DiversifiedClient Base
Better A/S &Product Service
Regional Market Share
US Market- “Focused Value / Service Player” – Targeting small- to mid-sized clients sensitive to TOC and downtime
- Aggressive entry into the leasing market
Europe- Increasing market coverage : Acquire new dealers in Franceand focus on Germany
- Installation of a moving branch in Eastern Europe
Regular client check-upsOperating a call center and keeping equipments for lease to minimize the actual downtimeMonitoring the service quality
US (Mid & Large-size)
Construction Equipment
Europe

33
Strategies to Boost Global Market Share - 2
Machine Tools
`
`4.2%
8.5%
‘05 ‘10
8.6%
11.5%
‘05 ‘10
Regional Market Share
Europe
US
Strategies
Enhanced Product Line-up
DiversifiedClient Base
Better A/S &Product Service
Increased high-end products with greater added value- Development and launch of 3 new models
Developing simplified models to expand client base- Plans to develop and launch 6 new models per year
Entering new business on top of existing MC/TC- In the process of finding the right item
Diversified client portfolio- Secure profitable aerospace/defense/medical industry clients
- Secure tier 2 clients in the automobile industry
- Searching for larger dealers and clients in existing markets
Establishment of an operating center in Europe
Expansion of the technical center in Europe and US
Enhanced product reliability by managing MTBF (Mean
Time Between Failure)
Better support for system engineering for factory
automation
34
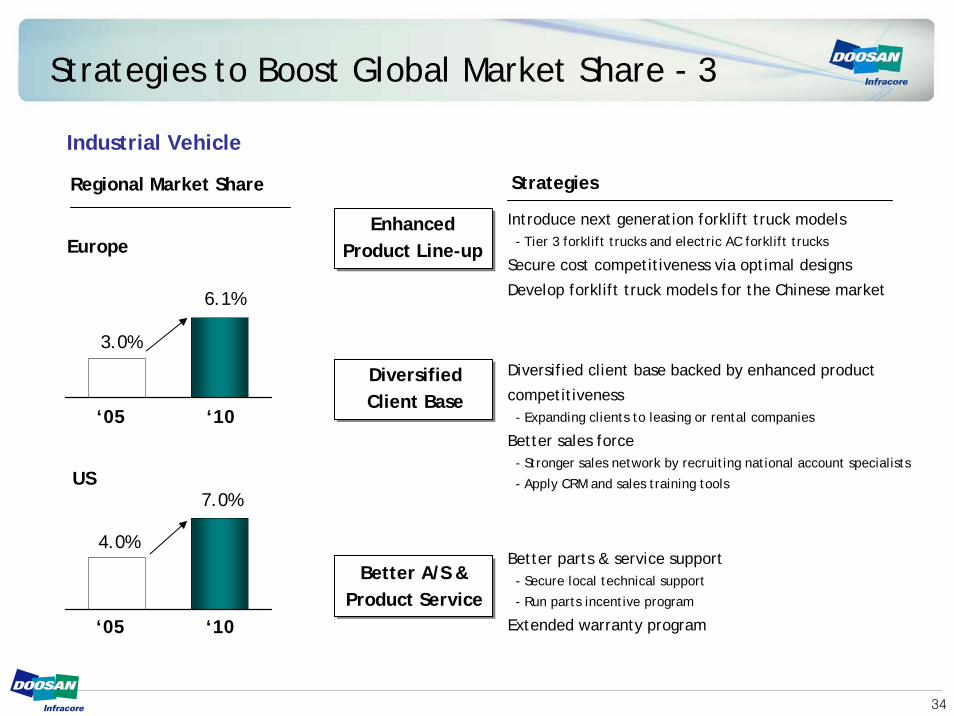
Strategies to Boost Global Market Share - 3
Industrial Vehicle
Regional Market Share
Europe
US
Strategies
Enhanced Product Line-up
DiversifiedClient Base
Better A/S &Product Service
Better parts & service support - Secure local technical support
- Run parts incentive program
Extended warranty program
Introduce next generation forklift truck models- Tier 3 forklift trucks and electric AC forklift trucks
Secure cost competitiveness via optimal designs
Develop forklift truck models for the Chinese market
Diversified client base backed by enhanced product
competitiveness- Expanding clients to leasing or rental companies
Better sales force- Stronger sales network by recruiting national account specialists
- Apply CRM and sales training tools
`4.0%
7.0%
`
3.0%
6.1%
‘05 ‘10
‘05 ‘10
35
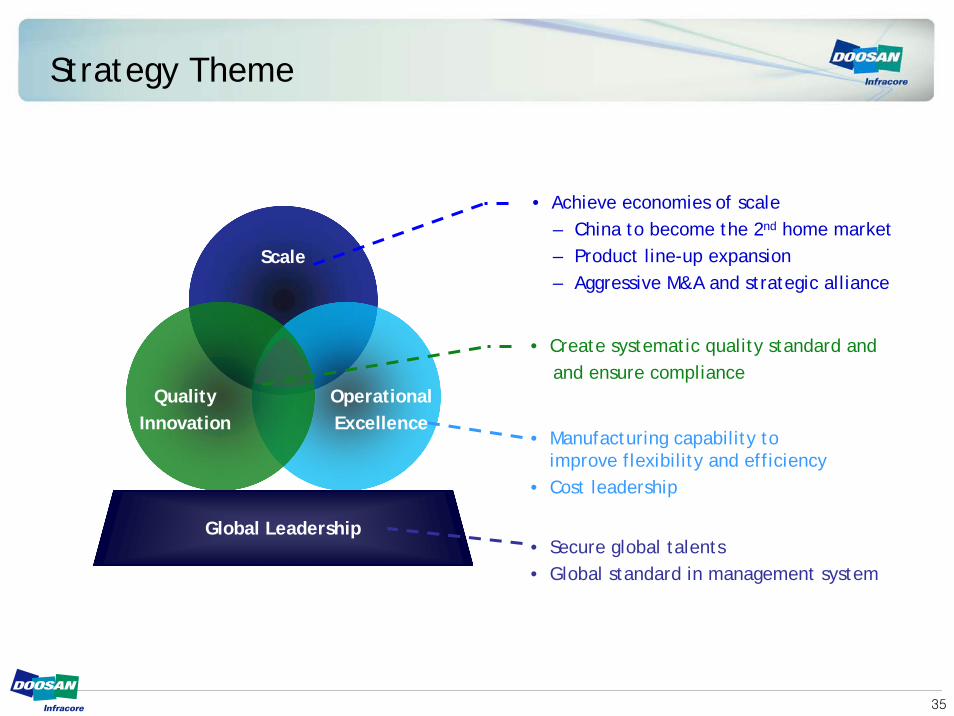
Strategy Theme
Scale
Operational Excellence
QualityInnovation
Global Leadership
• Create systematic quality standard and and ensure compliance
• Achieve economies of scale– China to become the 2nd home market– Product line-up expansion– Aggressive M&A and strategic alliance
• Secure global talents• Global standard in management system
• Manufacturing capability toimprove flexibility and efficiency
• Cost leadership

36
Our Confidence in Realizing Our Vision
Attractive Market Trend1
Solid Strategy Implementation Program2
Symptoms of Early Success3

37
- Global market size as of 2004 estimated at KRW174 trillion- Doosan Infracore participated in markets equivalent to 33% of the global market (or KRW57 trillion)
* Based on 2004 figures* Defense BG was excluded* Global markets were defined as follows: construction equipment market for the construction equipment BG, machine tool (cutting &
forming) market for the machine tool & F.A. BG, Class I~V market for the industrial vehicle BG and mid/large-sized diesel engine market for the engine & materials BG
Total Market Size : KRW174tr
Doosan Infracore Sales Market for Existing Business Market for Potential New Business
Market for Existing Business : 29.8
Excavators Wheel Loader
Market for Potential New Business : 17.6Other Construction Equipments
(e.g. Dozer, Back Hoe Loader,Telescopic Handler, SSL, ADT,RDT, Asphalt Finisher)
Market for Existing Business : 13.8
MC, TC, EDM
Market for Potential New Business : 31.2
Other Metal Cutting Tools (Milling, Grinding,
Honing, Gear Cutting M/C) & Metal Forming Tool
Market for Existing Businesses : 7.2ClassⅠ, ClassⅣ, ClassⅤ
Market for Potential New Business : 6.7ClassⅡ, ClassⅢ
Approachable Market : 6.2
Non-approachable Market : 61.5
Captive Market
Mac
hine
To
olIn
dust
rial
Ve
hicl
e
1.1
0.7
0.4
0.5
63%
31%
52%
9%
Cons
truc
tion
Eq
uipm
ent
Engi
nes
Market Size
KRW47.3tr
KRW45tr
KRW14tr
KRW67.7tr
(Unit : US$ billion,unless stated otherwise)
Attractive Market Trend1

38
Unit : US$ billion
Attractive Market Trend1
China
Europe
Americas
Others
2004 2010(P)
57
815.9%
CAGR
8.6%
2.9%
5.3%
7.0%
37%36%
19%
19%
22%
27%
21%
18%
China
EuropeAmericas
Others
2005 2010(P)
3.2
8.0* 20.0%CAGR
32.0%
18.0%
23.0%
15.0%44%
55%
12%
10%
16%
18%
28%
17%
Anticipating 6% ofSteady growth
China as a main driver of DI growth
* Excluding new business
Source : Off-highway research, Yengst Associate, Korea Institute of Construction Technology, WITS, Moto Data, Generator Sets ABI Research,
KAMA, The Association for Manufacturing Technology, A Garner Publication
Market size projection by region DI revenue projection by region
Unit : KRW billion
39
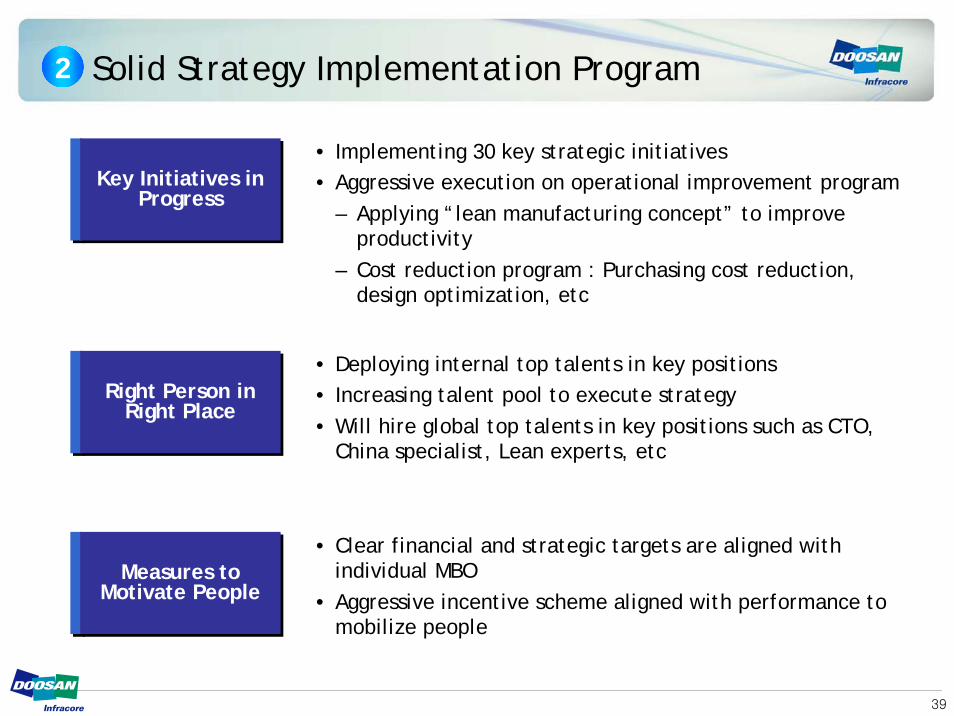
Solid Strategy Implementation Program2
Key Initiatives in Progress
Key Initiatives in Progress
• Implementing 30 key strategic initiatives• Aggressive execution on operational improvement program
– Applying “lean manufacturing concept” to improve productivity
– Cost reduction program : Purchasing cost reduction, design optimization, etc
Right Person in Right Place
Right Person in Right Place
• Deploying internal top talents in key positions• Increasing talent pool to execute strategy • Will hire global top talents in key positions such as CTO,
China specialist, Lean experts, etc
Measures to Motivate People
Measures to Motivate People
• Clear financial and strategic targets are aligned with individual MBO
• Aggressive incentive scheme aligned with performance to mobilize people

40
Symptoms of Early Success
• Launching next generation products– 15 excavator/wheel loader– 8 forklift, 9 machine tool
• Developing regionally competitive products such as China
• Global M&A and strategic alliance in progress : visible achievements expected within 6 ~ 12 months
• 17 won billion cost reduction for MRO/Indirect purchasing cost
• Identified 10%+ cost reduction potential of forklift by applying optimal design concept
Fundamental competitiveness
Fundamental competitiveness
Cost LeadershipCost Leadership
3

Appendix
42
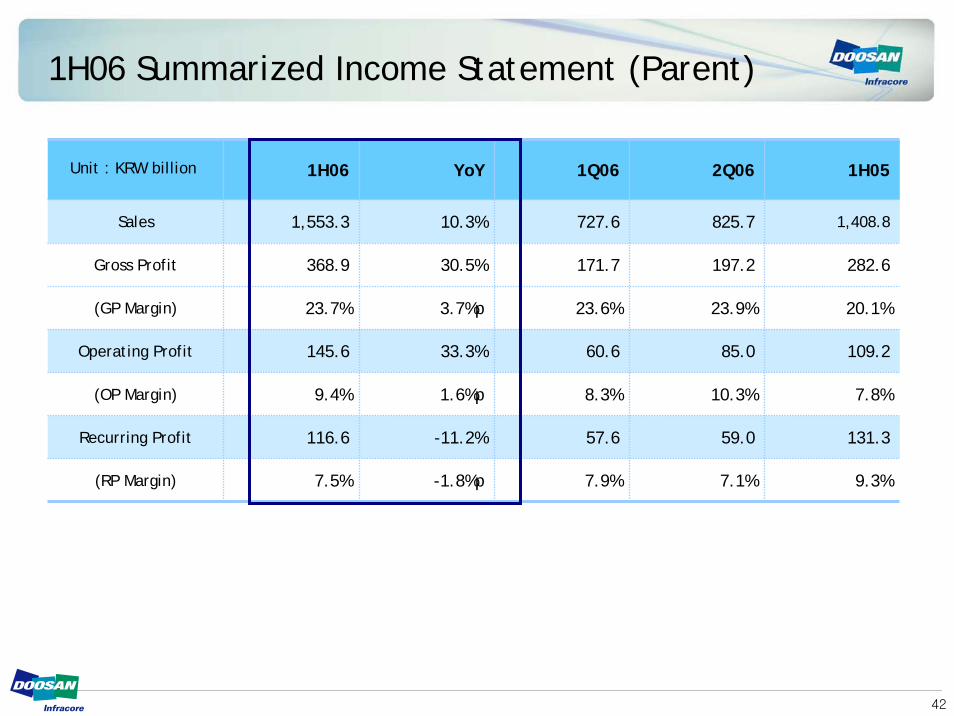
1H06 Summarized Income Statement (Parent)
1H06 YoY 1Q06 2Q06
1,553.3 727.6
171.7
23.6%
60.6
8.3%
57.6
7.9%
368.9
825.7
197.2
23.9%
85.0
10.3%
59.0
23.7%
145.6
9.4%
116.6
7.5% 7.1%
10.3%
30.5%
3.7%p
33.3%
1.6%p
-11.2%
-1.8%p
1H05
Sales 1,408.8
282.6
20.1%
109.2
7.8%
131.3
9.3%
Gross Profit
(GP Margin)
Operating Profit
(OP Margin)
Recurring Profit
(RP Margin)
Unit : KRW billion

43
Balance Sheet as of Jun. 2006 (Parent)
2Q06 QoQ YoY 1Q06 2Q05
-12.7%
3.8%
-5.6%
-30.0%
13.2%
-5.4%
-5.8%
Liabilities/Equity Ratio 141.2% -1.7%p 0.6%p 142.9% 140.6%
-7.2%p
1,518.6
1,152.3
2,670.8
672.6
888.3
1,561.0
1,109.9
47.1%
Current Assets 1,326.3 1.2% 1,310.7
Fixed Assets 1,195.8 -0.8% 1,204.8
Total Assets 2,522.1 0.3% 2,515.6
Debts 470.9 -12.4% 537.6
Other Liabilities 1,005.7 6.7% 942.5
Total Liabilities 1,476.5 -0.2% 1,480.1
Total Shareholders' Equity 1,045.6 1.0% 1,035.4
Net debt/Equity Ratio 39.9% 2.4%p 37.5%
Unit : KRW billion

44
1H06 Breakdown By Division (Parent)
Total Construction Equipment Machine Tools & F.A Industrial Vehicle Engines & Materials Others
04 05 06 04 05 06 04 05 06 04 05 06 04 05 06 04 05 06
Sales 1,483.6
1,408.8
1,553.3 573.9 502.7 616.2 241.0 301.7 351.1 200.3 205.3 224.1 234.7 191.2 179.7 233.7 207.9 182.2
YoY 35% -5% 10% 25% -12% 23% 52% 25% 16% 16% 2% 9% 104% -19% -6% 22% -11% -12%
Domestic Sales 754.4 581.9 559.1 239.0 130.3 120.7 90.7 96.7 113.9 91.8 77.1 86.3 140.6 100.3 89.2 192.3 177.5 149.0
YoY 26% -23% -4% 13% -45% -7% 65% 7% 18% 5% -16% 12% 66% -29% -11% 19% -8% -16%
Exports 729.2 826.9 994.2 334.9 372.4 495.5 150.3 205.0 237.2 108.5 128.2 137.8 94.1 90.9 90.5 41.4 30.4 33.2
YoY 47% 13% 20% 36% 11% 33% 45% 36% 16% 27% 18% 7% 210% -3% 0% 43% -27% 9%
Operating Profit 158.7 109.2 145.6 79.1 46.4 57.1 24.0 30.1 48.1 11.9 7.1 10.9 18.0 9.9 11.4 25.7 15.7 18.1
OP Margin (%) 10.7% 7.8% 9.4% 13.8% 9.2% 9.3% 10.0% 10.0% 13.7% 5.9% 3.5% 4.9% 7.7% 5.2% 6.3% 11.0% 7.6% 9.9%
Unit : KRW billion

45
1H06 Breakdown of Exports by Region (Parent)
2005 2006
US Europe China Others US Europe China Others
Construction Equipment
372.4 495.5 62.9 118.8 85.1 105.6 103.5 131.8 166.5 93.7
(YoY) 33.1% 64.5% 10.9% 95.7% -11.3%
Industrial Vehicle 205.0 237.2 61.0 87.3 29.4 27.3 82.1 92.0 31.7 31.4
(YoY) 15.7% 34.6% 5.4% 7.8% 15.0%
Machine Tools & F.A 128.2 137.8 48.7 43.2 4.8 31.5 54.3 44.3 5.7 33.5
(YoY) 7.5% 11.5% 2.5% 18.8% 6.3%
Engines & Materials 84.2 90.5 3.6 13.5 28.0 39.1 6.7 11.4 7.7 64.7
(YoY) 7.5% 86.1% -15.6% -72.5% 65.5%
Others 37.1 33.2 4.9 8.7 4.7 18.8 6.5 8.8 5.9 12.0
(YoY) -10.5% 32.7% 1.1% 25.5% -36.2%
Total 826.9 994.2 181.1 271.5 152.0 222.3 253.1 288.3 217.5 235.3
(YoY) 20.2% 39.8% 6.2% 43.1% 5.8%
2005 2006

46
Year Sales Operating Profit
2004 -2.8
8.7
y-y -21% TB
2004 299.5 11.1
2004 343.4 19.0
2004 255.3 2.5
2004 1,477.0 30.8
2005 233.3 2.8Germany Subsidiary
y-y -9% 12%
2005 368.2 20.6North America Subsidiary
y-y 7% 8%
2004 86.5 1.0
2005 95.1 2.1U.K. Subsidiary
y-y 10% 110%
2005 345.7 11.3
y-y 15% 2%
2005 1,431.6 45.5
y-y -3% 48%
Total
Europe Subsidiary
2005 389.3
492.3
China Subsidiary
Results of Overseas Subsidiaries (Parent)
Unit : KRW billion
47
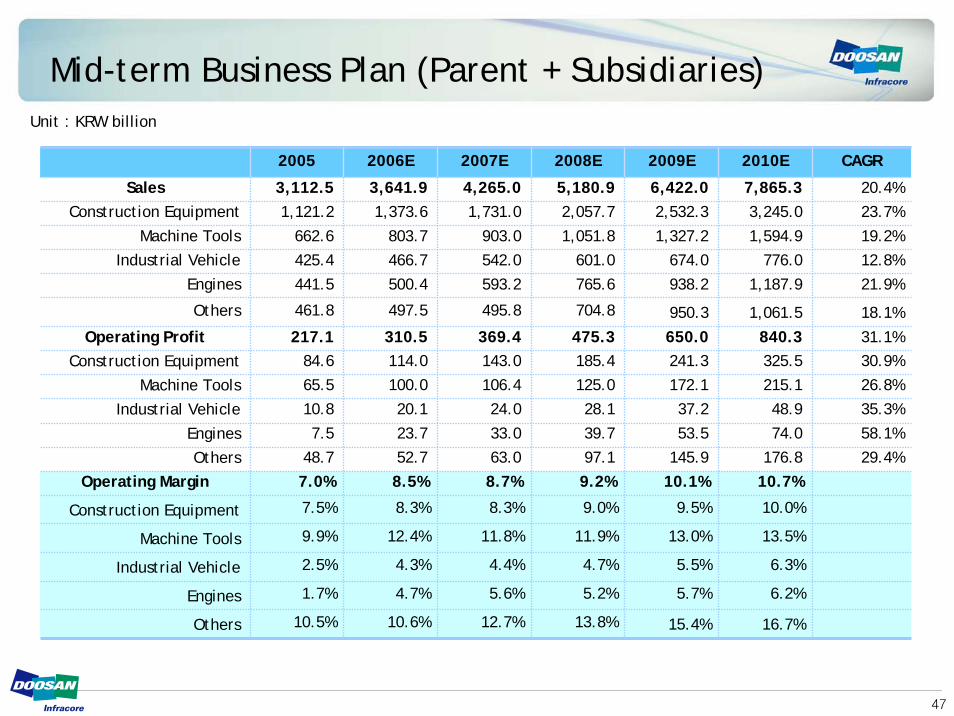
Mid-term Business Plan (Parent + Subsidiaries)
2005 2006E 2007E 2008E 2009E 2010E CAGR
6,422.0 7,865.33,245.0
1,594.9
776.0
1,187.9
1,061.5
840.3325.5
215.1
48.9
74.0
176.8
10.7%
10.0%
13.5%
6.3%
6.2%
16.7%
Construction Equipment 1,121.2 1,373.6 1,731.0 2,057.7 2,532.3
20.4%
23.7%
19.2%
12.8%
21.9%
18.1%
31.1%30.9%
26.8%
35.3%
58.1%
29.4%
Machine Tools 662.6 803.7 903.0 1,051.8 1,327.2
Engines 441.5 500.4 593.2 765.6 938.2
Construction Equipment 84.6 114.0 143.0 185.4 241.3
Machine Tools 65.5 100.0 106.4 125.0 172.1
Engines 7.5 23.7 33.0 39.7 53.5
Operating Margin 7.0% 8.5% 8.7% 9.2% 10.1%
Construction Equipment 7.5% 8.3% 8.3% 9.0% 9.5%
Machine Tools 9.9% 12.4% 11.8% 11.9% 13.0%
Industrial Vehicle 2.5% 4.3% 4.4% 4.7% 5.5%
Engines 1.7% 4.7% 5.6% 5.2% 5.7%
Industrial Vehicle 10.8 20.1 24.0 28.1 37.2
Others 48.7 52.7 63.0 97.1 145.9
Industrial Vehicle 425.4 466.7 542.0 601.0 674.0
Others 461.8 497.5 495.8 704.8 950.3
650.0
15.4%
5,180.9
475.3
13.8%
4,265.0
369.4
12.7%
3,641.9
310.5
10.6%
3,112.5
217.1
10.5%
Sales
Operating Profit
Others
Unit : KRW billion

48
2006 Business Target – Sales (Parent)Sales on track to reach 2006 business targetMore than 70% of defense sales are expected in 2H
0%
20%
40%
60%
80%
100%
Construction
Equipment
Machine Tools
& F.A
Industrial
Vehicle
Engines &
Materials
Others
Sales in 1H06 Sales expected in in 2H06
55.7% 48.5% 51.2% 45.7% 31.9%
% ofSales Target
48.1%

49
2006 Business Target – Operating Profit (Parent)
0%
20%
40%
60%
80%
100%
Construction
Equipment
Machine Tools
& F.A
Industrial
Vehicle
Engines &
Materials
Others
OP in 1H06 OP expected in in 2H06
66.6% 52.1% 58.0% 48.1% 48.7%
Exceeding expectations during 1H thanks to better than expected construction equipment, machine tools and industrial vehicle divisions
% ofOP Target
56.5%

Thank You
Contact: IR TEAM
KO Nam, Director, 822) 3398-8340 / JS Yang, Manager, 822) 3398-8341 / J Yoon, Manager, 822 )3398-8344 / HM Lee, Staff, 822) 3398-8343