Embed Size (px)
Citation preview

Presentation Identifier (Title or Location), Month 00, 2008
Cost and Benefit Analysis Framework EPRI Smart Grid Advisory Meeting
June 24, 2009 Red Bank, New Jersey
Steve Bossart
Director, Integrated Electric Power Systems
Office of Systems Analysis and Planning

2
Smart Grid Demonstrations
• Sponsors – DOE OE R&D and EPRI– Funding & direction
• Project Management – NETL PMC and EPRI– Award and manage RDSI and EPRI demonstrations
• Core CBA Team – ORNL/Smart Grid Experts– Develop common CBA methodology– Consult on RDSI and EPRI demonstrations
• Project-specific cost benefit analysis – NETL OSAP– Apply common methodology to RDSI and EPRI projects

3
Core CBA Team Member Organization
Ahmad Faruqui The Brattle Group
Russ Lee/Travis Smith Oak Ridge National Laboratory
Dan Violette Summit Blue
David Walls/Forrest Small Navigant Consulting
Bruce Renz Renz Consulting
Sponsor Managers
Bernie Neenan EPRI
Steve Bossart DOE NETL

4
RDSI Project NameContractor
PIDOE COR
Core CBA Team Member
OSAP CBA Team Member
West Virginia Super Circuit Harley Mayfield Tom George Travis Smith Keith Dodrill
Integrated Auto DG Technologies Demonstration Roger Weir Tom George Dan Violette Kristin Gerdes
Santa Rita Jail MicrogridBruce Dickinson Steve Waslo Ahmad Faruqui Rodney Geisbrecht
Peak Load Reduction on Distribution Feeders Using DER Dennis Sumner Mario Sciulli Travis Smith Kristin Gerdes
Interoperability of Demand Response Resources Demonstration in New York
Frank Doherty Tom George David Walls Rodney Geisbrecht
The Perfect Power Prototype for the Illinois Institute of Technology
Mohammad Shahidehpour Steve Waslo Bruce Renz Kristin Gerdes
Beach Cities Microgrid Rick Gardner Mario Sciulli Forrest Small Keith Dodrill
Managing Distribution System Resources for Improved Service Quality and Reliability, Transmission Congestion Relief and Grid Support Functions Terry Surles Mario Sciulli Ahmad Faruqui Keith DodrillDramatic Residential Demand Reduction in the Desert Southwest Robert Boehm Tom George Bruce Renz
Rodney Geisbrecht

5
Smart Grid Demonstration Cost and Benefit Analysis Methodology
• Objectives:– Develop and apply common cost and benefits
methodology across all Smart Grid demonstrations – Publish methodology including underlying rules and
assumptions – Enable fair and consistent comparison of different
approaches to Smart Grid implementation– Ensure that methodology can easily accommodate
changes and expansion
6
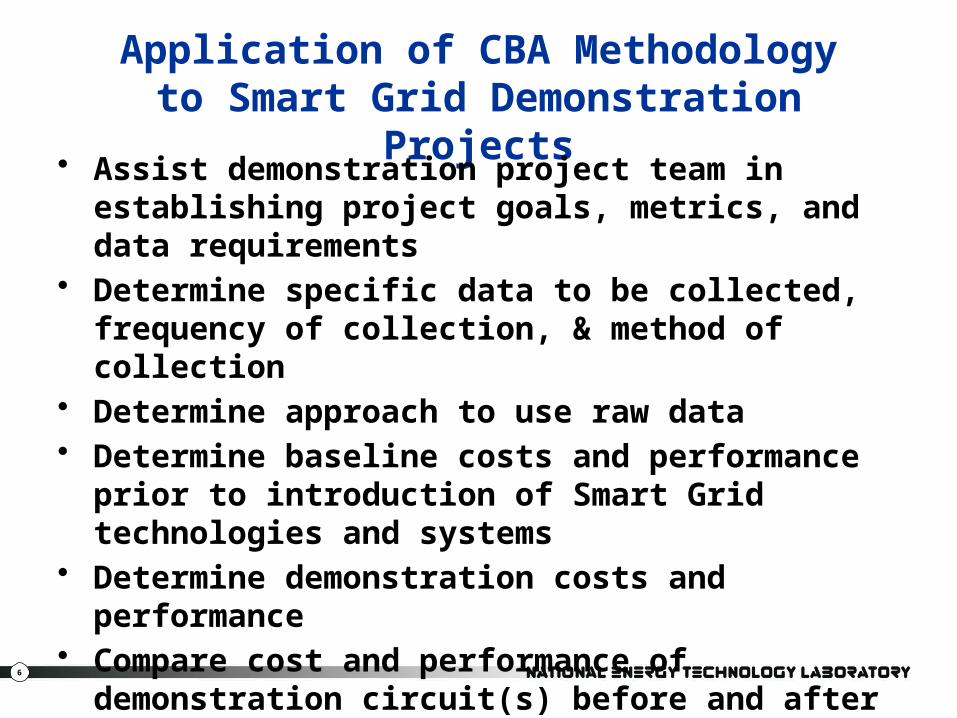
Application of CBA Methodologyto Smart Grid Demonstration Projects
• Assist demonstration project team in establishing project goals, metrics, and data requirements
• Determine specific data to be collected, frequency of collection, & method of collection
• Determine approach to use raw data• Determine baseline costs and performance prior to
introduction of Smart Grid technologies and systems
• Determine demonstration costs and performance • Compare cost and performance of demonstration
circuit(s) before and after introduction of Smart Grid technologies and systems
7
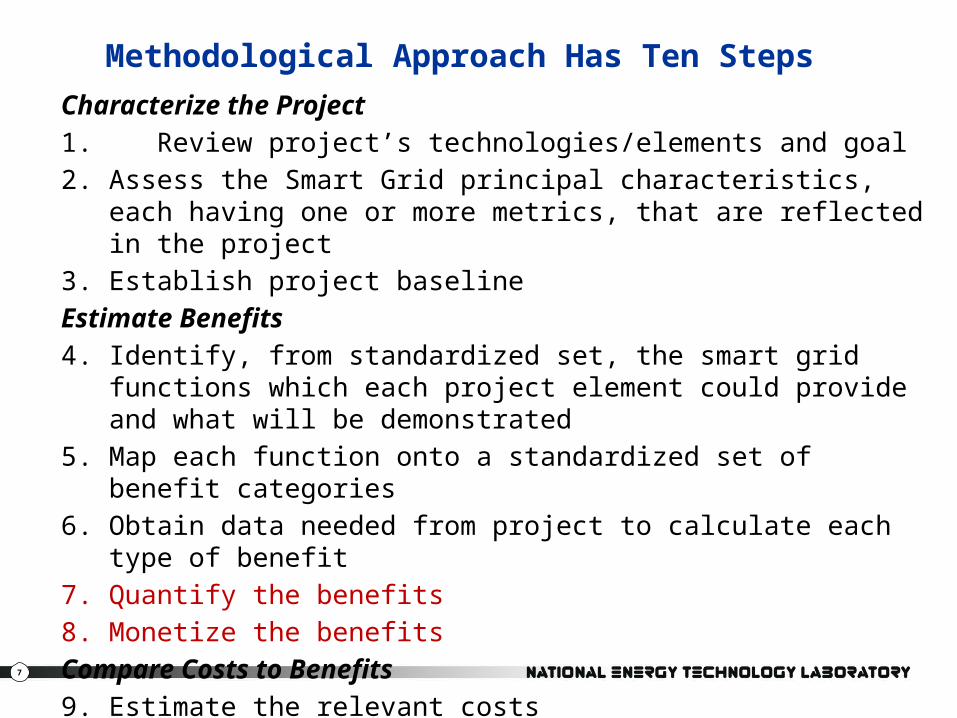
Methodological Approach Has Ten Steps
Characterize the Project
1. Review project’s technologies/elements and goal
2. Assess the Smart Grid principal characteristics, each having one or more metrics, that are reflected in the project
3. Establish project baseline
Estimate Benefits
4. Identify, from standardized set, the smart grid functions which each project element could provide and what will be demonstrated
5. Map each function onto a standardized set of benefit categories
6. Obtain data needed from project to calculate each type of benefit
7. Quantify the benefits
8. Monetize the benefits
Compare Costs to Benefits
9. Estimate the relevant costs
10. Compare costs to benefits

8
Cost and Benefit Guidance
• Cross-reference benefits with seven Smart Grid characteristics • Consider operation, consumer, and societal benefits• Monetized benefits can be either cost savings or cost avoidance• Keep algorithms, rules, and assumptions as simple as possible• Consider applying ranges for assumptions (i.e,. confidence
levels)• Consider need for sensitivity analyses• Baseline data determined from historical data and/or collection
of current data on demonstration circuits• Review scope of RDSI and EPRI demonstration projects to
determine goals and cost & benefits• Review previous CBA methodologies that were applied to
electric grid demonstrations
9
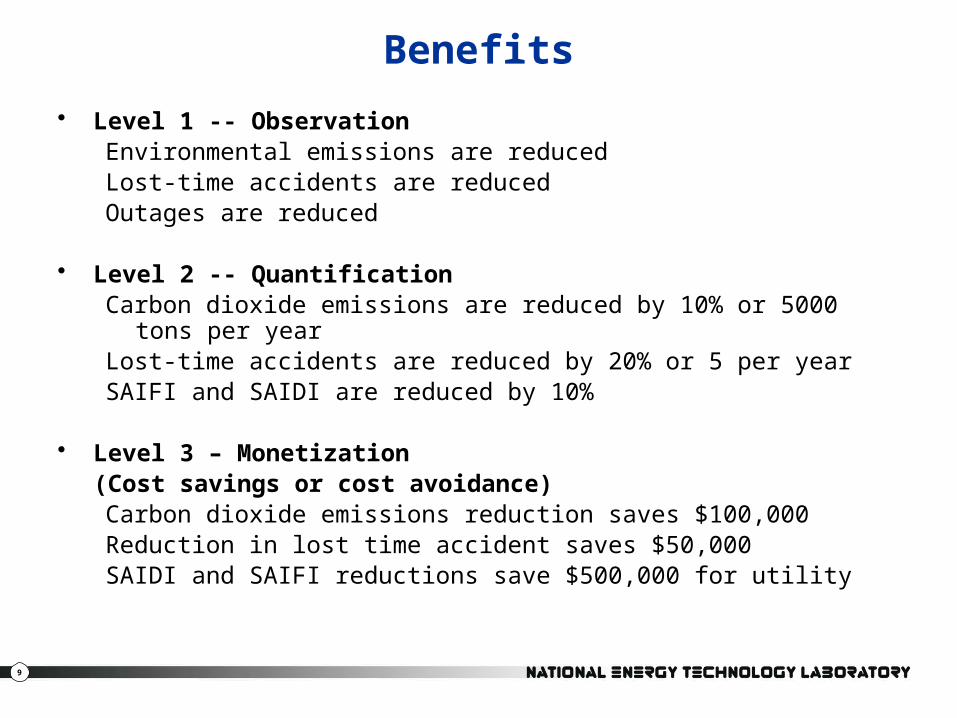
Benefits
• Level 1 -- ObservationEnvironmental emissions are reducedLost-time accidents are reducedOutages are reduced
• Level 2 -- QuantificationCarbon dioxide emissions are reduced by 10% or 5000 tons per yearLost-time accidents are reduced by 20% or 5 per yearSAIFI and SAIDI are reduced by 10%
• Level 3 – Monetization(Cost savings or cost avoidance)Carbon dioxide emissions reduction saves $100,000 Reduction in lost time accident saves $50,000SAIDI and SAIFI reductions save $500,000 for utility

10
Example
Functions, Mechanisms, Benefits and Value
10
Functions Mechanisms Benefits
What does the Smart Grid do?
How does itdo that?
What “goodness” results?
Value
What is the goodness worth?
Automatic voltage and VAR control
Improves feeder voltage regulation
Reduced feeder losses worth $60 per MWh
$6,000
11
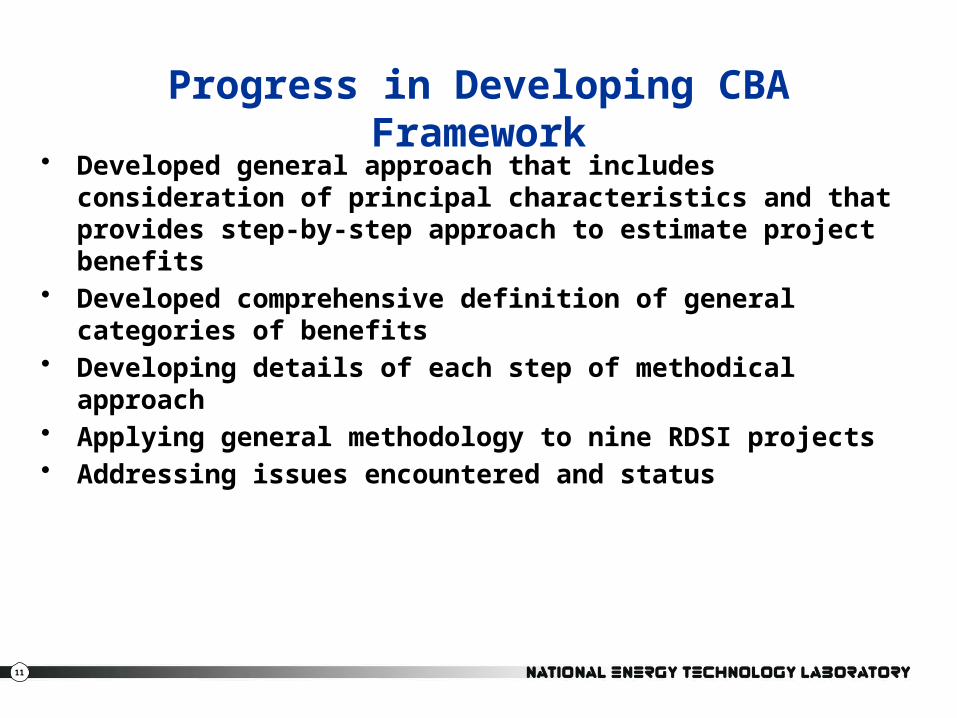
• Developed general approach that includes consideration of principal characteristics and that provides step-by-step approach to estimate project benefits
• Developed comprehensive definition of general categories of benefits
• Developing details of each step of methodical approach• Applying general methodology to nine RDSI projects• Addressing issues encountered and status
Progress in Developing CBA Framework
12
• Types of projects in RDSI/Smart Grid demonstrations• Goals of each project• Definition of general categories of benefits• Methodological approach• Generic example• Issues encountered and status
Overview of Discussion About Our Progress
13
Typical Smart Grid Elements Included in Demonstrations
• Advanced Metering Infrastructure/Smart Meters• Demand response/load control• Consumer gateway linking utility and consumer• Distributed generation
– Solar PV, fuel cells, wind power, CHP, biodiesel generator… • Energy storage
– NAS Battery, PHEV• Distribution automation• Distribution feeder reconfiguration• Automated voltage and VAR control• Real time load management and measurement• Real time load transfer• Automated islanding and reconnection• Diagnosis and notification of equipment condition

14
Typical Project Goals
• Reduce peak load met by centralized generation• Reduce outages• Quickly restore outages• Demonstrate islanding• Increase consumer participation in demand response
programs
Framework takes various goals and expresses them in terms of a consistently-stated set of benefits that can apply to other projects
15
Types of BenefitsConsistently defined
Estimated in the same way for all projects
• Broad categories of benefits– Economic (reduced costs)– Reliability (interruptions and power quality)– Environmental (emissions and hazardous materials)– Safety– Energy independency & security
• Stakeholders who benefit– Utilities/Ratepayers– Consumers– Society

16
Examples of Demonstrable Benefits • Electricity Service Provider
– Operational Reduced costs to service provider associated with: metering & billing, outage & work force management, reduced energy losses, optimize asset utilization, reduce equipment failure; reduce number, duration, and extent of outages
– Asset Management System planning, maintenance
• Consumer– Reduced business loss from outages and PQ events, information
access, reduced energy bills from energy management, participate in DR programs, reduced peak charges from connection of DG and storage, reduce transportation costs
• Societal – Reduced emissions, economic development, improved grid
security, revolutionize transportation sector to reduce dependence on foreign oil

17
Hypothetical project todemonstrate a microgrid
17
Primary Smart Grid Systems
• Distribution Automation for automatic switching (FLISR)
• AMI
• Customer owned PV
• Utility owned energy storage
• OMS/DMS
Project Goals
• Improve reliability
• Achieve reduce feeder peak load
• Manage feeder voltage and VAR
• Intentionally island customers
• Manage variable renewable resources
Distribution System Factors
• Build new distribution to tie feeders
• Install additional capacitor bank

18
Smart Grid Functions and Benefits
18
Smart Grid Functions
• Adaptive protection
• Automated feeder switching
• Automated islanding and reconnection
• Automated voltage and VAR control
• Enhanced fault protection
• Real-time load measurement and management
• Backup generation
• Demand response
• Energy storage
Key Benefits to Quantify
• Reduced outage frequency
• Reduced outage duration
• Reduced restoration costs
• Deferred distribution capacity investments
• Reduced distribution operations cost
• Reduced electricity costs
• Avoided on-peak charges
• Reduced peak demand
• Reduced peak losses
• Reduced reserve margin requirement
19
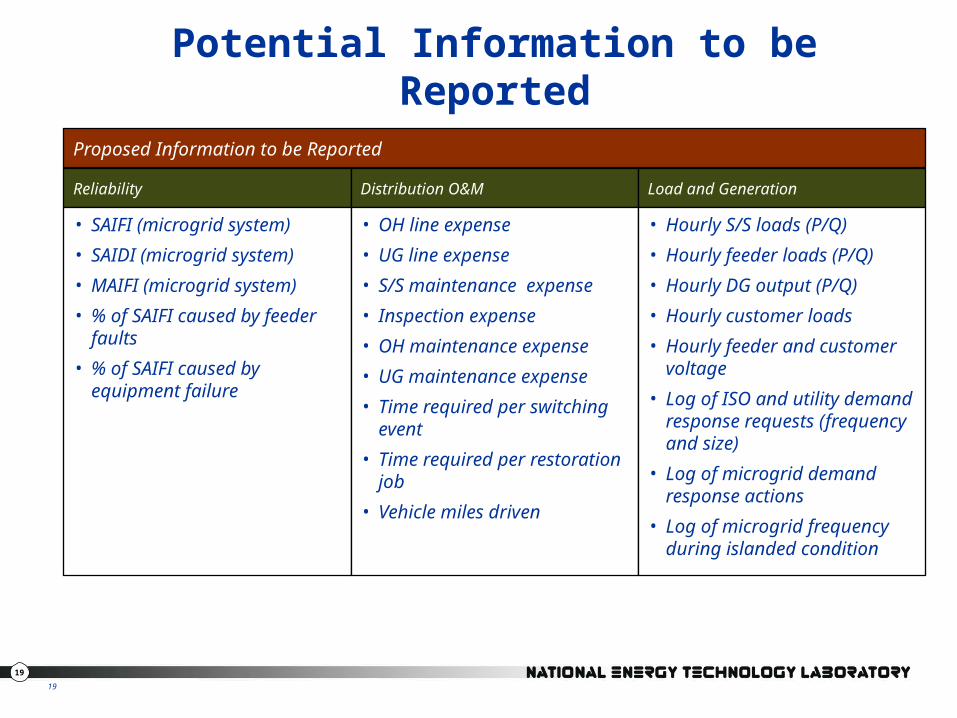
Potential Information to be Reported
19
Reliability
• SAIFI (microgrid system)
• SAIDI (microgrid system)
• MAIFI (microgrid system)
• % of SAIFI caused by feeder faults
• % of SAIFI caused by equipment failure
Distribution O&M
• OH line expense
• UG line expense
• S/S maintenance expense
• Inspection expense
• OH maintenance expense
• UG maintenance expense
• Time required per switching event
• Time required per restoration job
• Vehicle miles driven
Load and Generation
• Hourly S/S loads (P/Q)
• Hourly feeder loads (P/Q)
• Hourly DG output (P/Q)
• Hourly customer loads
• Hourly feeder and customer voltage
• Log of ISO and utility demand response requests (frequency and size)
• Log of microgrid demand response actions
• Log of microgrid frequency during islanded condition
Proposed Information to be Reported

20
Issues Encountered
• Availability of data from the projects• Adequacy of duration and size of demonstration to
determine benefits• Estimation of national benefits versus limited
demonstration benefits• Defining benefits in a uniform way so that estimates are
both comprehensive and mutually exclusive• Determination of baseline• Monetization of benefits• Different externalities from baseline and demonstration

21
Next Steps• Complete developing details of each step of methodology,
especially specifics of data needs, baseline definitions and monetization of benefits
• Complete consideration of each of the nine DOE RDSI projects, and perhaps EPRI
• Complete analysis of issues such as extending to a national context
• Complete report on the methodology, application to the nine projects, and discussion of issues
• Develop code (e.g., in Excel) to implement the methodology in the next phase