Embed Size (px)
Citation preview

Presentation for REITs Symposium 2017
27 May 2017
Important Notice
2
This presentation shall be read in conjunction with OUE Commercial REIT’s Financial Results announcement for1Q 2017 dated 5 May 2017.
This presentation is for information only and does not constitute an invitation or offer to acquire, purchase orsubscribe for units in OUE Commercial REIT (“Units”). The value of Units and the income from them, if any, mayfall or rise. The Units are not obligations of, deposits in, or guaranteed by, OUE Commercial REIT Management Pte.Ltd. as the Manager of OUE Commercial REIT (the “Manager”), or any of its affiliates. An investment in Units issubject to investment risks, including the possible loss of the principal amount invested. The past performance ofOUE Commercial REIT is not necessarily indicative of the future performance of OUE Commercial REIT.
This presentation may contain forward-looking statements that involve risks and uncertainties. All statementsregarding future financial position, operating results, business strategies, plans and future prospects of OUECommercial REIT are forward-looking statements. Actual future performance, outcomes and results may differmaterially from those expressed in forward-looking statements as a result of a number of risks, uncertainties andassumptions. These forward-looking statements speak only as at the date of this presentation. No assurance canbe given that future events will occur, that projections will be achieved, or that assumptions are correct.Representative examples of these factors include (without limitation) general industry and economic conditions,interest rate trends, cost of capital and capital availability, competition from similar developments, shifts in expectedlevels of property rental income, changes in operating expenses (including employee wages, benefits and trainingcosts), property expenses and governmental and public policy changes. You are cautioned not to place unduereliance on these forward-looking statements, which are based on the Manager’s current view of future events.
Investors should note that they will have no right to request the Manager to redeem or purchase their Units whilethe Units are listed on the Singapore Exchange Securities Trading Limited (the “SGX-ST”). It is intended thatUnitholders may only deal in their Units through trading on the SGX-ST. Listing of the Units on the SGX-ST doesnot guarantee a liquid market for the Units.
Overview
Financial Performance & Capital Management
Portfolio Performance
Summary
3
Content
About OUE Commercial REIT
4
OUE C-REIT’s principal investment strategy is to invest in income-
producing real estate which is used primarily for commercial purposes
in financial and business hubs in key gateway cities
With a total assets-under-management of approximately S$3.4 billion
as at 31 March 2017, OUE C-REIT’s portfolio comprises
OUE Bayfront, a premium Grade A office building located at Collyer Quay
between the Marina Bay downtown and Raffles Place in Singapore;
One Raffles Place, an integrated commercial development comprising two
Grade A office towers and a retail mall located in the heart of the
Singapore’s central business district at Raffles Place; and
Lippo Plaza, a Grade A commercial building located in Huangpu, one of
Shanghai’s established core CBD locations
4
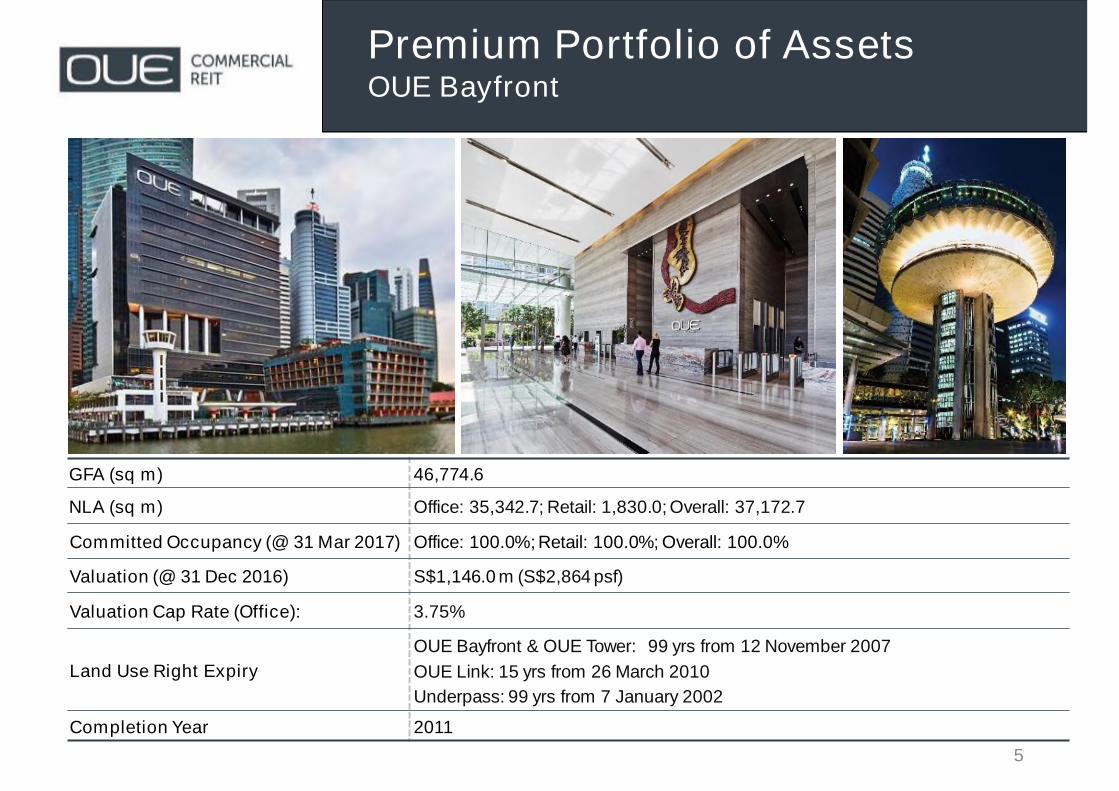
Premium Portfolio of AssetsOUE Bayfront
5
GFA (sq m) 46,774.6
NLA (sq m) Office: 35,342.7; Retail: 1,830.0; Overall: 37,172.7
Committed Occupancy (@ 31 Mar 2017) Office: 100.0%; Retail: 100.0%; Overall: 100.0%
Valuation (@ 31 Dec 2016) S$1,146.0 m (S$2,864 psf)
Valuation Cap Rate (Office): 3.75%
Land Use Right Expiry
OUE Bayfront & OUE Tower: 99 yrs from 12 November 2007
OUE Link: 15 yrs from 26 March 2010
Underpass: 99 yrs from 7 January 2002
Completion Year 2011
6
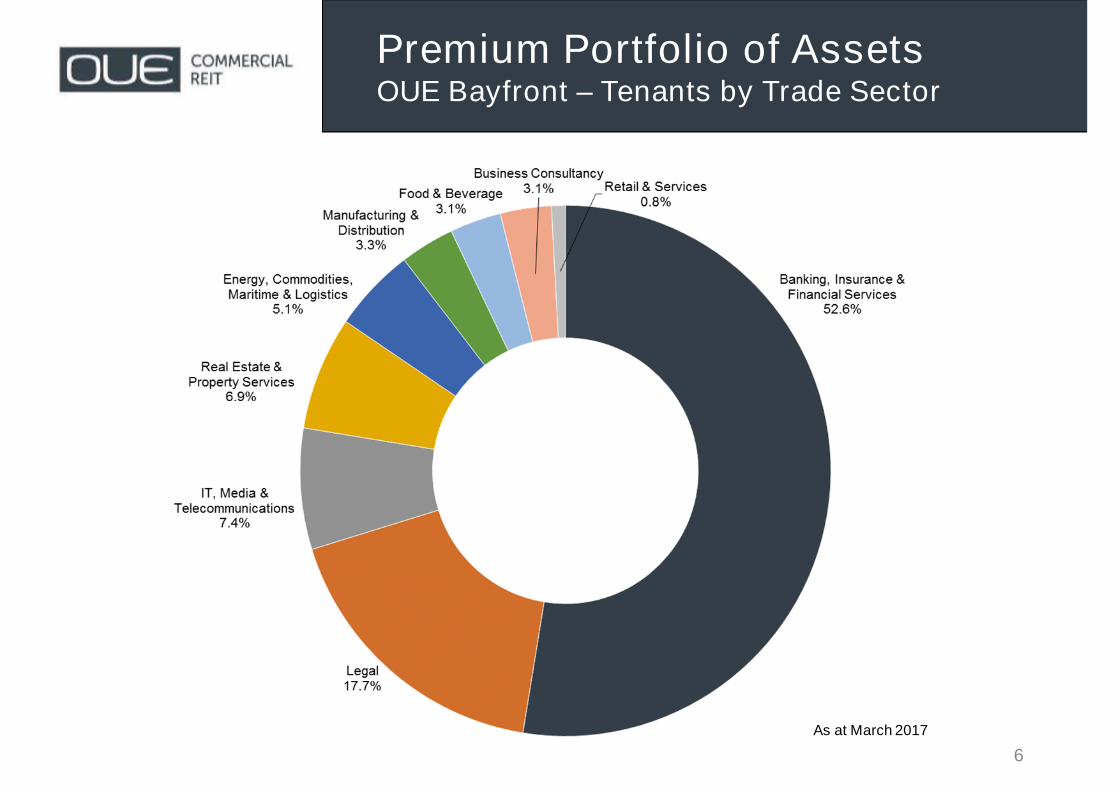
Premium Portfolio of AssetsOUE Bayfront – Tenants by Trade Sector
As at March 2017
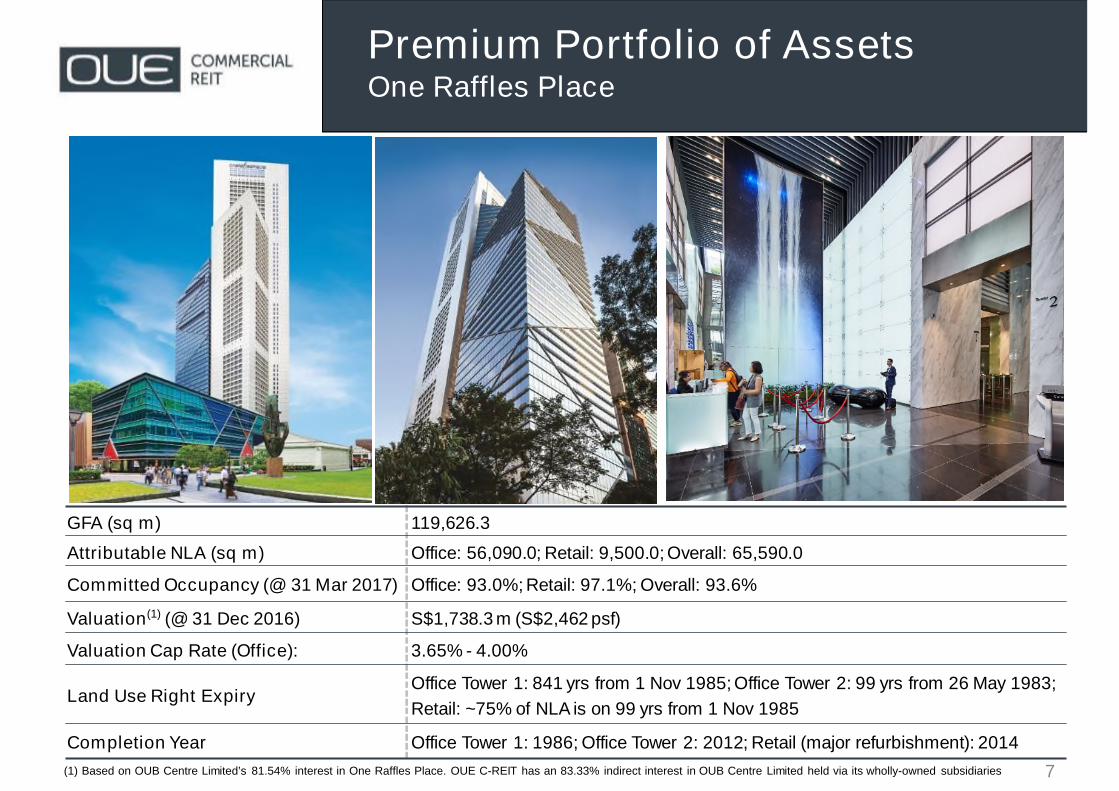
GFA (sq m) 119,626.3
Attributable NLA (sq m) Office: 56,090.0; Retail: 9,500.0; Overall: 65,590.0
Committed Occupancy (@ 31 Mar 2017) Office: 93.0%; Retail: 97.1%; Overall: 93.6%
Valuation(1) (@ 31 Dec 2016) S$1,738.3 m (S$2,462 psf)
Valuation Cap Rate (Office): 3.65% - 4.00%
Land Use Right ExpiryOffice Tower 1: 841 yrs from 1 Nov 1985; Office Tower 2: 99 yrs from 26 May 1983;
Retail: ~75% of NLA is on 99 yrs from 1 Nov 1985
Completion Year Office Tower 1: 1986; Office Tower 2: 2012; Retail (major refurbishment): 2014
Premium Portfolio of AssetsOne Raffles Place
7(1) Based on OUB Centre Limited’s 81.54% interest in One Raffles Place. OUE C-REIT has an 83.33% indirect interest in OUB Centre Limited held via its wholly-owned subsidiaries
8
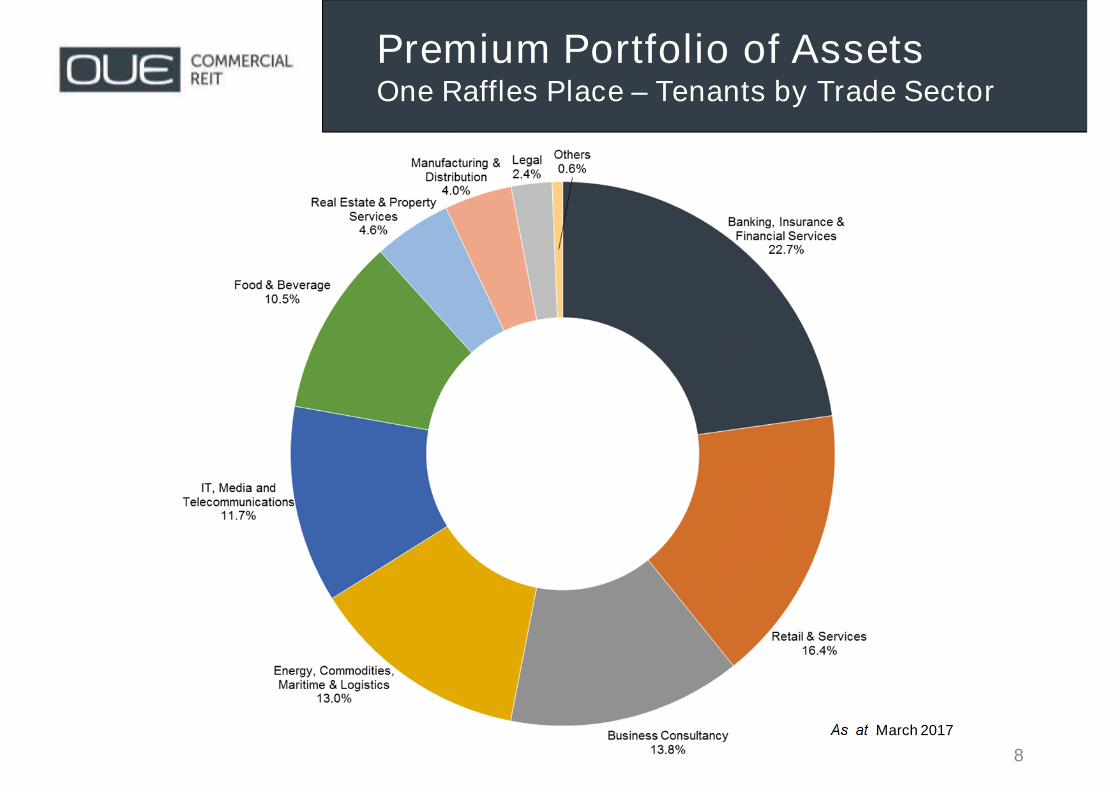
Premium Portfolio of AssetsOne Raffles Place – Tenants by Trade Sector
As at March 2017
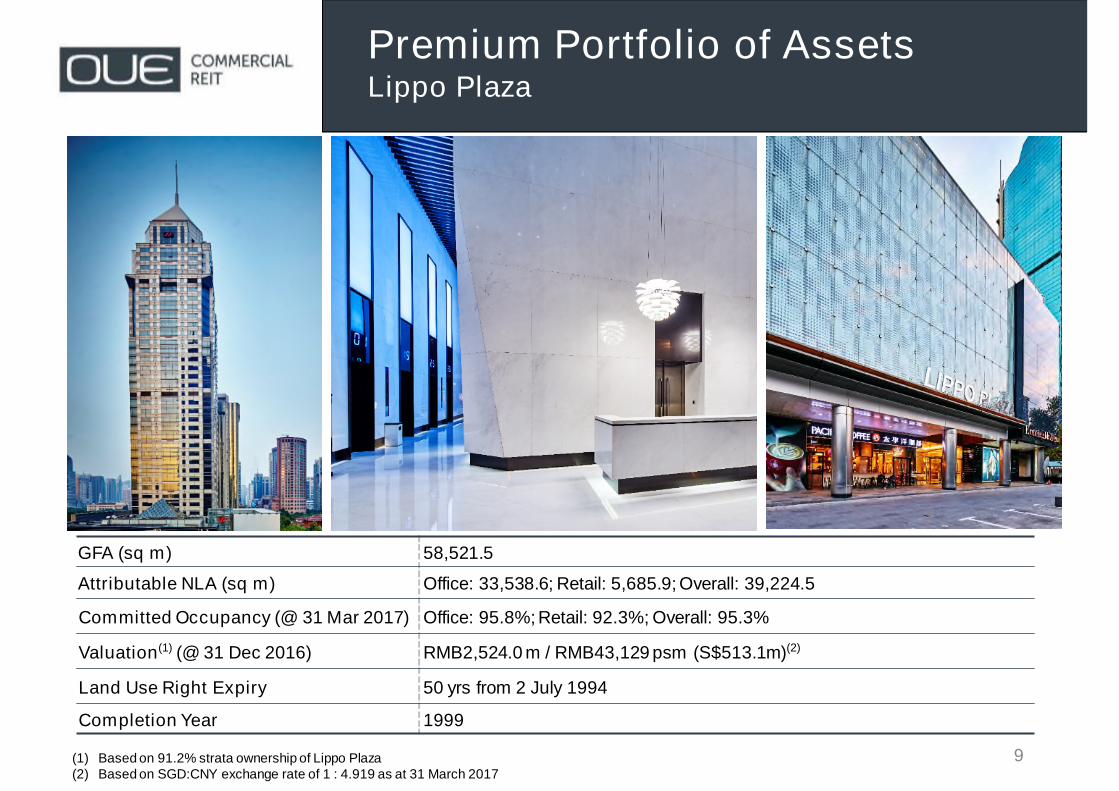
GFA (sq m) 58,521.5
Attributable NLA (sq m) Office: 33,538.6; Retail: 5,685.9; Overall: 39,224.5
Committed Occupancy (@ 31 Mar 2017) Office: 95.8%; Retail: 92.3%; Overall: 95.3%
Valuation(1) (@ 31 Dec 2016) RMB2,524.0 m / RMB43,129 psm (S$513.1m)(2)
Land Use Right Expiry 50 yrs from 2 July 1994
Completion Year 1999
Premium Portfolio of AssetsLippo Plaza
9(1) Based on 91.2% strata ownership of Lippo Plaza(2) Based on SGD:CNY exchange rate of 1 : 4.919 as at 31 March 2017
10
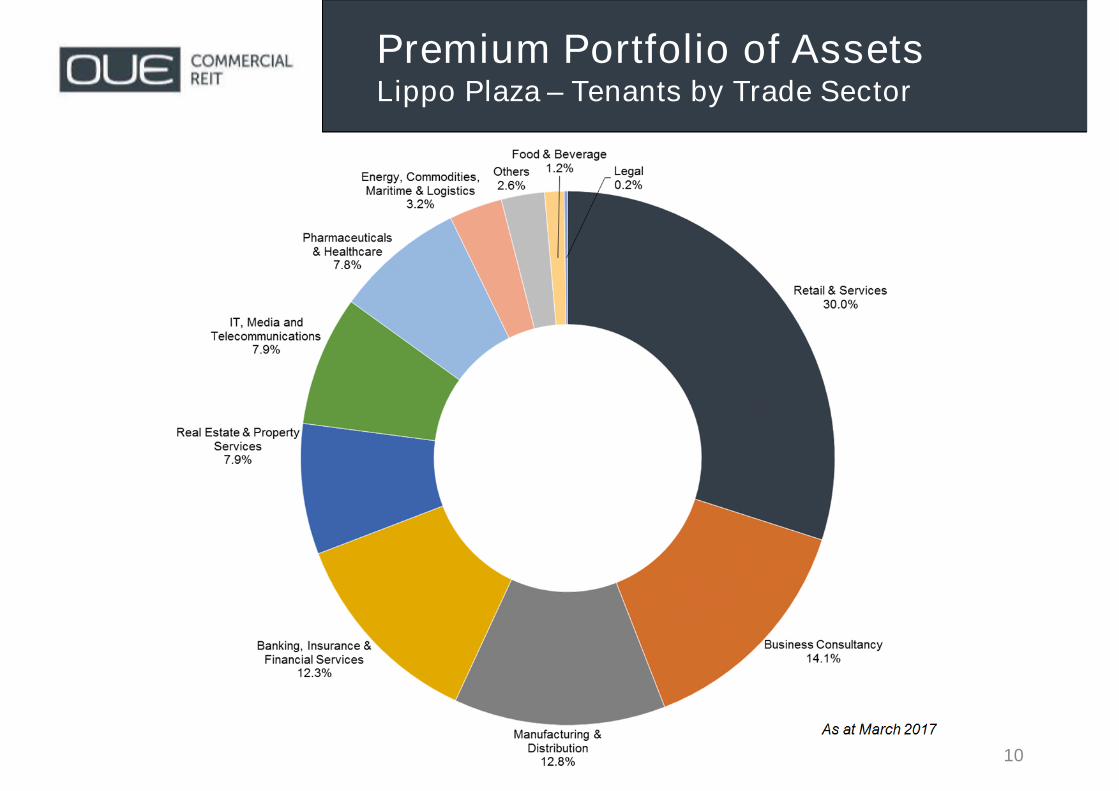
Premium Portfolio of AssetsLippo Plaza – Tenants by Trade Sector
As at March 2017
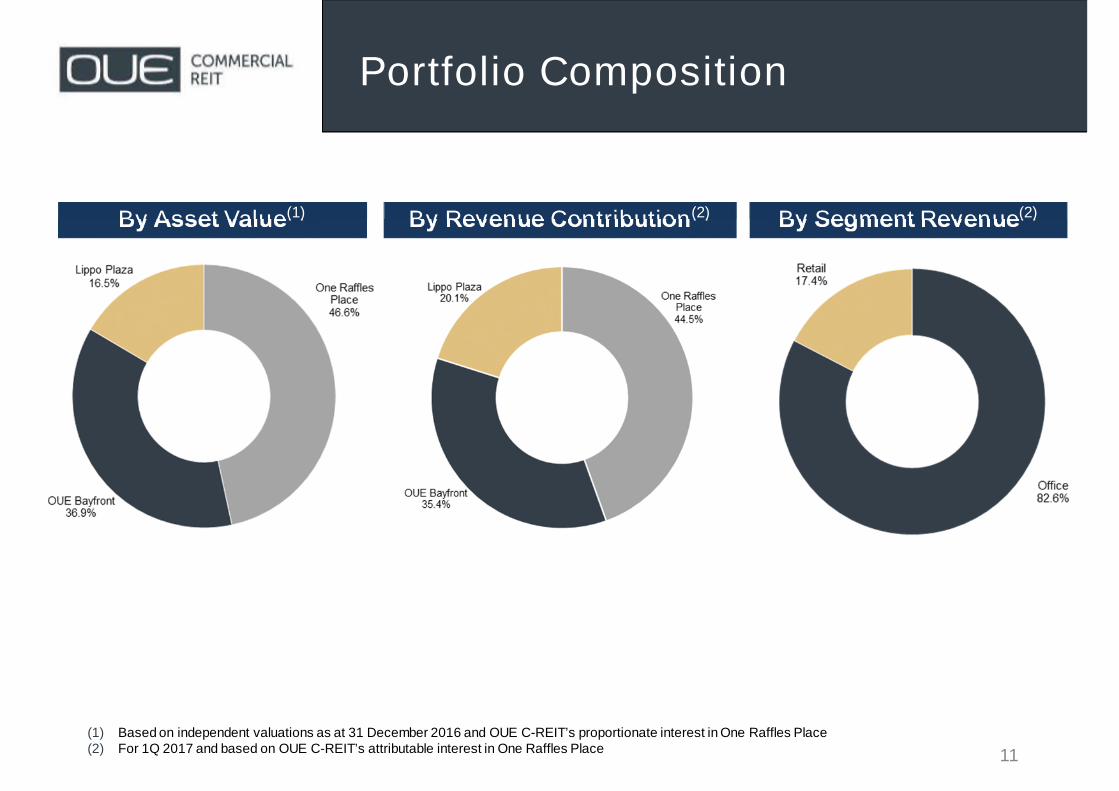
Portfolio Composition
11
By Asset Value(1) By Revenue Contribution(2) By Segment Revenue(2)
(1) Based on independent valuations as at 31 December 2016 and OUE C-REIT’s proportionate interest in One Raffles Place(2) For 1Q 2017 and based on OUE C-REIT’s attributable interest in One Raffles Place
12
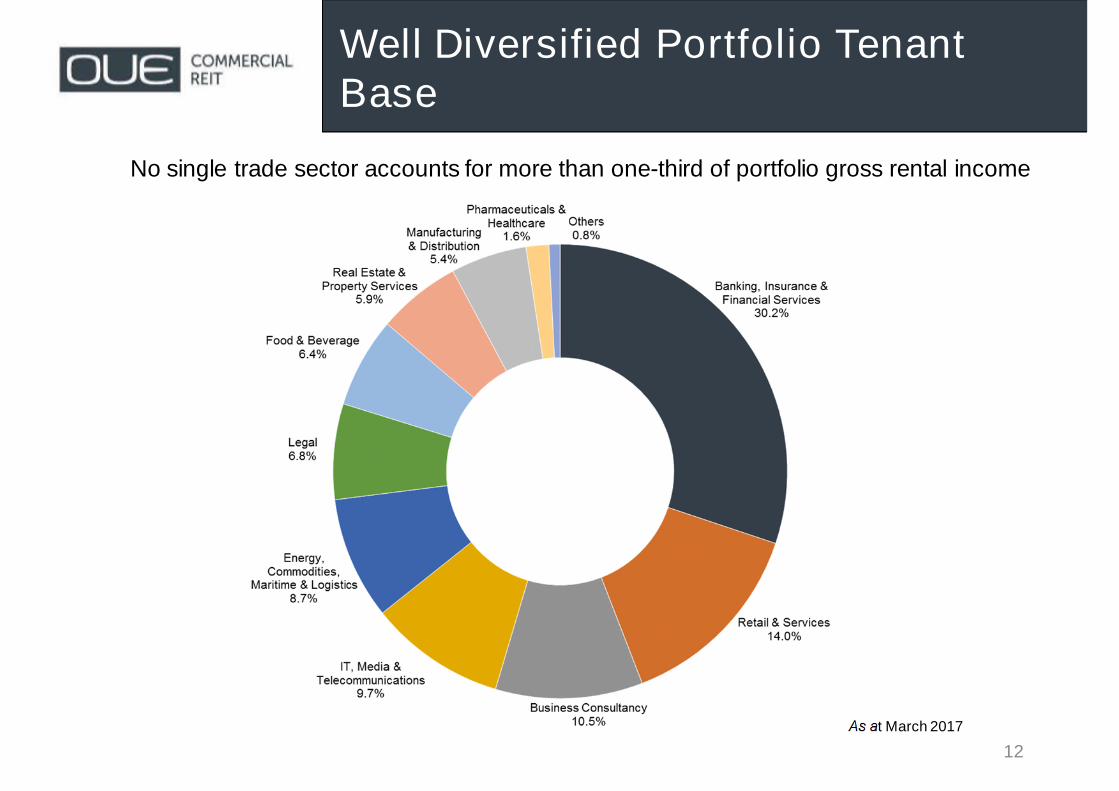
Well Diversified Portfolio TenantBase
As at March 2017
No single trade sector accounts for more than one-third of portfolio gross rental income
13
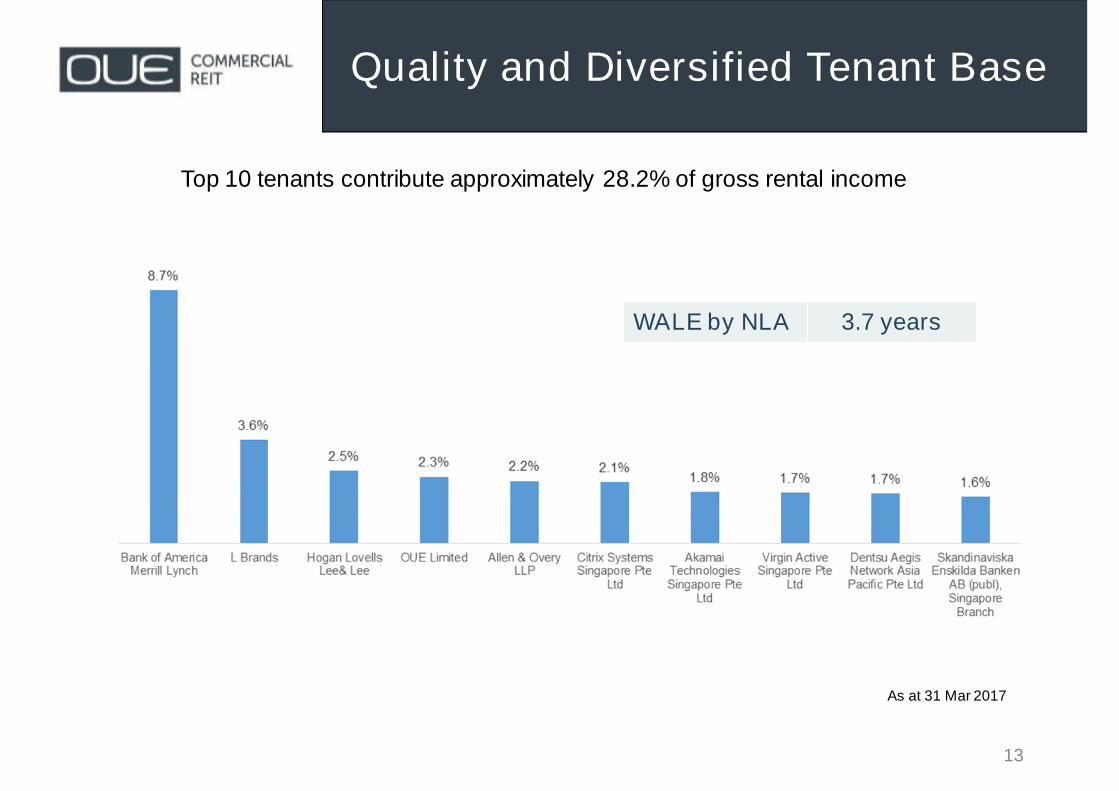
Quality and Diversified Tenant Base
WALE by NLA 3.7 years
Top 10 tenants contribute approximately 28.2% of gross rental income
As at 31 Mar 2017
FinancialPerformance &CapitalManagement
FinancialPerformance &CapitalManagement
15
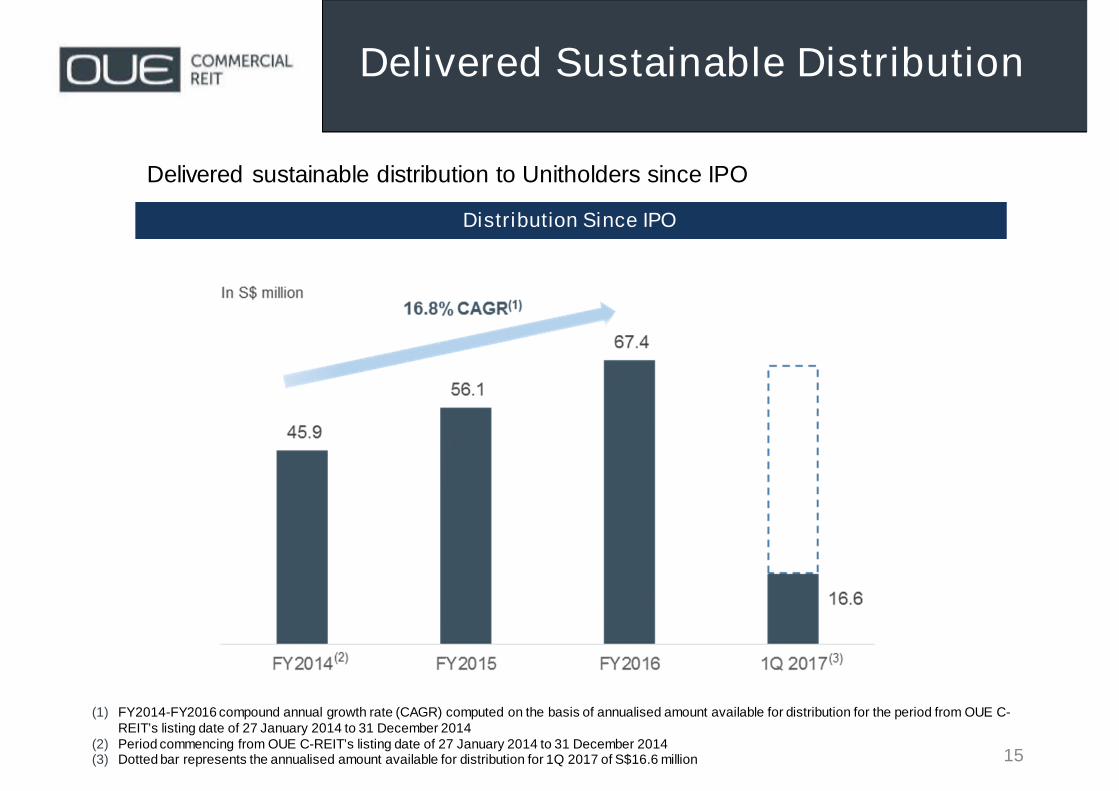
Delivered sustainable distribution to Unitholders since IPO
Distribution Since IPO
(1) FY2014-FY2016 compound annual growth rate (CAGR) computed on the basis of annualised amount available for distribution for the period from OUE C-REIT’s listing date of 27 January 2014 to 31 December 2014
(2) Period commencing from OUE C-REIT’s listing date of 27 January 2014 to 31 December 2014(3) Dotted bar represents the annualised amount available for distribution for 1Q 2017 of S$16.6 million
Delivered Sustainable Distribution
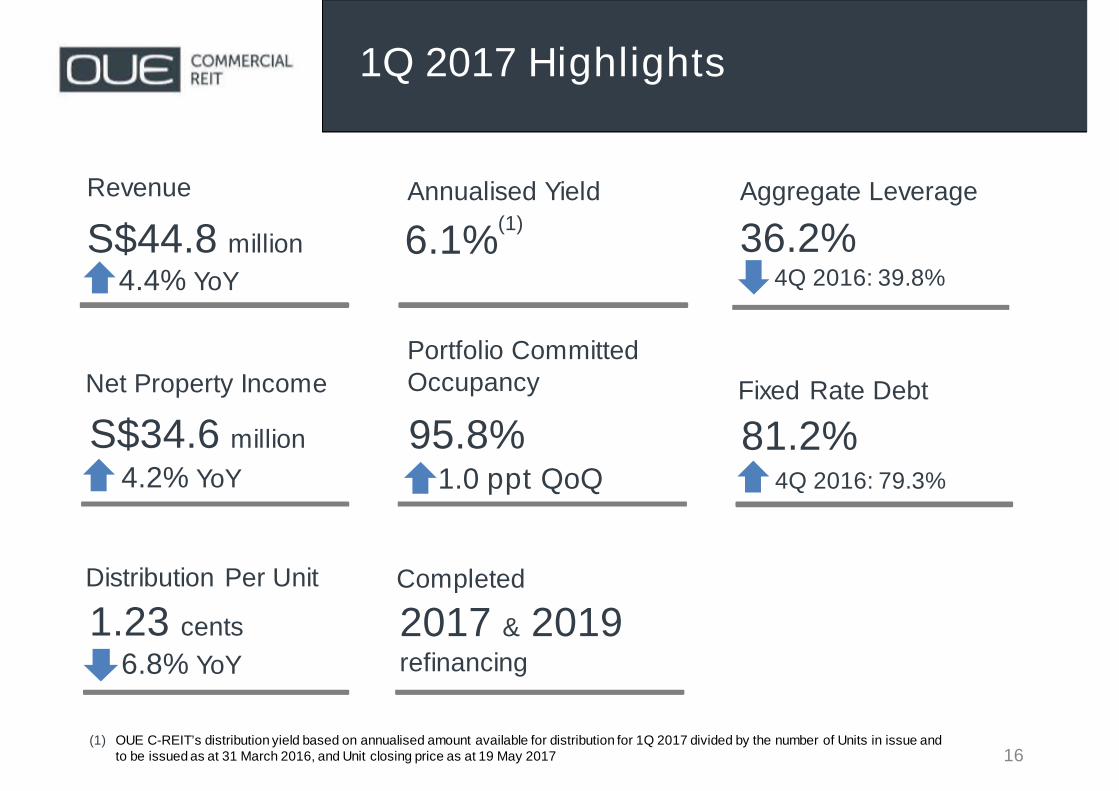
1Q 2017 Highlights
16
1.23 cents
6.8% YoY
6.1%
Aggregate Leverage
36.2%
S$34.6 million
4.2% YoY
4Q 2016: 39.8%
(1)S$44.8 million
4.4% YoY
Revenue
Net Property Income
Distribution Per Unit
Annualised Yield
95.8%1.0 ppt QoQ
Portfolio CommittedOccupancy Fixed Rate Debt
81.2%4Q 2016: 79.3%
(1) OUE C-REIT’s distribution yield based on annualised amount available for distribution for 1Q 2017 divided by the number of Units in issue andto be issued as at 31 March 2016, and Unit closing price as at 19 May 2017
2017 & 2019refinancing
Completed
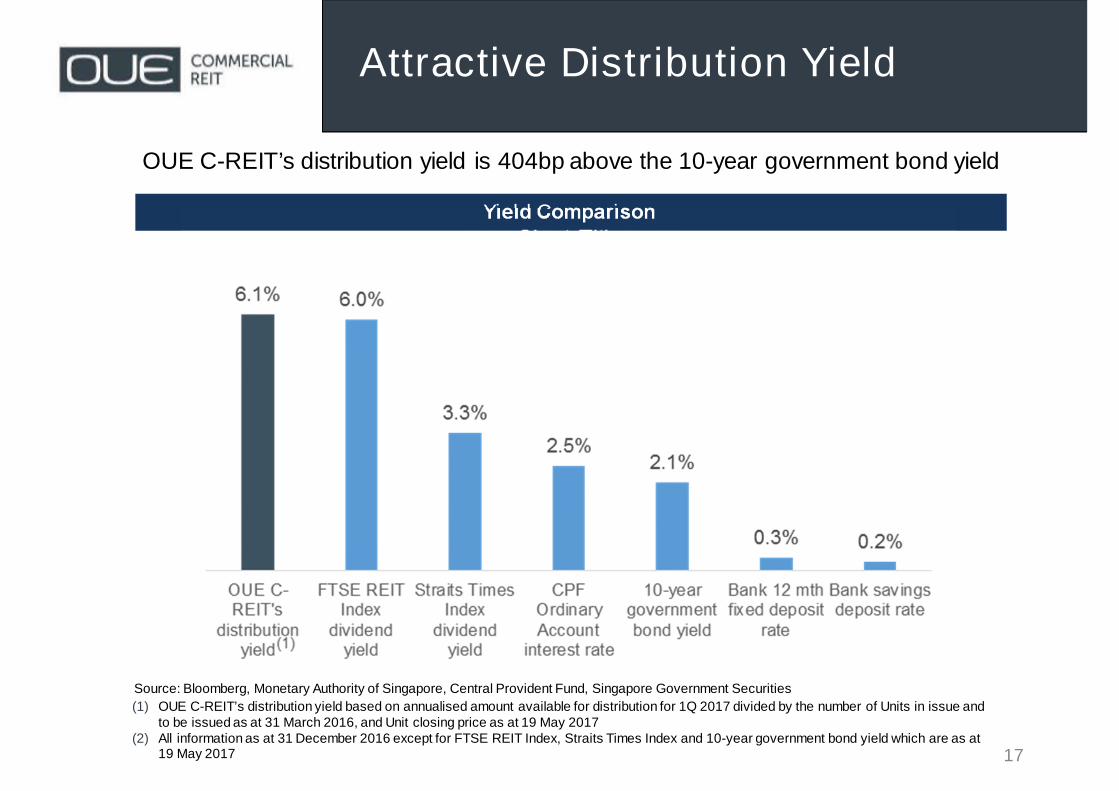
Attractive Distribution Yield
Yield Comparison
OUE C-REIT’s distribution yield is 404bp above the 10-year government bond yield
Source: Bloomberg, Monetary Authority of Singapore, Central Provident Fund, Singapore Government Securities
(1) OUE C-REIT’s distribution yield based on annualised amount available for distribution for 1Q 2017 divided by the number of Units in issue andto be issued as at 31 March 2016, and Unit closing price as at 19 May 2017
(2) All information as at 31 December 2016 except for FTSE REIT Index, Straits Times Index and 10-year government bond yield which are as at19 May 2017 17
Healthy Balance Sheet
18
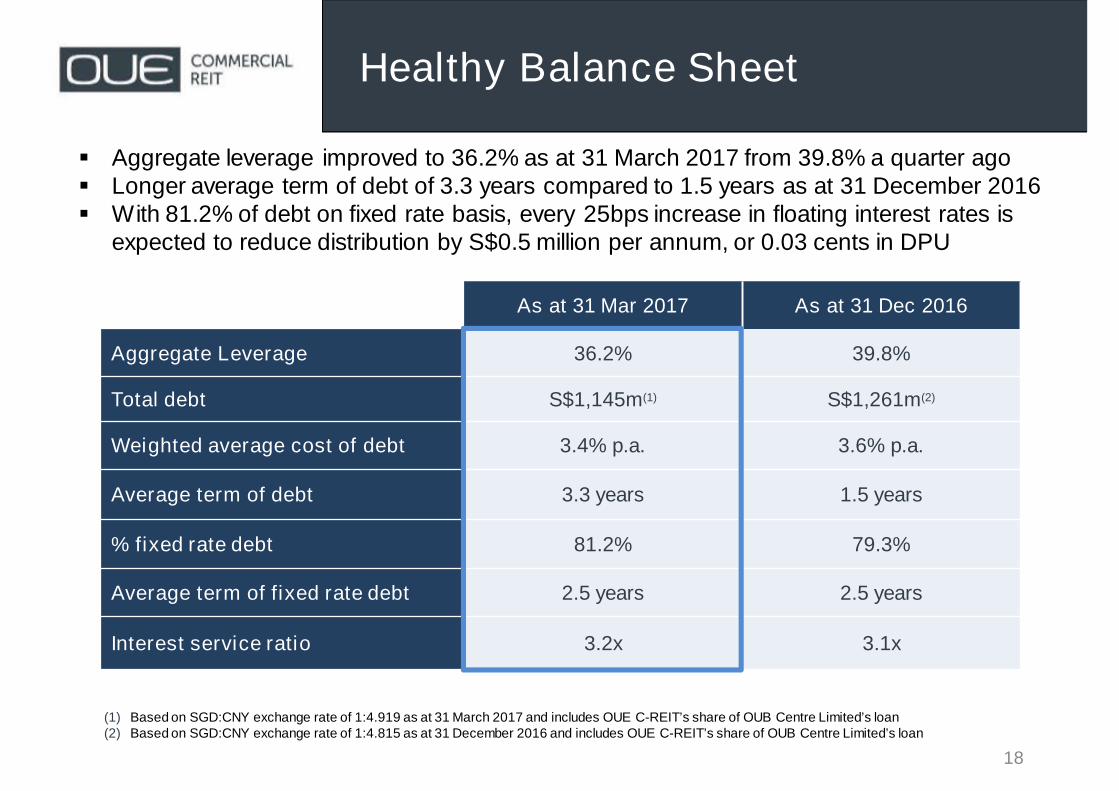
As at 31 Mar 2017 As at 31 Dec 2016
Aggregate Leverage 36.2% 39.8%
Total debt S$1,145m(1) S$1,261m(2)
Weighted average cost of debt 3.4% p.a. 3.6% p.a.
Average term of debt 3.3 years 1.5 years
% fixed rate debt 81.2% 79.3%
Average term of fixed rate debt 2.5 years 2.5 years
Interest service ratio 3.2x 3.1x
(1) Based on SGD:CNY exchange rate of 1:4.919 as at 31 March 2017 and includes OUE C-REIT’s share of OUB Centre Limited’s loan(2) Based on SGD:CNY exchange rate of 1:4.815 as at 31 December 2016 and includes OUE C-REIT’s share of OUB Centre Limited’s loan
Aggregate leverage improved to 36.2% as at 31 March 2017 from 39.8% a quarter ago Longer average term of debt of 3.3 years compared to 1.5 years as at 31 December 2016 With 81.2% of debt on fixed rate basis, every 25bps increase in floating interest rates is
expected to reduce distribution by S$0.5 million per annum, or 0.03 cents in DPU
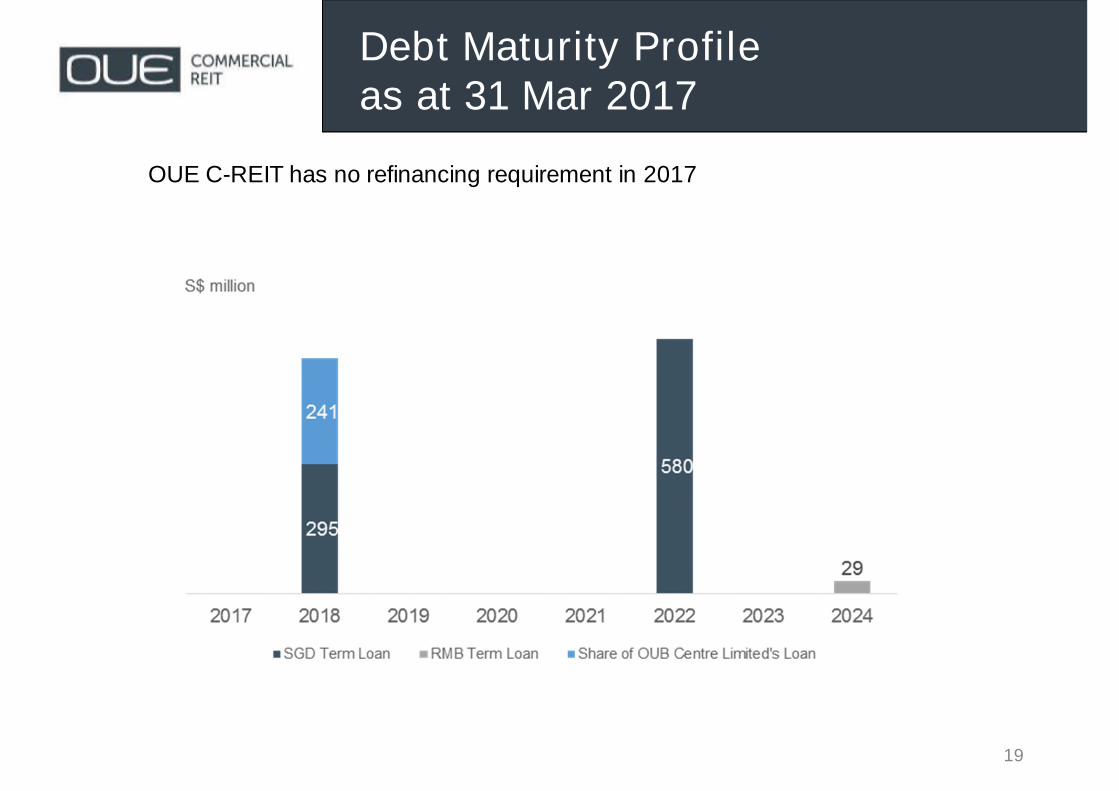
Debt Maturity Profileas at 31 Mar 2017
19
OUE C-REIT has no refinancing requirement in 2017
PortfolioPerformancePortfolioPerformance
21
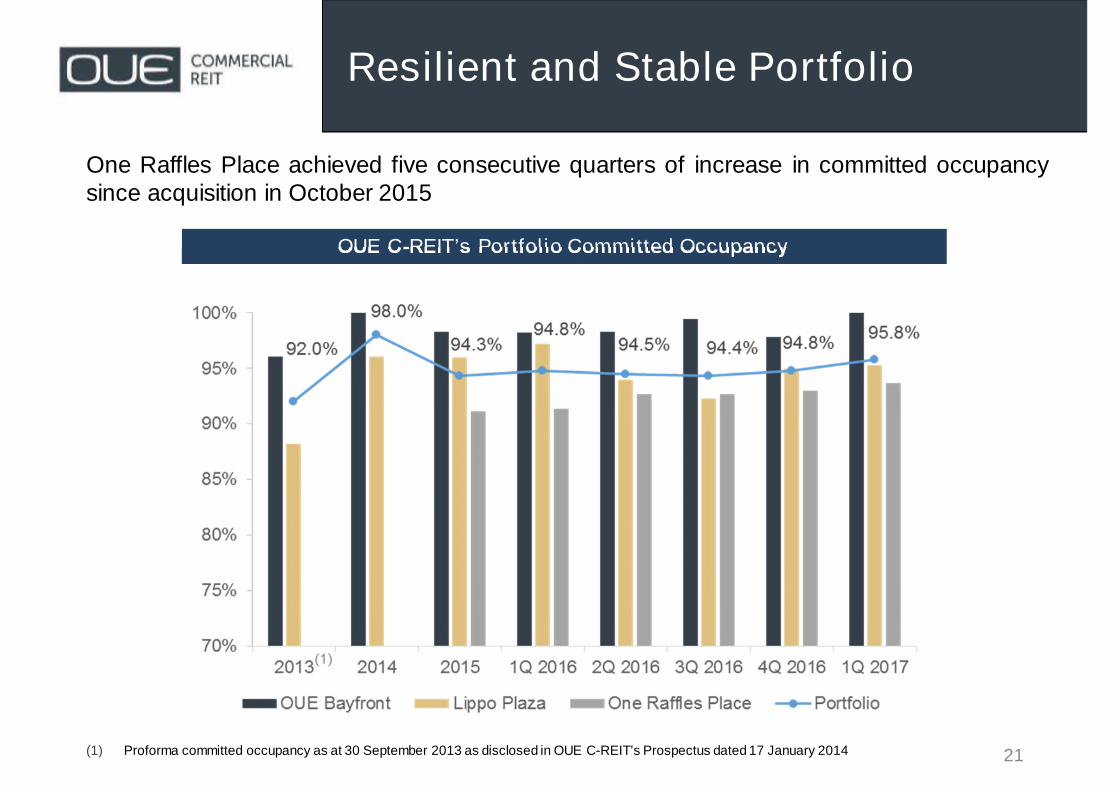
Resilient and Stable Portfolio
(1) Proforma committed occupancy as at 30 September 2013 as disclosed in OUE C-REIT’s Prospectus dated 17 January 2014
OUE C-REIT’s Portfolio Committed Occupancy
One Raffles Place achieved five consecutive quarters of increase in committed occupancysince acquisition in October 2015
22
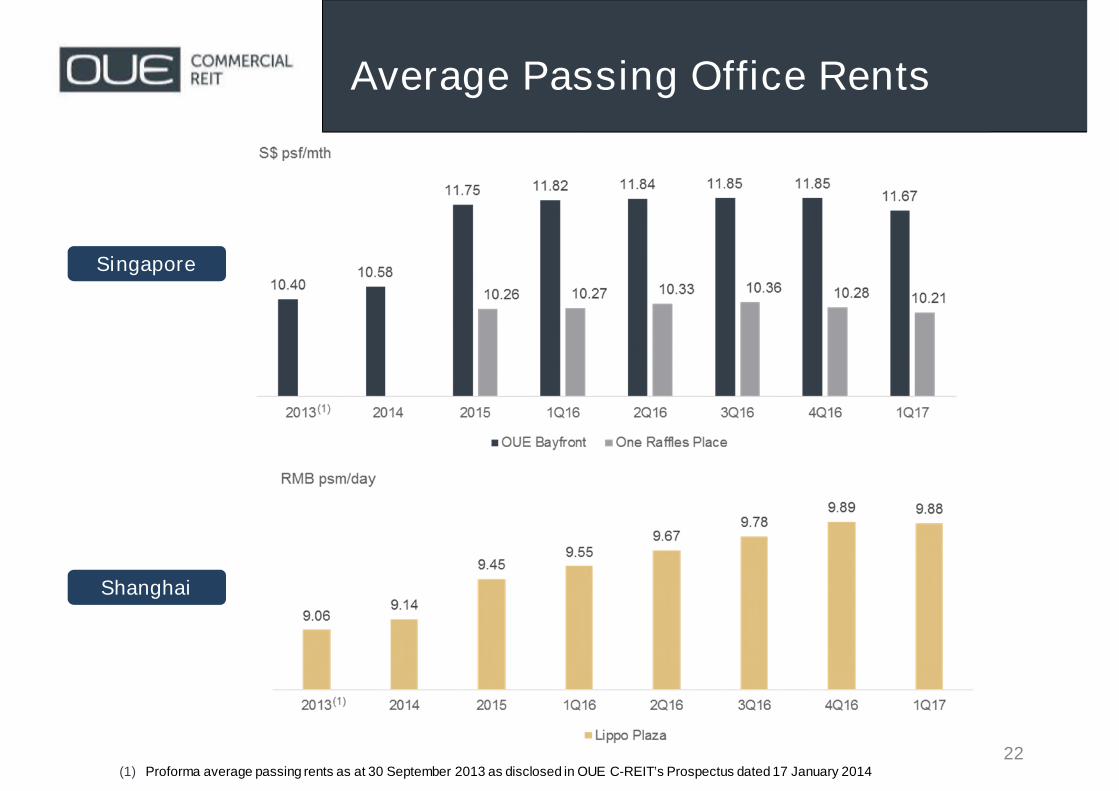
Average Passing Office Rents
(1) Proforma average passing rents as at 30 September 2013 as disclosed in OUE C-REIT’s Prospectus dated 17 January 2014
Singapore
Shanghai
23
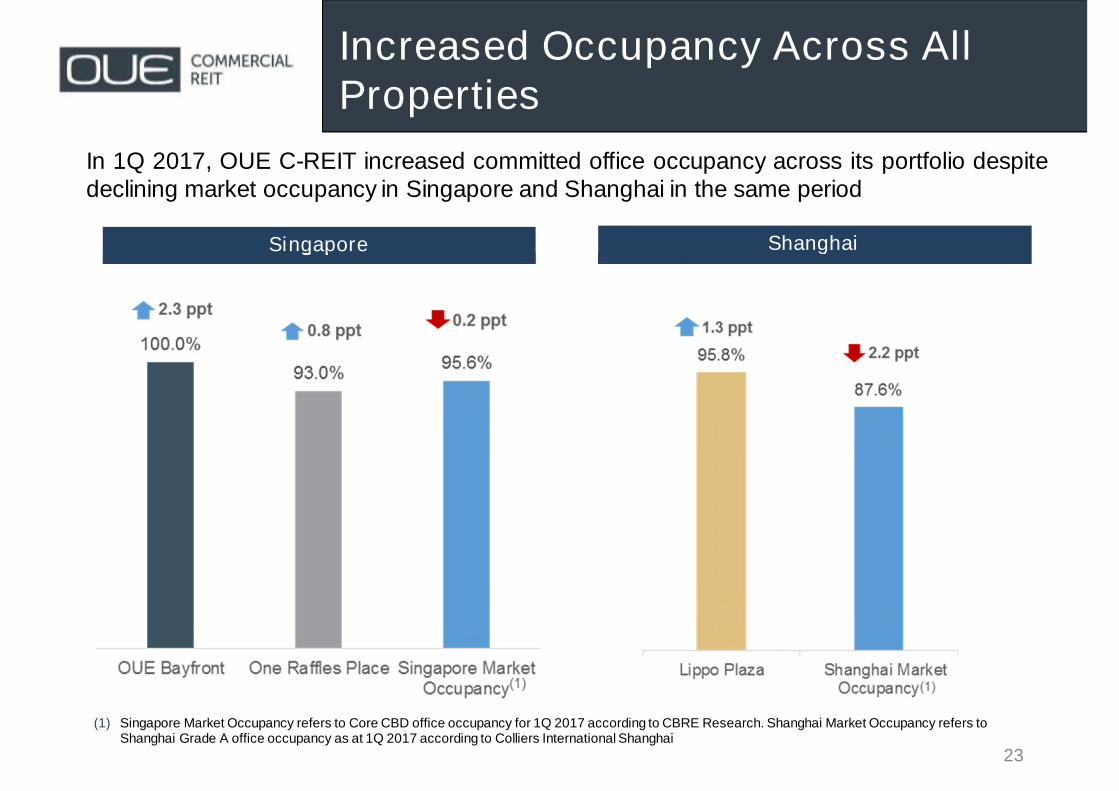
Increased Occupancy Across AllProperties
(1) Singapore Market Occupancy refers to Core CBD office occupancy for 1Q 2017 according to CBRE Research. Shanghai Market Occupancy refers toShanghai Grade A office occupancy as at 1Q 2017 according to Colliers International Shanghai
Singapore Shanghai
In 1Q 2017, OUE C-REIT increased committed office occupancy across its portfolio despitedeclining market occupancy in Singapore and Shanghai in the same period
24
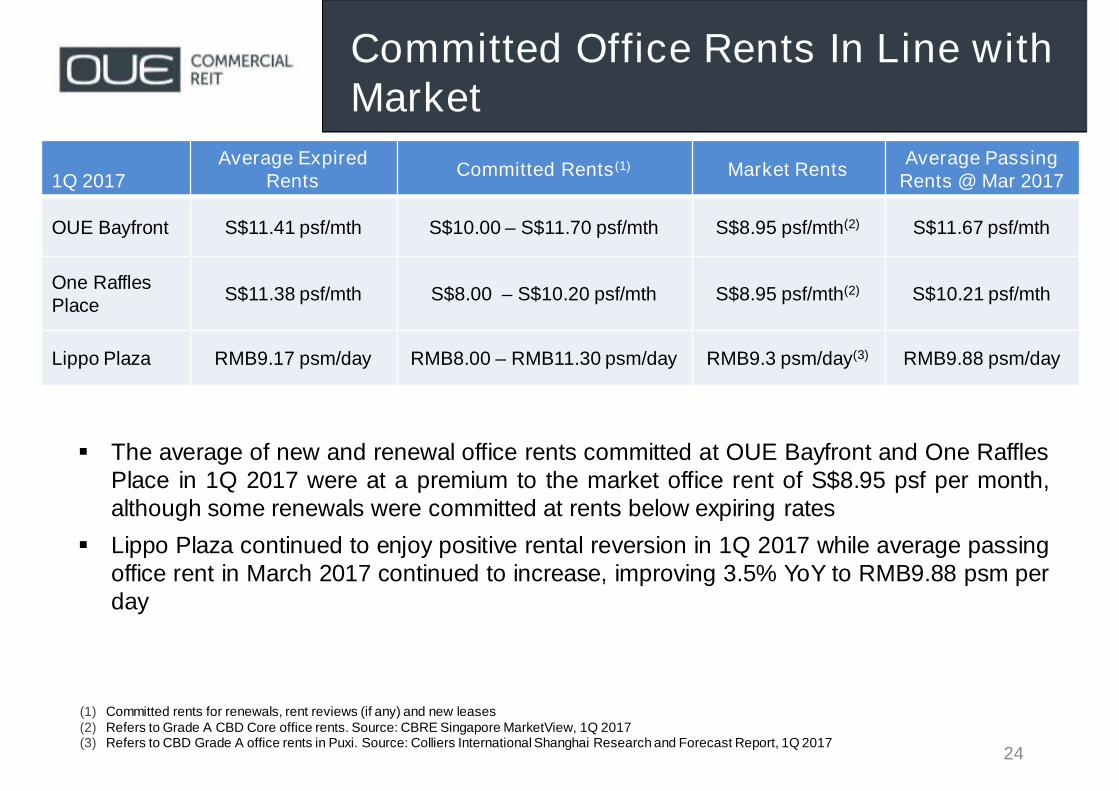
Committed Office Rents In Line withMarket
1Q 2017Average Expired
RentsCommitted Rents(1) Market Rents
Average PassingRents @ Mar 2017
OUE Bayfront S$11.41 psf/mth S$10.00 – S$11.70 psf/mth S$8.95 psf/mth(2) S$11.67 psf/mth
One RafflesPlace
S$11.38 psf/mth S$8.00 – S$10.20 psf/mth S$8.95 psf/mth(2) S$10.21 psf/mth
Lippo Plaza RMB9.17 psm/day RMB8.00 – RMB11.30 psm/day RMB9.3 psm/day(3) RMB9.88 psm/day
(1) Committed rents for renewals, rent reviews (if any) and new leases(2) Refers to Grade A CBD Core office rents. Source: CBRE Singapore MarketView, 1Q 2017(3) Refers to CBD Grade A office rents in Puxi. Source: Colliers International Shanghai Research and Forecast Report, 1Q 2017
The average of new and renewal office rents committed at OUE Bayfront and One RafflesPlace in 1Q 2017 were at a premium to the market office rent of S$8.95 psf per month,although some renewals were committed at rents below expiring rates
Lippo Plaza continued to enjoy positive rental reversion in 1Q 2017 while average passingoffice rent in March 2017 continued to increase, improving 3.5% YoY to RMB9.88 psm perday
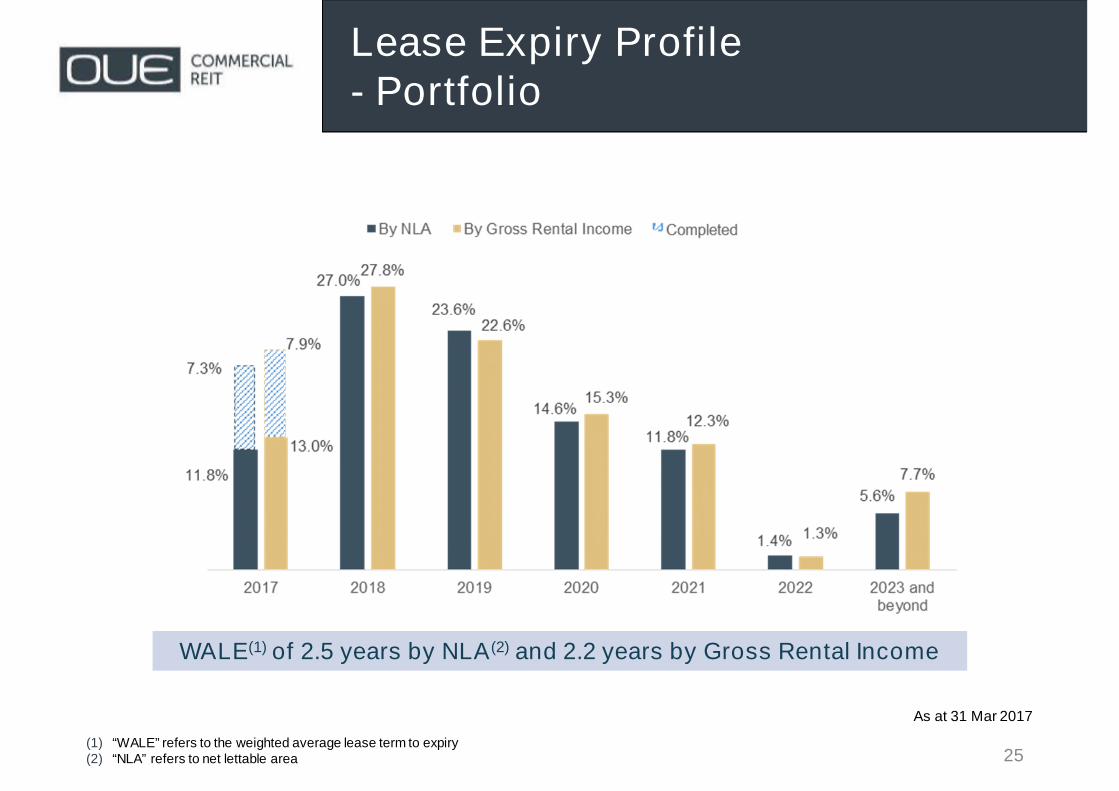
WALE(1) of 2.5 years by NLA(2) and 2.2 years by Gross Rental Income
25
Lease Expiry Profile- Portfolio
(1) “WALE” refers to the weighted average lease term to expiry(2) “NLA” refers to net lettable area
As at 31 Mar 2017
SummarySummary
27
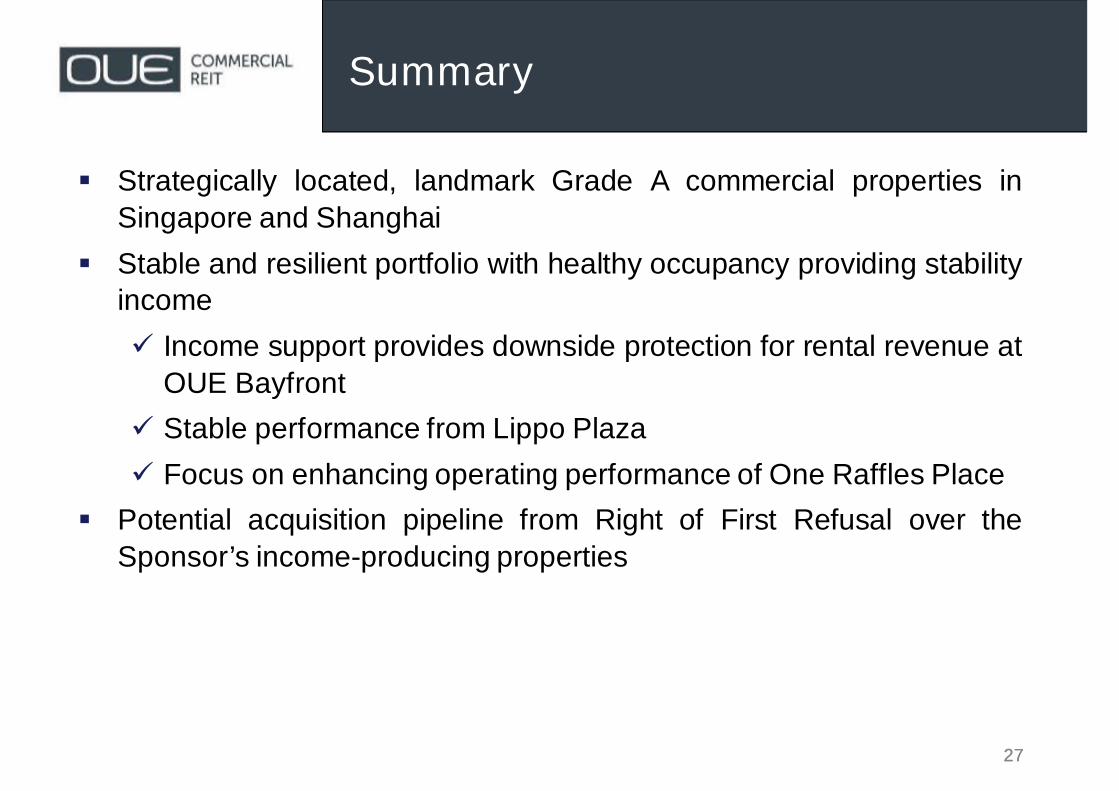
Strategically located, landmark Grade A commercial properties in
Singapore and Shanghai
Stable and resilient portfolio with healthy occupancy providing stabilityincome
Income support provides downside protection for rental revenue at
OUE Bayfront
Stable performance from Lippo Plaza
Focus on enhancing operating performance of One Raffles Place
Potential acquisition pipeline from Right of First Refusal over the
Sponsor’s income-producing properties
Summary
27

Thank you