Embed Size (px)
Citation preview
November 8, 2019
Presentation for Investors1H FY2019 (April 1 – September 30, 2019)
Financial Results
Presented by Junichi Miyazaki,
Director, Senior Executive Vice President & CFO
Head of Finance & Accounting Department
Translation of presentation materials for the investor meeting held in Tokyo on November 8, 2019

3
Highlight
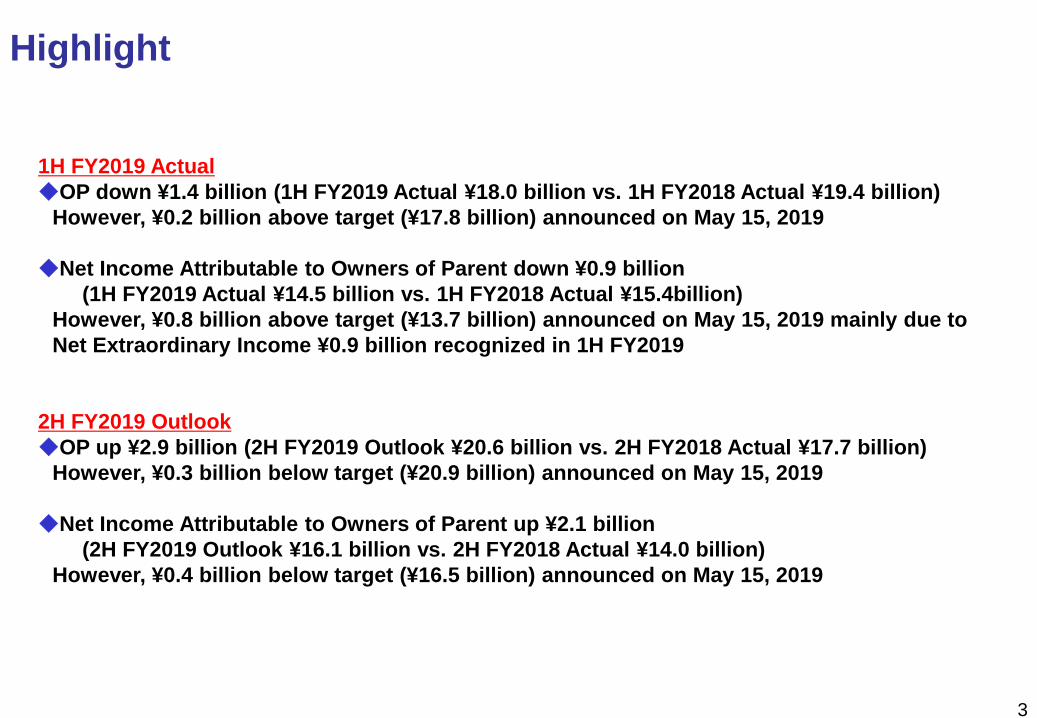
1H FY2019 Actual
◆OP down ¥1.4 billion (1H FY2019 Actual ¥18.0 billion vs. 1H FY2018 Actual ¥19.4 billion)
However, ¥0.2 billion above target (¥17.8 billion) announced on May 15, 2019
◆Net Income Attributable to Owners of Parent down ¥0.9 billion
(1H FY2019 Actual ¥14.5 billion vs. 1H FY2018 Actual ¥15.4billion)
However, ¥0.8 billion above target (¥13.7 billion) announced on May 15, 2019 mainly due to
Net Extraordinary Income ¥0.9 billion recognized in 1H FY2019
2H FY2019 Outlook
◆OP up ¥2.9 billion (2H FY2019 Outlook ¥20.6 billion vs. 2H FY2018 Actual ¥17.7 billion)
However, ¥0.3 billion below target (¥20.9 billion) announced on May 15, 2019
◆Net Income Attributable to Owners of Parent up ¥2.1 billion
(2H FY2019 Outlook ¥16.1 billion vs. 2H FY2018 Actual ¥14.0 billion)
However, ¥0.4 billion below target (¥16.5 billion) announced on May 15, 2019
4
Highlight
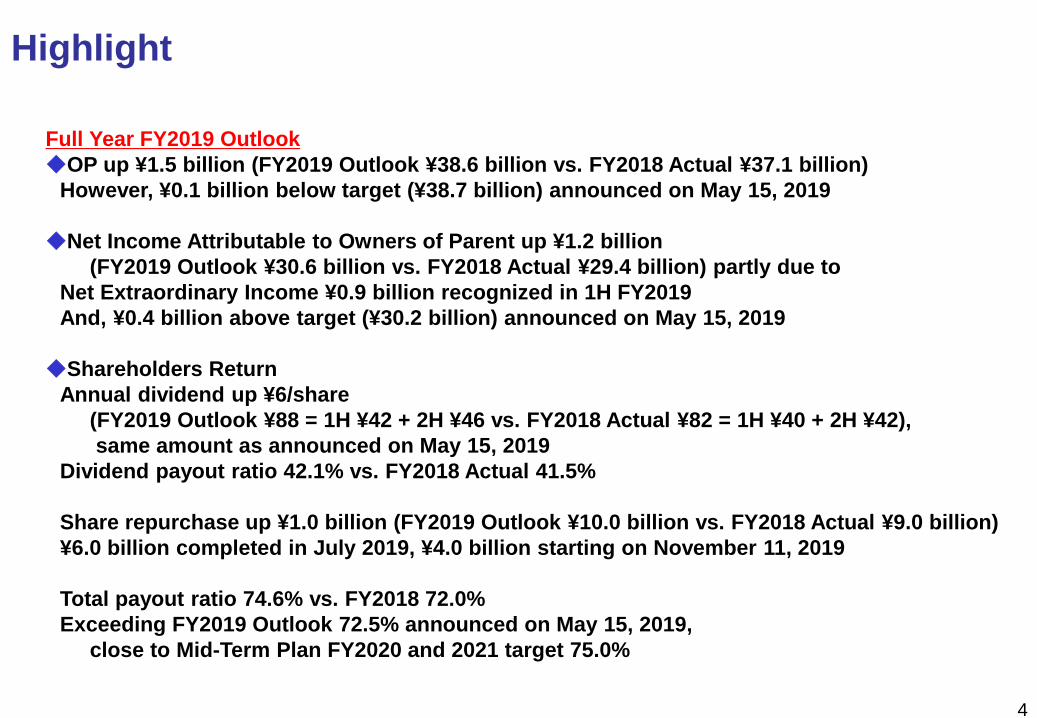
Full Year FY2019 Outlook
◆OP up ¥1.5 billion (FY2019 Outlook ¥38.6 billion vs. FY2018 Actual ¥37.1 billion)
However, ¥0.1 billion below target (¥38.7 billion) announced on May 15, 2019
◆Net Income Attributable to Owners of Parent up ¥1.2 billion
(FY2019 Outlook ¥30.6 billion vs. FY2018 Actual ¥29.4 billion) partly due to
Net Extraordinary Income ¥0.9 billion recognized in 1H FY2019
And, ¥0.4 billion above target (¥30.2 billion) announced on May 15, 2019
◆Shareholders Return
Annual dividend up ¥6/share
(FY2019 Outlook ¥88 = 1H ¥42 + 2H ¥46 vs. FY2018 Actual ¥82 = 1H ¥40 + 2H ¥42),
same amount as announced on May 15, 2019
Dividend payout ratio 42.1% vs. FY2018 Actual 41.5%
Share repurchase up ¥1.0 billion (FY2019 Outlook ¥10.0 billion vs. FY2018 Actual ¥9.0 billion)
¥6.0 billion completed in July 2019, ¥4.0 billion starting on November 11, 2019
Total payout ratio 74.6% vs. FY2018 72.0%
Exceeding FY2019 Outlook 72.5% announced on May 15, 2019,
close to Mid-Term Plan FY2020 and 2021 target 75.0%
5
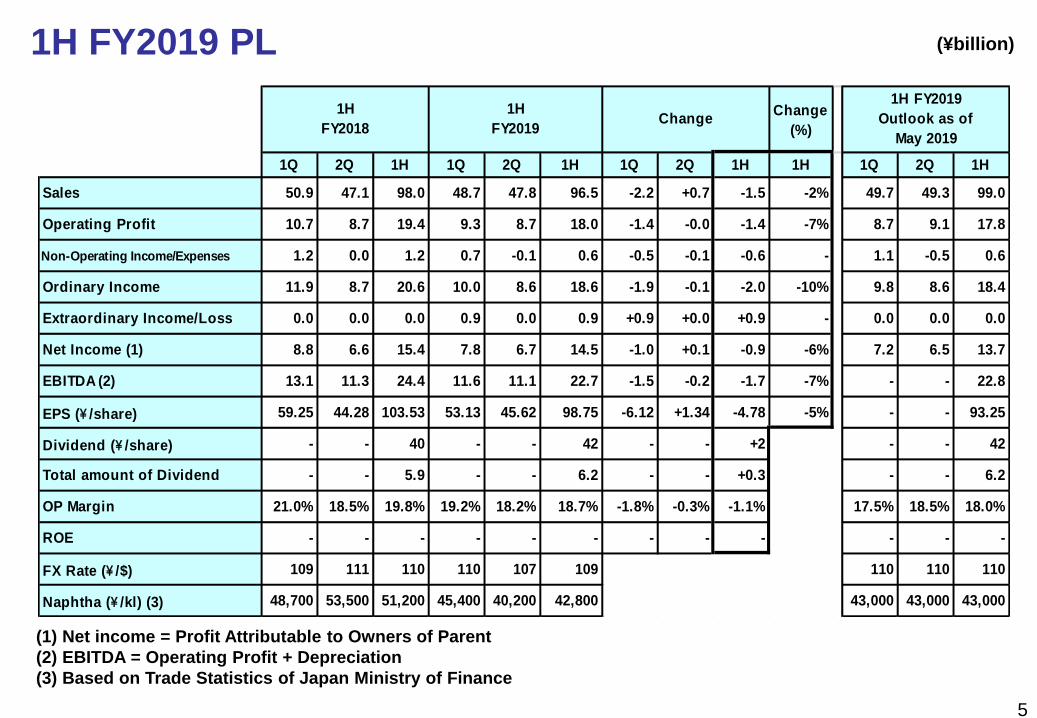
1H FY2019 PL
Change
(%)
1Q 2Q 1H 1Q 2Q 1H 1Q 2Q 1H 1H 1Q 2Q 1H
Sales 50.9 47.1 98.0 48.7 47.8 96.5 -2.2 +0.7 -1.5 -2% 49.7 49.3 99.0
Operating Profit 10.7 8.7 19.4 9.3 8.7 18.0 -1.4 -0.0 -1.4 -7% 8.7 9.1 17.8
Non-Operating Income/Expenses 1.2 0.0 1.2 0.7 -0.1 0.6 -0.5 -0.1 -0.6 - 1.1 -0.5 0.6
Ordinary Income 11.9 8.7 20.6 10.0 8.6 18.6 -1.9 -0.1 -2.0 -10% 9.8 8.6 18.4
Extraordinary Income/Loss 0.0 0.0 0.0 0.9 0.0 0.9 +0.9 +0.0 +0.9 - 0.0 0.0 0.0
Net Income (1) 8.8 6.6 15.4 7.8 6.7 14.5 -1.0 +0.1 -0.9 -6% 7.2 6.5 13.7
EBITDA (2) 13.1 11.3 24.4 11.6 11.1 22.7 -1.5 -0.2 -1.7 -7% - - 22.8
EPS (\ /share) 59.25 44.28 103.53 53.13 45.62 98.75 -6.12 +1.34 -4.78 -5% - - 93.25
Dividend (\ /share) - - 40 - - 42 - - +2 - - 42
Total amount of Dividend - - 5.9 - - 6.2 - - +0.3 - - 6.2
OP Margin 21.0% 18.5% 19.8% 19.2% 18.2% 18.7% -1.8% -0.3% -1.1% 17.5% 18.5% 18.0%
ROE - - - - - - - - - - - -
FX Rate (\ /$) 109 111 110 110 107 109 110 110 110
Naphtha (\ /kl) (3) 48,700 53,500 51,200 45,400 40,200 42,800 43,000 43,000 43,000
1H
FY2018
1H
FY2019Change
1H FY2019
Outlook as of
May 2019
(¥billion)
(1) Net income = Profit Attributable to Owners of Parent
(2) EBITDA = Operating Profit + Depreciation
(3) Based on Trade Statistics of Japan Ministry of Finance
6
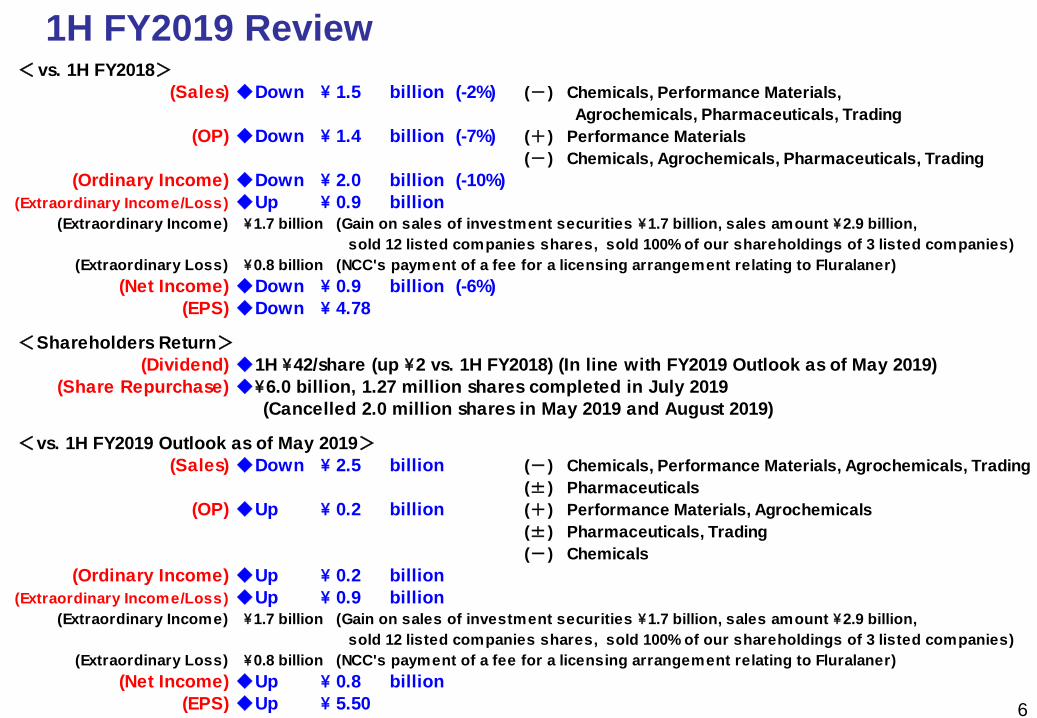
1H FY2019 Review<vs. 1H FY2018>
(Sales) ◆Down \ 1.5 billion (-2%) (-) Chemicals, Performance Materials,
Agrochemicals, Pharmaceuticals, Trading
(OP) ◆Down \ 1.4 billion (-7%) (+) Performance Materials
(-) Chemicals, Agrochemicals, Pharmaceuticals, Trading
(Ordinary Income) ◆Down \ 2.0 billion (-10%)
(Extraordinary Income/Loss) ◆Up \ 0.9 billion(Extraordinary Income) \1.7 billion (Gain on sales of investment securities \1.7 billion, sales amount \2.9 billion,
sold 12 listed companies shares, sold 100% of our shareholdings of 3 listed companies)
(Extraordinary Loss) \0.8 billion (NCC's payment of a fee for a licensing arrangement relating to Fluralaner)
(Net Income) ◆Down \ 0.9 billion (-6%)
(EPS) ◆Down \ 4.78
<Shareholders Return>(Dividend) ◆1H \42/share (up \2 vs. 1H FY2018) (In line with FY2019 Outlook as of May 2019)
(Share Repurchase) ◆\6.0 billion, 1.27 million shares completed in July 2019
(Cancelled 2.0 million shares in May 2019 and August 2019)
<vs. 1H FY2019 Outlook as of May 2019>(Sales) ◆Down \ 2.5 billion (-) Chemicals, Performance Materials, Agrochemicals, Trading
(±) Pharmaceuticals
(OP) ◆Up \ 0.2 billion (+) Performance Materials, Agrochemicals
(±) Pharmaceuticals, Trading
(-) Chemicals
(Ordinary Income) ◆Up \ 0.2 billion
(Extraordinary Income/Loss) ◆Up \ 0.9 billion(Extraordinary Income) \1.7 billion (Gain on sales of investment securities \1.7 billion, sales amount \2.9 billion,
sold 12 listed companies shares, sold 100% of our shareholdings of 3 listed companies)
(Extraordinary Loss) \0.8 billion (NCC's payment of a fee for a licensing arrangement relating to Fluralaner)
(Net Income) ◆Up \ 0.8 billion
(EPS) ◆Up \ 5.50
7
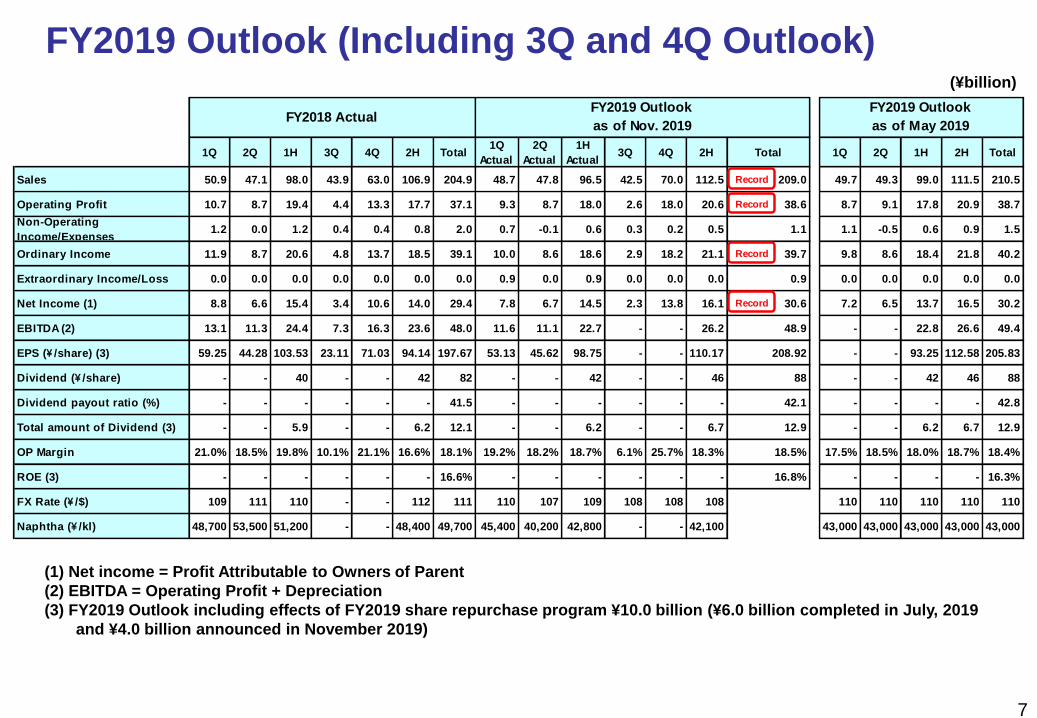
FY2019 Outlook (Including 3Q and 4Q Outlook)(¥billion)
(1) Net income = Profit Attributable to Owners of Parent
(2) EBITDA = Operating Profit + Depreciation
(3) FY2019 Outlook including effects of FY2019 share repurchase program ¥10.0 billion (¥6.0 billion completed in July, 2019
and ¥4.0 billion announced in November 2019)
1Q 2Q 1H 3Q 4Q 2H Total1Q
Actual
2Q
Actual
1H
Actual3Q 4Q 2H Total 1Q 2Q 1H 2H Total
Sales 50.9 47.1 98.0 43.9 63.0 106.9 204.9 48.7 47.8 96.5 42.5 70.0 112.5 209.0 49.7 49.3 99.0 111.5 210.5
Operating Profit 10.7 8.7 19.4 4.4 13.3 17.7 37.1 9.3 8.7 18.0 2.6 18.0 20.6 38.6 8.7 9.1 17.8 20.9 38.7
Non-Operating
Income/Expenses1.2 0.0 1.2 0.4 0.4 0.8 2.0 0.7 -0.1 0.6 0.3 0.2 0.5 1.1 1.1 -0.5 0.6 0.9 1.5
Ordinary Income 11.9 8.7 20.6 4.8 13.7 18.5 39.1 10.0 8.6 18.6 2.9 18.2 21.1 39.7 9.8 8.6 18.4 21.8 40.2
Extraordinary Income/Loss 0.0 0.0 0.0 0.0 0.0 0.0 0.0 0.9 0.0 0.9 0.0 0.0 0.0 0.9 0.0 0.0 0.0 0.0 0.0
Net Income (1) 8.8 6.6 15.4 3.4 10.6 14.0 29.4 7.8 6.7 14.5 2.3 13.8 16.1 30.6 7.2 6.5 13.7 16.5 30.2
EBITDA (2) 13.1 11.3 24.4 7.3 16.3 23.6 48.0 11.6 11.1 22.7 - - 26.2 48.9 - - 22.8 26.6 49.4
EPS (\ /share) (3) 59.25 44.28 103.53 23.11 71.03 94.14 197.67 53.13 45.62 98.75 - - 110.17 208.92 - - 93.25 112.58 205.83
Dividend (\ /share) - - 40 - - 42 82 - - 42 - - 46 88 - - 42 46 88
Dividend payout ratio (%) - - - - - - 41.5 - - - - - - 42.1 - - - - 42.8
Total amount of Dividend (3) - - 5.9 - - 6.2 12.1 - - 6.2 - - 6.7 12.9 - - 6.2 6.7 12.9
OP Margin 21.0% 18.5% 19.8% 10.1% 21.1% 16.6% 18.1% 19.2% 18.2% 18.7% 6.1% 25.7% 18.3% 18.5% 17.5% 18.5% 18.0% 18.7% 18.4%
ROE (3) - - - - - - 16.6% - - - - - - 16.8% - - - - 16.3%
FX Rate (\ /$) 109 111 110 - - 112 111 110 107 109 108 108 108 110 110 110 110 110
Naphtha (\ /kl) 48,700 53,500 51,200 - - 48,400 49,700 45,400 40,200 42,800 - - 42,100 43,000 43,000 43,000 43,000 43,000
FY2019 Outlook
as of Nov. 2019
FY2019 Outlook
as of May 2019FY2018 Actual
Record
Record
Record
Record
8
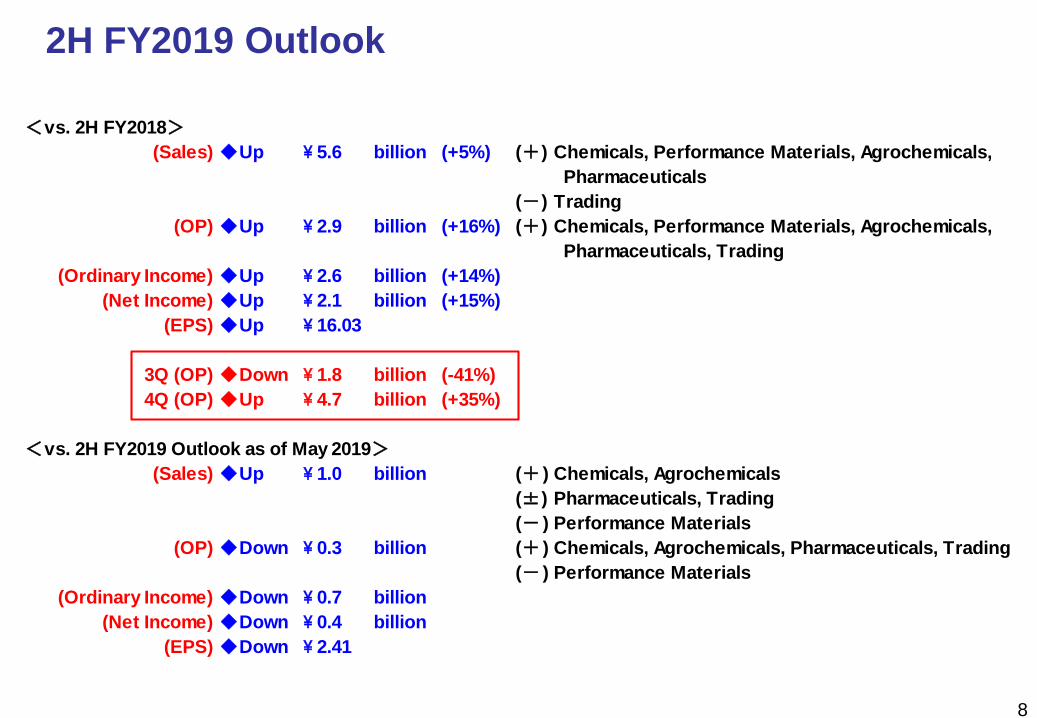
2H FY2019 Outlook
<vs. 2H FY2018>
(Sales) ◆Up \ 5.6 billion (+5%) (+) Chemicals, Performance Materials, Agrochemicals,
Pharmaceuticals
(-) Trading
(OP) ◆Up \ 2.9 billion (+16%) (+) Chemicals, Performance Materials, Agrochemicals,
Pharmaceuticals, Trading
(Ordinary Income) ◆Up \ 2.6 billion (+14%)
(Net Income) ◆Up \ 2.1 billion (+15%)
(EPS) ◆Up \ 16.03
3Q (OP) ◆Down \ 1.8 billion (-41%)
4Q (OP) ◆Up \ 4.7 billion (+35%)
<vs. 2H FY2019 Outlook as of May 2019>
(Sales) ◆Up \ 1.0 billion (+ ) Chemicals, Agrochemicals
(±) Pharmaceuticals, Trading
(- ) Performance Materials
(OP) ◆Down \ 0.3 billion (+ ) Chemicals, Agrochemicals, Pharmaceuticals, Trading
(- ) Performance Materials
(Ordinary Income) ◆Down \ 0.7 billion
(Net Income) ◆Down \ 0.4 billion
(EPS) ◆Down \ 2.41
9
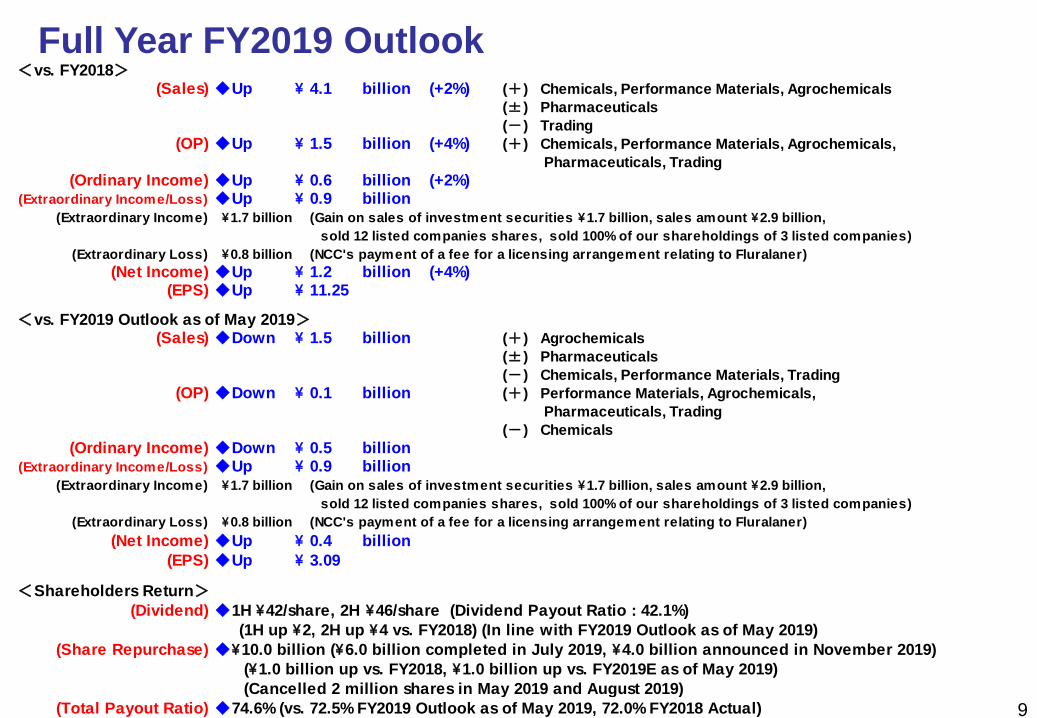
Full Year FY2019 Outlook<vs. FY2018>
(Sales) ◆Up \ 4.1 billion (+2%) (+) Chemicals, Performance Materials, Agrochemicals
(±) Pharmaceuticals
(-) Trading
(OP) ◆Up \ 1.5 billion (+4%) (+) Chemicals, Performance Materials, Agrochemicals,
Pharmaceuticals, Trading
(Ordinary Income) ◆Up \ 0.6 billion (+2%)(Extraordinary Income/Loss) ◆Up \ 0.9 billion
(Extraordinary Income) \1.7 billion (Gain on sales of investment securities \1.7 billion, sales amount \2.9 billion,
sold 12 listed companies shares, sold 100% of our shareholdings of 3 listed companies)
(Extraordinary Loss) \0.8 billion (NCC's payment of a fee for a licensing arrangement relating to Fluralaner)
(Net Income) ◆Up \ 1.2 billion (+4%)(EPS) ◆Up \ 11.25
<vs. FY2019 Outlook as of May 2019>(Sales) ◆Down \ 1.5 billion (+) Agrochemicals
(±) Pharmaceuticals
(-) Chemicals, Performance Materials, Trading
(OP) ◆Down \ 0.1 billion (+) Performance Materials, Agrochemicals,
Pharmaceuticals, Trading
(-) Chemicals
(Ordinary Income) ◆Down \ 0.5 billion(Extraordinary Income/Loss) ◆Up \ 0.9 billion
(Extraordinary Income) \1.7 billion (Gain on sales of investment securities \1.7 billion, sales amount \2.9 billion,
sold 12 listed companies shares, sold 100% of our shareholdings of 3 listed companies)
(Extraordinary Loss) \0.8 billion (NCC's payment of a fee for a licensing arrangement relating to Fluralaner)
(Net Income) ◆Up \ 0.4 billion
(EPS) ◆Up \ 3.09
<Shareholders Return>(Dividend) ◆1H \42/share, 2H \46/share (Dividend Payout Ratio : 42.1%)
(1H up \2, 2H up \4 vs. FY2018) (In line with FY2019 Outlook as of May 2019)
(Share Repurchase) ◆\10.0 billion (\6.0 billion completed in July 2019, \4.0 billion announced in November 2019)
(\1.0 billion up vs. FY2018, \1.0 billion up vs. FY2019E as of May 2019)
(Cancelled 2 million shares in May 2019 and August 2019)
(Total Payout Ratio) ◆74.6% (vs. 72.5% FY2019 Outlook as of May 2019, 72.0% FY2018 Actual)
10
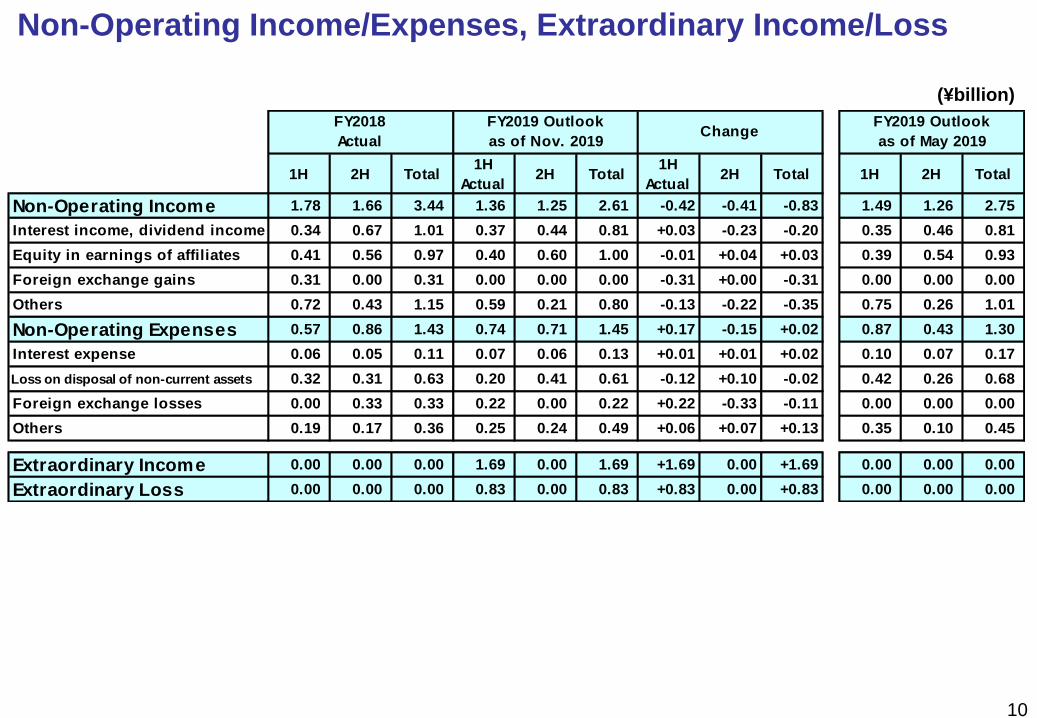
Non-Operating Income/Expenses, Extraordinary Income/Loss
(¥billion)
1H 2H Total1H
Actual2H Total
1H
Actual2H Total 1H 2H Total
Non-Operating Income 1.78 1.66 3.44 1.36 1.25 2.61 -0.42 -0.41 -0.83 1.49 1.26 2.75
Interest income, dividend income 0.34 0.67 1.01 0.37 0.44 0.81 +0.03 -0.23 -0.20 0.35 0.46 0.81
Equity in earnings of affiliates 0.41 0.56 0.97 0.40 0.60 1.00 -0.01 +0.04 +0.03 0.39 0.54 0.93
Foreign exchange gains 0.31 0.00 0.31 0.00 0.00 0.00 -0.31 +0.00 -0.31 0.00 0.00 0.00
Others 0.72 0.43 1.15 0.59 0.21 0.80 -0.13 -0.22 -0.35 0.75 0.26 1.01
Non-Operating Expenses 0.57 0.86 1.43 0.74 0.71 1.45 +0.17 -0.15 +0.02 0.87 0.43 1.30
Interest expense 0.06 0.05 0.11 0.07 0.06 0.13 +0.01 +0.01 +0.02 0.10 0.07 0.17
Loss on disposal of non-current assets 0.32 0.31 0.63 0.20 0.41 0.61 -0.12 +0.10 -0.02 0.42 0.26 0.68
Foreign exchange losses 0.00 0.33 0.33 0.22 0.00 0.22 +0.22 -0.33 -0.11 0.00 0.00 0.00
Others 0.19 0.17 0.36 0.25 0.24 0.49 +0.06 +0.07 +0.13 0.35 0.10 0.45
Extraordinary Income 0.00 0.00 0.00 1.69 0.00 1.69 +1.69 0.00 +1.69 0.00 0.00 0.00
Extraordinary Loss 0.00 0.00 0.00 0.83 0.00 0.83 +0.83 0.00 +0.83 0.00 0.00 0.00
FY2018
Actual
FY2019 Outlook
as of Nov. 2019
FY2019 Outlook
as of May 2019Change
11
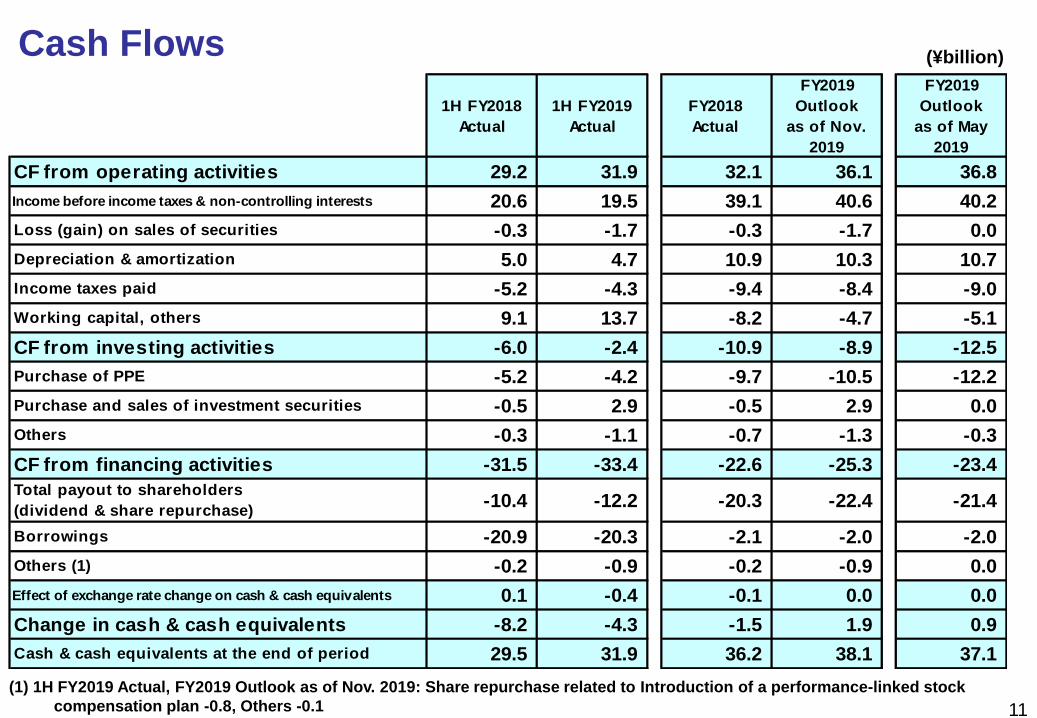
(¥billion)Cash Flows
1H FY2018
Actual
1H FY2019
Actual
FY2018
Actual
FY2019
Outlook
as of Nov.
2019
FY2019
Outlook
as of May
2019
CF from operating activities 29.2 31.9 32.1 36.1 36.8
Income before income taxes & non-controlling interests 20.6 19.5 39.1 40.6 40.2
Loss (gain) on sales of securities -0.3 -1.7 -0.3 -1.7 0.0
Depreciation & amortization 5.0 4.7 10.9 10.3 10.7
Income taxes paid -5.2 -4.3 -9.4 -8.4 -9.0
Working capital, others 9.1 13.7 -8.2 -4.7 -5.1
CF from investing activities -6.0 -2.4 -10.9 -8.9 -12.5
Purchase of PPE -5.2 -4.2 -9.7 -10.5 -12.2
Purchase and sales of investment securities -0.5 2.9 -0.5 2.9 0.0
Others -0.3 -1.1 -0.7 -1.3 -0.3
CF from financing activities -31.5 -33.4 -22.6 -25.3 -23.4
Total payout to shareholders
(dividend & share repurchase)-10.4 -12.2 -20.3 -22.4 -21.4
Borrowings -20.9 -20.3 -2.1 -2.0 -2.0
Others (1) -0.2 -0.9 -0.2 -0.9 0.0
Effect of exchange rate change on cash & cash equivalents 0.1 -0.4 -0.1 0.0 0.0
Change in cash & cash equivalents -8.2 -4.3 -1.5 1.9 0.9
Cash & cash equivalents at the end of period 29.5 31.9 36.2 38.1 37.1
(1) 1H FY2019 Actual, FY2019 Outlook as of Nov. 2019: Share repurchase related to Introduction of a performance-linked stock
compensation plan -0.8, Others -0.1
12
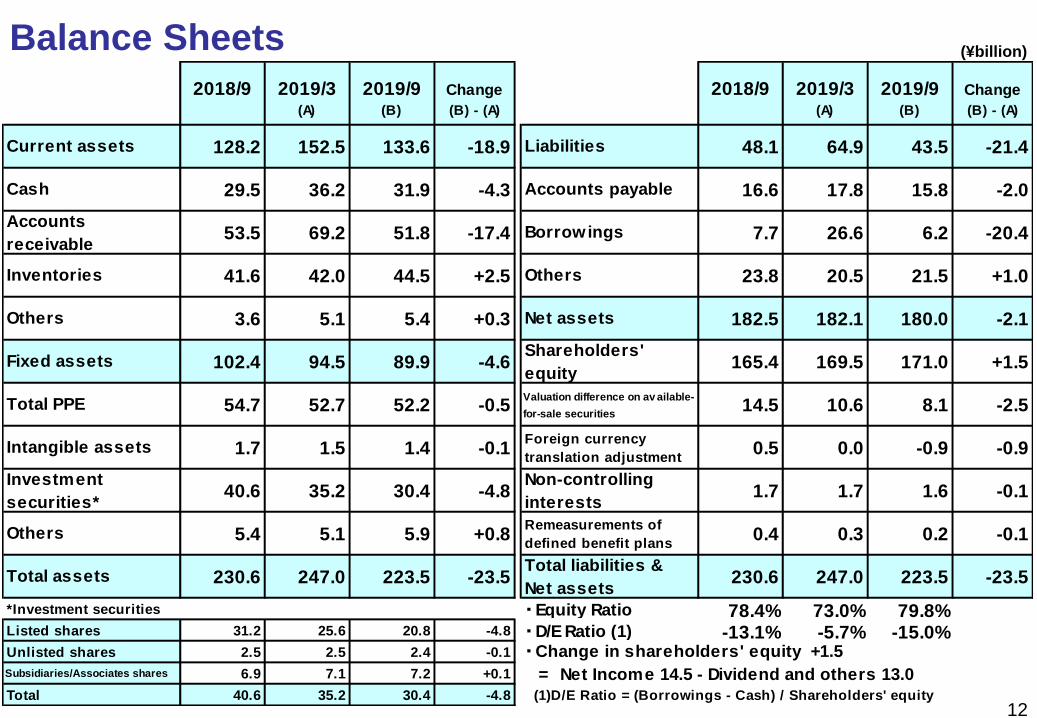
2018/9 2019/3 2019/9 Change 2018/9 2019/3 2019/9 Change
(A) (B) (B) - (A) (A) (B) (B) - (A)
Current assets 128.2 152.5 133.6 -18.9 Liabilities 48.1 64.9 43.5 -21.4
Cash 29.5 36.2 31.9 -4.3 Accounts payable 16.6 17.8 15.8 -2.0
Accounts
receivable53.5 69.2 51.8 -17.4 Borrowings 7.7 26.6 6.2 -20.4
Inventories 41.6 42.0 44.5 +2.5 Others 23.8 20.5 21.5 +1.0
Others 3.6 5.1 5.4 +0.3 Net assets 182.5 182.1 180.0 -2.1
Fixed assets 102.4 94.5 89.9 -4.6Shareholders'
equity165.4 169.5 171.0 +1.5
Total PPE 54.7 52.7 52.2 -0.5Valuation difference on av ailable-
for-sale securities14.5 10.6 8.1 -2.5
Intangible assets 1.7 1.5 1.4 -0.1Foreign currency
translation adjustment0.5 0.0 -0.9 -0.9
Investment
securities*40.6 35.2 30.4 -4.8
Non-controlling
interests1.7 1.7 1.6 -0.1
Others 5.4 5.1 5.9 +0.8Remeasurements of
defined benefit plans0.4 0.3 0.2 -0.1
Total assets 230.6 247.0 223.5 -23.5Total liabilities &
Net assets230.6 247.0 223.5 -23.5
*Investment securities ・Equity Ratio 78.4% 73.0% 79.8%Listed shares 31.2 25.6 20.8 -4.8 ・D/E Ratio (1) -13.1% -5.7% -15.0%Unlisted shares 2.5 2.5 2.4 -0.1
Subsidiaries/Associates shares 6.9 7.1 7.2 +0.1
Total 40.6 35.2 30.4 -4.8 (1)D/E Ratio = (Borrowings - Cash) / Shareholders' equity
・Change in shareholders' equity +1.5
= Net Income 14.5 - Dividend and others 13.0
Balance Sheets (¥billion)
13
(¥billion)
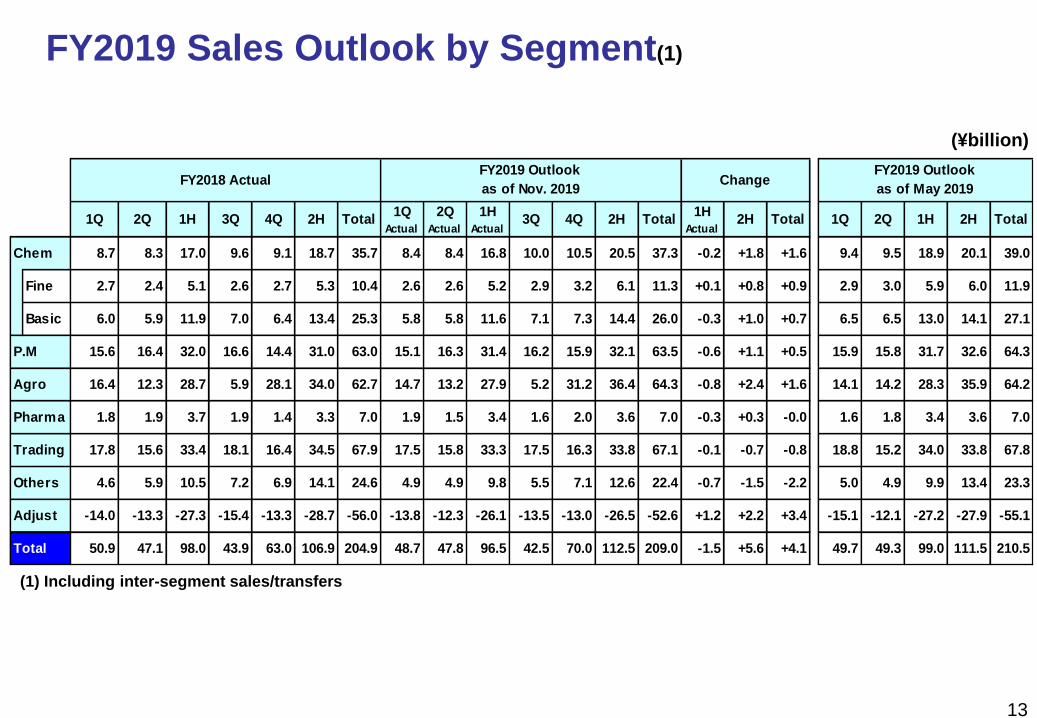
FY2019 Sales Outlook by Segment(1)
(1) Including inter-segment sales/transfers
1Q 2Q 1H 3Q 4Q 2H Total1Q
Actual
2Q
Actual
1H
Actual3Q 4Q 2H Total
1H
Actual2H Total 1Q 2Q 1H 2H Total
Chem 8.7 8.3 17.0 9.6 9.1 18.7 35.7 8.4 8.4 16.8 10.0 10.5 20.5 37.3 -0.2 +1.8 +1.6 9.4 9.5 18.9 20.1 39.0
Fine 2.7 2.4 5.1 2.6 2.7 5.3 10.4 2.6 2.6 5.2 2.9 3.2 6.1 11.3 +0.1 +0.8 +0.9 2.9 3.0 5.9 6.0 11.9
Basic 6.0 5.9 11.9 7.0 6.4 13.4 25.3 5.8 5.8 11.6 7.1 7.3 14.4 26.0 -0.3 +1.0 +0.7 6.5 6.5 13.0 14.1 27.1
15.6 16.4 32.0 16.6 14.4 31.0 63.0 15.1 16.3 31.4 16.2 15.9 32.1 63.5 -0.6 +1.1 +0.5 15.9 15.8 31.7 32.6 64.3
Agro 16.4 12.3 28.7 5.9 28.1 34.0 62.7 14.7 13.2 27.9 5.2 31.2 36.4 64.3 -0.8 +2.4 +1.6 14.1 14.2 28.3 35.9 64.2
Pharma 1.8 1.9 3.7 1.9 1.4 3.3 7.0 1.9 1.5 3.4 1.6 2.0 3.6 7.0 -0.3 +0.3 -0.0 1.6 1.8 3.4 3.6 7.0
Trading 17.8 15.6 33.4 18.1 16.4 34.5 67.9 17.5 15.8 33.3 17.5 16.3 33.8 67.1 -0.1 -0.7 -0.8 18.8 15.2 34.0 33.8 67.8
Others 4.6 5.9 10.5 7.2 6.9 14.1 24.6 4.9 4.9 9.8 5.5 7.1 12.6 22.4 -0.7 -1.5 -2.2 5.0 4.9 9.9 13.4 23.3
-14.0 -13.3 -27.3 -15.4 -13.3 -28.7 -56.0 -13.8 -12.3 -26.1 -13.5 -13.0 -26.5 -52.6 +1.2 +2.2 +3.4 -15.1 -12.1 -27.2 -27.9 -55.1
Total 50.9 47.1 98.0 43.9 63.0 106.9 204.9 48.7 47.8 96.5 42.5 70.0 112.5 209.0 -1.5 +5.6 +4.1 49.7 49.3 99.0 111.5 210.5
FY2019 Outlook
as of May 2019FY2018 Actual
FY2019 Outlook
as of Nov. 2019Change
P.M
Adjust
14
(¥billion)
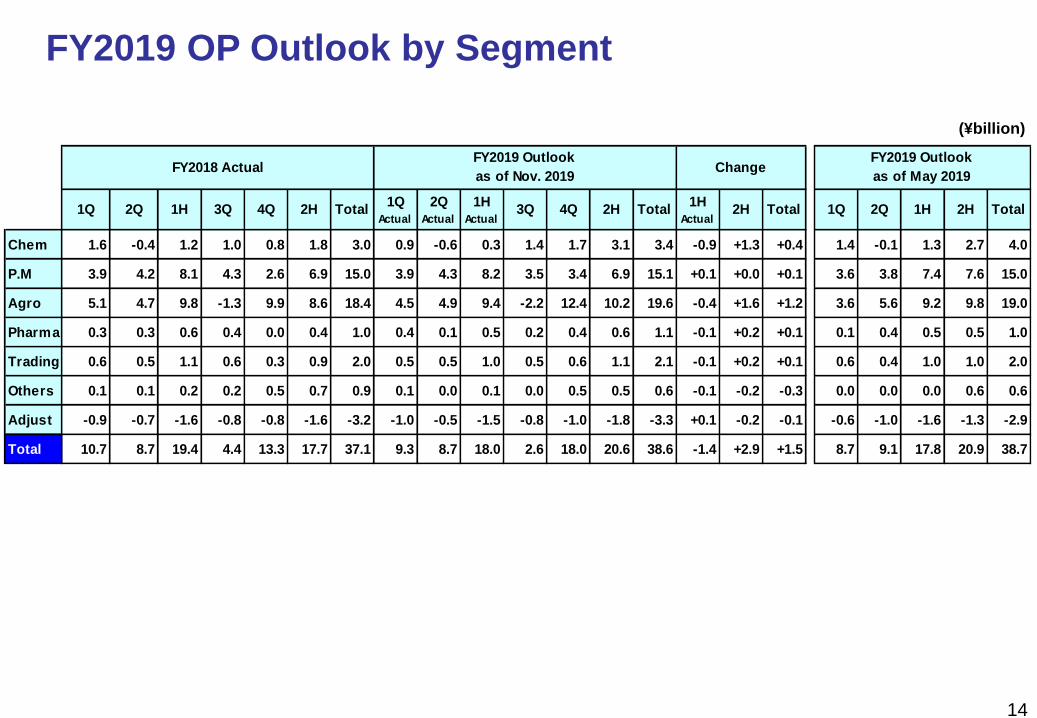
FY2019 OP Outlook by Segment
1Q 2Q 1H 3Q 4Q 2H Total1Q
Actual
2Q
Actual
1H
Actual3Q 4Q 2H Total
1H
Actual2H Total 1Q 2Q 1H 2H Total
Chem 1.6 -0.4 1.2 1.0 0.8 1.8 3.0 0.9 -0.6 0.3 1.4 1.7 3.1 3.4 -0.9 +1.3 +0.4 1.4 -0.1 1.3 2.7 4.0
P.M 3.9 4.2 8.1 4.3 2.6 6.9 15.0 3.9 4.3 8.2 3.5 3.4 6.9 15.1 +0.1 +0.0 +0.1 3.6 3.8 7.4 7.6 15.0
Agro 5.1 4.7 9.8 -1.3 9.9 8.6 18.4 4.5 4.9 9.4 -2.2 12.4 10.2 19.6 -0.4 +1.6 +1.2 3.6 5.6 9.2 9.8 19.0
Pharma 0.3 0.3 0.6 0.4 0.0 0.4 1.0 0.4 0.1 0.5 0.2 0.4 0.6 1.1 -0.1 +0.2 +0.1 0.1 0.4 0.5 0.5 1.0
Trading 0.6 0.5 1.1 0.6 0.3 0.9 2.0 0.5 0.5 1.0 0.5 0.6 1.1 2.1 -0.1 +0.2 +0.1 0.6 0.4 1.0 1.0 2.0
Others 0.1 0.1 0.2 0.2 0.5 0.7 0.9 0.1 0.0 0.1 0.0 0.5 0.5 0.6 -0.1 -0.2 -0.3 0.0 0.0 0.0 0.6 0.6
Adjust -0.9 -0.7 -1.6 -0.8 -0.8 -1.6 -3.2 -1.0 -0.5 -1.5 -0.8 -1.0 -1.8 -3.3 +0.1 -0.2 -0.1 -0.6 -1.0 -1.6 -1.3 -2.9
Total 10.7 8.7 19.4 4.4 13.3 17.7 37.1 9.3 8.7 18.0 2.6 18.0 20.6 38.6 -1.4 +2.9 +1.5 8.7 9.1 17.8 20.9 38.7
FY2019 Outlook
as of May 2019FY2018 Actual
FY2019 Outlook
as of Nov. 2019Change
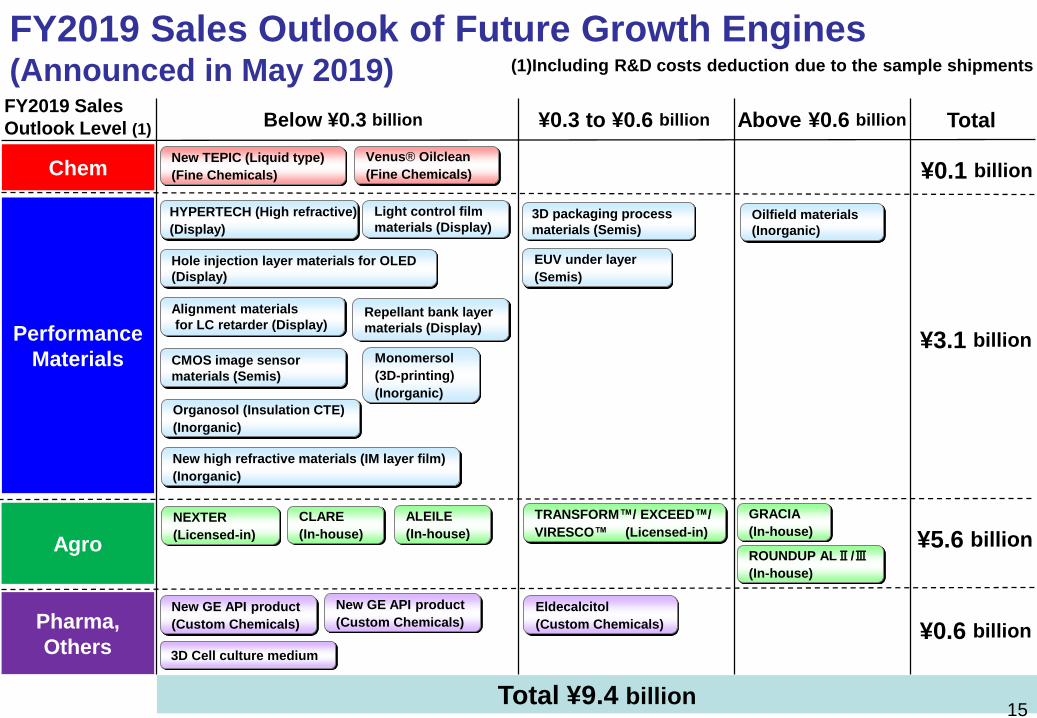
Total ¥9.4 billion
¥0.1 billion
Below ¥0.3 billion ¥0.3 to ¥0.6 billionFY2019 Sales
Outlook Level (1) Total
Performance
Materials
Pharma,
Others
Agro
Chem
Hole injection layer materials for OLED
(Display)
New high refractive materials (IM layer film)
(Inorganic)
Eldecalcitol
(Custom Chemicals)
Oilfield materials
(Inorganic)
New TEPIC (Liquid type)
(Fine Chemicals)
Light control film
materials (Display)
NEXTER
(Licensed-in)
GRACIA
(In-house)
New GE API product
(Custom Chemicals)
Repellant bank layer
materials (Display)
Alignment materials
for LC retarder (Display)
Organosol (Insulation CTE)
(Inorganic)
EUV under layer
(Semis)
CMOS image sensor
materials (Semis)
3D Cell culture medium
15
¥3.1 billion
¥5.6 billion
¥0.6 billion
(1)Including R&D costs deduction due to the sample shipments
HYPERTECH (High refractive)
(Display)3D packaging process
materials (Semis)
Monomersol
(3D-printing)
(Inorganic)
CLARE
(In-house)
ROUNDUP ALⅡ/Ⅲ
(In-house)
FY2019 Sales Outlook of Future Growth Engines(Announced in May 2019)
Venus® Oilclean
(Fine Chemicals)
ALEILE
(In-house)
New GE API product
(Custom Chemicals)
Above ¥0.6 billion
TRANSFORM™/ EXCEED™/
VIRESCO™ (Licensed-in)
16
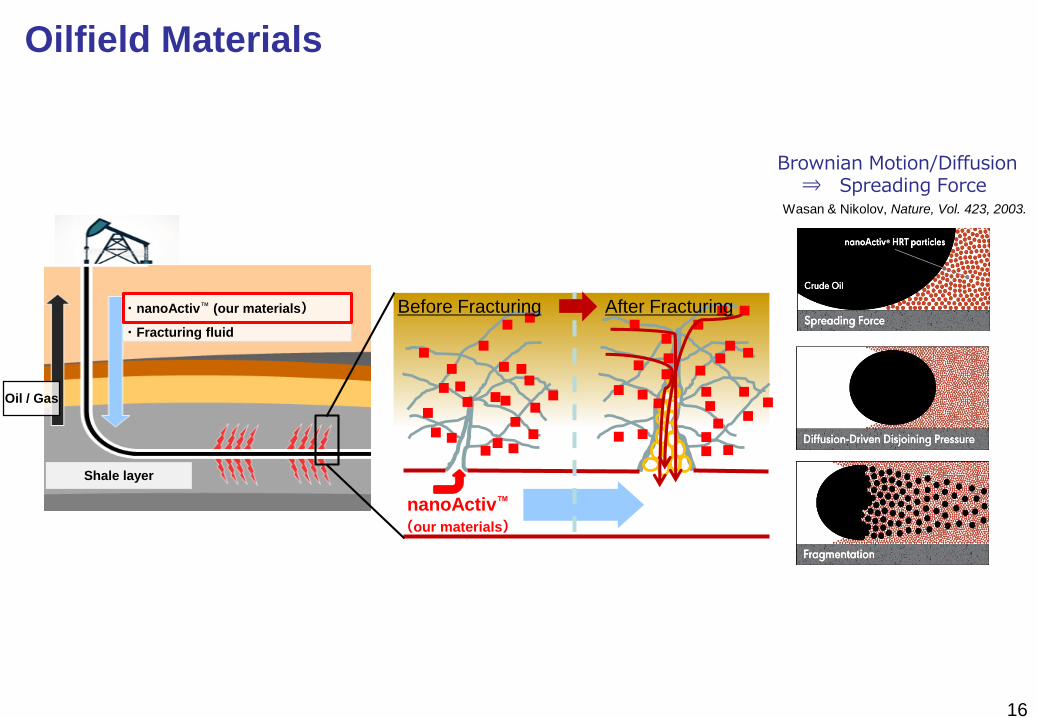
Shale layer
・nanoActiv™ (our materials)
・Fracturing fluid
Oil / Gas
nanoActiv™
(our materials)
・・・・・・・・・・・・
・・ ・・・・・・・
・・ ・
・・・・・・ ・・・ ・・
・・・・・・・・・・・・
・・
Before Fracturing After Fracturing
Oilfield Materials
Brownian Motion/Diffusion⇒ Spreading Force
Wasan & Nikolov, Nature, Vol. 423, 2003.
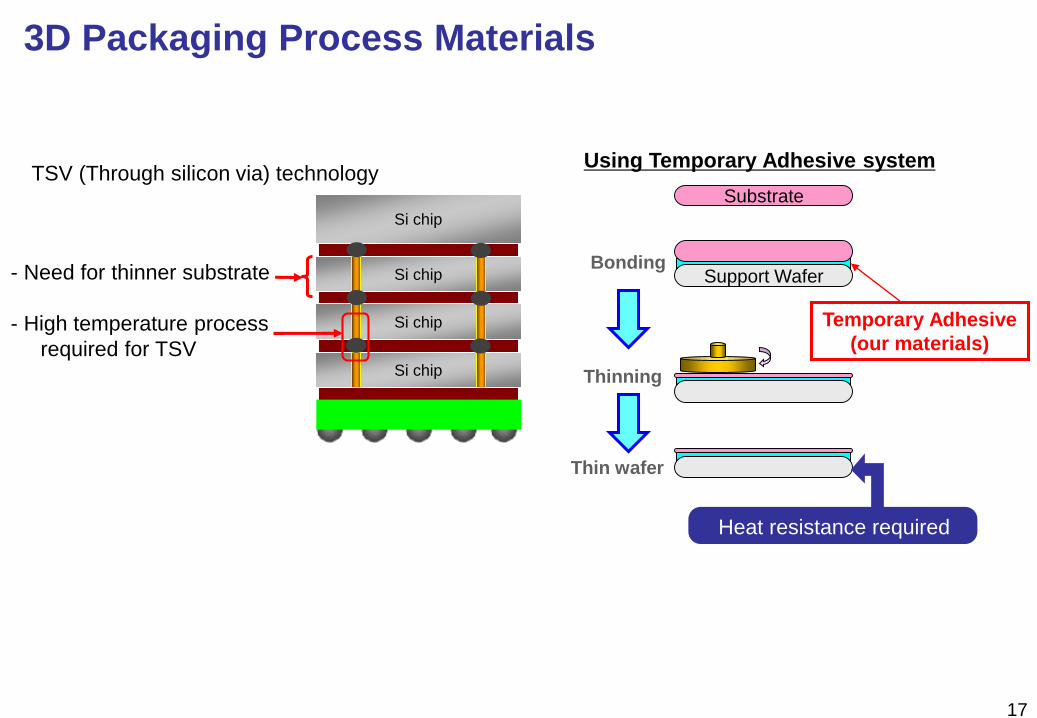
- Need for thinner substrate
- High temperature process
required for TSV
TSV (Through silicon via) technology
17
3D Packaging Process Materials
Substrate
BondingSupport Wafer
Thinning
Thin wafer
高温プロセス対応可
Using Temporary Adhesive system
Temporary Adhesive
(our materials)
Heat resistance required
Si chip
Si chip
Si chip
Si chip
18
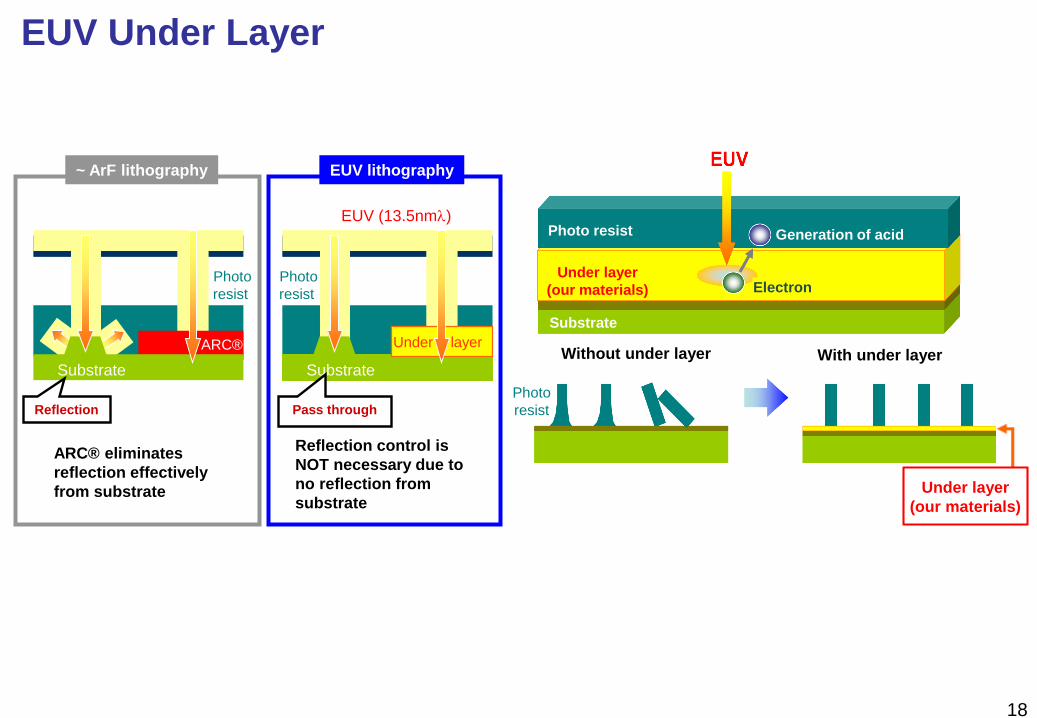
EUV Under Layer
~ ArF lithography EUV lithography
EUV (13.5nml)
Substrate
ARC®
Reflection
Substrate
Photo
resist
Photo
resist
Pass through
Under layer
Under layer
(our materials)
Photo resist Generation of acid
Electron
Substrate
Without under layer With under layer
Under layer
(our materials)
Photo
resist
ARC® eliminates
reflection effectively
from substrate
Reflection control is
NOT necessary due to
no reflection from
substrate
19
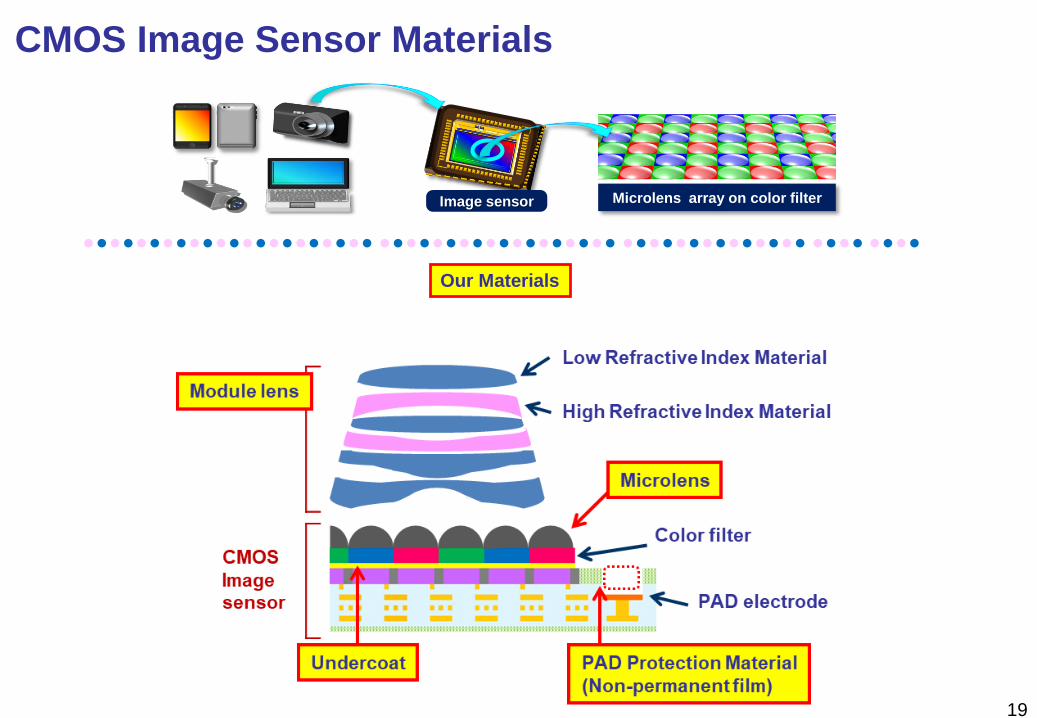
CMOS Image Sensor Materials
●●●●●●●●●●●●●●●●●●●●●● ●●●●●●●●●●●●●●●●●● ●●●●●●●●●●●●●● ●●●●●●●●
Microlens array on color filter Image sensor
Our Materials
20
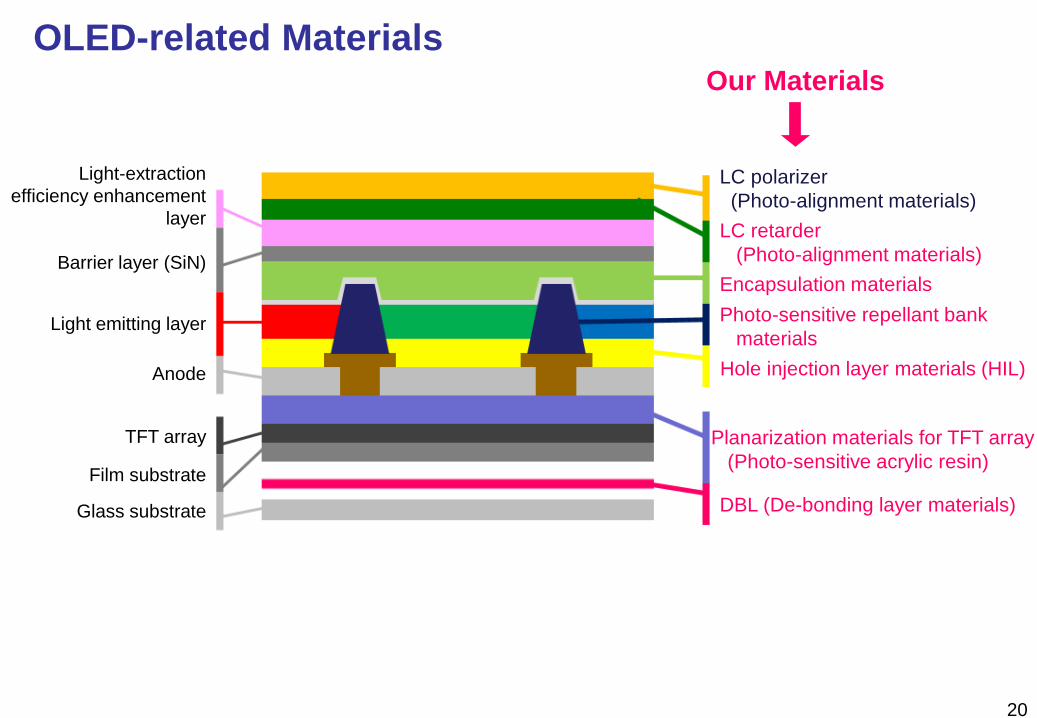
OLED-related Materials
Light-extraction
efficiency enhancement
layer
Barrier layer (SiN)
Light emitting layer
Anode
TFT array
Film substrate
Glass substrate
Our Materials
LC polarizer
(Photo-alignment materials)
LC retarder
(Photo-alignment materials)
Encapsulation materials
DBL (De-bonding layer materials)
Hole injection layer materials (HIL)
Photo-sensitive repellant bank
materials
Planarization materials for TFT array
(Photo-sensitive acrylic resin)
21
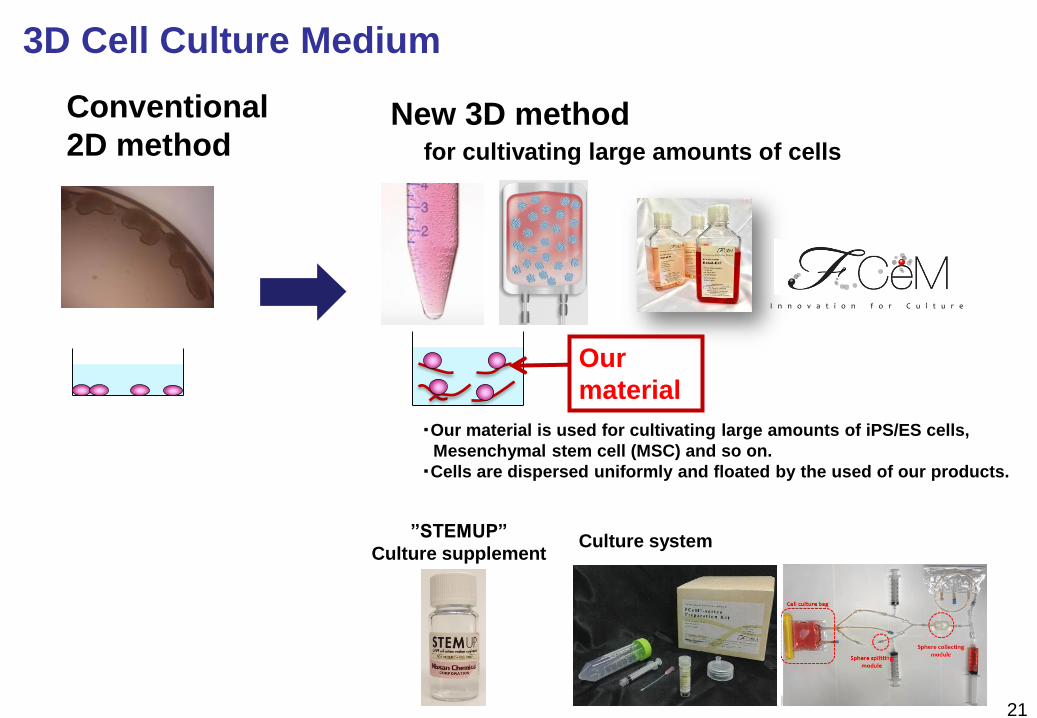
Our
material
Conventional
2D methodNew 3D method
I n n o v a t i o n f o r C u l t u r e
for cultivating large amounts of cells
・Our material is used for cultivating large amounts of iPS/ES cells,
Mesenchymal stem cell (MSC) and so on.
・Cells are dispersed uniformly and floated by the used of our products.
”STEMUP”
Culture supplementCulture system
3D Cell Culture Medium

22
(Blank)
23
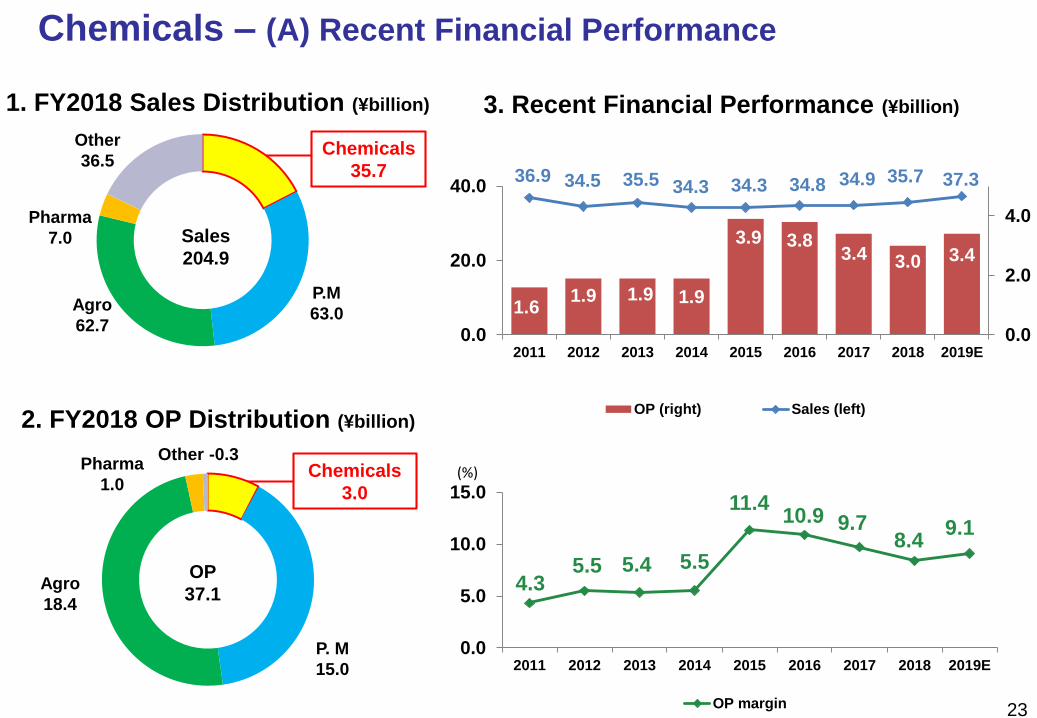
Chemicals – (A) Recent Financial Performance
1.61.9 1.9 1.9
3.9 3.83.4 3.0 3.4
36.9 34.5 35.5 34.3 34.3 34.8 34.9 35.7 37.3
0.0
2.0
4.0
0.0
20.0
40.0
2011 2012 2013 2014 2015 2016 2017 2018 2019E
OP (right) Sales (left)
4.35.5 5.4 5.5
11.410.9 9.7
8.49.1
0.0
5.0
10.0
15.0
2011 2012 2013 2014 2015 2016 2017 2018 2019E
OP margin
(%)
1. FY2018 Sales Distribution (¥billion) 3. Recent Financial Performance (¥billion)
2. FY2018 OP Distribution (¥billion)
Other -0.3
Sales
204.9
Pharma
1.0
OP
37.1
Chemicals
3.0
Agro
62.7
Agro
18.4
P.M
63.0
P. M
15.0
Chemicals
35.7
Pharma
7.0
Other
36.5
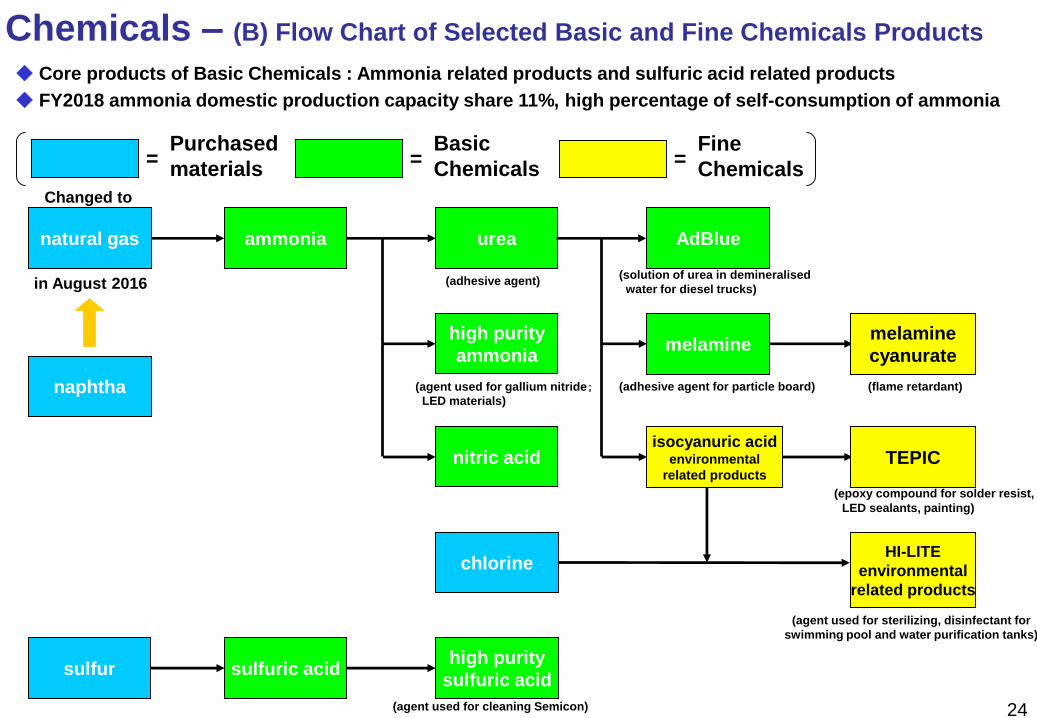
sulfur
urea
melaminemelamine
cyanurate
isocyanuric acidenvironmental
related products
nitric acid TEPIC
high purity
sulfuric acid
AdBlueammonia
high purity
ammonia
chlorine
sulfuric acid
(agent used for cleaning Semicon)
(agent used for sterilizing, disinfectant for
swimming pool and water purification tanks)
(epoxy compound for solder resist,
LED sealants, painting)
(flame retardant)(agent used for gallium nitride;LED materials)
(solution of urea in demineralised
water for diesel trucks)
(adhesive agent for particle board)
(adhesive agent)
◆ Core products of Basic Chemicals : Ammonia related products and sulfuric acid related products
◆ FY2018 ammonia domestic production capacity share 11%, high percentage of self-consumption of ammonia
Purchased
materials
Chemicals – (B) Flow Chart of Selected Basic and Fine Chemicals Products
HI-LITE
environmental
related products
= =Basic
Chemicals =
Fine
Chemicals
24
Changed to
in August 2016
natural gas
naphtha
25
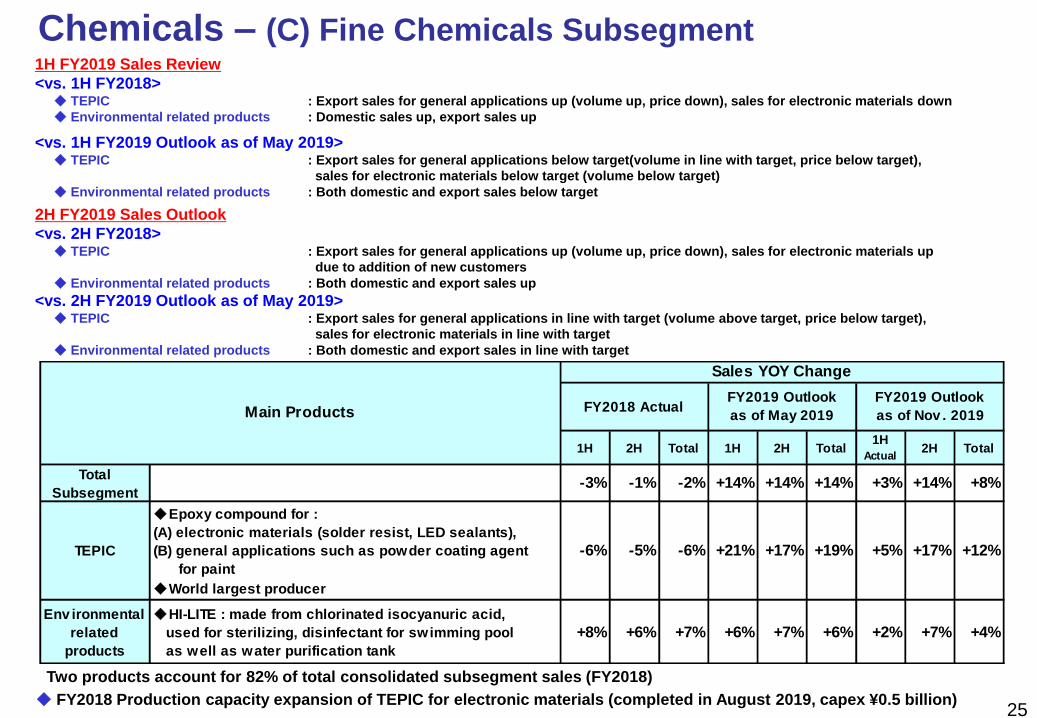
1H 2H Total 1H 2H Total1H
Actual2H Total
Total
Subsegment-3% -1% -2% +14% +14% +14% +3% +14% +8%
TEPIC
◆Epoxy compound for :
(A) electronic materials (solder resist, LED sealants),
(B) general applications such as powder coating agent
for paint
◆World largest producer
-6% -5% -6% +21% +17% +19% +5% +17% +12%
Env ironmental
related
products
◆HI-LITE : made from chlorinated isocyanuric acid,
used for sterilizing, disinfectant for swimming pool
as well as water purification tank
+8% +6% +7% +6% +7% +6% +2% +7% +4%
FY2019 Outlook
as of Nov . 2019FY2018 ActualMain Products
FY2019 Outlook
as of May 2019
Sales YOY Change
Chemicals – (C) Fine Chemicals Subsegment
Two products account for 82% of total consolidated subsegment sales (FY2018)
1H FY2019 Sales Review
<vs. 1H FY2018> ◆ TEPIC : Export sales for general applications up (volume up, price down), sales for electronic materials down
◆ Environmental related products : Domestic sales up, export sales up
<vs. 1H FY2019 Outlook as of May 2019>◆ TEPIC : Export sales for general applications below target(volume in line with target, price below target),
sales for electronic materials below target (volume below target)
◆ Environmental related products : Both domestic and export sales below target
2H FY2019 Sales Outlook
<vs. 2H FY2018> ◆ TEPIC : Export sales for general applications up (volume up, price down), sales for electronic materials up
due to addition of new customers
◆ Environmental related products : Both domestic and export sales up
<vs. 2H FY2019 Outlook as of May 2019>◆ TEPIC : Export sales for general applications in line with target (volume above target, price below target),
sales for electronic materials in line with target
◆ Environmental related products : Both domestic and export sales in line with target
◆ FY2018 Production capacity expansion of TEPIC for electronic materials (completed in August 2019, capex ¥0.5 billion)
26
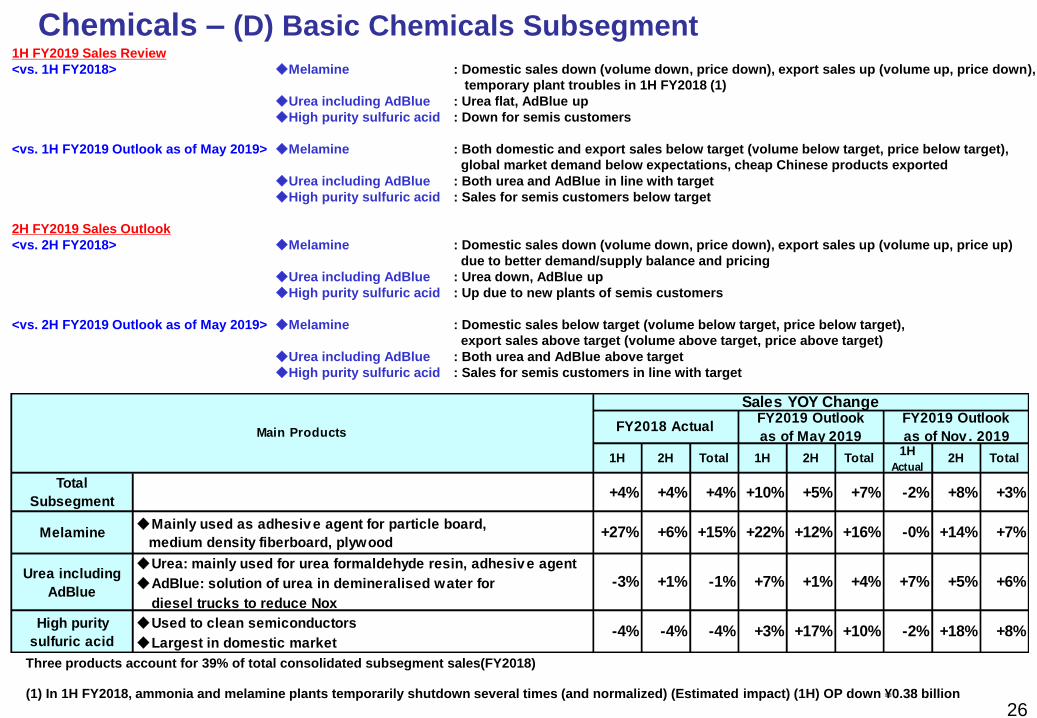
Chemicals – (D) Basic Chemicals Subsegment
Three products account for 39% of total consolidated subsegment sales(FY2018)
1H FY2019 Sales Review
<vs. 1H FY2018> ◆Melamine : Domestic sales down (volume down, price down), export sales up (volume up, price down),
temporary plant troubles in 1H FY2018 (1)
◆Urea including AdBlue : Urea flat, AdBlue up
◆High purity sulfuric acid : Down for semis customers
<vs. 1H FY2019 Outlook as of May 2019> ◆Melamine : Both domestic and export sales below target (volume below target, price below target),
global market demand below expectations, cheap Chinese products exported
◆Urea including AdBlue : Both urea and AdBlue in line with target
◆High purity sulfuric acid : Sales for semis customers below target
2H FY2019 Sales Outlook
<vs. 2H FY2018> ◆Melamine : Domestic sales down (volume down, price down), export sales up (volume up, price up)
due to better demand/supply balance and pricing
◆Urea including AdBlue : Urea down, AdBlue up
◆High purity sulfuric acid : Up due to new plants of semis customers
<vs. 2H FY2019 Outlook as of May 2019> ◆Melamine : Domestic sales below target (volume below target, price below target),
export sales above target (volume above target, price above target)
◆Urea including AdBlue : Both urea and AdBlue above target
◆High purity sulfuric acid : Sales for semis customers in line with target
1H 2H Total 1H 2H Total1H
Actual2H Total
Total
Subsegment+4% +4% +4% +10% +5% +7% -2% +8% +3%
Melamine◆Mainly used as adhesive agent for particle board,
medium density fiberboard, plywood+27% +6% +15% +22% +12% +16% -0% +14% +7%
Urea including
AdBlue
◆Urea: mainly used for urea formaldehyde resin, adhesive agent
◆AdBlue: solution of urea in demineralised water for
diesel trucks to reduce Nox
-3% +1% -1% +7% +1% +4% +7% +5% +6%
High purity
sulfuric acid
◆Used to clean semiconductors
◆Largest in domestic market-4% -4% -4% +3% +17% +10% -2% +18% +8%
FY2018 Actual
Sales YOY ChangeFY2019 Outlook
as of Nov . 2019Main ProductsFY2019 Outlook
as of May 2019
(1) In 1H FY2018, ammonia and melamine plants temporarily shutdown several times (and normalized) (Estimated impact) (1H) OP down ¥0.38 billion
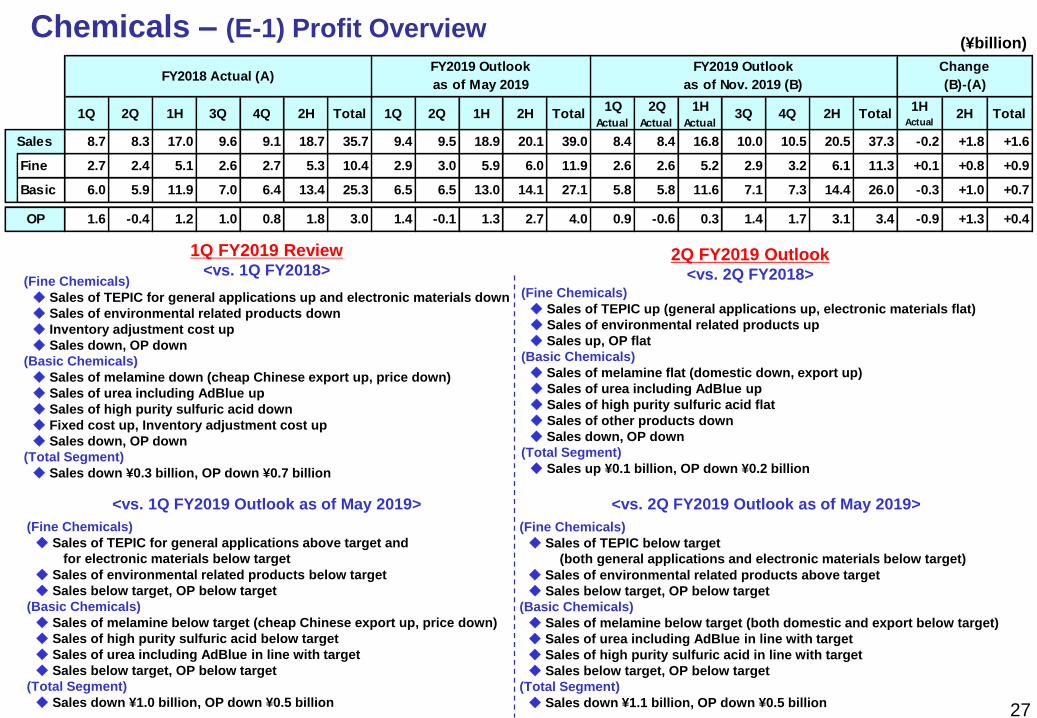
(Fine Chemicals)
◆ Sales of TEPIC for general applications up and electronic materials down
◆ Sales of environmental related products down
◆ Inventory adjustment cost up
◆ Sales down, OP down
(Basic Chemicals)
◆ Sales of melamine down (cheap Chinese export up, price down)
◆ Sales of urea including AdBlue up
◆ Sales of high purity sulfuric acid down
◆ Fixed cost up, Inventory adjustment cost up
◆ Sales down, OP down
(Total Segment)
◆ Sales down ¥0.3 billion, OP down ¥0.7 billion
27
1Q 2Q 1H 3Q 4Q 2H Total 1Q 2Q 1H 2H Total1Q
Actual
2Q
Actual
1H
Actual3Q 4Q 2H Total
1HActual
2H Total
8.7 8.3 17.0 9.6 9.1 18.7 35.7 9.4 9.5 18.9 20.1 39.0 8.4 8.4 16.8 10.0 10.5 20.5 37.3 -0.2 +1.8 +1.6
Fine 2.7 2.4 5.1 2.6 2.7 5.3 10.4 2.9 3.0 5.9 6.0 11.9 2.6 2.6 5.2 2.9 3.2 6.1 11.3 +0.1 +0.8 +0.9
Basic 6.0 5.9 11.9 7.0 6.4 13.4 25.3 6.5 6.5 13.0 14.1 27.1 5.8 5.8 11.6 7.1 7.3 14.4 26.0 -0.3 +1.0 +0.7
1.6 -0.4 1.2 1.0 0.8 1.8 3.0 1.4 -0.1 1.3 2.7 4.0 0.9 -0.6 0.3 1.4 1.7 3.1 3.4 -0.9 +1.3 +0.4
Sales
OP
Change
(B)-(A)
FY2019 Outlook
as of May 2019FY2018 Actual (A)
FY2019 Outlook
as of Nov. 2019 (B)
(¥billion)Chemicals – (E-1) Profit Overview
1Q FY2019 Review<vs. 1Q FY2018>
<vs. 1Q FY2019 Outlook as of May 2019>
2Q FY2019 Outlook<vs. 2Q FY2018>
<vs. 2Q FY2019 Outlook as of May 2019>
(Fine Chemicals)
◆ Sales of TEPIC up (general applications up, electronic materials flat)
◆ Sales of environmental related products up
◆ Sales up, OP flat
(Basic Chemicals)
◆ Sales of melamine flat (domestic down, export up)
◆ Sales of urea including AdBlue up
◆ Sales of high purity sulfuric acid flat
◆ Sales of other products down
◆ Sales down, OP down
(Total Segment)
◆ Sales up ¥0.1 billion, OP down ¥0.2 billion
(Fine Chemicals)
◆ Sales of TEPIC below target
(both general applications and electronic materials below target)
◆ Sales of environmental related products above target
◆ Sales below target, OP below target
(Basic Chemicals)
◆ Sales of melamine below target (both domestic and export below target)
◆ Sales of urea including AdBlue in line with target
◆ Sales of high purity sulfuric acid in line with target
◆ Sales below target, OP below target
(Total Segment)
◆ Sales down ¥1.1 billion, OP down ¥0.5 billion
(Fine Chemicals)
◆ Sales of TEPIC for general applications above target and
for electronic materials below target
◆ Sales of environmental related products below target
◆ Sales below target, OP below target
(Basic Chemicals)
◆ Sales of melamine below target (cheap Chinese export up, price down)
◆ Sales of high purity sulfuric acid below target
◆ Sales of urea including AdBlue in line with target
◆ Sales below target, OP below target
(Total Segment)
◆ Sales down ¥1.0 billion, OP down ¥0.5 billion
28
Chemicals – (E-2) Profit Overview
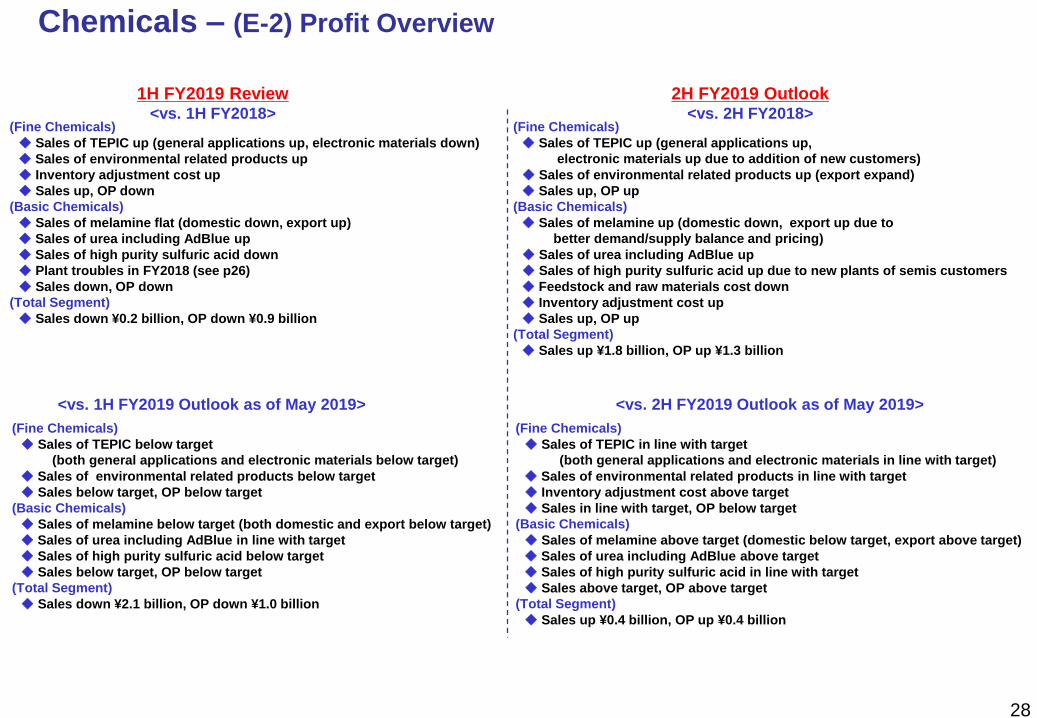
1H FY2019 Review<vs. 1H FY2018>
<vs. 1H FY2019 Outlook as of May 2019>
2H FY2019 Outlook<vs. 2H FY2018>
<vs. 2H FY2019 Outlook as of May 2019>
(Fine Chemicals)
◆ Sales of TEPIC up (general applications up,
electronic materials up due to addition of new customers)
◆ Sales of environmental related products up (export expand)
◆ Sales up, OP up
(Basic Chemicals)
◆ Sales of melamine up (domestic down, export up due to
better demand/supply balance and pricing)
◆ Sales of urea including AdBlue up
◆ Sales of high purity sulfuric acid up due to new plants of semis customers
◆ Feedstock and raw materials cost down
◆ Inventory adjustment cost up
◆ Sales up, OP up
(Total Segment)
◆ Sales up ¥1.8 billion, OP up ¥1.3 billion
(Fine Chemicals)
◆ Sales of TEPIC in line with target
(both general applications and electronic materials in line with target)
◆ Sales of environmental related products in line with target
◆ Inventory adjustment cost above target
◆ Sales in line with target, OP below target
(Basic Chemicals)
◆ Sales of melamine above target (domestic below target, export above target)
◆ Sales of urea including AdBlue above target
◆ Sales of high purity sulfuric acid in line with target
◆ Sales above target, OP above target
(Total Segment)
◆ Sales up ¥0.4 billion, OP up ¥0.4 billion
(Fine Chemicals)
◆ Sales of TEPIC up (general applications up, electronic materials down)
◆ Sales of environmental related products up
◆ Inventory adjustment cost up
◆ Sales up, OP down
(Basic Chemicals)
◆ Sales of melamine flat (domestic down, export up)
◆ Sales of urea including AdBlue up
◆ Sales of high purity sulfuric acid down
◆ Plant troubles in FY2018 (see p26)
◆ Sales down, OP down
(Total Segment)
◆ Sales down ¥0.2 billion, OP down ¥0.9 billion
(Fine Chemicals)
◆ Sales of TEPIC below target
(both general applications and electronic materials below target)
◆ Sales of environmental related products below target
◆ Sales below target, OP below target
(Basic Chemicals)
◆ Sales of melamine below target (both domestic and export below target)
◆ Sales of urea including AdBlue in line with target
◆ Sales of high purity sulfuric acid below target
◆ Sales below target, OP below target
(Total Segment)
◆ Sales down ¥2.1 billion, OP down ¥1.0 billion
Sales
204.9
29
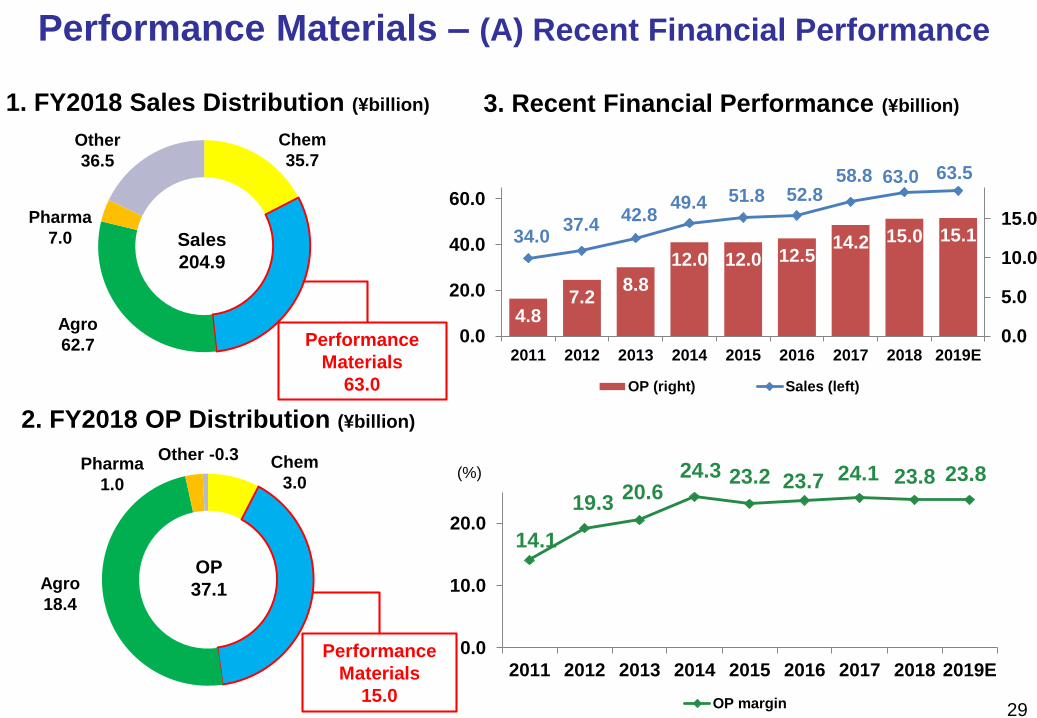
Performance Materials – (A) Recent Financial Performance
4.87.2
8.8
12.0 12.0 12.514.2 15.0 15.134.0
37.442.8
49.4 51.8 52.858.8 63.0 63.5
0.0
5.0
10.0
15.0
0.0
20.0
40.0
60.0
2011 2012 2013 2014 2015 2016 2017 2018 2019E
OP (right) Sales (left)
14.1
19.320.6
24.3 23.2 23.7 24.1 23.8 23.8
0.0
10.0
20.0
2011 2012 2013 2014 2015 2016 2017 2018 2019E
OP margin
(%)
1. FY2018 Sales Distribution (¥billion) 3. Recent Financial Performance (¥billion)
2. FY2018 OP Distribution (¥billion)
Chem
3.0
Chem
35.7
OP
37.1
Performance
Materials
15.0
Performance
Materials
63.0
Other -0.3Pharma
1.0
Agro
18.4
Agro
62.7
Pharma
7.0
Other
36.5
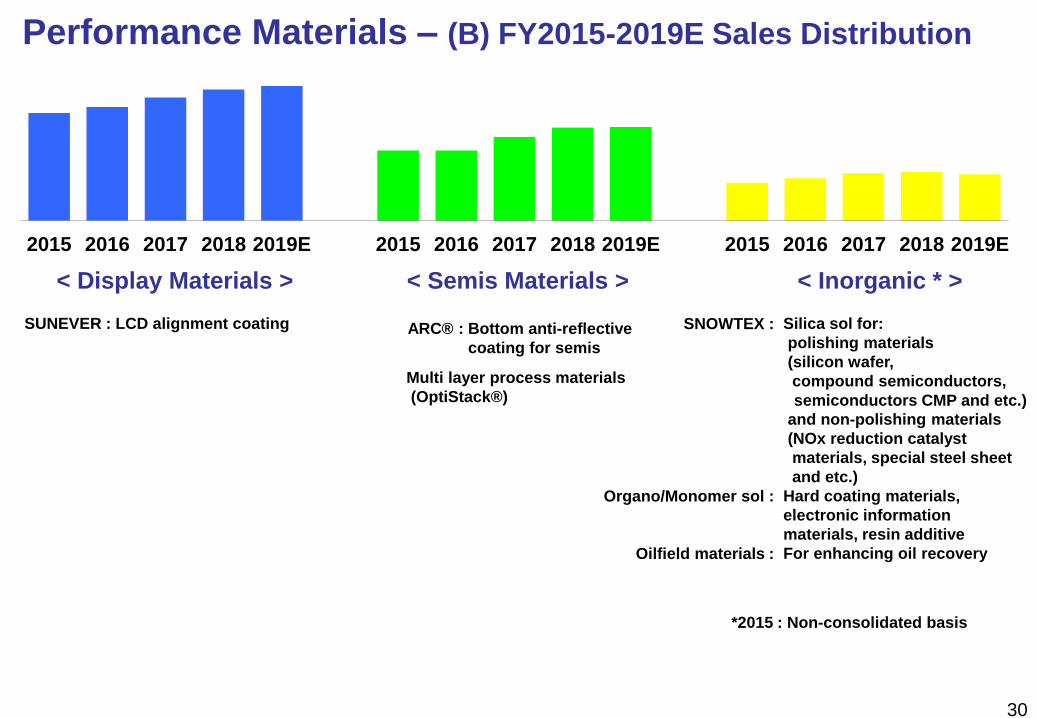
Performance Materials – (B) FY2015-2019E Sales Distribution
< Display Materials > < Semis Materials > < Inorganic * >
Silica sol for:
polishing materials
(silicon wafer,
compound semiconductors,
semiconductors CMP and etc.)
and non-polishing materials
(NOx reduction catalyst
materials, special steel sheet
and etc.)
Hard coating materials,
electronic information
materials, resin additive
For enhancing oil recovery
SNOWTEX :
Organo/Monomer sol :
Oilfield materials :
SUNEVER : LCD alignment coating
30
*2015 : Non-consolidated basis
ARC® : Bottom anti-reflective
coating for semis
Multi layer process materials
(OptiStack®)
2015 2016 2017 2018 2019E 2015 2016 2017 2018 2019E 2015 2016 2017 2018 2019E
31
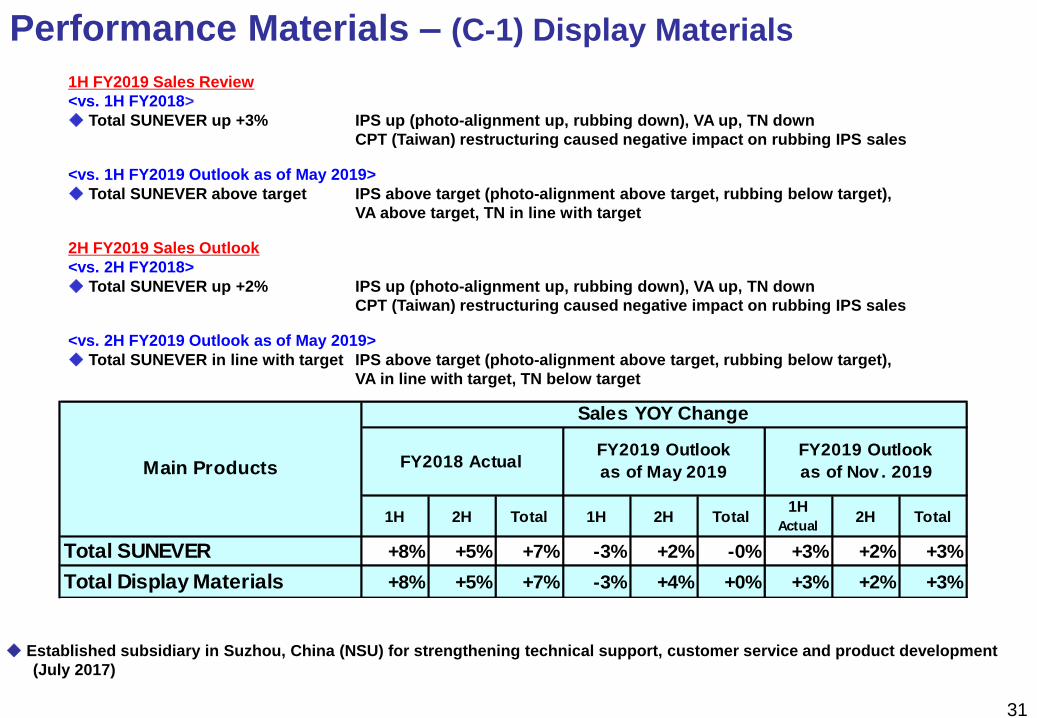
1H 2H Total 1H 2H Total1H
Actual2H Total
+8% +5% +7% -3% +2% -0% +3% +2% +3%
+8% +5% +7% -3% +4% +0% +3% +2% +3%
Total SUNEVER
Main Products
Total Display Materials
FY2019 Outlook
as of May 2019FY2018 Actual
Sales YOY Change
FY2019 Outlook
as of Nov . 2019
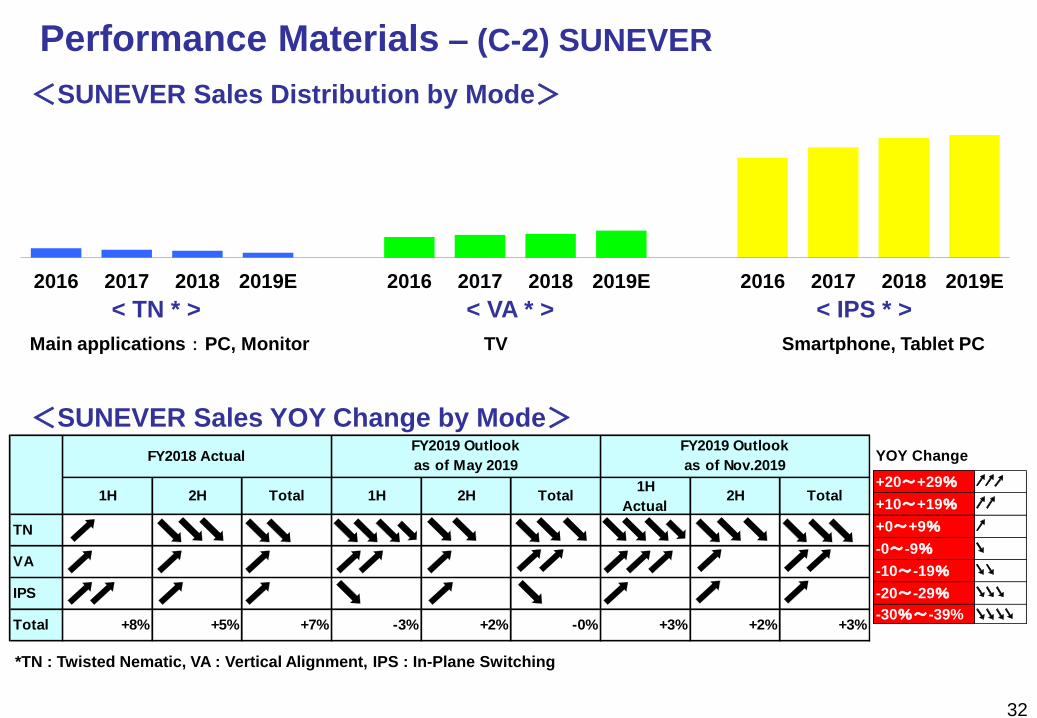
Performance Materials – (C-1) Display Materials
1H FY2019 Sales Review
<vs. 1H FY2018>
◆ Total SUNEVER up +3% IPS up (photo-alignment up, rubbing down), VA up, TN down
CPT (Taiwan) restructuring caused negative impact on rubbing IPS sales
<vs. 1H FY2019 Outlook as of May 2019>
◆ Total SUNEVER above target IPS above target (photo-alignment above target, rubbing below target),
VA above target, TN in line with target
2H FY2019 Sales Outlook
<vs. 2H FY2018>
◆ Total SUNEVER up +2% IPS up (photo-alignment up, rubbing down), VA up, TN down
CPT (Taiwan) restructuring caused negative impact on rubbing IPS sales
<vs. 2H FY2019 Outlook as of May 2019>
◆ Total SUNEVER in line with target IPS above target (photo-alignment above target, rubbing below target),
VA in line with target, TN below target
◆ Established subsidiary in Suzhou, China (NSU) for strengthening technical support, customer service and product development
(July 2017)
2016 2017 2018 2019E 2016 2017 2018 2019E 2016 2017 2018 2019E
32
< TN * > < VA * > < IPS * >
<SUNEVER Sales Distribution by Mode>
<SUNEVER Sales YOY Change by Mode>
YOY Change
+20~+29%
+10~+19%
+0~+9%
-0~-9%
-10~-19%
-20~-29%
-30%~-39%
*TN : Twisted Nematic, VA : Vertical Alignment, IPS : In-Plane Switching
Main applications : PC, Monitor TV Smartphone, Tablet PC
Performance Materials – (C-2) SUNEVER
1H 2H Total 1H 2H Total1H
Actual2H Total
TN
VA
IPS
+8% +5% +7% -3% +2% -0% +3% +2% +3%Total
FY2019 Outlook
as of Nov.2019
FY2019 Outlook
as of May 2019FY2018 Actual
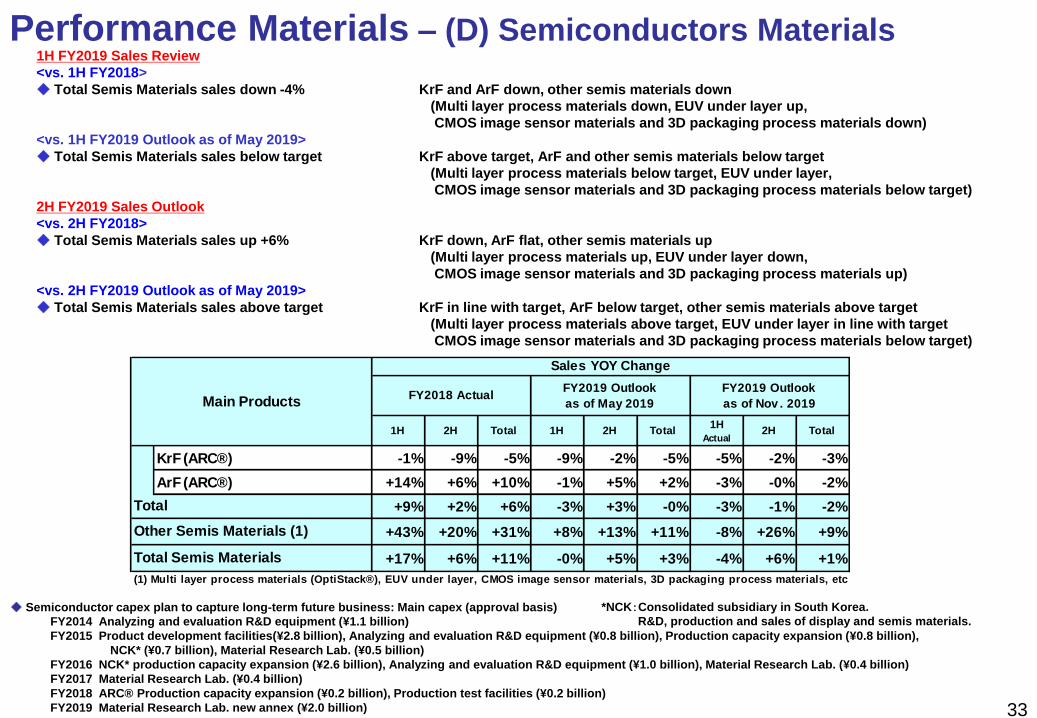
1H 2H Total 1H 2H Total1H
Actual2H Total
KrF (ARC®) -1% -9% -5% -9% -2% -5% -5% -2% -3%
ArF (ARC®) +14% +6% +10% -1% +5% +2% -3% -0% -2%
+9% +2% +6% -3% +3% -0% -3% -1% -2%
+43% +20% +31% +8% +13% +11% -8% +26% +9%
+17% +6% +11% -0% +5% +3% -4% +6% +1%
(1) Multi layer process materials (OptiStack®), EUV under layer, CMOS image sensor materials, 3D packaging process materials, etc
FY2018 ActualFY2019 Outlook
as of May 2019
Total Semis Materials
Other Semis Materials (1)
Main Products
Total
FY2019 Outlook
as of Nov . 2019
Sales YOY Change
33
1H FY2019 Sales Review
<vs. 1H FY2018>
◆ Total Semis Materials sales down -4% KrF and ArF down, other semis materials down
(Multi layer process materials down, EUV under layer up,
CMOS image sensor materials and 3D packaging process materials down)
<vs. 1H FY2019 Outlook as of May 2019>
◆ Total Semis Materials sales below target KrF above target, ArF and other semis materials below target
(Multi layer process materials below target, EUV under layer,
CMOS image sensor materials and 3D packaging process materials below target)
2H FY2019 Sales Outlook
<vs. 2H FY2018>
◆ Total Semis Materials sales up +6% KrF down, ArF flat, other semis materials up
(Multi layer process materials up, EUV under layer down,
CMOS image sensor materials and 3D packaging process materials up)
<vs. 2H FY2019 Outlook as of May 2019>
◆ Total Semis Materials sales above target KrF in line with target, ArF below target, other semis materials above target
(Multi layer process materials above target, EUV under layer in line with target
CMOS image sensor materials and 3D packaging process materials below target)
Performance Materials – (D) Semiconductors Materials
◆ Semiconductor capex plan to capture long-term future business: Main capex (approval basis)
FY2014 Analyzing and evaluation R&D equipment (¥1.1 billion)
FY2015 Product development facilities(¥2.8 billion), Analyzing and evaluation R&D equipment (¥0.8 billion), Production capacity expansion (¥0.8 billion),
NCK* (¥0.7 billion), Material Research Lab. (¥0.5 billion)
FY2016 NCK* production capacity expansion (¥2.6 billion), Analyzing and evaluation R&D equipment (¥1.0 billion), Material Research Lab. (¥0.4 billion)
FY2017 Material Research Lab. (¥0.4 billion)
FY2018 ARC® Production capacity expansion (¥0.2 billion), Production test facilities (¥0.2 billion)
FY2019 Material Research Lab. new annex (¥2.0 billion)
*NCK:Consolidated subsidiary in South Korea.
R&D, production and sales of display and semis materials.
34
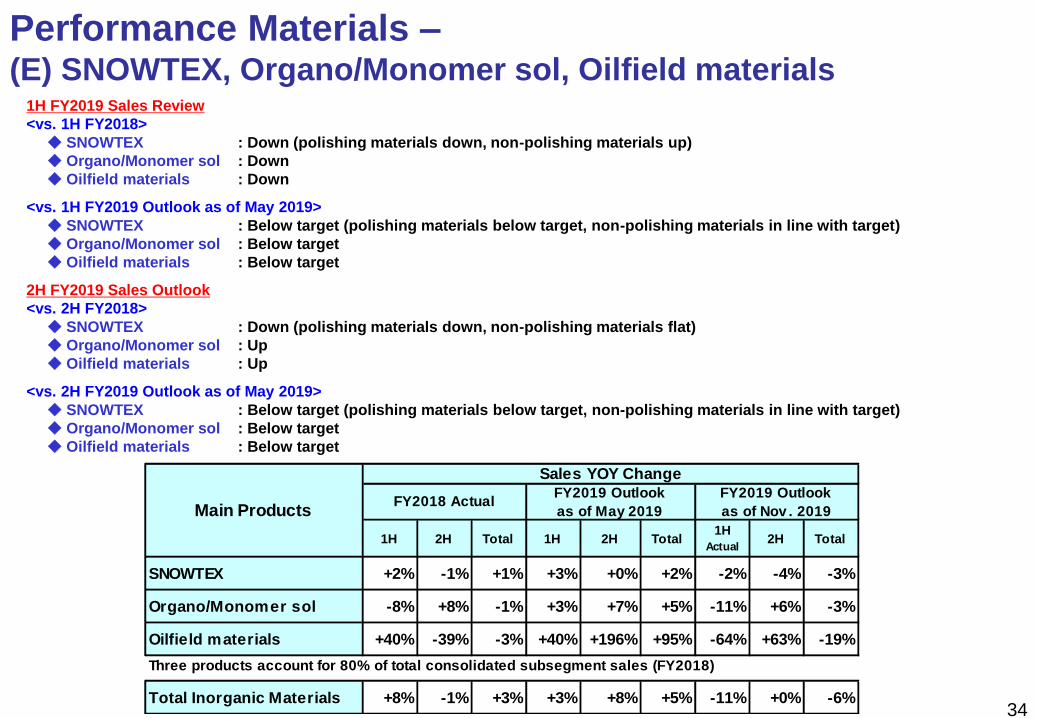
Performance Materials –(E) SNOWTEX, Organo/Monomer sol, Oilfield materials
1H FY2019 Sales Review
<vs. 1H FY2018>
◆ SNOWTEX : Down (polishing materials down, non-polishing materials up)
◆ Organo/Monomer sol : Down
◆ Oilfield materials : Down
<vs. 1H FY2019 Outlook as of May 2019>
◆ SNOWTEX : Below target (polishing materials below target, non-polishing materials in line with target)
◆ Organo/Monomer sol : Below target
◆ Oilfield materials : Below target
2H FY2019 Sales Outlook
<vs. 2H FY2018>
◆ SNOWTEX : Down (polishing materials down, non-polishing materials flat)
◆ Organo/Monomer sol : Up
◆ Oilfield materials : Up
<vs. 2H FY2019 Outlook as of May 2019>
◆ SNOWTEX : Below target (polishing materials below target, non-polishing materials in line with target)
◆ Organo/Monomer sol : Below target
◆ Oilfield materials : Below target
1H 2H Total 1H 2H Total1H
Actual2H Total
SNOWTEX +2% -1% +1% +3% +0% +2% -2% -4% -3%
Organo/Monomer sol -8% +8% -1% +3% +7% +5% -11% +6% -3%
Oilfield materials +40% -39% -3% +40% +196% +95% -64% +63% -19%
Three products account for 80% of total consolidated subsegment sales (FY2018)
Total Inorganic Materials +8% -1% +3% +3% +8% +5% -11% +0% -6%
Sales YOY Change
FY2019 Outlook
as of Nov . 2019FY2018 Actual
FY2019 Outlook
as of May 2019Main Products
35
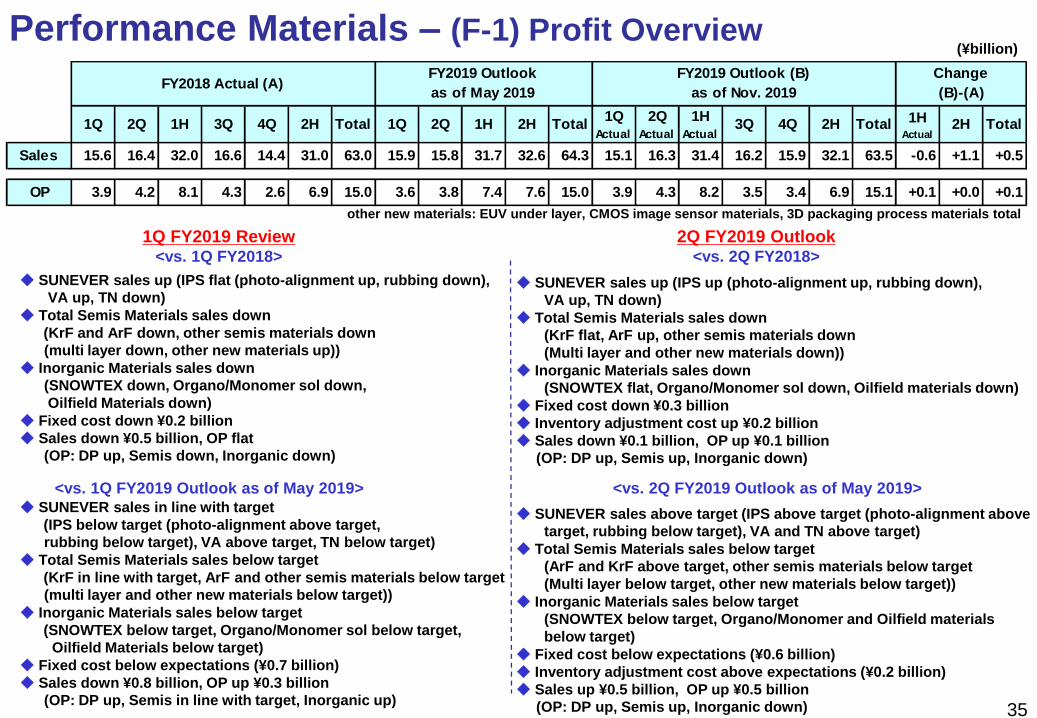
◆ SUNEVER sales up (IPS up (photo-alignment up, rubbing down),
VA up, TN down)
◆ Total Semis Materials sales down
(KrF flat, ArF up, other semis materials down
(Multi layer and other new materials down))
◆ Inorganic Materials sales down
(SNOWTEX flat, Organo/Monomer sol down, Oilfield materials down)
◆ Fixed cost down ¥0.3 billion
◆ Inventory adjustment cost up ¥0.2 billion
◆ Sales down ¥0.1 billion, OP up ¥0.1 billion
(OP: DP up, Semis up, Inorganic down)
◆ SUNEVER sales above target (IPS above target (photo-alignment above
target, rubbing below target), VA and TN above target)
◆ Total Semis Materials sales below target
(ArF and KrF above target, other semis materials below target
(Multi layer below target, other new materials below target))
◆ Inorganic Materials sales below target
(SNOWTEX below target, Organo/Monomer and Oilfield materials
below target)
◆ Fixed cost below expectations (¥0.6 billion)
◆ Inventory adjustment cost above expectations (¥0.2 billion)
◆ Sales up ¥0.5 billion, OP up ¥0.5 billion
(OP: DP up, Semis up, Inorganic down)
Performance Materials – (F-1) Profit Overview(¥billion)
1Q 2Q 1H 3Q 4Q 2H Total 1Q 2Q 1H 2H Total1Q
Actual
2Q
Actual
1H
Actual3Q 4Q 2H Total 1H
Actual2H Total
15.6 16.4 32.0 16.6 14.4 31.0 63.0 15.9 15.8 31.7 32.6 64.3 15.1 16.3 31.4 16.2 15.9 32.1 63.5 -0.6 +1.1 +0.5
3.9 4.2 8.1 4.3 2.6 6.9 15.0 3.6 3.8 7.4 7.6 15.0 3.9 4.3 8.2 3.5 3.4 6.9 15.1 +0.1 +0.0 +0.1
Change
(B)-(A)FY2018 Actual (A)
FY2019 Outlook
as of May 2019
FY2019 Outlook (B)
as of Nov. 2019
Sales
OP
1Q FY2019 Review<vs. 1Q FY2018>
<vs. 1Q FY2019 Outlook as of May 2019>
2Q FY2019 Outlook<vs. 2Q FY2018>
<vs. 2Q FY2019 Outlook as of May 2019>
◆ SUNEVER sales up (IPS flat (photo-alignment up, rubbing down),
VA up, TN down)
◆ Total Semis Materials sales down
(KrF and ArF down, other semis materials down
(multi layer down, other new materials up))
◆ Inorganic Materials sales down
(SNOWTEX down, Organo/Monomer sol down,
Oilfield Materials down)
◆ Fixed cost down ¥0.2 billion
◆ Sales down ¥0.5 billion, OP flat
(OP: DP up, Semis down, Inorganic down)
◆ SUNEVER sales in line with target
(IPS below target (photo-alignment above target,
rubbing below target), VA above target, TN below target)
◆ Total Semis Materials sales below target
(KrF in line with target, ArF and other semis materials below target
(multi layer and other new materials below target))
◆ Inorganic Materials sales below target
(SNOWTEX below target, Organo/Monomer sol below target,
Oilfield Materials below target)
◆ Fixed cost below expectations (¥0.7 billion)
◆ Sales down ¥0.8 billion, OP up ¥0.3 billion
(OP: DP up, Semis in line with target, Inorganic up)
other new materials: EUV under layer, CMOS image sensor materials, 3D packaging process materials total
36
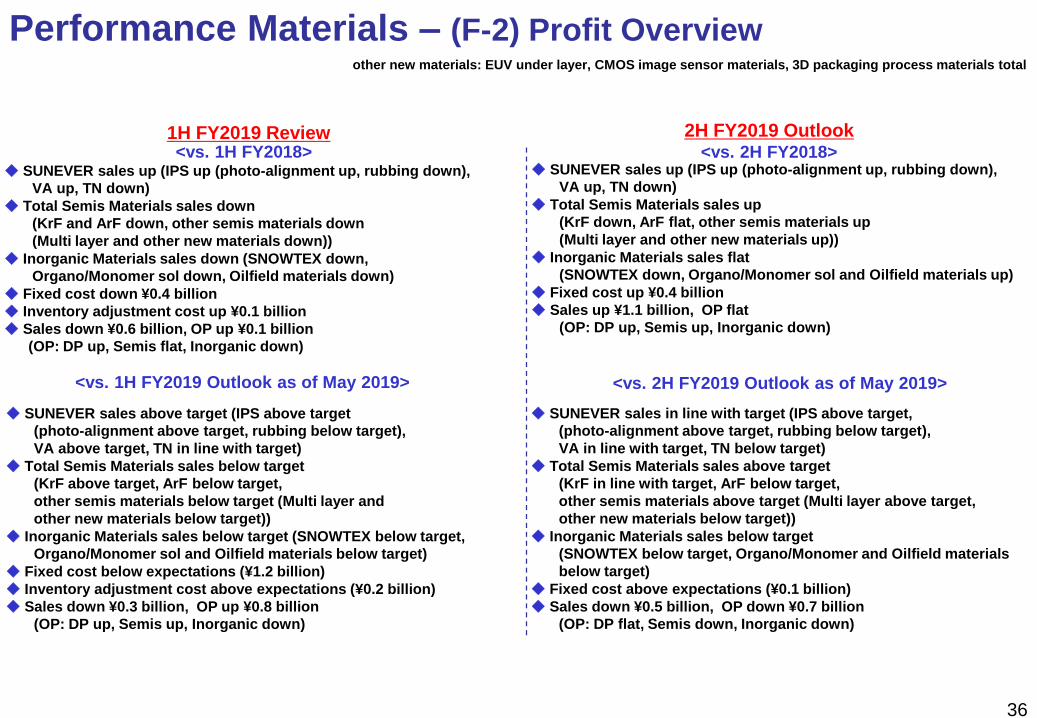
1H FY2019 Review
<vs. 1H FY2019 Outlook as of May 2019>
2H FY2019 Outlook<vs. 2H FY2018>
<vs. 2H FY2019 Outlook as of May 2019>
◆ SUNEVER sales up (IPS up (photo-alignment up, rubbing down),
VA up, TN down)
◆ Total Semis Materials sales up
(KrF down, ArF flat, other semis materials up
(Multi layer and other new materials up))
◆ Inorganic Materials sales flat
(SNOWTEX down, Organo/Monomer sol and Oilfield materials up)
◆ Fixed cost up ¥0.4 billion
◆ Sales up ¥1.1 billion, OP flat
(OP: DP up, Semis up, Inorganic down)
◆ SUNEVER sales in line with target (IPS above target,
(photo-alignment above target, rubbing below target),
VA in line with target, TN below target)
◆ Total Semis Materials sales above target
(KrF in line with target, ArF below target,
other semis materials above target (Multi layer above target,
other new materials below target))
◆ Inorganic Materials sales below target
(SNOWTEX below target, Organo/Monomer and Oilfield materials
below target)
◆ Fixed cost above expectations (¥0.1 billion)
◆ Sales down ¥0.5 billion, OP down ¥0.7 billion
(OP: DP flat, Semis down, Inorganic down)
Performance Materials – (F-2) Profit Overview
<vs. 1H FY2018>◆ SUNEVER sales up (IPS up (photo-alignment up, rubbing down),
VA up, TN down)
◆ Total Semis Materials sales down
(KrF and ArF down, other semis materials down
(Multi layer and other new materials down))
◆ Inorganic Materials sales down (SNOWTEX down,
Organo/Monomer sol down, Oilfield materials down)
◆ Fixed cost down ¥0.4 billion
◆ Inventory adjustment cost up ¥0.1 billion
◆ Sales down ¥0.6 billion, OP up ¥0.1 billion
(OP: DP up, Semis flat, Inorganic down)
◆ SUNEVER sales above target (IPS above target
(photo-alignment above target, rubbing below target),
VA above target, TN in line with target)
◆ Total Semis Materials sales below target
(KrF above target, ArF below target,
other semis materials below target (Multi layer and
other new materials below target))
◆ Inorganic Materials sales below target (SNOWTEX below target,
Organo/Monomer sol and Oilfield materials below target)
◆ Fixed cost below expectations (¥1.2 billion)
◆ Inventory adjustment cost above expectations (¥0.2 billion)
◆ Sales down ¥0.3 billion, OP up ¥0.8 billion
(OP: DP up, Semis up, Inorganic down)
other new materials: EUV under layer, CMOS image sensor materials, 3D packaging process materials total
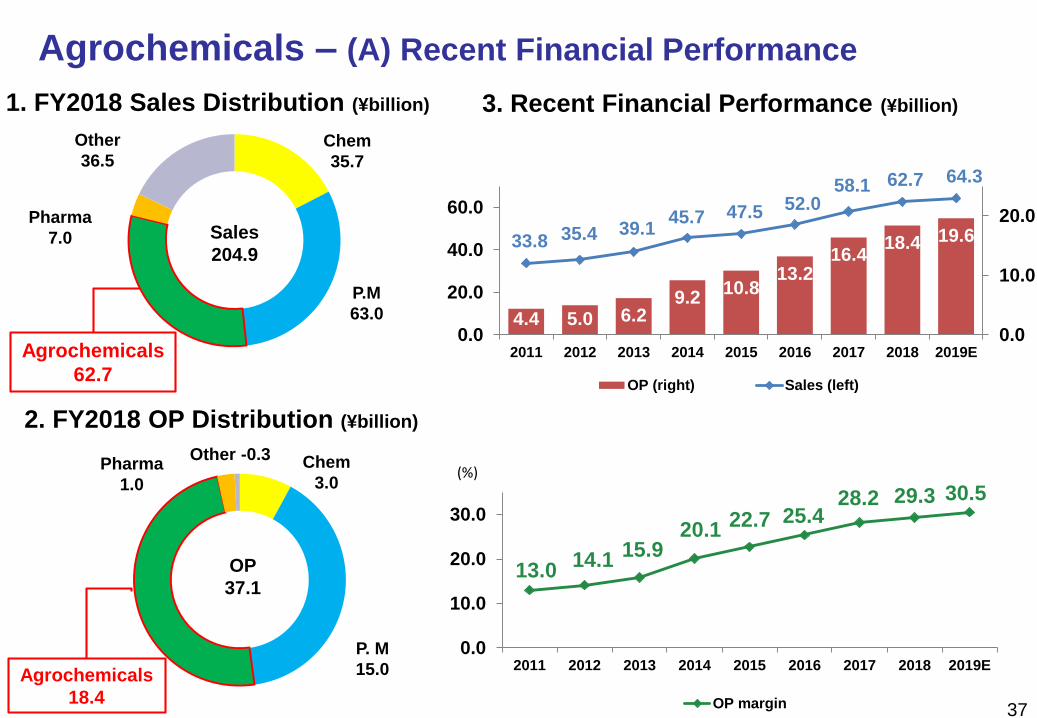
Agrochemicals – (A) Recent Financial Performance
1. FY2018 Sales Distribution (¥billion) 3. Recent Financial Performance (¥billion)
2. FY2018 OP Distribution (¥billion)
Chem
3.0
Other -0.3
Agrochemicals
62.7
Sales
204.9
Agrochemicals
18.4
Pharma
1.0
4.4 5.0 6.29.2
10.813.2
16.418.4 19.633.8 35.4 39.1
45.7 47.5 52.058.1 62.7 64.3
0.0
10.0
20.0
0.0
20.0
40.0
60.0
2011 2012 2013 2014 2015 2016 2017 2018 2019E
OP (right) Sales (left)
13.014.1
15.920.1
22.7 25.428.2 29.3 30.5
0.0
10.0
20.0
30.0
2011 2012 2013 2014 2015 2016 2017 2018 2019E
OP margin
(%)
37
OP
37.1
Chem
35.7
Pharma
7.0
Other
36.5
P.M
63.0
P. M
15.0
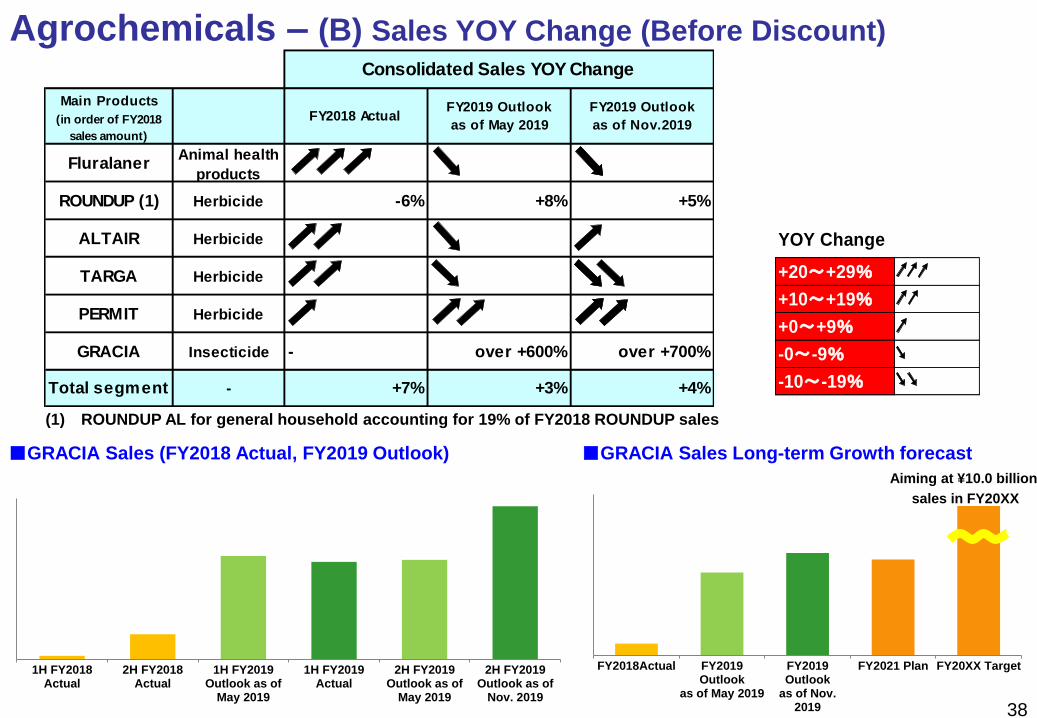
Agrochemicals – (B) Sales YOY Change (Before Discount)
38
(1) ROUNDUP AL for general household accounting for 19% of FY2018 ROUNDUP sales
YOY Change
+20~+29%
+10~+19%
+0~+9%
-0~-9%
-10~-19%
Main Products
(in order of FY2018
sales amount)
FY2018 ActualFY2019 Outlook
as of May 2019
FY2019 Outlook
as of Nov.2019
FluralanerAnimal health
products
ROUNDUP (1) Herbicide -6% +8% +5%
ALTAIR Herbicide
TARGA Herbicide
PERMIT Herbicide
GRACIA Insecticide - over +600% over +700%
Total segment - +7% +3% +4%
Consolidated Sales YOY Change
1H FY2018Actual
2H FY2018Actual
1H FY2019Outlook as of
May 2019
1H FY2019Actual
2H FY2019Outlook as of
May 2019
2H FY2019Outlook as of
Nov. 2019
FY2018Actual FY2019Outlook
as of May 2019
FY2019Outlook
as of Nov.2019
FY2021 Plan FY20XX Target
■GRACIA Sales Long-term Growth forecast
Aiming at ¥10.0 billion
sales in FY20XX
■GRACIA Sales (FY2018 Actual, FY2019 Outlook)
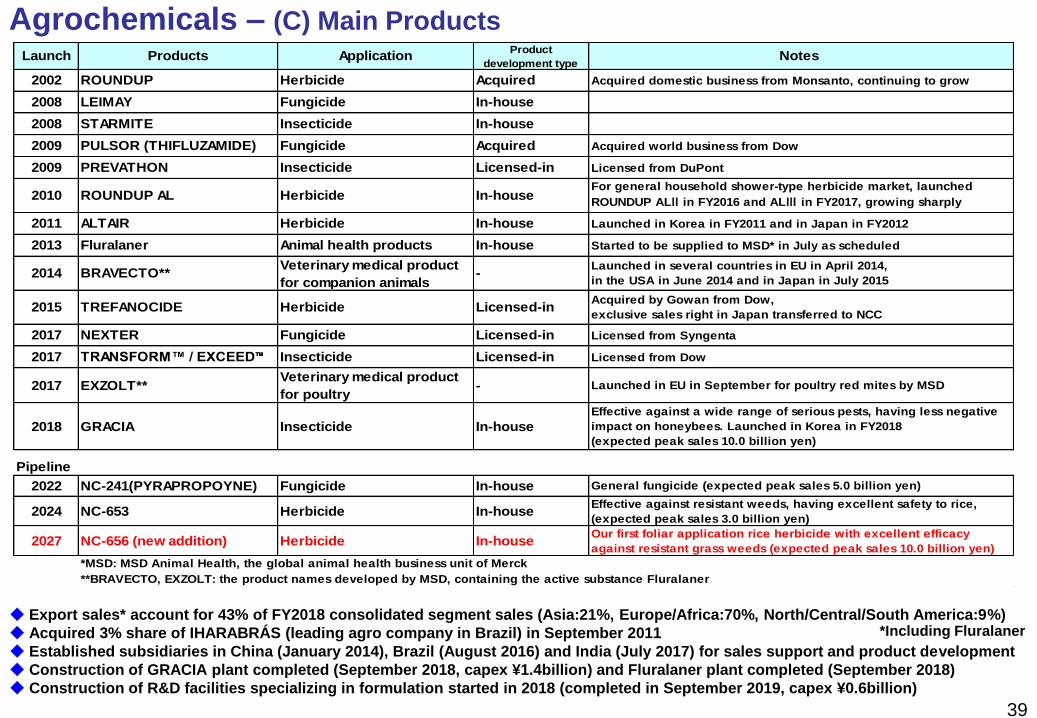
Agrochemicals – (C) Main ProductsLaunch Products Application
Product
development type
2002 ROUNDUP Herbicide Acquired Acquired domestic business from Monsanto, continuing to grow
2008 LEIMAY Fungicide In-house
2008 STARMITE Insecticide In-house
2009 PULSOR (THIFLUZAMIDE) Fungicide Acquired Acquired world business from Dow
2009 PREVATHON Insecticide Licensed-in Licensed from DuPont
2010 ROUNDUP AL Herbicide In-house
2011 ALTAIR Herbicide In-house Launched in Korea in FY2011 and in Japan in FY2012
2013 Fluralaner Animal health products In-house Started to be supplied to MSD* in July as scheduled
2014 BRAVECTO**Veterinary medical product
for companion animals-
2015 TREFANOCIDE Herbicide Licensed-in
2017 NEXTER Fungicide Licensed-in Licensed from Syngenta
2017 TRANSFORM™ / EXCEED™ Insecticide Licensed-in Licensed from Dow
2017 EXZOLT**Veterinary medical product
for poultry-
2018 GRACIA Insecticide In-house
Pipeline
2022 NC-241(PYRAPROPOYNE) Fungicide In-house General fungicide (expected peak sales 5.0 billion yen)
2024 NC-653 Herbicide In-house
2027 NC-656 (new addition) Herbicide In-house
*MSD: MSD Animal Health, the global animal health business unit of Merck
**BRAVECTO, EXZOLT: the product names developed by MSD, containing the active substance Fluralaner
Our first foliar application rice herbicide with excellent efficacy
against resistant grass weeds (expected peak sales 10.0 billion yen)
Effective against resistant weeds, having excellent safety to rice,
(expected peak sales 3.0 billion yen)
Effective against a wide range of serious pests, having less negative
impact on honeybees. Launched in Korea in FY2018
(expected peak sales 10.0 billion yen)
Notes
For general household shower-type herbicide market, launched
ROUNDUP ALⅡ in FY2016 and ALⅢ in FY2017, growing sharply
Launched in several countries in EU in April 2014,
in the USA in June 2014 and in Japan in July 2015
Acquired by Gowan from Dow,
exclusive sales right in Japan transferred to NCC
Launched in EU in September for poultry red mites by MSD
39
◆ Export sales* account for 43% of FY2018 consolidated segment sales (Asia:21%, Europe/Africa:70%, North/Central/South America:9%)
◆ Acquired 3% share of IHARABRÁS (leading agro company in Brazil) in September 2011
◆ Established subsidiaries in China (January 2014), Brazil (August 2016) and India (July 2017) for sales support and product development
◆ Construction of GRACIA plant completed (September 2018, capex ¥1.4billion) and Fluralaner plant completed (September 2018)
◆ Construction of R&D facilities specializing in formulation started in 2018 (completed in September 2019, capex ¥0.6billion)
*Including Fluralaner
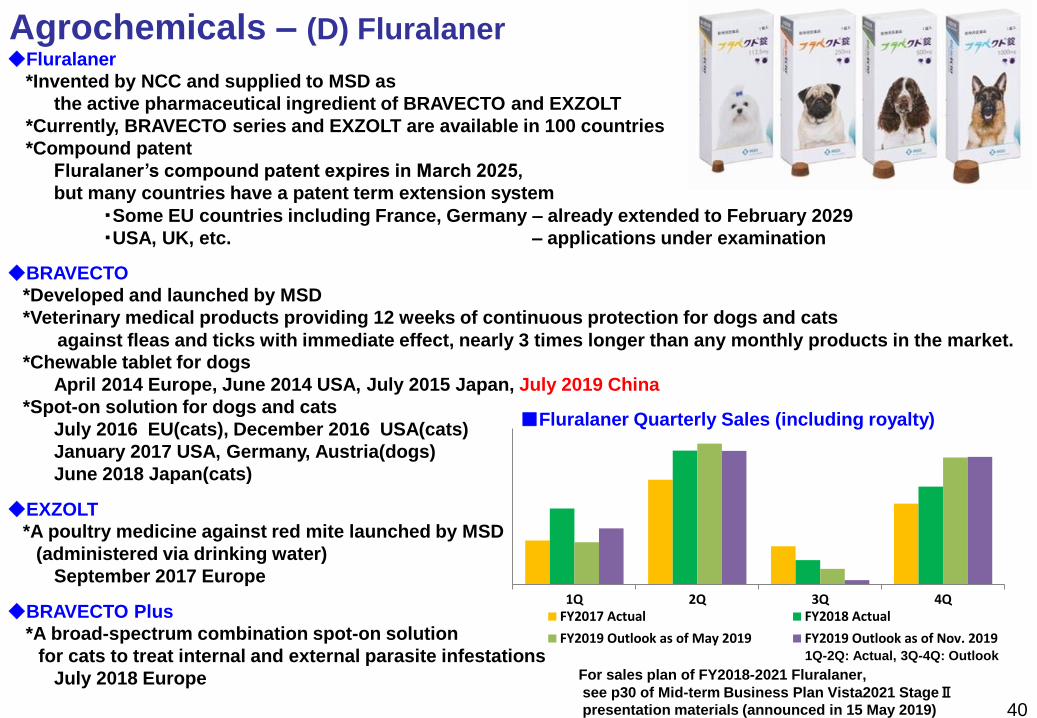
Agrochemicals – (D) Fluralaner◆Fluralaner
*Invented by NCC and supplied to MSD as
the active pharmaceutical ingredient of BRAVECTO and EXZOLT
*Currently, BRAVECTO series and EXZOLT are available in 100 countries
*Compound patent
Fluralaner’s compound patent expires in March 2025,
but many countries have a patent term extension system
・Some EU countries including France, Germany – already extended to February 2029
・USA, UK, etc. – applications under examination
◆BRAVECTO
*Developed and launched by MSD
*Veterinary medical products providing 12 weeks of continuous protection for dogs and cats
against fleas and ticks with immediate effect, nearly 3 times longer than any monthly products in the market.
*Chewable tablet for dogs
April 2014 Europe, June 2014 USA, July 2015 Japan, July 2019 China
*Spot-on solution for dogs and cats
July 2016 EU(cats), December 2016 USA(cats)
January 2017 USA, Germany, Austria(dogs)
June 2018 Japan(cats)
◆EXZOLT
*A poultry medicine against red mite launched by MSD
(administered via drinking water)
September 2017 Europe
◆BRAVECTO Plus
*A broad-spectrum combination spot-on solution
for cats to treat internal and external parasite infestations
July 2018 Europe
40
■Fluralaner Quarterly Sales (including royalty)
1Q 2Q 3Q 4QFY2017 Actual FY2018 Actual
FY2019 Outlook as of May 2019 FY2019 Outlook as of Nov. 20191Q-2Q: Actual, 3Q-4Q: Outlook
For sales plan of FY2018-2021 Fluralaner,
see p30 of Mid-term Business Plan Vista2021 StageⅡpresentation materials (announced in 15 May 2019)
41
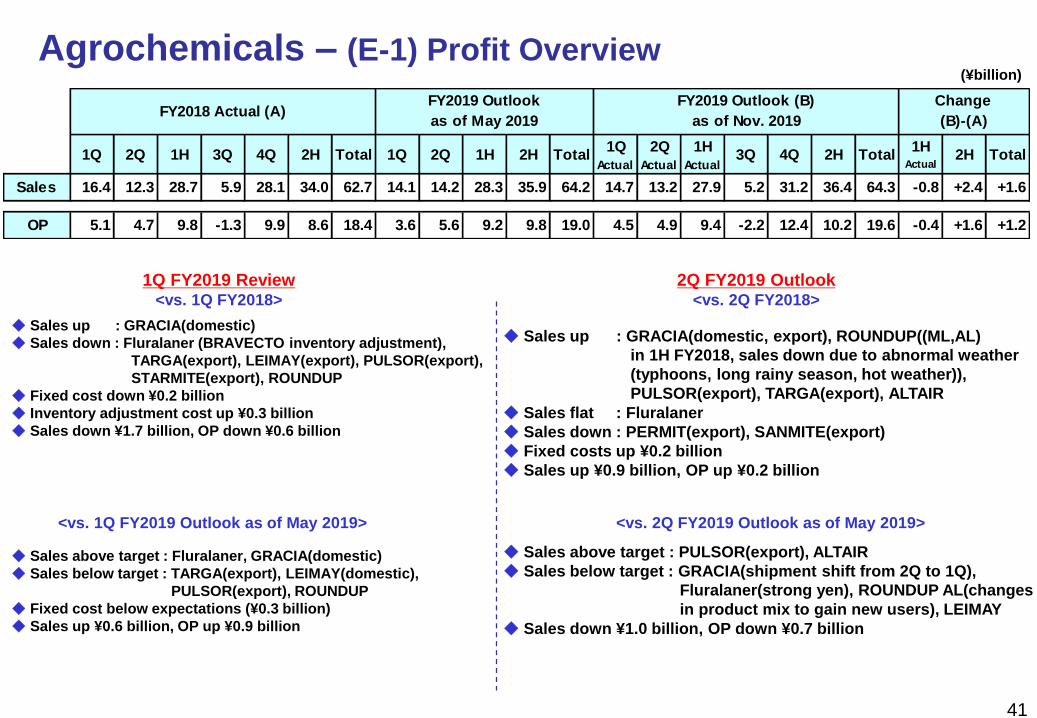
Agrochemicals – (E-1) Profit Overview
◆ Sales up : GRACIA(domestic, export), ROUNDUP((ML,AL)
in 1H FY2018, sales down due to abnormal weather
(typhoons, long rainy season, hot weather)),
PULSOR(export), TARGA(export), ALTAIR
◆ Sales flat : Fluralaner
◆ Sales down : PERMIT(export), SANMITE(export)
◆ Fixed costs up ¥0.2 billion
◆ Sales up ¥0.9 billion, OP up ¥0.2 billion
◆ Sales above target : PULSOR(export), ALTAIR
◆ Sales below target : GRACIA(shipment shift from 2Q to 1Q),
Fluralaner(strong yen), ROUNDUP AL(changes
in product mix to gain new users), LEIMAY
◆ Sales down ¥1.0 billion, OP down ¥0.7 billion
(¥billion)
1Q 2Q 1H 3Q 4Q 2H Total 1Q 2Q 1H 2H Total1Q
Actual
2Q
Actual
1H
Actual3Q 4Q 2H Total
1HActual
2H Total
16.4 12.3 28.7 5.9 28.1 34.0 62.7 14.1 14.2 28.3 35.9 64.2 14.7 13.2 27.9 5.2 31.2 36.4 64.3 -0.8 +2.4 +1.6
5.1 4.7 9.8 -1.3 9.9 8.6 18.4 3.6 5.6 9.2 9.8 19.0 4.5 4.9 9.4 -2.2 12.4 10.2 19.6 -0.4 +1.6 +1.2
Change
(B)-(A)FY2018 Actual (A)
FY2019 Outlook
as of May 2019
FY2019 Outlook (B)
as of Nov. 2019
Sales
OP
1Q FY2019 Review<vs. 1Q FY2018>
<vs. 1Q FY2019 Outlook as of May 2019>
2Q FY2019 Outlook<vs. 2Q FY2018>
<vs. 2Q FY2019 Outlook as of May 2019>
◆ Sales up : GRACIA(domestic)
◆ Sales down : Fluralaner (BRAVECTO inventory adjustment),
TARGA(export), LEIMAY(export), PULSOR(export),
STARMITE(export), ROUNDUP
◆ Fixed cost down ¥0.2 billion
◆ Inventory adjustment cost up ¥0.3 billion
◆ Sales down ¥1.7 billion, OP down ¥0.6 billion
◆ Sales above target : Fluralaner, GRACIA(domestic)
◆ Sales below target : TARGA(export), LEIMAY(domestic),
PULSOR(export), ROUNDUP
◆ Fixed cost below expectations (¥0.3 billion)
◆ Sales up ¥0.6 billion, OP up ¥0.9 billion
42
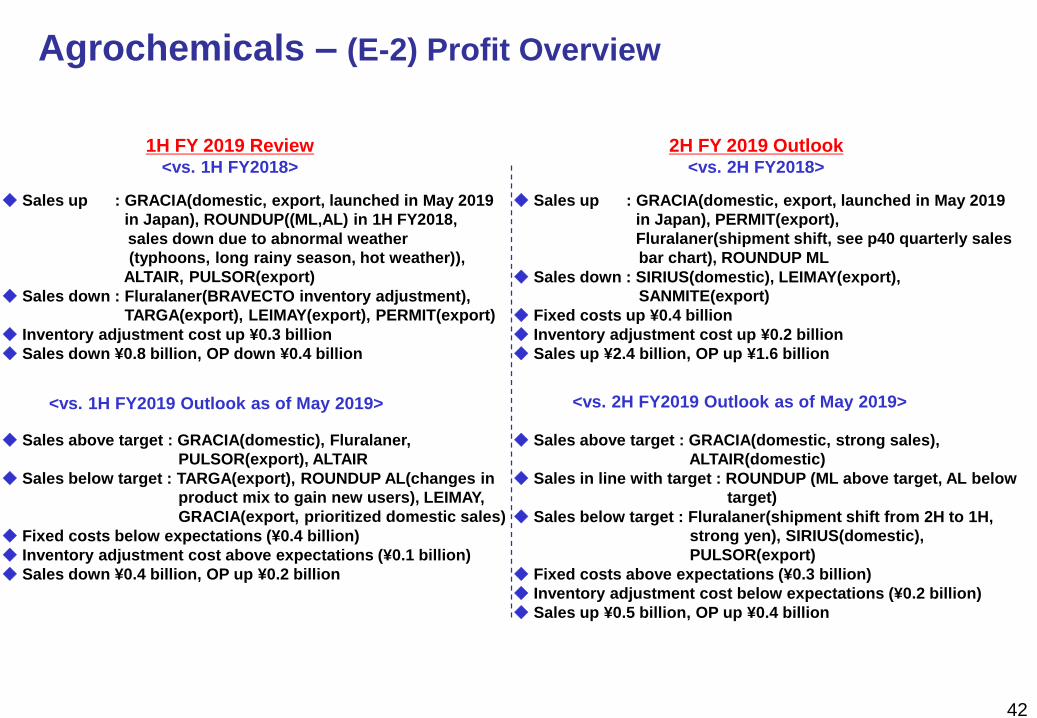
Agrochemicals – (E-2) Profit Overview
1H FY 2019 Review<vs. 1H FY2018>
<vs. 1H FY2019 Outlook as of May 2019>
2H FY 2019 Outlook<vs. 2H FY2018>
<vs. 2H FY2019 Outlook as of May 2019>
◆ Sales up : GRACIA(domestic, export, launched in May 2019
in Japan), PERMIT(export),
Fluralaner(shipment shift, see p40 quarterly sales
bar chart), ROUNDUP ML
◆ Sales down : SIRIUS(domestic), LEIMAY(export),
SANMITE(export)
◆ Fixed costs up ¥0.4 billion
◆ Inventory adjustment cost up ¥0.2 billion
◆ Sales up ¥2.4 billion, OP up ¥1.6 billion
◆ Sales above target : GRACIA(domestic, strong sales),
ALTAIR(domestic)
◆ Sales in line with target : ROUNDUP (ML above target, AL below
target)
◆ Sales below target : Fluralaner(shipment shift from 2H to 1H,
strong yen), SIRIUS(domestic),
PULSOR(export)
◆ Fixed costs above expectations (¥0.3 billion)
◆ Inventory adjustment cost below expectations (¥0.2 billion)
◆ Sales up ¥0.5 billion, OP up ¥0.4 billion
◆ Sales up : GRACIA(domestic, export, launched in May 2019
in Japan), ROUNDUP((ML,AL) in 1H FY2018,
sales down due to abnormal weather
(typhoons, long rainy season, hot weather)),
ALTAIR, PULSOR(export)
◆ Sales down : Fluralaner(BRAVECTO inventory adjustment),
TARGA(export), LEIMAY(export), PERMIT(export)
◆ Inventory adjustment cost up ¥0.3 billion
◆ Sales down ¥0.8 billion, OP down ¥0.4 billion
◆ Sales above target : GRACIA(domestic), Fluralaner,
PULSOR(export), ALTAIR
◆ Sales below target : TARGA(export), ROUNDUP AL(changes in
product mix to gain new users), LEIMAY,
GRACIA(export, prioritized domestic sales)
◆ Fixed costs below expectations (¥0.4 billion)
◆ Inventory adjustment cost above expectations (¥0.1 billion)
◆ Sales down ¥0.4 billion, OP up ¥0.2 billion
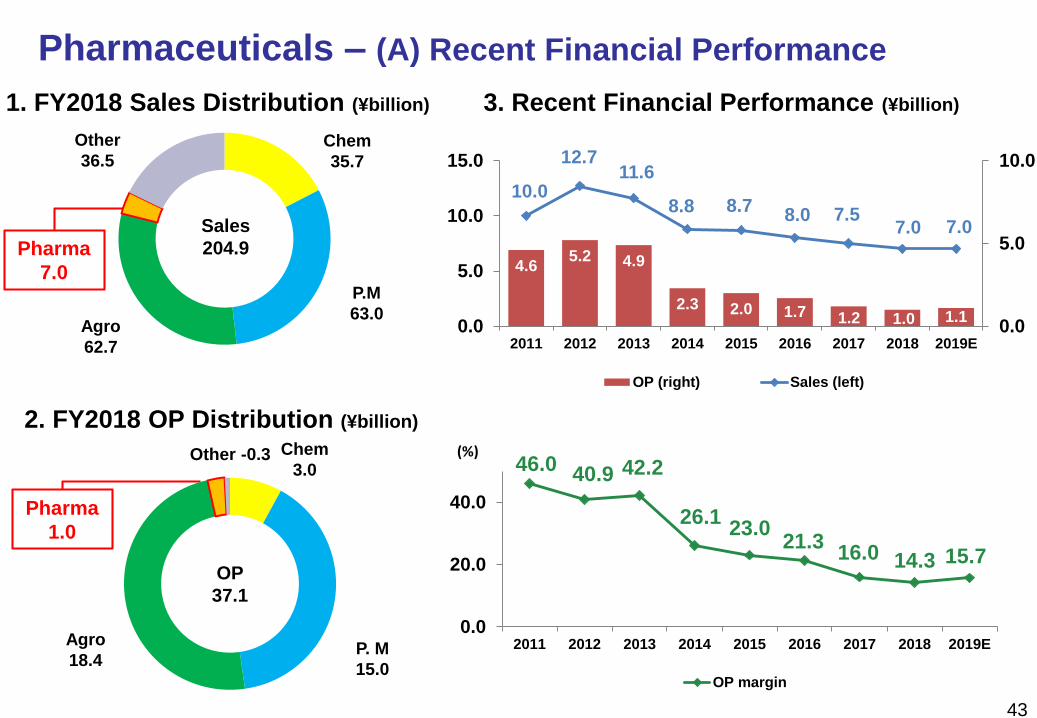
Pharmaceuticals – (A) Recent Financial Performance
43
1. FY2018 Sales Distribution (¥billion) 3. Recent Financial Performance (¥billion)
4.65.2 4.9
2.3 2.0 1.7 1.2 1.0 1.1
10.0
12.711.6
8.8 8.78.0 7.5
7.0 7.0
0.0
5.0
10.0
0.0
5.0
10.0
15.0
2011 2012 2013 2014 2015 2016 2017 2018 2019E
OP (right) Sales (left)
46.040.9 42.2
26.123.0
21.316.0 14.3 15.7
0.0
20.0
40.0
2011 2012 2013 2014 2015 2016 2017 2018 2019E
OP margin
(%)
Pharma
7.0
2. FY2018 OP Distribution (¥billion)
Pharma
1.0
Sales
204.9
OP
37.1
Chem
3.0Other -0.3
Chem
35.7
Other
36.5
P.M
63.0
P. M
15.0
Agro
18.4
Agro
62.7

< After Launch >< Before Launch >
◆ Unique ethical pharma business model without sales force
Pharmaceuticals – (B) Business Model (New Drug) and LIVALO
NCC Major
Pharma
License out
Upfront Payment,
Development Milestone
Drug
DiscoveryClinical
Trial
NCCMajor
PharmaEnd
MarketAPI
Production
Shipment
Formulation,
Marketing, Sales
API* Sales Revenues,
Sales Milestone, Royalty
API*: Active Pharmaceutical Ingredient
44
◆ LIVALO (Anti-Cholesterol Drug)
Domestic End Market Sales
(NHI drug price basis, \billion)52.6 34.5 29.7 23.9 21.0 16.7 - -
Our Domestic and Export API Sales (\billion) 10.2 6.9 5.8 5.2 4.8 4.3 4.1 3.9
Our Domestic and Export API Sales YOY Change -2% -32% -15% -11% -7% -11% -5% -10%
(Domestic API Sales YOY Change) (-2%) (-46%) (-27%) (-42%) (-73%) (-53%) (+59%) (+59%)
(Export API Sales YOY Change) (-1%) (+21%) (+5%) (+26%) (+29%) (-6%) (-9%) (-14%)
FY2019
Outlook
as of Nov.
2019
FY2019
Outlook
as of May
2019
FY2014
Actual
FY2017
Actual
FY2018
Actual
FY2016
Actual
FY2013
Actual
FY2015
Actual
- August 2013, domestic compound patent expired
- December 2018, won a law suit against certain companies in USA which had submitted Abbreviated New
Drug Application(ANDA) with FDA
-Currently, available in 25 countries
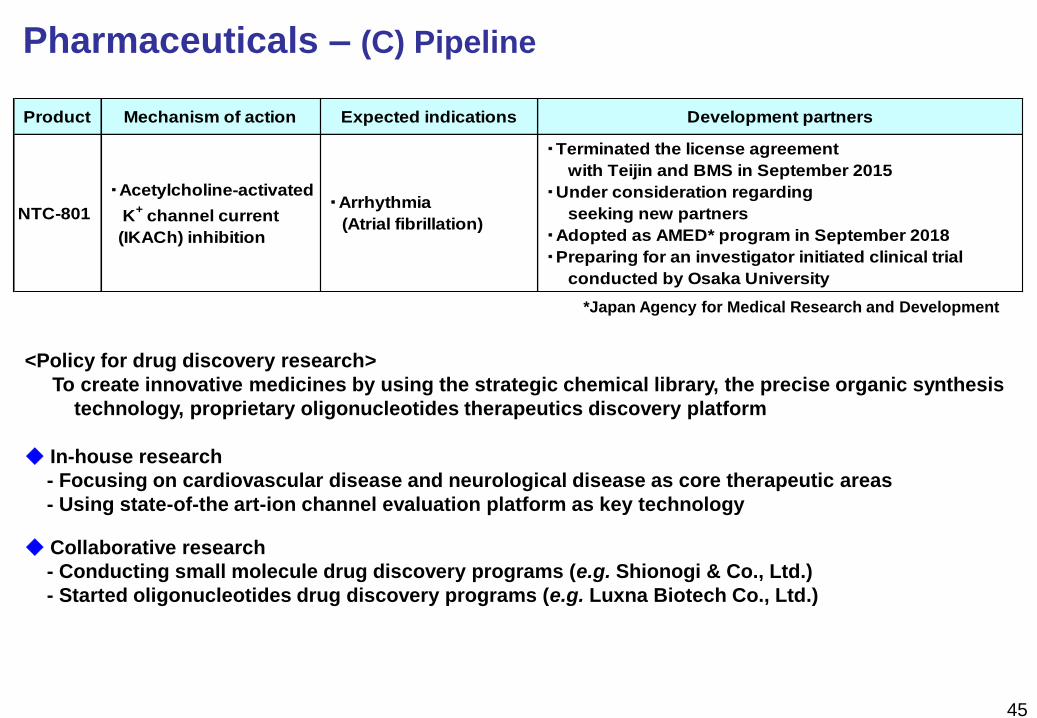
Pharmaceuticals – (C) Pipeline
45
Product Mechanism of action Expected indications Development partners
NTC-801
・Acetylcholine-activated
K+ channel current
(IKACh) inhibition
・Arrhythmia
(Atrial fibrillation)
・Terminated the license agreement
with Teijin and BMS in September 2015
・Under consideration regarding
seeking new partners
・Adopted as AMED* program in September 2018
・Preparing for an investigator initiated clinical trial
conducted by Osaka University
*Japan Agency for Medical Research and Development
<Policy for drug discovery research>
To create innovative medicines by using the strategic chemical library, the precise organic synthesis
technology, proprietary oligonucleotides therapeutics discovery platform
◆ In-house research
- Focusing on cardiovascular disease and neurological disease as core therapeutic areas
- Using state-of-the art-ion channel evaluation platform as key technology
◆ Collaborative research
- Conducting small molecule drug discovery programs (e.g. Shionogi & Co., Ltd.)
- Started oligonucleotides drug discovery programs (e.g. Luxna Biotech Co., Ltd.)
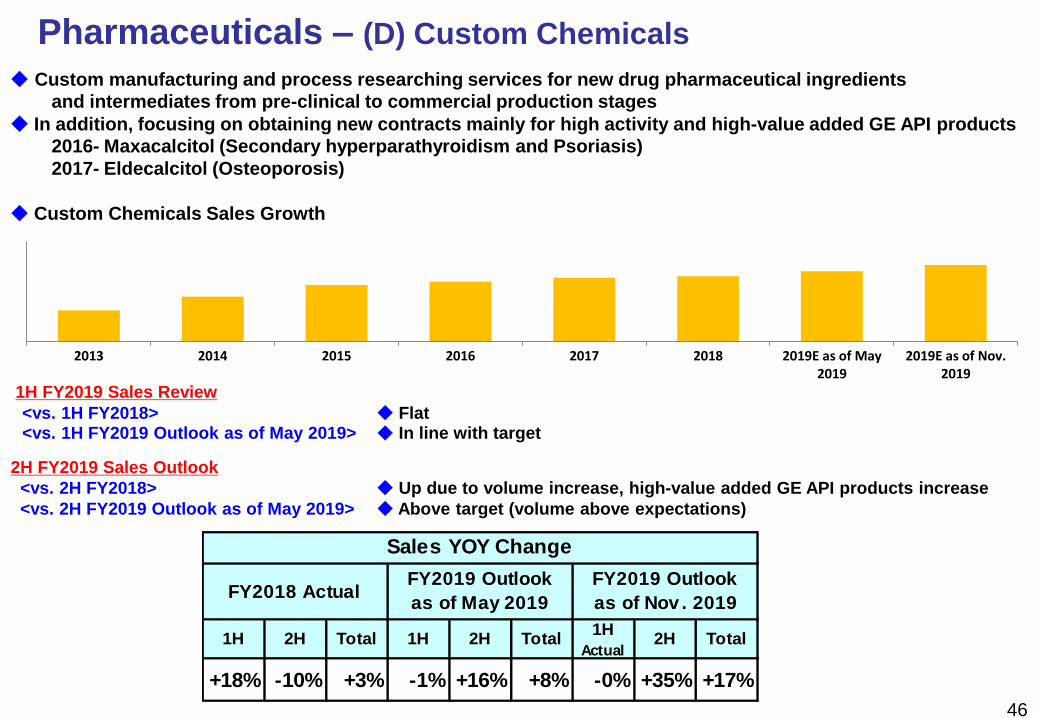
◆ Custom manufacturing and process researching services for new drug pharmaceutical ingredients
and intermediates from pre-clinical to commercial production stages
◆ In addition, focusing on obtaining new contracts mainly for high activity and high-value added GE API products
2016- Maxacalcitol (Secondary hyperparathyroidism and Psoriasis)
2017- Eldecalcitol (Osteoporosis)
◆ Custom Chemicals Sales Growth
Pharmaceuticals – (D) Custom Chemicals
46
1H 2H Total 1H 2H Total1H
Actual2H Total
+18% -10% +3% -1% +16% +8% -0% +35% +17%
FY2018 Actual
Sales YOY Change
FY2019 Outlook
as of May 2019
FY2019 Outlook
as of Nov . 2019
2013 2014 2015 2016 2017 2018 2019E as of May2019
2019E as of Nov.2019
1H FY2019 Sales Review
<vs. 1H FY2018> ◆ Flat<vs. 1H FY2019 Outlook as of May 2019> ◆ In line with target
2H FY2019 Sales Outlook
<vs. 2H FY2018> ◆ Up due to volume increase, high-value added GE API products increase
<vs. 2H FY2019 Outlook as of May 2019> ◆ Above target (volume above expectations)
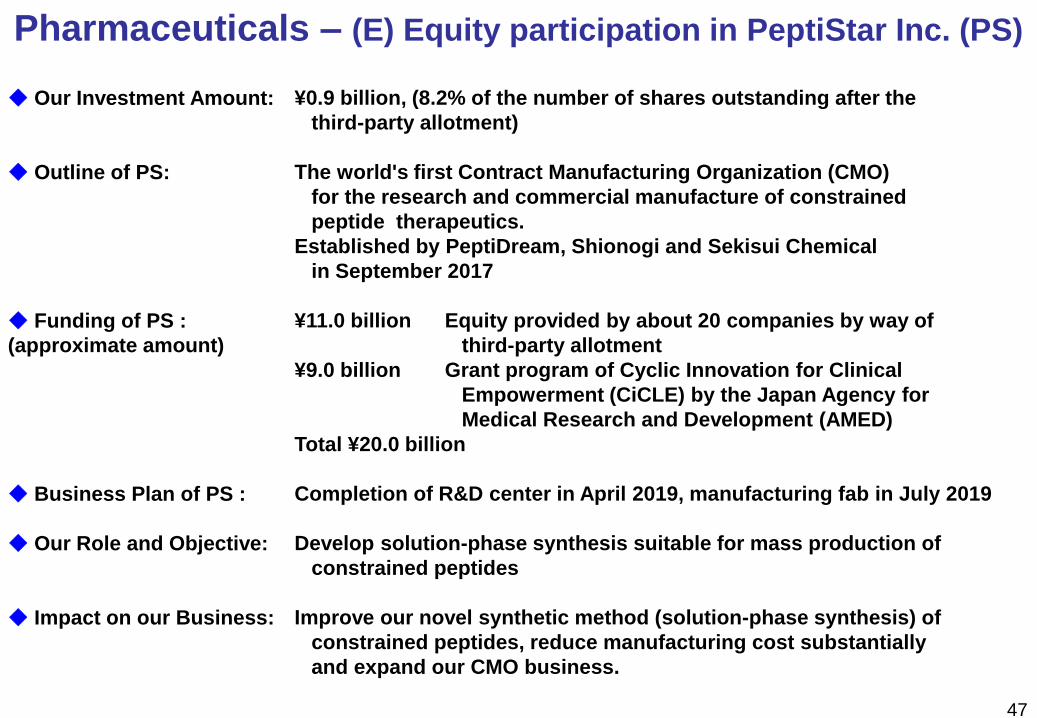
¥0.9 billion, (8.2% of the number of shares outstanding after the
third-party allotment)
The world's first Contract Manufacturing Organization (CMO)
for the research and commercial manufacture of constrained
peptide therapeutics.
Established by PeptiDream, Shionogi and Sekisui Chemical
in September 2017
¥11.0 billion Equity provided by about 20 companies by way of
third-party allotment
¥9.0 billion Grant program of Cyclic Innovation for Clinical
Empowerment (CiCLE) by the Japan Agency for
Medical Research and Development (AMED)
Total ¥20.0 billion
Completion of R&D center in April 2019, manufacturing fab in July 2019
Develop solution-phase synthesis suitable for mass production of
constrained peptides
Improve our novel synthetic method (solution-phase synthesis) of
constrained peptides, reduce manufacturing cost substantially
and expand our CMO business.
Pharmaceuticals – (E) Equity participation in PeptiStar Inc. (PS)
47
◆ Our Investment Amount:
◆ Outline of PS:
◆ Funding of PS :
(approximate amount)
◆ Business Plan of PS :
◆ Our Role and Objective:
◆ Impact on our Business:

48
(Blank)
49
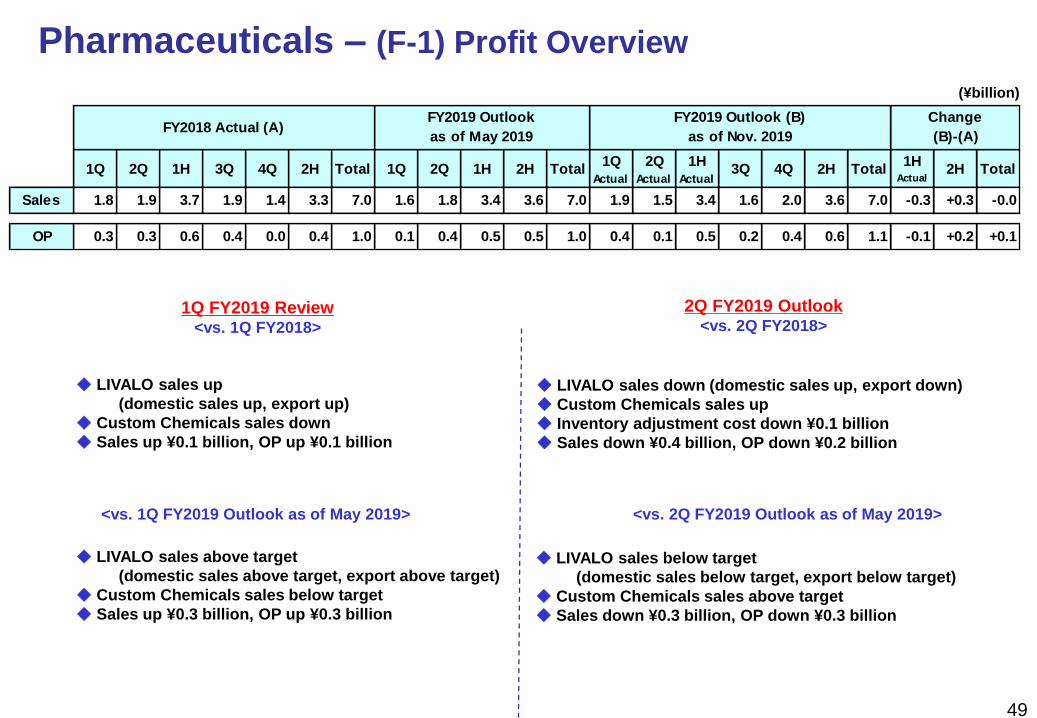
Pharmaceuticals – (F-1) Profit Overview
◆ LIVALO sales down (domestic sales up, export down)
◆ Custom Chemicals sales up
◆ Inventory adjustment cost down ¥0.1 billion
◆ Sales down ¥0.4 billion, OP down ¥0.2 billion
◆ LIVALO sales below target
(domestic sales below target, export below target)
◆ Custom Chemicals sales above target
◆ Sales down ¥0.3 billion, OP down ¥0.3 billion
(¥billion)
1Q 2Q 1H 3Q 4Q 2H Total 1Q 2Q 1H 2H Total1Q
Actual
2Q
Actual
1H
Actual3Q 4Q 2H Total
1HActual
2H Total
1.8 1.9 3.7 1.9 1.4 3.3 7.0 1.6 1.8 3.4 3.6 7.0 1.9 1.5 3.4 1.6 2.0 3.6 7.0 -0.3 +0.3 -0.0
0.3 0.3 0.6 0.4 0.0 0.4 1.0 0.1 0.4 0.5 0.5 1.0 0.4 0.1 0.5 0.2 0.4 0.6 1.1 -0.1 +0.2 +0.1
Sales
OP
Change
(B)-(A)FY2018 Actual (A)
FY2019 Outlook
as of May 2019
FY2019 Outlook (B)
as of Nov. 2019
1Q FY2019 Review<vs. 1Q FY2018>
<vs. 1Q FY2019 Outlook as of May 2019>
2Q FY2019 Outlook<vs. 2Q FY2018>
<vs. 2Q FY2019 Outlook as of May 2019>
◆ LIVALO sales up
(domestic sales up, export up)
◆ Custom Chemicals sales down
◆ Sales up ¥0.1 billion, OP up ¥0.1 billion
◆ LIVALO sales above target
(domestic sales above target, export above target)
◆ Custom Chemicals sales below target
◆ Sales up ¥0.3 billion, OP up ¥0.3 billion
50
Pharmaceuticals – (F-2) Profit Overview
1H FY 2019 Review<vs. 1H FY2018>
<vs. 1H FY2019 Outlook as of May 2019>
2H FY 2019 Outlook<vs. 2H FY2018>
<vs. 2H FY2019 Outlook as of May 2019>
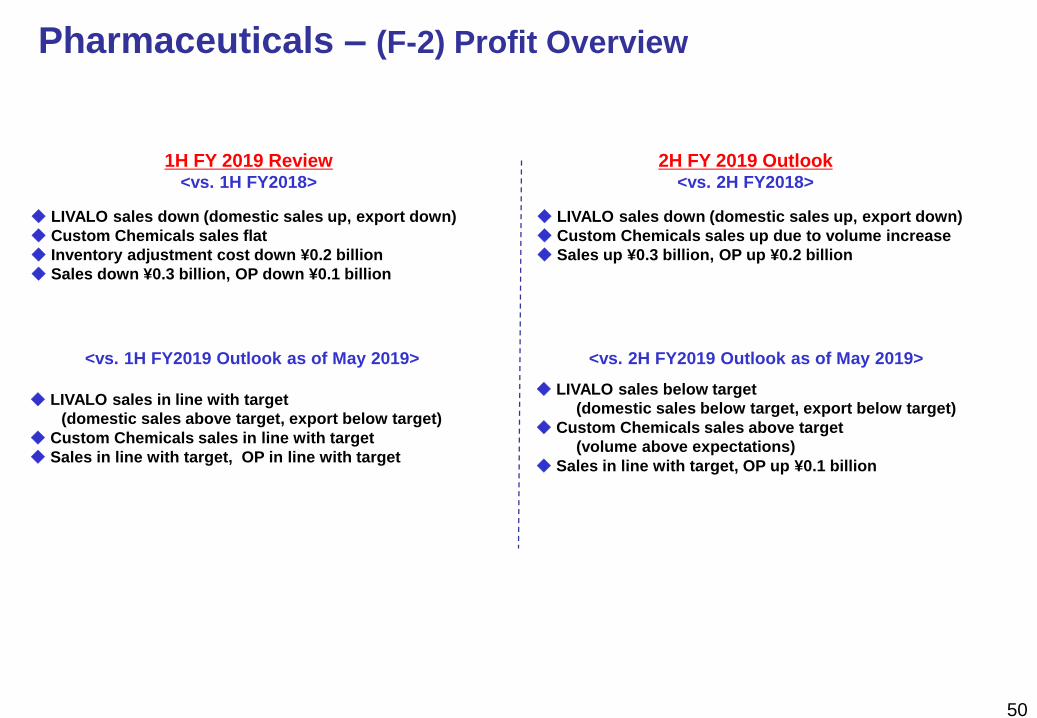
◆ LIVALO sales down (domestic sales up, export down)
◆ Custom Chemicals sales up due to volume increase
◆ Sales up ¥0.3 billion, OP up ¥0.2 billion
◆ LIVALO sales below target
(domestic sales below target, export below target)
◆ Custom Chemicals sales above target
(volume above expectations)
◆ Sales in line with target, OP up ¥0.1 billion
◆ LIVALO sales down (domestic sales up, export down)
◆ Custom Chemicals sales flat
◆ Inventory adjustment cost down ¥0.2 billion
◆ Sales down ¥0.3 billion, OP down ¥0.1 billion
◆ LIVALO sales in line with target
(domestic sales above target, export below target)
◆ Custom Chemicals sales in line with target
◆ Sales in line with target, OP in line with target
2015 2016 2017 2018 2019E(2019/5)
2019E(2019/11)
2015 2016 2017 2018 2019E(2019/5)
2019E(2019/11)
2015 2016 2017 2018 2019E(2019/5)
2019E(2019/11)
% of Sales
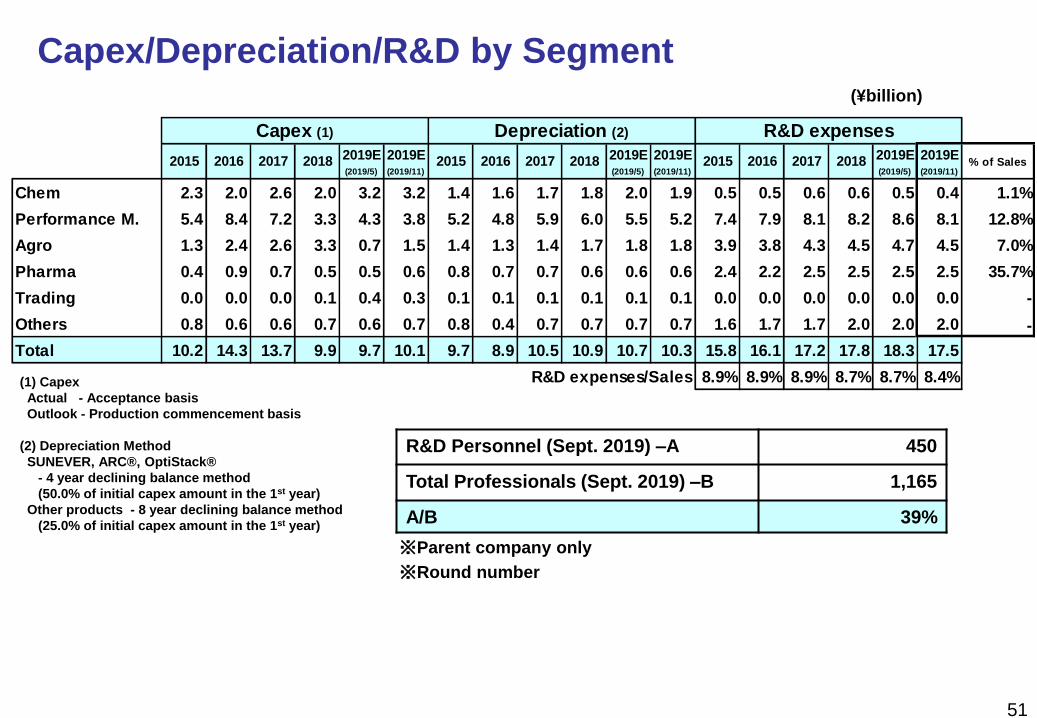
Chem 2.3 2.0 2.6 2.0 3.2 3.2 1.4 1.6 1.7 1.8 2.0 1.9 0.5 0.5 0.6 0.6 0.5 0.4 1.1%
Performance M. 5.4 8.4 7.2 3.3 4.3 3.8 5.2 4.8 5.9 6.0 5.5 5.2 7.4 7.9 8.1 8.2 8.6 8.1 12.8%
Agro 1.3 2.4 2.6 3.3 0.7 1.5 1.4 1.3 1.4 1.7 1.8 1.8 3.9 3.8 4.3 4.5 4.7 4.5 7.0%
Pharma 0.4 0.9 0.7 0.5 0.5 0.6 0.8 0.7 0.7 0.6 0.6 0.6 2.4 2.2 2.5 2.5 2.5 2.5 35.7%
Trading 0.0 0.0 0.0 0.1 0.4 0.3 0.1 0.1 0.1 0.1 0.1 0.1 0.0 0.0 0.0 0.0 0.0 0.0 -
Others 0.8 0.6 0.6 0.7 0.6 0.7 0.8 0.4 0.7 0.7 0.7 0.7 1.6 1.7 1.7 2.0 2.0 2.0 -
Total 10.2 14.3 13.7 9.9 9.7 10.1 9.7 8.9 10.5 10.9 10.7 10.3 15.8 16.1 17.2 17.8 18.3 17.5
R&D expenses/Sales 8.9% 8.9% 8.9% 8.7% 8.7% 8.4%
Depreciation (2)Capex (1) R&D expenses
Capex/Depreciation/R&D by Segment(¥billion)
(1) Capex
Actual - Acceptance basis
Outlook - Production commencement basis
(2) Depreciation Method
SUNEVER, ARC®, OptiStack®
- 4 year declining balance method
(50.0% of initial capex amount in the 1st year)
Other products - 8 year declining balance method
(25.0% of initial capex amount in the 1st year)
R&D Personnel (Sept. 2019) –A 450
Total Professionals (Sept. 2019) –B 1,165
A/B 39%
※Parent company only
51
※Round number
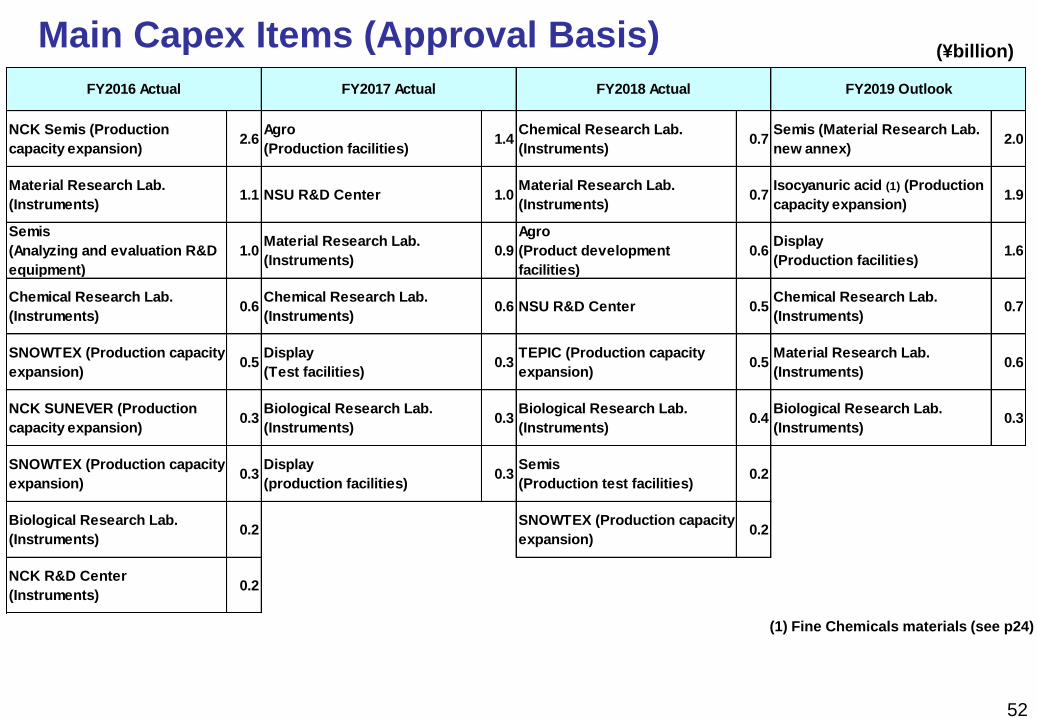
NCK Semis (Production
capacity expansion)2.6
Agro
(Production facilities)1.4
Chemical Research Lab.
(Instruments)0.7
Semis (Material Research Lab.
new annex)2.0
Material Research Lab.
(Instruments)1.1 NSU R&D Center 1.0
Material Research Lab.
(Instruments)0.7
Isocyanuric acid (1) (Production
capacity expansion)1.9
Semis
(Analyzing and evaluation R&D
equipment)
1.0Material Research Lab.
(Instruments)0.9
Agro
(Product development
facilities)
0.6Display
(Production facilities)1.6
Chemical Research Lab.
(Instruments)0.6
Chemical Research Lab.
(Instruments)0.6 NSU R&D Center 0.5
Chemical Research Lab.
(Instruments)0.7
SNOWTEX (Production capacity
expansion)0.5
Display
(Test facilities)0.3
TEPIC (Production capacity
expansion)0.5
Material Research Lab.
(Instruments)0.6
NCK SUNEVER (Production
capacity expansion)0.3
Biological Research Lab.
(Instruments)0.3
Biological Research Lab.
(Instruments)0.4
Biological Research Lab.
(Instruments)0.3
SNOWTEX (Production capacity
expansion)0.3
Display
(production facilities)0.3
Semis
(Production test facilities)0.2
Biological Research Lab.
(Instruments)0.2
SNOWTEX (Production capacity
expansion)0.2
NCK R&D Center
(Instruments)0.2
FY2016 Actual FY2017 Actual FY2018 Actual FY2019 Outlook
Main Capex Items (Approval Basis)(¥billion)
52
(1) Fine Chemicals materials (see p24)
53
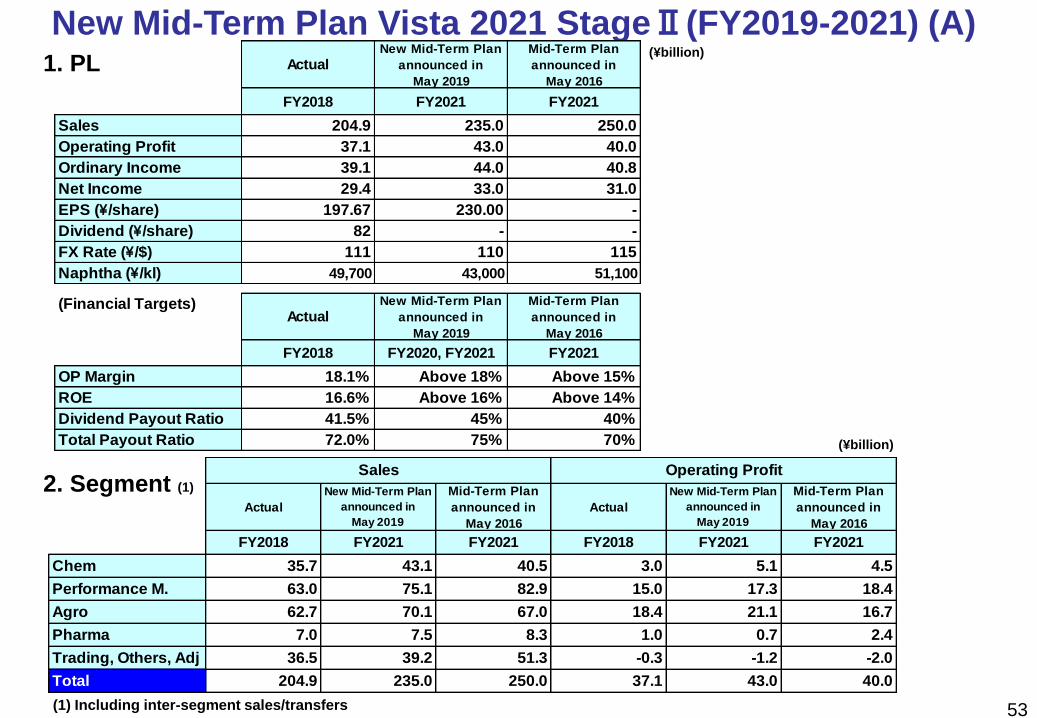
New Mid-Term Plan Vista 2021 StageⅡ(FY2019-2021) (A)Actual
New Mid-Term Plan
announced in
May 2019
Mid-Term Plan
announced in
May 2016
FY2018 FY2021 FY2021
Sales 204.9 235.0 250.0
Operating Profit 37.1 43.0 40.0
Ordinary Income 39.1 44.0 40.8
Net Income 29.4 33.0 31.0
EPS (\/share) 197.67 230.00 -
Dividend (\/share) 82 - -
FX Rate (\/$) 111 110 115
Naphtha (\/kl) 49,700 43,000 51,100
(Financial Targets)Actual
New Mid-Term Plan
announced in
May 2019
Mid-Term Plan
announced in
May 2016
FY2018 FY2020, FY2021 FY2021
OP Margin 18.1% Above 18% Above 15%
ROE 16.6% Above 16% Above 14%
Dividend Payout Ratio 41.5% 45% 40%
Total Payout Ratio 72.0% 75% 70%
Actual
New Mid-Term Plan
announced in
May 2019
Mid-Term Plan
announced in
May 2016
Actual
New Mid-Term Plan
announced in
May 2019
Mid-Term Plan
announced in
May 2016
FY2018 FY2021 FY2021 FY2018 FY2021 FY2021
Chem 35.7 43.1 40.5 3.0 5.1 4.5
Performance M. 63.0 75.1 82.9 15.0 17.3 18.4
Agro 62.7 70.1 67.0 18.4 21.1 16.7
Pharma 7.0 7.5 8.3 1.0 0.7 2.4
Trading, Others, Adj 36.5 39.2 51.3 -0.3 -1.2 -2.0
Total 204.9 235.0 250.0 37.1 43.0 40.0
Sales Operating Profit
1. PL(¥billion)
(¥billion)
(1) Including inter-segment sales/transfers
2. Segment (1)
ActualNew
Mid-Term Plan
Total
FY2016-2018
Total
FY2019-2021(round number)
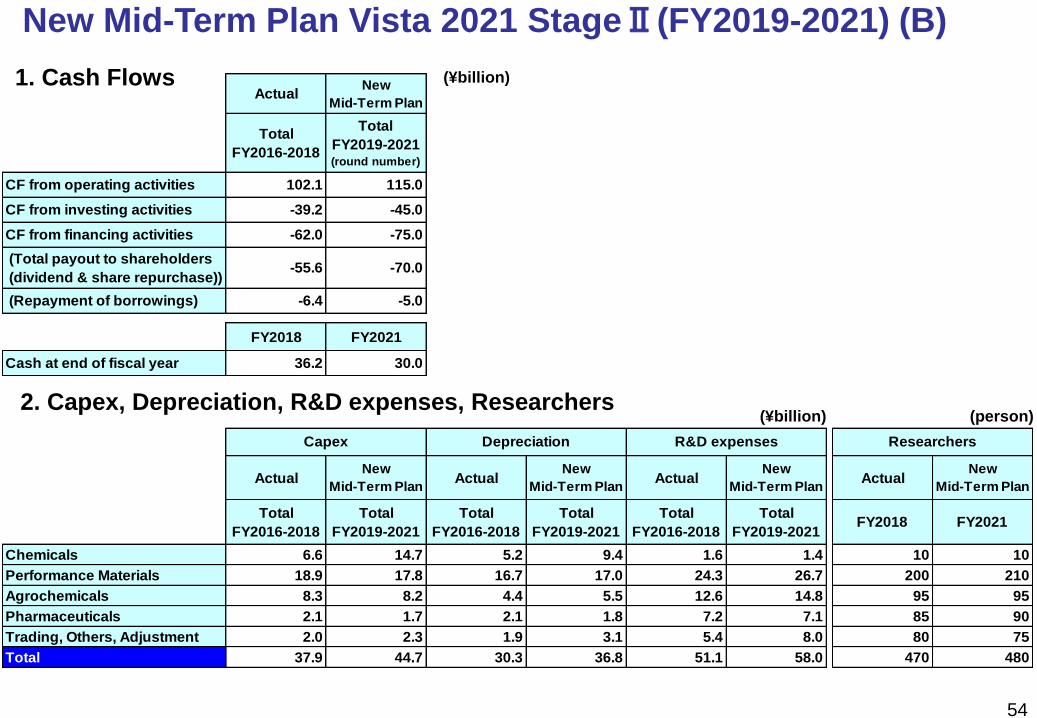
CF from operating activities 102.1 115.0
CF from investing activities -39.2 -45.0
CF from financing activities -62.0 -75.0
(Total payout to shareholders
(dividend & share repurchase))-55.6 -70.0
(Repayment of borrowings) -6.4 -5.0
FY2018 FY2021
Cash at end of fiscal year 36.2 30.0
ActualNew
Mid-Term PlanActual
New
Mid-Term PlanActual
New
Mid-Term PlanActual
New
Mid-Term Plan
Total
FY2016-2018
Total
FY2019-2021
Total
FY2016-2018
Total
FY2019-2021
Total
FY2016-2018
Total
FY2019-2021FY2018 FY2021
Chemicals 6.6 14.7 5.2 9.4 1.6 1.4 10 10
Performance Materials 18.9 17.8 16.7 17.0 24.3 26.7 200 210
Agrochemicals 8.3 8.2 4.4 5.5 12.6 14.8 95 95
Pharmaceuticals 2.1 1.7 2.1 1.8 7.2 7.1 85 90
Trading, Others, Adjustment 2.0 2.3 1.9 3.1 5.4 8.0 80 75
Total 37.9 44.7 30.3 36.8 51.1 58.0 470 480
Capex R&D expenses ResearchersDepreciation
54
1. Cash Flows
2. Capex, Depreciation, R&D expenses, Researchers
(¥billion)
New Mid-Term Plan Vista 2021 StageⅡ(FY2019-2021) (B)
(person)(¥billion)
ESG and Awards
55
◆April 2019
Established Nomination and Remuneration Advisory Committee as an optional advisory body
of the Board of Directors
◆June 2019
・Introduced a performance-linked stock compensation plan called a Board Benefit Trust
for members of the Board of Directors, etc.
・One Outside Director added
As a result, the Board of Directors consisting of 9 Directors include 3 Outside Directors
◆July 2019
NCC was selected for the first time as an inclusion in the MSCI Japan Empowering Woman
Index (WIN)
◆August 2019
NCC was selected as one of the 50 candidates of the Corporate Value Improvement Award hosted
by the Tokyo Stock Exchange for the second consecutive year. The Award targets all listed
companies in Japan (approximately 3,600 companies).
◆September 2019
・NCC was selected as an inclusion in the Dow Jones Sustainability Asia Pacific Index for the
second consecutive year
・Published “Integrated Reports 2019”
(English translation under preparation)

56
(Blank)
Nissan Chemical,
where unique & solution meet
15.717.3
21.7 20.8
24.8
17.419.2 19.8
15.5
19.5
22.2
25.3
28.6
31.4
35.037.1
10.010.7
12.812.0
14.6
10.9
12.8 12.9
10.4
12.713.6
14.816.2
17.4 18.1 18.1
0.0
10.0
20.0
0.0
10.0
20.0
30.0
40.0
2003 2004 2005 2006 2007 2008 2009 2010 2011 2012 2013 2014 2015 2016 2017 2018
Operating Profit (left axis) OP Margin (right axis)
(%)(¥billion)
57
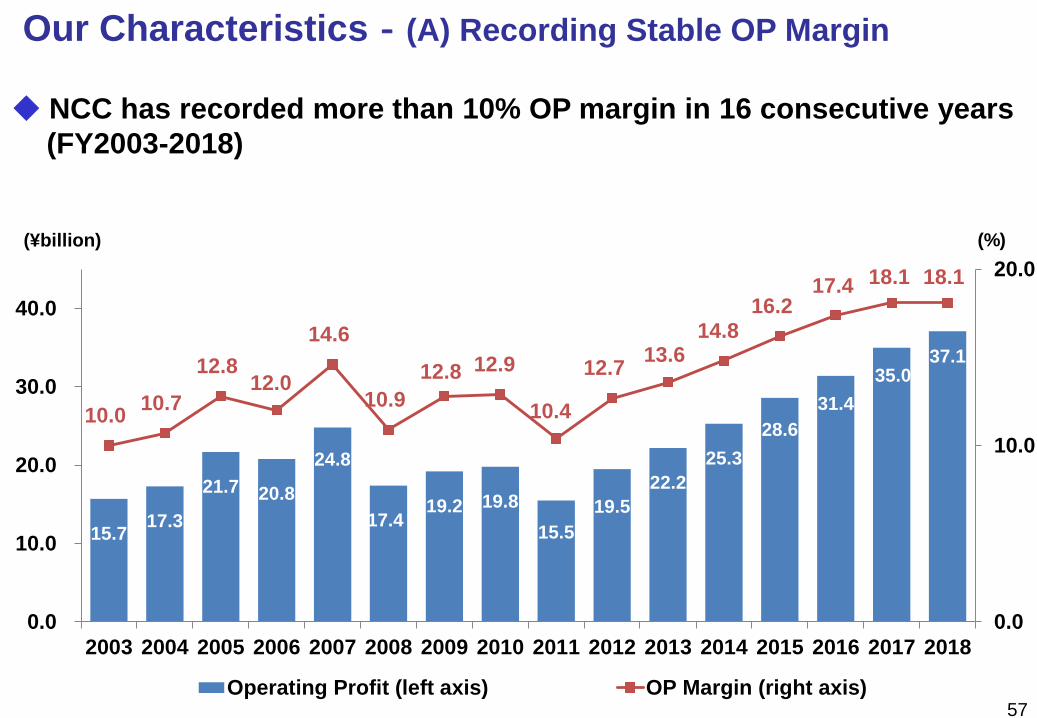
Our Characteristics‐(A) Recording Stable OP Margin
◆ NCC has recorded more than 10% OP margin in 16 consecutive years
(FY2003-2018)
14.0 15.5
10.1 12.8 13.0
11.0 13.9
16.7 18.2
22.4 24.0
27.1 29.4
30.6
14.7 15.6
10.3
12.6 11.9
9.5
11.4
12.7 12.7
14.6 15.116.1 16.6 16.8
0.0
10.0
20.0
0.0
10.0
20.0
30.0
40.0
2006 2007 2008 2009 2010 2011 2012 2013 2014 2015 2016 2017 2018 2019E
Net Income (left axis) ROE (right axis)
(%)
58
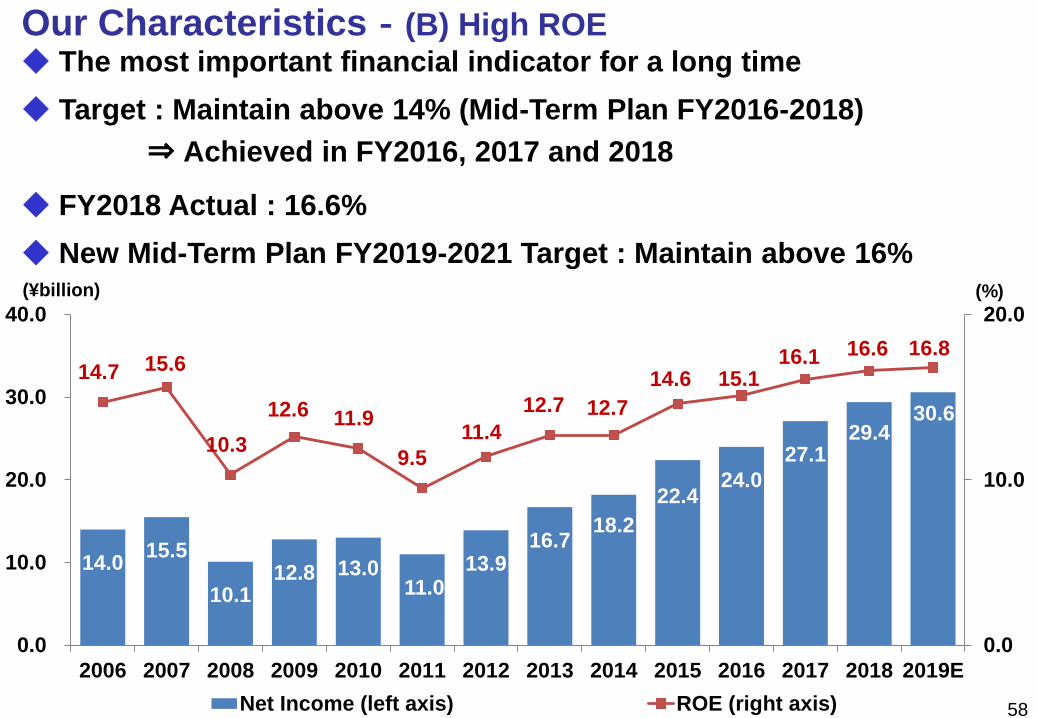
◆ The most important financial indicator for a long time
◆ Target : Maintain above 14% (Mid-Term Plan FY2016-2018)
⇒ Achieved in FY2016, 2017 and 2018
◆ FY2018 Actual : 16.6%
◆ New Mid-Term Plan FY2019-2021 Target : Maintain above 16%
Our Characteristics‐(B) High ROE
(¥billion)
59
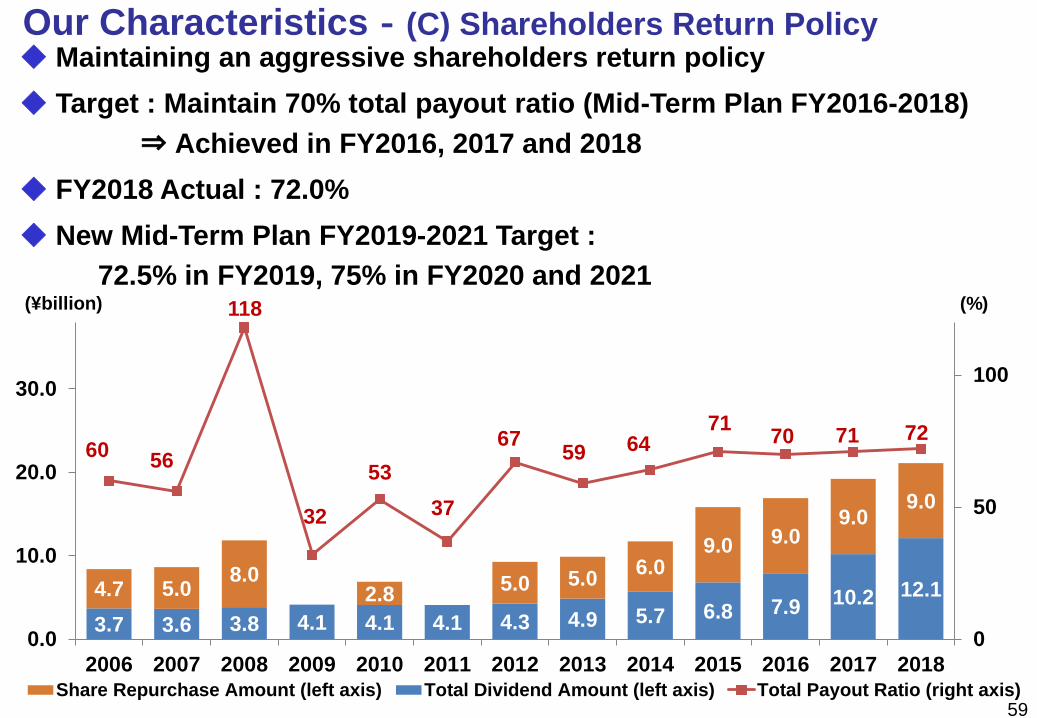
◆ Maintaining an aggressive shareholders return policy
◆ Target : Maintain 70% total payout ratio (Mid-Term Plan FY2016-2018)
⇒ Achieved in FY2016, 2017 and 2018
◆ FY2018 Actual : 72.0%
◆ New Mid-Term Plan FY2019-2021 Target :
72.5% in FY2019, 75% in FY2020 and 2021
Our Characteristics‐(C) Shareholders Return Policy
3.7 3.6 3.8 4.1 4.1 4.1 4.3 4.9 5.7 6.8 7.9 10.2 12.14.7 5.0 8.0
2.8 5.0 5.0
6.0 9.0 9.0
9.0 9.0
60 56
118
32
53
37
67 59 64
71 70 71 72
0
50
100
0.0
10.0
20.0
30.0
2006 2007 2008 2009 2010 2011 2012 2013 2014 2015 2016 2017 2018Share Repurchase Amount (left axis) Total Dividend Amount (left axis) Total Payout Ratio (right axis)
(%)(¥billion)
60
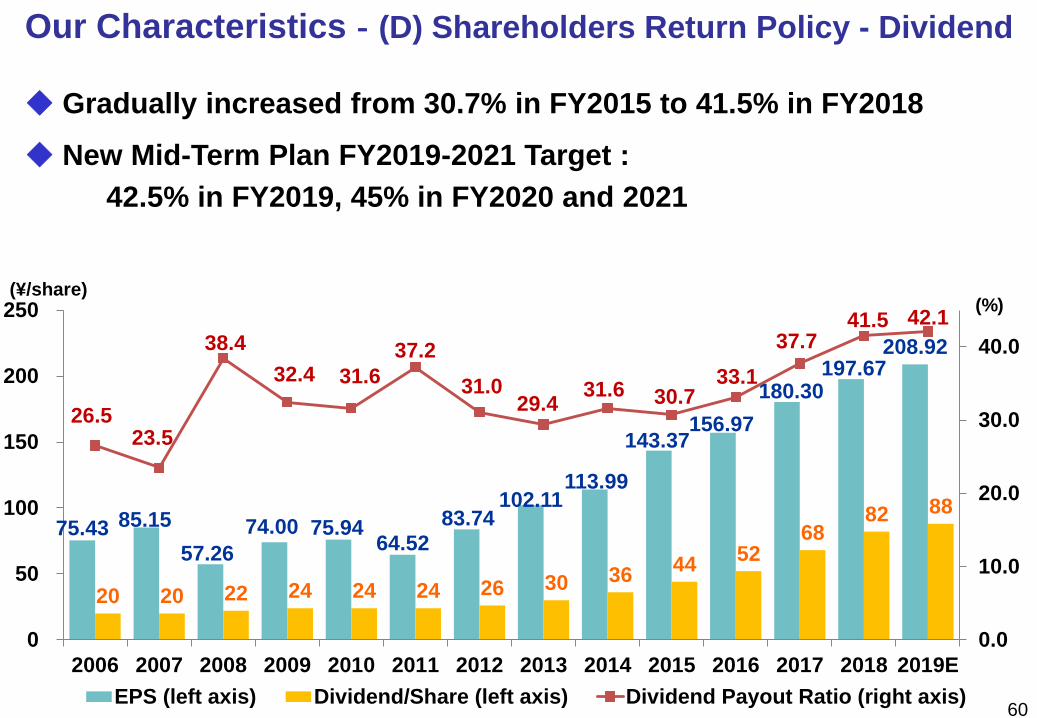
◆ Gradually increased from 30.7% in FY2015 to 41.5% in FY2018
◆ New Mid-Term Plan FY2019-2021 Target :
42.5% in FY2019, 45% in FY2020 and 2021
Our Characteristics‐(D) Shareholders Return Policy - Dividend
75.43 85.15
57.26
74.00 75.9464.52
83.74102.11
113.99
143.37156.97
180.30197.67
208.92
20 20 22 24 24 24 26 30 36 44
52 68
82 88
26.5 23.5
38.4
32.4 31.6
37.2
31.0 29.4
31.6 30.7 33.1
37.7 41.5 42.1
0.0
10.0
20.0
30.0
40.0
0
50
100
150
200
250
2006 2007 2008 2009 2010 2011 2012 2013 2014 2015 2016 2017 2018 2019E
EPS (left axis) Dividend/Share (left axis) Dividend Payout Ratio (right axis)
(¥/share)(%)

◆ Started share repurchase in 2006 only to enhance ROE
◆ Repurchased ¥72.5 billion, 38.8 million shares (20.7% of shares issued) in total from FY2006 to FY2018
◆ Cancelled all repurchased shares
Shareholders Return FY2006 - 2018
◆ Cash Management Policy
Aiming to control cash balance around the level of
= Minimum required level
+ 1/3 of annual scheduled long-term borrowings repayment
+ 1/3 of short-term borrowings outstanding + Contingent risk reserves61
Fiscal year 2006 2007 2008 2009 2010 2011 2012 2013 2014 2015 2016 2017 2018 Total
Shares purchased (thousand shares) 3,500 3,399 7,355 0 2,167 0 6,372 3,263 2,764 3,333 2,621 2,292 1,682 38,748
Purchase costs (\ billion) 4.7 5.0 8.0 0.0 2.8 0.0 5.0 5.0 6.0 9.0 9.0 9.0 9.0 72.5
Shares cancelled (thousand shares) 3,000 3,635 7,000 0 3,000 0 6,000 4,000 3,000 2,000 2,000 3,000 2,000 38,635
Shares issued at FY end (million shares) 185 181 174 174 171 171 165 161 158 156 154 151 149
Treasury shares at FY end (thousand shares) 1,367 1,233 1,660 1,709 885 886 1,258 522 287 1,621 2,242 1,535 1,218
Our Characteristics‐(E) Shareholders Return Policy - Share Repurchase
◆ Share repurchase program
Fiscal year 2019 Actual2019 Plan
as of Nov. 2019Fiscal year
Period of repurchaseMay 14, 2018
- June 8, 2018
Feb. 12, 2019
- March 4, 2019
May 16, 2019
- July 23, 2019
Nov. 11, 2019
- April 30, 2020Date of cancellation May 2019 August 2019
Total amount (¥billion) 5.0 4.0 6.0 up to 4.0
Total number of shares
repurchased
(thousand shares)
976 706 1,270 up to 1,300
2018 Actual 2019 Actual
Total number of shares
cancelled
(thousand shares)
1,0001,000
◆ Cancellation of treasury shares

62
(Blank)
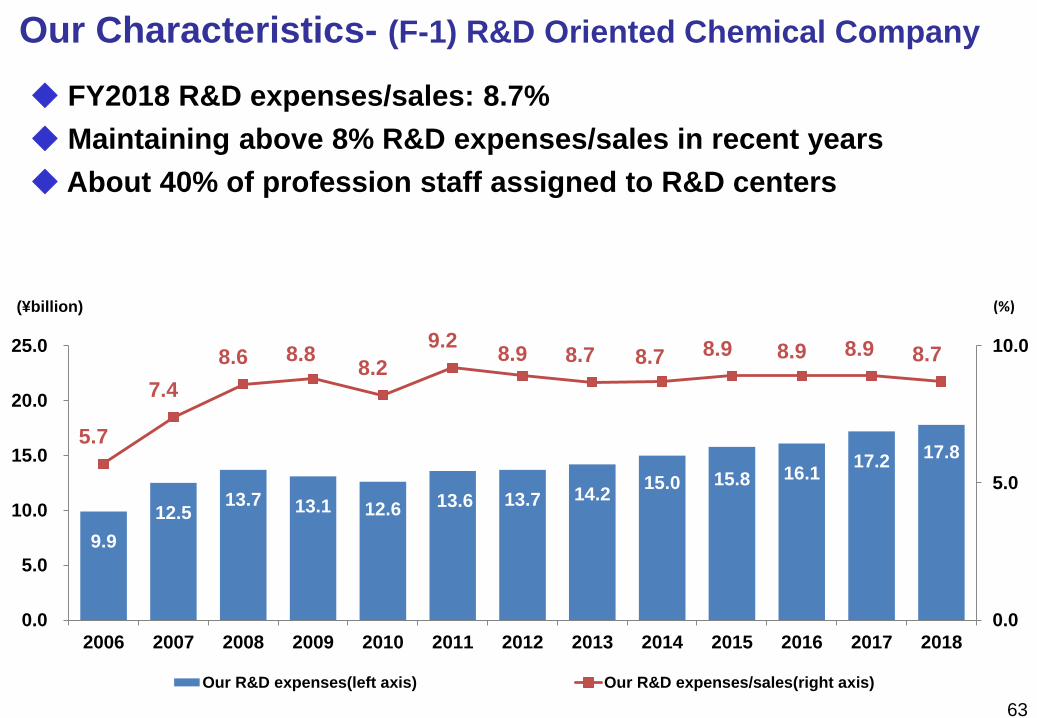
Our Characteristics- (F-1) R&D Oriented Chemical Company
63
9.9
12.5 13.7 13.1 12.6 13.6 13.7 14.2
15.0 15.8 16.1 17.2
17.8 5.7
7.4
8.6 8.88.2
9.28.9 8.7 8.7 8.9 8.9 8.9 8.7
0.0
5.0
10.0
0.0
5.0
10.0
15.0
20.0
25.0
2006 2007 2008 2009 2010 2011 2012 2013 2014 2015 2016 2017 2018
Our R&D expenses(left axis) Our R&D expenses/sales(right axis)
(¥billion) (%)
◆ FY2018 R&D expenses/sales: 8.7%
◆ Maintaining above 8% R&D expenses/sales in recent years
◆ About 40% of profession staff assigned to R&D centers
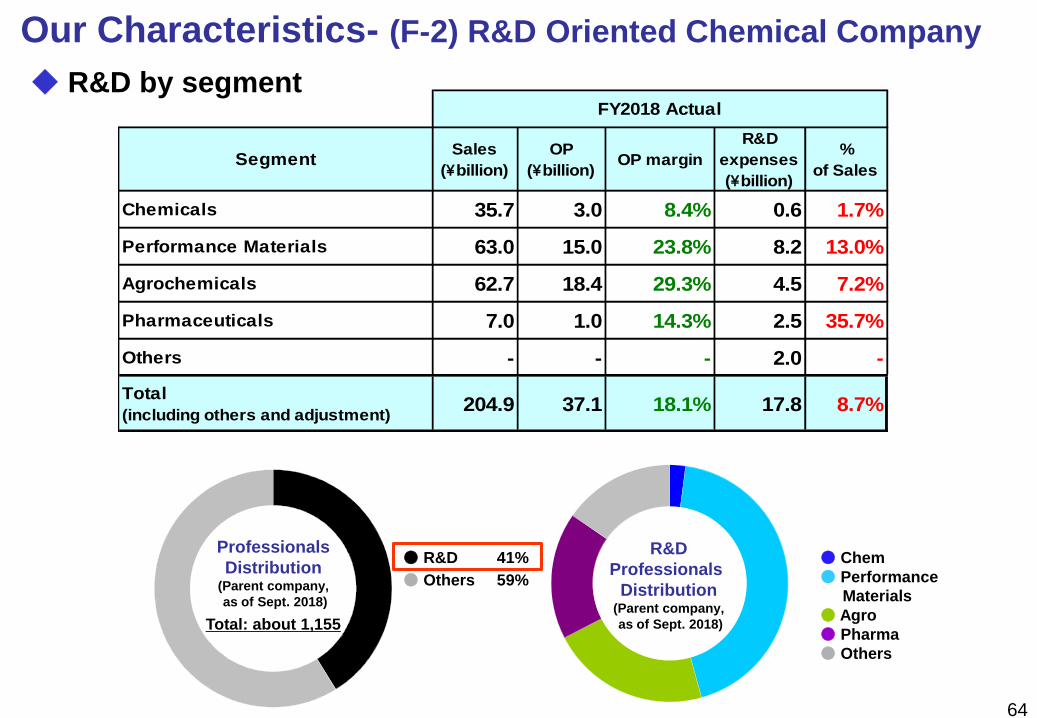
Our Characteristics- (F-2) R&D Oriented Chemical Company
SegmentSales
(\billion)
OP
(\billion)OP margin
R&D
expenses
(\billion)
%
of Sales
Chemicals 35.7 3.0 8.4% 0.6 1.7%
Performance Materials 63.0 15.0 23.8% 8.2 13.0%
Agrochemicals 62.7 18.4 29.3% 4.5 7.2%
Pharmaceuticals 7.0 1.0 14.3% 2.5 35.7%
Others - - - 2.0 -
Total
(including others and adjustment)204.9 37.1 18.1% 17.8 8.7%
FY2018 Actual
64
◆ R&D by segment
Professionals
Distribution(Parent company,
as of Sept. 2018)
Total: about 1,155
R&D
Professionals
Distribution(Parent company,
as of Sept. 2018)
● R&D 41%
● Others 59%
● Chem
● Performance
Materials
● Agro
● Pharma
● Others
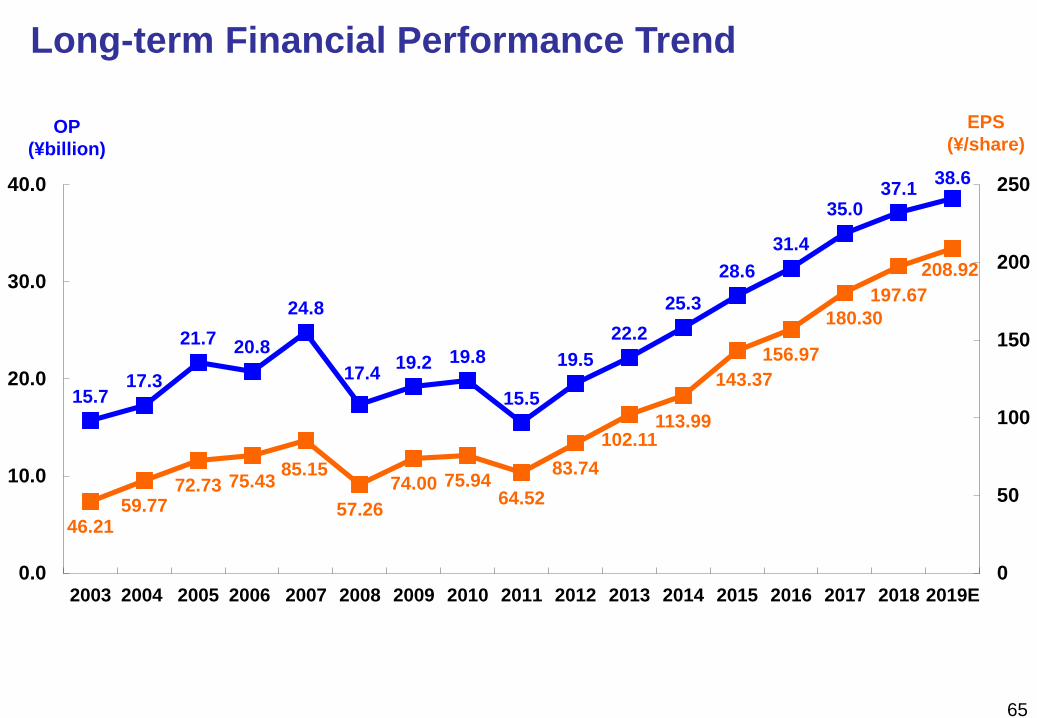
EPS
(¥/share)OP
(¥billion)
Long-term Financial Performance Trend
65
46.21 59.77
72.73 75.43 85.15
57.26
74.00 75.94 64.52
83.74
102.11 113.99
143.37
156.97
180.30
197.67
208.92
15.717.3
21.7 20.8
24.8
17.419.2 19.8
15.5
19.5
22.2
25.3
28.6
31.4
35.037.1
38.6
0.0
10.0
20.0
30.0
40.0
2003 2004 2005 2006 2007 2008 2009 2010 2011 2012 2013 2014 2015 2016 2017 2018 2019E0
50
100
150
200
250
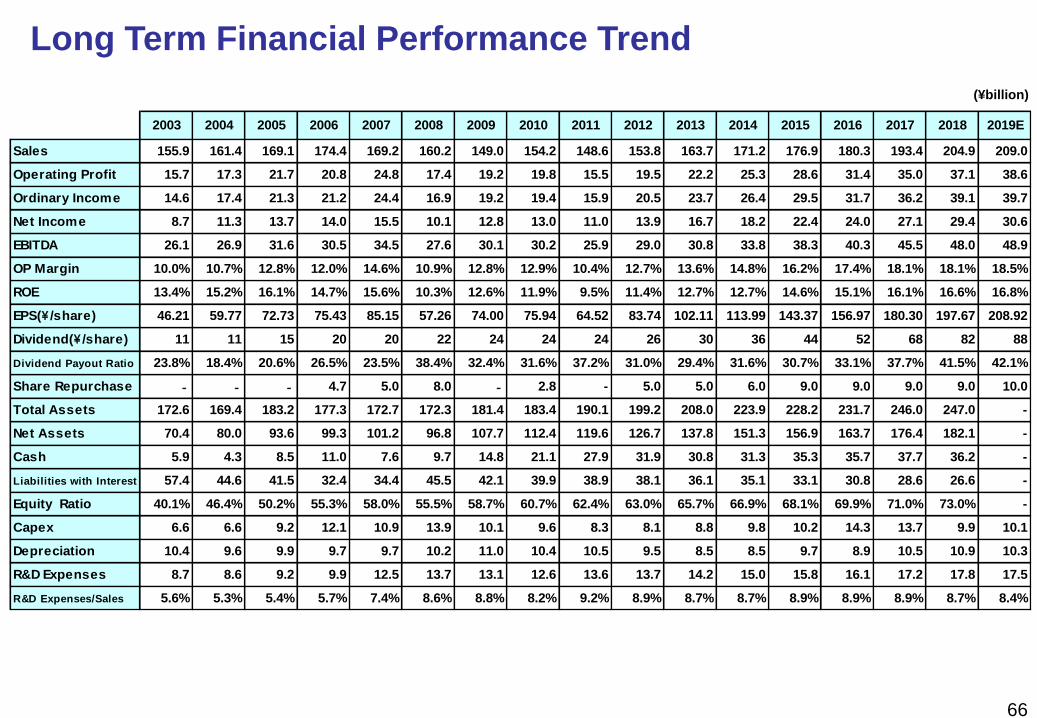
Long Term Financial Performance Trend
(¥billion)
66
2003 2004 2005 2006 2007 2008 2009 2010 2011 2012 2013 2014 2015 2016 2017 2018 2019E
Sales 155.9 161.4 169.1 174.4 169.2 160.2 149.0 154.2 148.6 153.8 163.7 171.2 176.9 180.3 193.4 204.9 209.0
Operating Profit 15.7 17.3 21.7 20.8 24.8 17.4 19.2 19.8 15.5 19.5 22.2 25.3 28.6 31.4 35.0 37.1 38.6
Ordinary Income 14.6 17.4 21.3 21.2 24.4 16.9 19.2 19.4 15.9 20.5 23.7 26.4 29.5 31.7 36.2 39.1 39.7
Net Income 8.7 11.3 13.7 14.0 15.5 10.1 12.8 13.0 11.0 13.9 16.7 18.2 22.4 24.0 27.1 29.4 30.6
EBITDA 26.1 26.9 31.6 30.5 34.5 27.6 30.1 30.2 25.9 29.0 30.8 33.8 38.3 40.3 45.5 48.0 48.9
OP Margin 10.0% 10.7% 12.8% 12.0% 14.6% 10.9% 12.8% 12.9% 10.4% 12.7% 13.6% 14.8% 16.2% 17.4% 18.1% 18.1% 18.5%
ROE 13.4% 15.2% 16.1% 14.7% 15.6% 10.3% 12.6% 11.9% 9.5% 11.4% 12.7% 12.7% 14.6% 15.1% 16.1% 16.6% 16.8%
EPS(\ /share) 46.21 59.77 72.73 75.43 85.15 57.26 74.00 75.94 64.52 83.74 102.11 113.99 143.37 156.97 180.30 197.67 208.92
Dividend(\ /share) 11 11 15 20 20 22 24 24 24 26 30 36 44 52 68 82 88
Dividend Payout Ratio 23.8% 18.4% 20.6% 26.5% 23.5% 38.4% 32.4% 31.6% 37.2% 31.0% 29.4% 31.6% 30.7% 33.1% 37.7% 41.5% 42.1%
Share Repurchase ‐ ‐ ‐ 4.7 5.0 8.0 ‐ 2.8 - 5.0 5.0 6.0 9.0 9.0 9.0 9.0 10.0
Total Assets 172.6 169.4 183.2 177.3 172.7 172.3 181.4 183.4 190.1 199.2 208.0 223.9 228.2 231.7 246.0 247.0 -
Net Assets 70.4 80.0 93.6 99.3 101.2 96.8 107.7 112.4 119.6 126.7 137.8 151.3 156.9 163.7 176.4 182.1 -
Cash 5.9 4.3 8.5 11.0 7.6 9.7 14.8 21.1 27.9 31.9 30.8 31.3 35.3 35.7 37.7 36.2 -
Liabilities with Interest 57.4 44.6 41.5 32.4 34.4 45.5 42.1 39.9 38.9 38.1 36.1 35.1 33.1 30.8 28.6 26.6 -
Equity Ratio 40.1% 46.4% 50.2% 55.3% 58.0% 55.5% 58.7% 60.7% 62.4% 63.0% 65.7% 66.9% 68.1% 69.9% 71.0% 73.0% -
Capex 6.6 6.6 9.2 12.1 10.9 13.9 10.1 9.6 8.3 8.1 8.8 9.8 10.2 14.3 13.7 9.9 10.1
Depreciation 10.4 9.6 9.9 9.7 9.7 10.2 11.0 10.4 10.5 9.5 8.5 8.5 9.7 8.9 10.5 10.9 10.3
R&D Expenses 8.7 8.6 9.2 9.9 12.5 13.7 13.1 12.6 13.6 13.7 14.2 15.0 15.8 16.1 17.2 17.8 17.5
R&D Expenses/Sales 5.6% 5.3% 5.4% 5.7% 7.4% 8.6% 8.8% 8.2% 9.2% 8.9% 8.7% 8.7% 8.9% 8.9% 8.9% 8.7% 8.4%
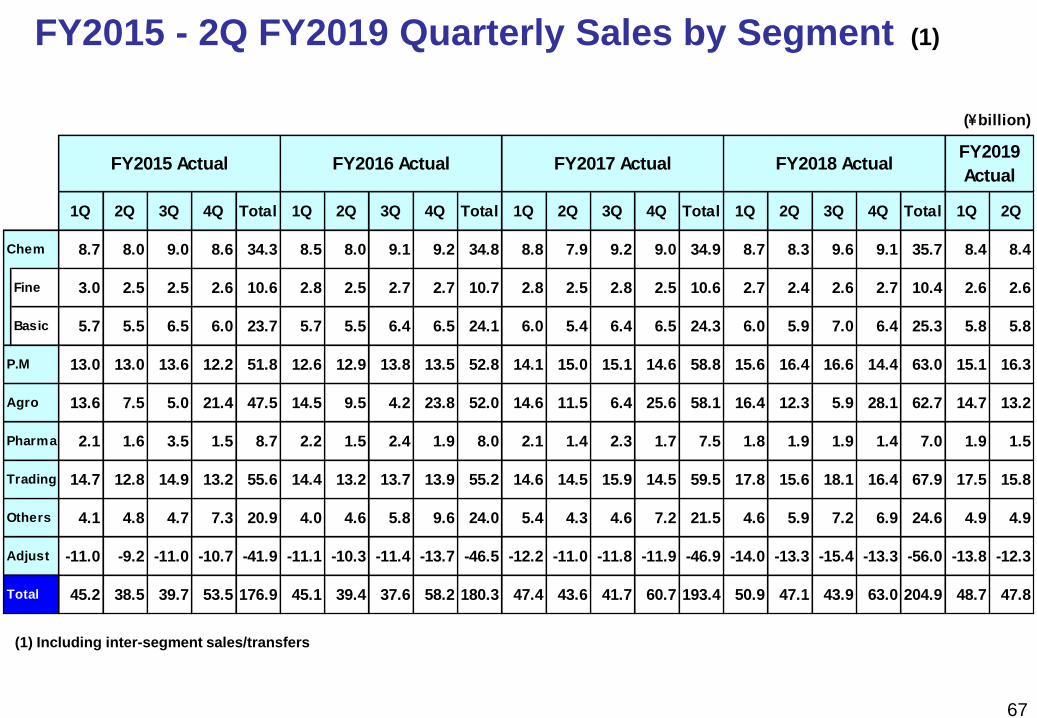
67
FY2015 - 2Q FY2019 Quarterly Sales by Segment (1)
(\billion)
1Q 2Q 3Q 4Q Total 1Q 2Q 3Q 4Q Total 1Q 2Q 3Q 4Q Total 1Q 2Q 3Q 4Q Total 1Q 2Q
Chem 8.7 8.0 9.0 8.6 34.3 8.5 8.0 9.1 9.2 34.8 8.8 7.9 9.2 9.0 34.9 8.7 8.3 9.6 9.1 35.7 8.4 8.4
Fine 3.0 2.5 2.5 2.6 10.6 2.8 2.5 2.7 2.7 10.7 2.8 2.5 2.8 2.5 10.6 2.7 2.4 2.6 2.7 10.4 2.6 2.6
Basic 5.7 5.5 6.5 6.0 23.7 5.7 5.5 6.4 6.5 24.1 6.0 5.4 6.4 6.5 24.3 6.0 5.9 7.0 6.4 25.3 5.8 5.8
13.0 13.0 13.6 12.2 51.8 12.6 12.9 13.8 13.5 52.8 14.1 15.0 15.1 14.6 58.8 15.6 16.4 16.6 14.4 63.0 15.1 16.3
Agro 13.6 7.5 5.0 21.4 47.5 14.5 9.5 4.2 23.8 52.0 14.6 11.5 6.4 25.6 58.1 16.4 12.3 5.9 28.1 62.7 14.7 13.2
Pharma 2.1 1.6 3.5 1.5 8.7 2.2 1.5 2.4 1.9 8.0 2.1 1.4 2.3 1.7 7.5 1.8 1.9 1.9 1.4 7.0 1.9 1.5
Trading 14.7 12.8 14.9 13.2 55.6 14.4 13.2 13.7 13.9 55.2 14.6 14.5 15.9 14.5 59.5 17.8 15.6 18.1 16.4 67.9 17.5 15.8
Others 4.1 4.8 4.7 7.3 20.9 4.0 4.6 5.8 9.6 24.0 5.4 4.3 4.6 7.2 21.5 4.6 5.9 7.2 6.9 24.6 4.9 4.9
Adjust -11.0 -9.2 -11.0 -10.7 -41.9 -11.1 -10.3 -11.4 -13.7 -46.5 -12.2 -11.0 -11.8 -11.9 -46.9 -14.0 -13.3 -15.4 -13.3 -56.0 -13.8 -12.3
45.2 38.5 39.7 53.5 176.9 45.1 39.4 37.6 58.2 180.3 47.4 43.6 41.7 60.7 193.4 50.9 47.1 43.9 63.0 204.9 48.7 47.8
FY2019
ActualFY2018 ActualFY2017 ActualFY2016 Actual
Total
P.M
FY2015 Actual
(1) Including inter-segment sales/transfers
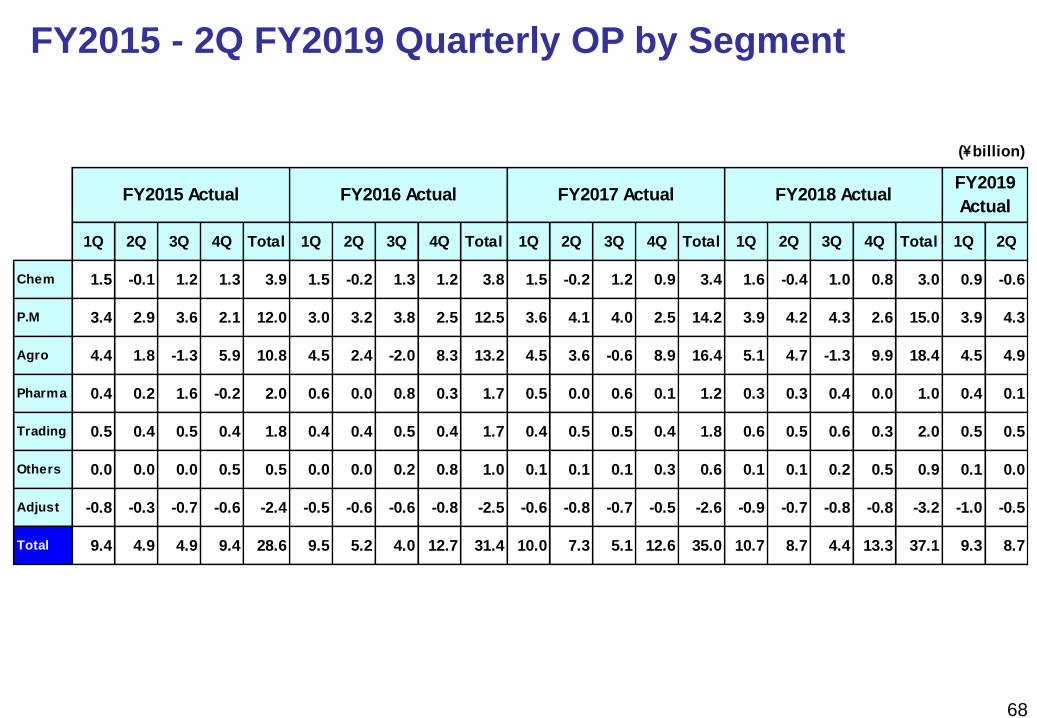
68
FY2015 - 2Q FY2019 Quarterly OP by Segment
(\billion)
1Q 2Q 3Q 4Q Total 1Q 2Q 3Q 4Q Total 1Q 2Q 3Q 4Q Total 1Q 2Q 3Q 4Q Total 1Q 2Q
Chem 1.5 -0.1 1.2 1.3 3.9 1.5 -0.2 1.3 1.2 3.8 1.5 -0.2 1.2 0.9 3.4 1.6 -0.4 1.0 0.8 3.0 0.9 -0.6
3.4 2.9 3.6 2.1 12.0 3.0 3.2 3.8 2.5 12.5 3.6 4.1 4.0 2.5 14.2 3.9 4.2 4.3 2.6 15.0 3.9 4.3
Agro 4.4 1.8 -1.3 5.9 10.8 4.5 2.4 -2.0 8.3 13.2 4.5 3.6 -0.6 8.9 16.4 5.1 4.7 -1.3 9.9 18.4 4.5 4.9
Pharma 0.4 0.2 1.6 -0.2 2.0 0.6 0.0 0.8 0.3 1.7 0.5 0.0 0.6 0.1 1.2 0.3 0.3 0.4 0.0 1.0 0.4 0.1
Trading 0.5 0.4 0.5 0.4 1.8 0.4 0.4 0.5 0.4 1.7 0.4 0.5 0.5 0.4 1.8 0.6 0.5 0.6 0.3 2.0 0.5 0.5
Others 0.0 0.0 0.0 0.5 0.5 0.0 0.0 0.2 0.8 1.0 0.1 0.1 0.1 0.3 0.6 0.1 0.1 0.2 0.5 0.9 0.1 0.0
Adjust -0.8 -0.3 -0.7 -0.6 -2.4 -0.5 -0.6 -0.6 -0.8 -2.5 -0.6 -0.8 -0.7 -0.5 -2.6 -0.9 -0.7 -0.8 -0.8 -3.2 -1.0 -0.5
9.4 4.9 4.9 9.4 28.6 9.5 5.2 4.0 12.7 31.4 10.0 7.3 5.1 12.6 35.0 10.7 8.7 4.4 13.3 37.1 9.3 8.7
FY2019
ActualFY2018 Actual
Total
FY2015 Actual FY2017 ActualFY2016 Actual
P.M
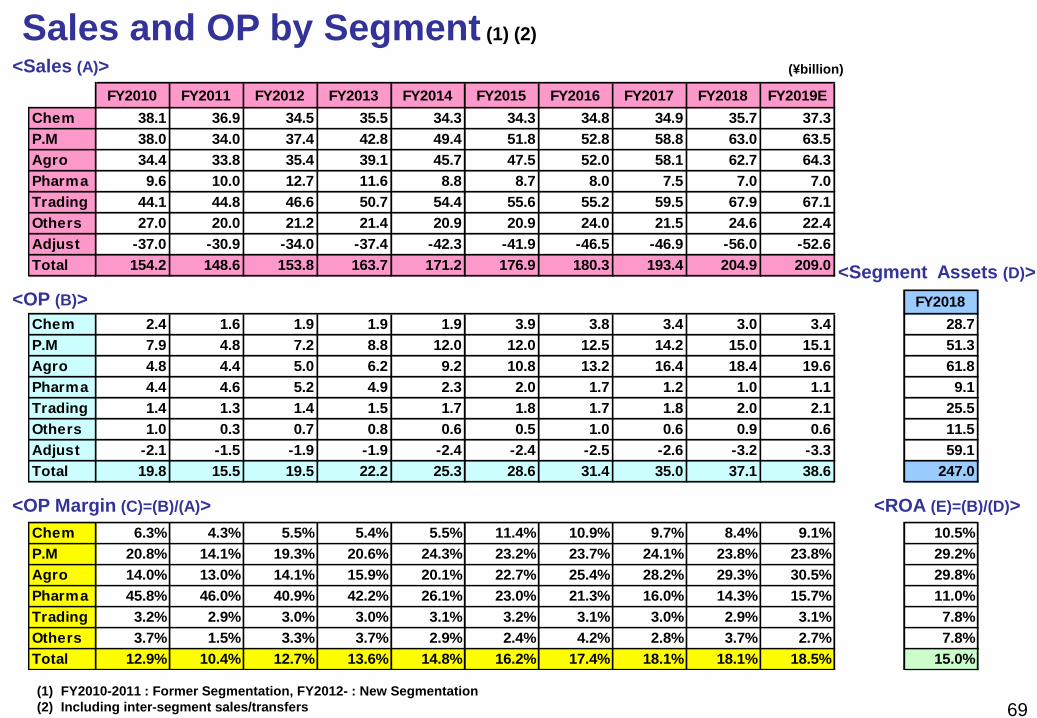
69
FY2010 FY2011 FY2012 FY2013 FY2014 FY2015 FY2016 FY2017 FY2018 FY2019E
Chem 38.1 36.9 34.5 35.5 34.3 34.3 34.8 34.9 35.7 37.3
P.M 38.0 34.0 37.4 42.8 49.4 51.8 52.8 58.8 63.0 63.5
Agro 34.4 33.8 35.4 39.1 45.7 47.5 52.0 58.1 62.7 64.3
Pharma 9.6 10.0 12.7 11.6 8.8 8.7 8.0 7.5 7.0 7.0
Trading 44.1 44.8 46.6 50.7 54.4 55.6 55.2 59.5 67.9 67.1
Others 27.0 20.0 21.2 21.4 20.9 20.9 24.0 21.5 24.6 22.4
Adjust -37.0 -30.9 -34.0 -37.4 -42.3 -41.9 -46.5 -46.9 -56.0 -52.6
Total 154.2 148.6 153.8 163.7 171.2 176.9 180.3 193.4 204.9 209.0
FY2018
Chem 2.4 1.6 1.9 1.9 1.9 3.9 3.8 3.4 3.0 3.4 28.7
P.M 7.9 4.8 7.2 8.8 12.0 12.0 12.5 14.2 15.0 15.1 51.3
Agro 4.8 4.4 5.0 6.2 9.2 10.8 13.2 16.4 18.4 19.6 61.8
Pharma 4.4 4.6 5.2 4.9 2.3 2.0 1.7 1.2 1.0 1.1 9.1
Trading 1.4 1.3 1.4 1.5 1.7 1.8 1.7 1.8 2.0 2.1 25.5
Others 1.0 0.3 0.7 0.8 0.6 0.5 1.0 0.6 0.9 0.6 11.5
Adjust -2.1 -1.5 -1.9 -1.9 -2.4 -2.4 -2.5 -2.6 -3.2 -3.3 59.1
Total 19.8 15.5 19.5 22.2 25.3 28.6 31.4 35.0 37.1 38.6 247.0
Chem 6.3% 4.3% 5.5% 5.4% 5.5% 11.4% 10.9% 9.7% 8.4% 9.1% 10.5%
P.M 20.8% 14.1% 19.3% 20.6% 24.3% 23.2% 23.7% 24.1% 23.8% 23.8% 29.2%
Agro 14.0% 13.0% 14.1% 15.9% 20.1% 22.7% 25.4% 28.2% 29.3% 30.5% 29.8%
Pharma 45.8% 46.0% 40.9% 42.2% 26.1% 23.0% 21.3% 16.0% 14.3% 15.7% 11.0%
Trading 3.2% 2.9% 3.0% 3.0% 3.1% 3.2% 3.1% 3.0% 2.9% 3.1% 7.8%
Others 3.7% 1.5% 3.3% 3.7% 2.9% 2.4% 4.2% 2.8% 3.7% 2.7% 7.8%
Total 12.9% 10.4% 12.7% 13.6% 14.8% 16.2% 17.4% 18.1% 18.1% 18.5% 15.0%
(1) FY2010-2011 : Former Segmentation, FY2012- : New Segmentation
(2) Including inter-segment sales/transfers
Sales and OP by Segment (1) (2)
(¥billion)<Sales (A)>
<OP (B)>
<OP Margin (C)=(B)/(A)>
<Segment Assets (D)>
<ROA (E)=(B)/(D)>
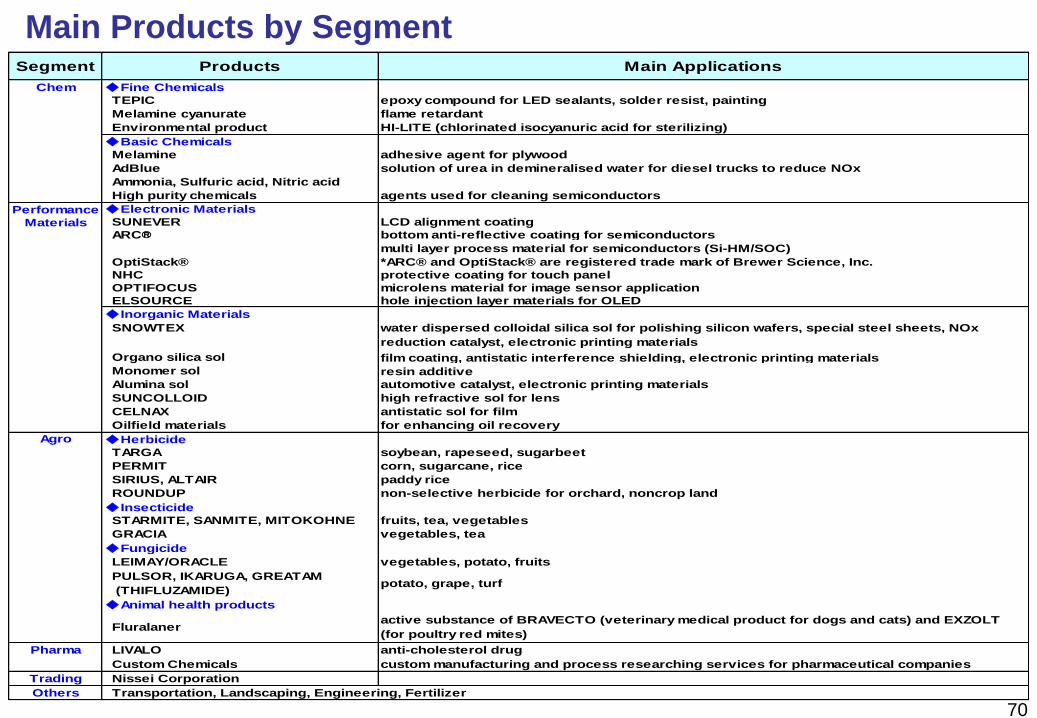
Segment Products Main Applications
Chem ◆Fine Chemicals
TEPIC epoxy compound for LED sealants, solder resist, painting
Melamine cyanurate flame retardant
Environmental product HI-LITE (chlorinated isocyanuric acid for sterilizing)
◆Basic Chemicals
Melamine adhesive agent for plywood
AdBlue solution of urea in demineralised water for diesel trucks to reduce NOx
Ammonia, Sulfuric acid, Nitric acid
High purity chemicals agents used for cleaning semiconductors
Performance ◆Electronic Materials
Materials SUNEVER LCD alignment coating
ARC® bottom anti-reflective coating for semiconductors
multi layer process material for semiconductors (Si-HM/SOC)
OptiStack® *ARC® and OptiStack® are registered trade mark of Brewer Science, Inc.
NHC protective coating for touch panel
OPTIFOCUS microlens material for image sensor application
ELSOURCE hole injection layer materials for OLED
◆Inorganic Materials
SNOWTEX water dispersed colloidal silica sol for polishing silicon wafers, special steel sheets, NOx
reduction catalyst, electronic printing materials
Organo silica sol film coating, antistatic interference shielding, electronic printing materials
Monomer sol resin additive
Alumina sol automotive catalyst, electronic printing materials
SUNCOLLOID high refractive sol for lens
CELNAX antistatic sol for film
Oilfield materials for enhancing oil recovery
Agro ◆Herbicide
TARGA soybean, rapeseed, sugarbeet
PERMIT corn, sugarcane, rice
SIRIUS, ALTAIR paddy rice
ROUNDUP non-selective herbicide for orchard, noncrop land
◆Insecticide
STARMITE, SANMITE, MITOKOHNE fruits, tea, vegetables
GRACIA vegetables, tea
◆Fungicide
LEIMAY/ORACLE vegetables, potato, fruits
PULSOR, IKARUGA, GREATAM
(THIFLUZAMIDE)potato, grape, turf
◆Animal health products
Fluralaneractive substance of BRAVECTO (veterinary medical product for dogs and cats) and EXZOLT
(for poultry red mites)
Pharma LIVALO anti-cholesterol drug
Custom Chemicals custom manufacturing and process researching services for pharmaceutical companies
Trading Nissei Corporation
Others Transportation, Landscaping, Engineering, Fertilizer
Main Products by Segment
70
Nissan Chemical,
where unique & solution meet
Forward Looking Statements
The forward looking statements in this material are based on information
available at the time of preparation of the material. Although they reflect our
current expectations, these statements are not guarantees of future
performance, but include a number of risks and uncertainties. Actual results
may largely differ from these statements due to various factors which may be
beyond company control.
No information in this material is provided as an offer to buy or sell the shares
of the company. We urge users of the material to make investment decision
based upon own judgment.