Embed Size (px)
Citation preview

© 2
017 C
RIS
IL L
td.
All
rig
hts
reserv
ed.
Presentation 3: Assessment of non conventional energy sourcesin SAARC Member States
SAARC Dissemination Workshop for the Study on "SAARC
Energy Outlook 2030"
Presenter: CRISIL Research

© 2
017 C
RIS
IL L
td.
All
rig
hts
reserv
ed.
2
Energy Profile of SMS – Review : How non conventional energy stack up
Country Total Primary
Energy in 2012/
FY13 (MTOE)
Conventional and
non conventional
energy mix (2012/
FY13)
Total Primary
Energy in 2017/
FY18 (MTOE)
Conventional and
non conventional
energy mix (2017/
FY18)
Major non
conventional
energy sources
Afghanistan 5.7 4.3 Biomass
Bangladesh 25.7 37.5 Hydro
Bhutan 0.6 0.7 Hydro, biomass
India 651.2 816.8 Solar, hydro
Maldives 0.4 0.5 Solar, wind
Nepal 10.0 13.5 Hydro
Pakistan 57.7 74.6 Hydro
Sri Lanka 9.6 11.4 Biomass, hydro
Non conventional includes solar, wind, hydro, biomass

© 2
017 C
RIS
IL L
td.
All
rig
hts
reserv
ed.
3
Afghanistan : Non-Conventional Energy (1/2)
• The country has developed more than 5,000 mini- and micro-hydro plants that feed power to mini-grids located in
areas that are not yet connected to the national grid, thereby creating an islanding system
• Most of the micro- and mini-hydro projects are installed on irrigation canals, where the villagers divert water to the
plant for generating electricity at night. This power has been very important to local people and communities who
had to rely on kerosene lamps for lighting
• Major large hydro projects in the country include Naghlu HPP (100 MW), Mahipar HPP (66 MW), Salma HPP (42
MW), Sarobi HPP (22 MW) and Darunta HPP (11.2 MW).
Hydro
• There is no significant installed solar capacities in the country. Major upcoming solar plants are: 1. Kabul (10
MW) (FY19) 2. Nagarhar (100 MW) (FY20) 3. Kandahar Phase 1 (10 MW) (FY20) 4. Daikundi (10 MW) (FY21)
5. Baghdara (240 MW) (FY22) 6. Saruni-II (180 MW) (FY23) 7. Kandahar Phase 2 (20 MW) (FY25)
• Several off-grid solar projects providing power to schools, shops, communities that are currently not grid
connected are expected to come up
Solar
~ 1,000 MW
~580 MW
Outlook
(FY30)Present (FY18)
<10 MW
~200 MW

© 2
017 C
RIS
IL L
td.
All
rig
hts
reserv
ed.
4
Afghanistan : Non-Conventional Energy (2/2)
• Biomass is being used extensively in Afghanistan for heating homes and cooking purposes. With electricity
eluding the majority of the country’s population, biomass usage in the rural areas is widespread
• The primary resources available are crop residue, animal manure, firewood, and municipal waste. According
to the Afghanistan Living Conditions Survey (ALCS), 74% of all households and 90% of rural households
relied on biomass as their primary fuel for cooking, while 82% of households and 90% of rural households
used it as their primary source of heat.
• Per capita biomass consumption has reduced marginally from 14.51 KTOE in fiscal 2013 to 13.9 KTOE in
fiscal 2018 (provisional). However, dependence on biomass continues to be strong and comprises ~10% of
the total primary energy consumption in the country (as of fiscal 2018)
Wind
Biomass
• Currently there is no major wind turbine generation in operation in Afghanistan. Only the Pandshir small wind
farm which operates ten wind turbines of 10 kW each is presently operational
Outlook
(FY18-FY30)
~100 MW
~425 KTOE~392 KTOE
Present (FY18)
<10 MW
Outlook on Non Conventional Energy Sources
470
875
1056
FY18P FY24E FY30E
KTOE

© 2
017 C
RIS
IL L
td.
All
rig
hts
reserv
ed.
5
Bangladesh : Non-Conventional Energy (1/2)
• There is just one hydro power plant in the country, Karnafuli Hydro, with an installed capacity of 230 MW (2x40
MW+3x50 MW). Hydropower generated in fiscal 2018 was 982 MU, a meagre 1.6% of total power production
• The governments of Bangladesh, Bhutan and India have signed an MoU for constructing 1,125 MW Dorjilung
hydro project with prospects of future exports of power from Bhutan to India and Bangladesh. However, the
project has not received much traction and there is uncertainty over commencement of commercial production
• Bangladesh has no plans to set up hydropower projects owing to high capital expenditure. With the country
already reeling under incessant floods and change in rainfall patterns, it does not intend to build new dams for
power projects
Hydro
• There is no significant installed solar capacities in the country. The government is not planning any large scale
solar projects. Major upcoming solar plants are: 1. Solar Park on BOO basis at Teknaf, Cox's Bazar (200 MW) 2.
Solar Park at Dharmapasha, Sunamganj (32 MW) 3. Solar Park at Sutiakhali (50 MW) 4. Solar PV Power Project
at Shekhgach (50 MW) 5. Solar PV Power Project at Sundarganj (200 MW) 6. Grid Tied Solar PV Power Project
at Bora Durgapur, Mongla (100 MW)
• The BPDB has installed solar systems of 270 kWh in its offices with another 500 kWh in the pipeline. Eight cities
are installing solar street lights and solar charging stations are being set up in Sylhet and Chittagong
Solar
~230 MW
~850 MW
Outlook
(FY18-FY30)Present (FY18)
<10 MW
~230 MW

© 2
017 C
RIS
IL L
td.
All
rig
hts
reserv
ed.
6
Bangladesh : Non-Conventional Energy (2/2)
• There is no significant usage of biomass of biogas in the country.
• Biogas can be used for home cooking fuel, especially in rural areas where increasing LPG prices may see
some shift from gas to this affordable and clean energy. However, consumers are unlikely to shift in large
numbers as gas prices are expected to be subsidised for low income households.
Wind
Biomass
• Several companies, including Vestas have been conducting Wind Resource Assessments (WRA) at several
sites to assess wind velocities and prospective power production possibilities. The mapping is being
conducted in coastal zones, onshore and inland areas, such as Inani Beach of Cox’s Bazar, Sitakunda and
Anwara of Chittagong, Khepupara of Patuakhali, Morelganj of Bagerhat, Chandpur, and Rajshahi
• Letters of Intent have been given to two projects (a) 60MW wind turbine power plant in Cox’s Bazar (b)
100MW wind-based power plant in Anwara. However, implementation was delayed and progress is slow.
Going forward, ~250-300 MW of wind plants is expected to come up by 2030
Outlook
(FY18-FY30)
~300 MW
<10 MW
Present (FY18)
<10 MW
<10 MW
Outlook on Non Conventional Energy Sources
81.8 81.8 81.8
FY18P FY24E FY30E
KTOE

© 2
017 C
RIS
IL L
td.
All
rig
hts
reserv
ed.
7
Bhutan : Non-Conventional Energy (1/2)
• Hydro power projects constituted ~99% share of Bhutan’s total installed power capacity in 2017
• Going forward, with the commissioning of hydro power plants, the share of hydro power in the overall primary
energy consumption in Bhutan is expected to reach 36% by 2030 from 26% in 2017
• Bhutan is expected to add 3,658 MW of hydro power generating stations by 2030. Besides new hydro capacities,
solar and wind power installed capacities are expected to reach 5 MW each by 2025, as per the target of the
Alternative Renewable Policy 2013. Major hydel plants expected to come up include: 1. Mangdechhu Hydro
Project (720 MW) 2. Nikachhu Hyropower Project (118 MW) 3. PunatsangchhuI I and II Hydropower Project
(2,200 MW) 4. Kholongchhu Hydropower Project (600 MW)
Hydro
• There are no major solar installations in the country.
• As per targets set by Alternative Renewable Policy 2013 and based on realistic estimates, solar installed
capacities are expected to reach 5 MW by 2030
Solar
5.3 GW
~5 MW
Outlook
(2030)Present (2017)
<1 MW
1.6 GW
Wind • There are no major wind installations in the country
• As per targets set by Alternative Renewable Policy 2013 and based on realistic estimates, wind installed
capacities are expected to reach 5 MW by 2030
~5 MW<1 MW

© 2
017 C
RIS
IL L
td.
All
rig
hts
reserv
ed.
8
Bhutan : Non-Conventional Energy (2/2)
• Biomass, mostly in the form of fuel wood, is mainly consumed for heating and cooking purpose by the
building sector, which comprises residential, commercial and institutional segments
• The industrial sector also consumes a small amount of biomass (1-2%) for heating applications.
• The building sector derived ~82% of its energy demand in 2017 from biomass. Overall consumption of
biomass rose at ~0.6% CAGR from 2014 till 2017(E). Per capita consumption of biomass (mostly fuel wood)
in Bhutan was ~0.8 tons in 2017(E) and contributed ~33% of the total energy consumption of Bhutan in 2017
• Overall consumption of biomass is expected to increase at a marginal ~0.64% CAGR over 2017(E) -2030 to
reach 259 KTOE. With the shift towards cleaner fuel, biomass share in overall fuel-wise primary energy
consumption of Bhutan is also expected to decline from ~33% in 2017(E) to ~17% by 2030
• Decline in biomass share is also critical from the perspective of maintaining a minimum of 60% of total land
cover under forest. However, the low biomass consumption trend is subject to increase in electricity supply
from new hydro power projects.
Biomass 259 KTOE
Present (2017)
239 KTOE
Outlook
(2030)
427518
824
2017 2023E 2030E
KTOE
Outlook on Non Conventional Energy Sources

© 2
017 C
RIS
IL L
td.
All
rig
hts
reserv
ed.
9
India : Non-Conventional Energy (1/2)
• As of fiscal 2018, only 45 GW of hydro projects have been set up in the country, contributing ~13% of the power
generation mix
• Several problems like replacement and rehabilitation (R&R) issues, land acquisition problems, clearance and
approval procedures, and capability of developers have been hindering development. Hydropower projects are
capital intensive with long payback periods. This makes developers wary of investing
• Additional ~34 GW of additional hydro projects are expected to come up by fiscal 2030. The government is
striving to stem investor confidence by creating a conducive environment and removing impediments through
sound policy formulation.
Hydro
~79 GW
Outlook
(FY30)Present (FY18)
45 GW
Wind • As of fiscal 2018, wind power constituted ~10% of the total installed power generation capacity in India and
49% share in renewable energy capacities (69 GW). Wind power is estimated to have accounted for about 4.3%
of the country's total power generated in fiscal 2018
• India is expected to see capacity additions of ~70 GW over the next 12 years (fiscals 2018-2030s) driven by
rising participation of the central government (SECI) and other relatively stronger off-takers like PTC
• Going forward, no significant wind capacity additions are expected due to mountainous terrain and technological
challenges
107 GW34 GW

© 2
017 C
RIS
IL L
td.
All
rig
hts
reserv
ed.
10
India : Non-Conventional Energy (2/2)
• As of fiscal 2018, the total installed capacity for biomass ((bagasse cogeneration power) based power was ~8
GW.
• The country intends to achieve 40% of power installed capacity from non-fossil fuel (wind power, solar,
hydropower, biomass, waste to energy and nuclear power) by 2030 as per its INDC commitments. Going by
current capacity addition trends, India is expected to reach its goal by as early as 2020
Biomass ~12 GW
Present (FY18)
8 GW
Outlook
(FY30)
Outlook on Non Conventional Energy Sources
19
37
57
FY18 FY24E FY30E
MTOE
• India had an installed solar capacity of ~22 GW as of fiscal 2018. Annual capacity additions rose to 9,363 MW in
fiscal 2018 compared with 5,526 MW in fiscal 2017 with Karnataka and Telangana leading the pack
• It is expected that India will see robust solar capacity additions of ~60 GW over fiscals 2019-2023 and ~70 GW
over fiscal 2024-2030
Solar150.1 GW21.7 GW

© 2
017 C
RIS
IL L
td.
All
rig
hts
reserv
ed.
11
Pakistan : Non-Conventional Energy (1/2)
• As of fiscal 2018, Pakistan has an estimated installed capacity of 9,500 MW of large hydro projects, of which over
95% is owned by WAPDA, while the remainder is owned and operated by IPPs.
• However, on the generation front, power production has been reducing from 2016, due to the lack of water
availability and diversion of water from large reservoir-based power plants towards irrigation
• Major hydro projects under operation include: 1. Tarbela (3,478 MW) 2. Ghazi Barotha (1,450 MW) 3. Mangla
(1,000 MW) 4. Warsak (243 MW) 5. Chashma (184 MW)
• WAPDA and private concessionaires have a healthy lineup of hydel projects, which are under construction or
awaiting clearance. More than 12,500 MW of hydro projects are expected to be set up by fiscal 2030. However,
the share of large hydro projects in the power generation mix in fiscal 2030 is seen at 28%, in line with fiscal 2018
levels of 26%
Hydro
• The sector is taking off following the completion of 400 MW of solar PV projects in 2015-2016. Meanwhile, 24
additional letters of intent issued by AEDB, amounting to a total installed capacity of 556.5 MW, are at an
advanced stage of completion
• Based on LOA or LOI signed, upcoming installations, the country is expected to add ~2.4 GW between fiscals
2018 and 2030
Solar
12.8 GW
~3,100 MW
Outlook
(FY30)Present (FY18)
~650 MW
9.5 GW
Biomass • Four sugar mills had bagasse power generation units with a combined installed capacity of 145.1 MW. In
addition, 216.4 MW of capacity are close to completion, with plants expected to start operation by 2018
• Furthermore, owing to extensive agricultural activity and a well-established sugar-refining industry, large amounts
of agricultural residues can also be used for energy purpose
~200 MW 2,570 MW

© 2
017 C
RIS
IL L
td.
All
rig
hts
reserv
ed.
12
Pakistan : Non-Conventional Energy (2/2)
• To date, all of Pakistan’s wind power development has been in the Gharo-Keti Bandar corridor in the south of
the country which has a theoretical potential of around 50 GW of wind energy. This corridor combines good
wind resources with relative proximity to load centres and national grid connectivity
• AEDB has issued 35 letters of intent for wind power projects, with a cumulative capacity of 1, 747.5 MW. A
further five projects with a cumulative capacity of 297.6 MW had achieved financial closure and were in various
stages of construction, aiming to start up on a commercial basis by 2020
• The Sindh provincial government is actively trying to maximise wind power. Through the Sindh Energy
Department, it has issued 23 letters of intent for wind power projects with a combined capacity of 1 710 MW
• Based on LOA or LOI signed and upcoming installations, the country is expected to add ~2.9 GW between
fiscals 2018 and 2030
Wind 3,650 MW
Present (FY18)
800 MW
Outlook
(FY30)
Outlook on Non Conventional Energy Sources
2.84.5
5.9
FY18P FY24E FY30E
MTOE

© 2
017 C
RIS
IL L
td.
All
rig
hts
reserv
ed.
13
Sri Lanka : Non-Conventional Energy (1/2)
• Hydropower was the major source of power for Sri Lanka in the past owing to the abundance of water resources
in the country. Presently, it produces one-third of the total power demand
• Major hydro plants include: 1. Kotmale (201 MW) 2. Victoria (210 MW) 3. Upper Kotmale (150 MW) 4.
Samanalawewa (120 MW) 5. Kukule (70 MW) 6. Randenigala (122 MW)
• As per estimates, an additional 300-500 MW of major hydro plants are expected to come up by 2030. However,
hydro power generation would reduce from 33% of the power mix in 2017 to 21% in 2030
• Major upcoming hydro plants include: 1. Uma Oya (122 MW) 2. Broadlands (35 MW) 3. Moragolla (30 MW) 4.
Seethawaka (20 MW)
Hydro
• There are no major solar installations in the country.
• Based on targets set up by renewable energy targets, LOI/ LOA issued and realistic estimates, solar installed
capacities are expected to reach ~750-800 MW by 2030
Solar
2.3 GW
~780 MW
Outlook
(2030)Present (2017)
~20 MW
~1.8 GW
Wind • There are no major wind installations in the country
• Based on targets set up by renewable energy targets, LOI/ LOA issued and realistic estimates, wind installed
capacities are expected to reach ~750 MW by 2030
~750 MW~130 MW

© 2
017 C
RIS
IL L
td.
All
rig
hts
reserv
ed.
14
Sri Lanka : Non-Conventional Energy (2/2)
• Sri Lanka consumed ~12 million tonne of biofuel in 2017. The biggest consumers of biofuel are the
household and commercial segment followed by the industrial segment
• Biomass-based energy production is being promoted in the country in association with the UNDP. Agriculture
and industrial waste power plants are being set up in line with LTGEP targets to increase RE generation.
• Going forward, industrial biomass usage is expected to rise. The industrialised districts of Colombo,
Gampaha and Kalutara are the major consumers of biomass and fuel wood for thermal energy.
• With increasing fossil fuel prices, more than 350 industrial biomass energy conversion systems (BECS) have
been operationalised. BECS are primarily used to provide industrial services such as steam, hot water, hot
thermic oil, and electric power. Most BECS have been using woodlogs and multifuels as feedstock.
• Feasibility studies are also underway to set up municipal waste-to-energy plants and wood gasification
technology is being developed for thermal energy applications
Biofuel 3.7 MTOE
Present (2017)
4.5 MTOE
Outlook
(2030)
Outlook on Non Conventional Energy Sources
5.0
4.64.5
2017 2023E 2030E
MTOE
© 2
017 C
RIS
IL L
td.
All
rig
hts
reserv
ed.
15
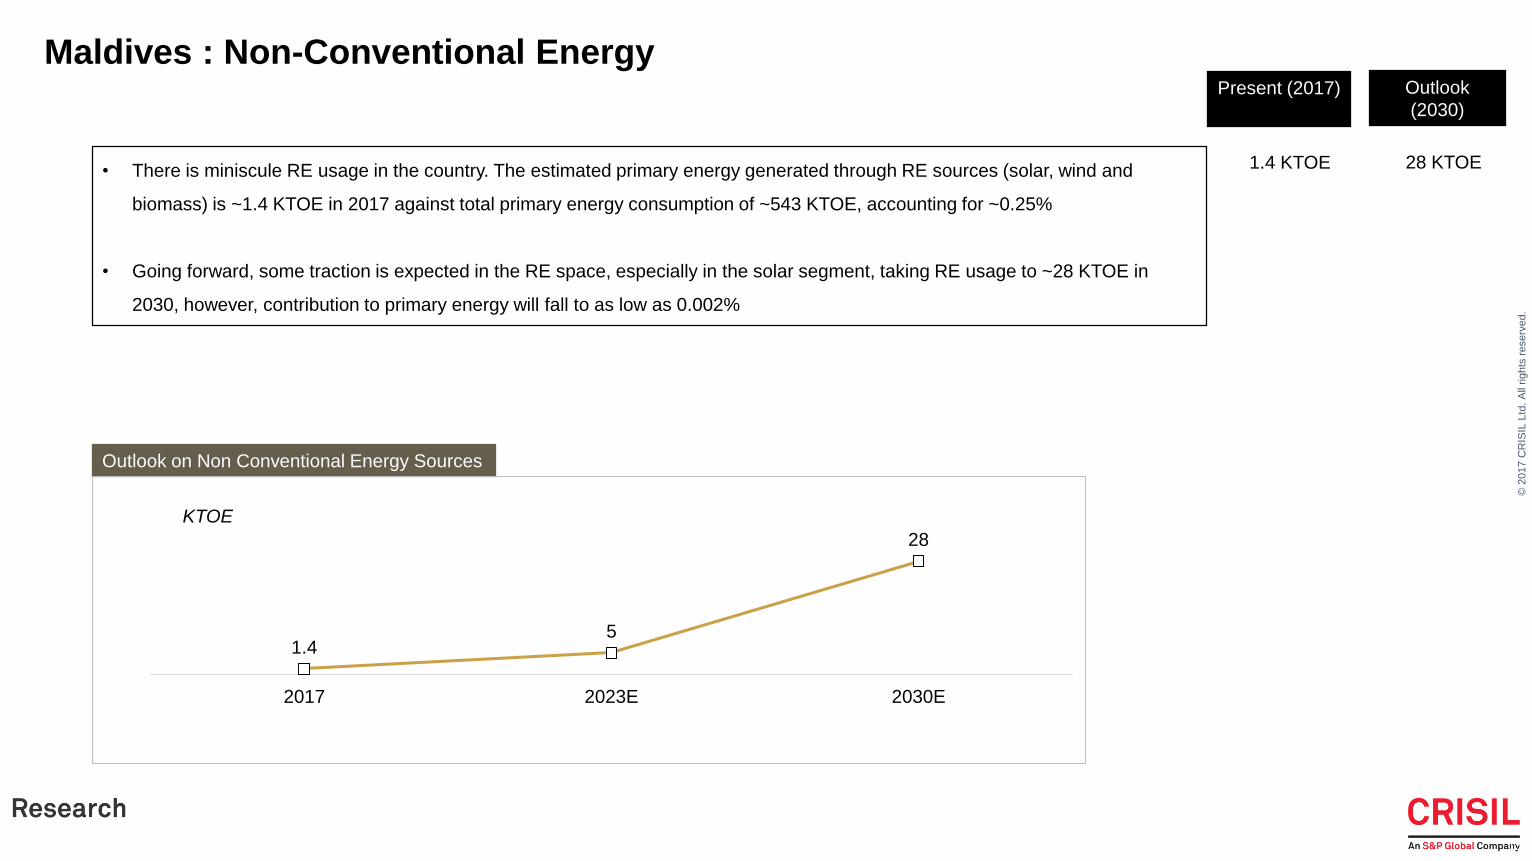
Maldives : Non-Conventional Energy
28 KTOE
Outlook
(2030)Present (2017)
1.4 KTOE• There is miniscule RE usage in the country. The estimated primary energy generated through RE sources (solar, wind and
biomass) is ~1.4 KTOE in 2017 against total primary energy consumption of ~543 KTOE, accounting for ~0.25%
• Going forward, some traction is expected in the RE space, especially in the solar segment, taking RE usage to ~28 KTOE in
2030, however, contribution to primary energy will fall to as low as 0.002%
Outlook on Non Conventional Energy Sources
1.45
28
2017 2023E 2030E
KTOE

© 2
017 C
RIS
IL L
td.
All
rig
hts
reserv
ed.
16
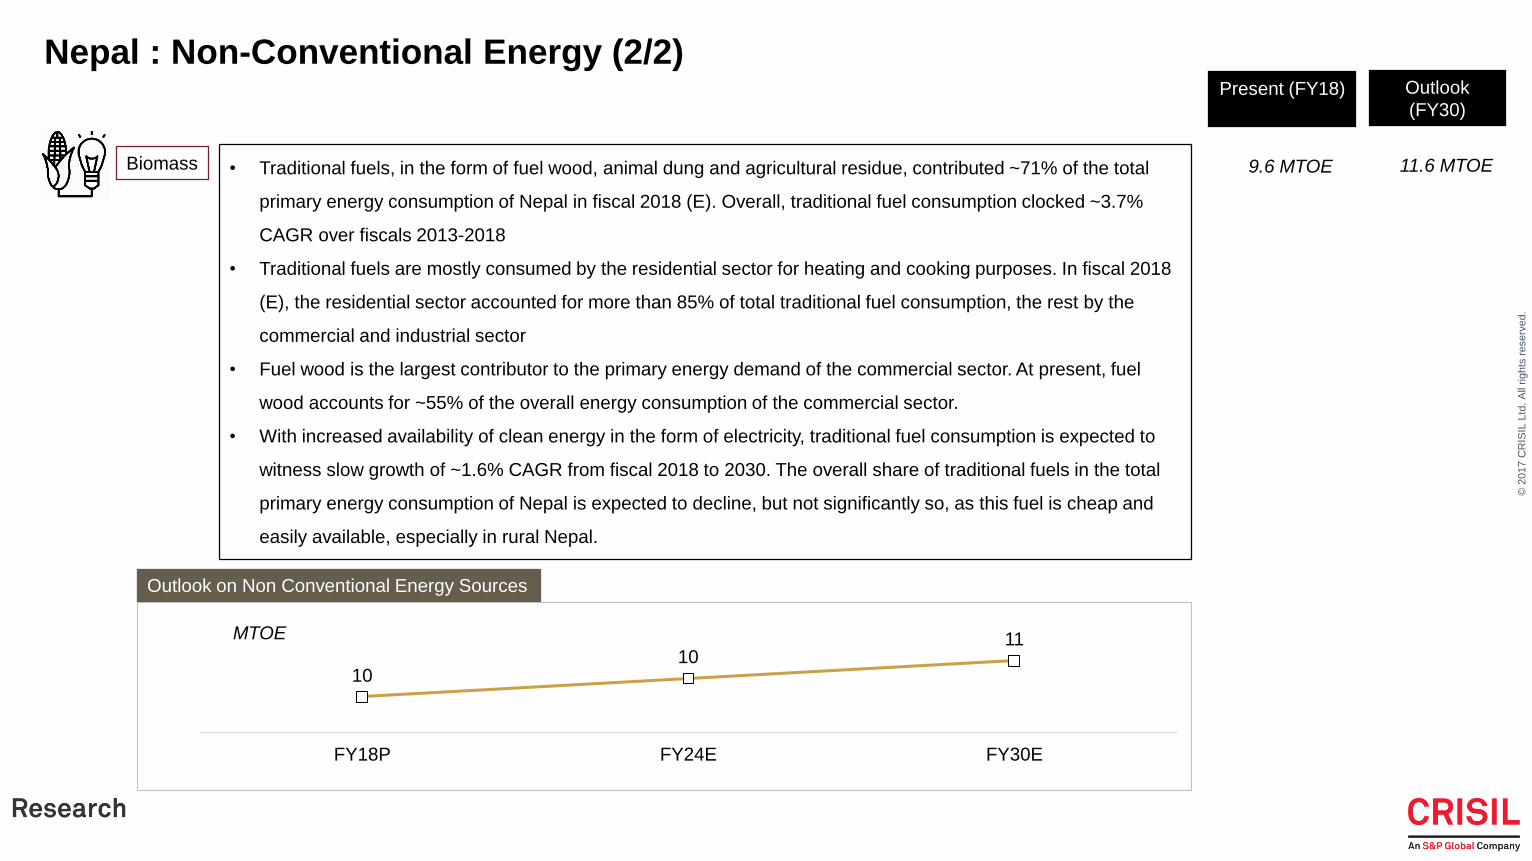
Nepal : Non-Conventional Energy (1/2)
• Power generation from hydropower plants accounted for ~99.9% of total power generation in fiscal 2018.
• Hydro power plants are expected to remain a significant contributor to power generation, with ~96% share in the total
installed capacity. About 3,256 MW of new hydro capacity is expected to be commissioned by Nepal by fiscal 2030.
• Going forward, with the commissioning of the new hydropower capacity, the share of hydro energy in the overall primary
energy consumption of the country is expected to grow from ~2% in fiscal 2018 to ~6% by fiscal 2030.
Hydro
• There are no major solar installations in the country.
• Based on targets set up by renewable energy targets, LOI/ LOA issued and realistic estimates, solar installed
capacities are expected to reach ~125 MW by 2030
Solar
~4,300 MW
~125 MW
Outlook
(FY30)Present (FY18)
<10 MW
~1,020 MW
Wind • There are no major wind installations in the country
• Going forward, no significant wind capacity additions are expected due to mountainous terrain and technological
challenges
<10 MW<10 MW
© 2
017 C
RIS
IL L
td.
All
rig
hts
reserv
ed.
17
Nepal : Non-Conventional Energy (2/2)
• Traditional fuels, in the form of fuel wood, animal dung and agricultural residue, contributed ~71% of the total
primary energy consumption of Nepal in fiscal 2018 (E). Overall, traditional fuel consumption clocked ~3.7%
CAGR over fiscals 2013-2018
• Traditional fuels are mostly consumed by the residential sector for heating and cooking purposes. In fiscal 2018
(E), the residential sector accounted for more than 85% of total traditional fuel consumption, the rest by the
commercial and industrial sector
• Fuel wood is the largest contributor to the primary energy demand of the commercial sector. At present, fuel
wood accounts for ~55% of the overall energy consumption of the commercial sector.
• With increased availability of clean energy in the form of electricity, traditional fuel consumption is expected to
witness slow growth of ~1.6% CAGR from fiscal 2018 to 2030. The overall share of traditional fuels in the total
primary energy consumption of Nepal is expected to decline, but not significantly so, as this fuel is cheap and
easily available, especially in rural Nepal.
Biomass 11.6 MTOE
Present (FY18)
9.6 MTOE
Outlook
(FY30)
Outlook on Non Conventional Energy Sources
1010
11
FY18P FY24E FY30E
MTOE

© 2
017 C
RIS
IL L
td.
All
rig
hts
reserv
ed.
18
Energy Profile of SMS – Outlook: No significant growth in non-conventional energy
Country
Total Primary
Energy in FY18/
2017 (MTOE)
Total Non-
Conventional
Energy (FY 18/
2017) (MTOE)
Total Primary
Energy in FY30/
2030 (MTOE)
Total Non-
Conventional
Energy (FY 30/
2030) (MTOE)
Growth in primary
energy vis-à-vis
non-conventional
energy
Afghanistan 4.3 0.5 9.3 6.6% 1.1 7.0%
Bangladesh 37.5 0.1 85.3 7.1% 0.1 0.0%
Bhutan 0.7 0.4 1.5 6.0% 0.8 5.2%
India 816.8 19.0 1,391.3 4.5% 56.9 9.6%
Maldives 0.5 0.0 1.2 5.7% 0.03 25.8%
Nepal 13.5 10.1 21.2 3.8% 13.2 2.2%
Pakistan 74.6 2.8 147.3 5.8% 5.9 6.5%
Sri Lanka 11.4 4.9 16.2 2.7% 4.5 -0.8%
• Growth in Total PE: 4.75% on-year; growth in total NCE: 6.72% on-year
• Scenario in 2030: PE-> 1,673 MTOE, NCE: 83 MTOE

© 2
017 C
RIS
IL L
td.
All
rig
hts
reserv
ed.
Thank You