Embed Size (px)
Citation preview
An Investigation of Chinese and American Foreign Direct Investment in Africa
Ryan Nabil (2015)
Ways to Serve a Foreign Market
● Export: produce goods in home market and ship to foreign market
● License: produce goods in foreign market using a foreign firm
● Foreign Direct Investment (FDI): produce in foreign market by buying majority shares of a company or creating a new company
What is FDI?
● Essentially, FDI is a “controlling ownership in a business enterprise in one country.”
● Own at least 10% of outstanding stocks
● Foreign Direct Investment vs Portfolio Investment
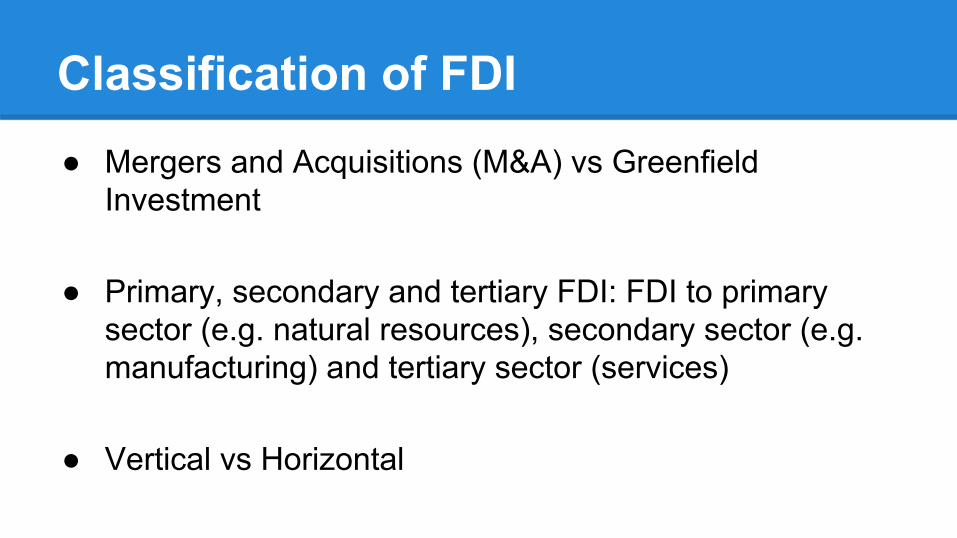
Classification of FDI ● Mergers and Acquisitions (M&A) vs Greenfield
Investment
● Primary, secondary and tertiary FDI: FDI to primary sector (e.g. natural resources), secondary sector (e.g. manufacturing) and tertiary sector (services)
● Vertical vs Horizontal
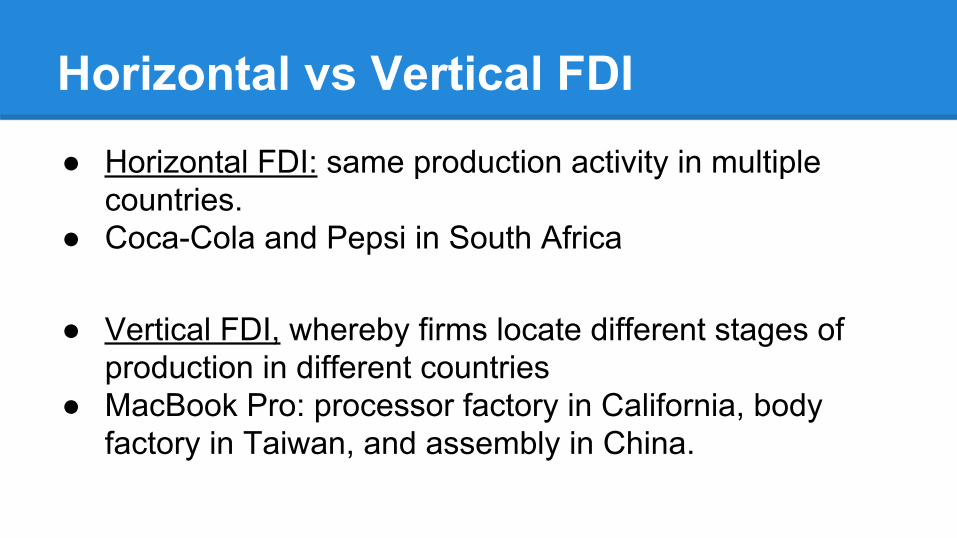
Horizontal vs Vertical FDI● Horizontal FDI: same production activity in multiple
countries.● Coca-Cola and Pepsi in South Africa
● Vertical FDI, whereby firms locate different stages of production in different countries
● MacBook Pro: processor factory in California, body factory in Taiwan, and assembly in China.
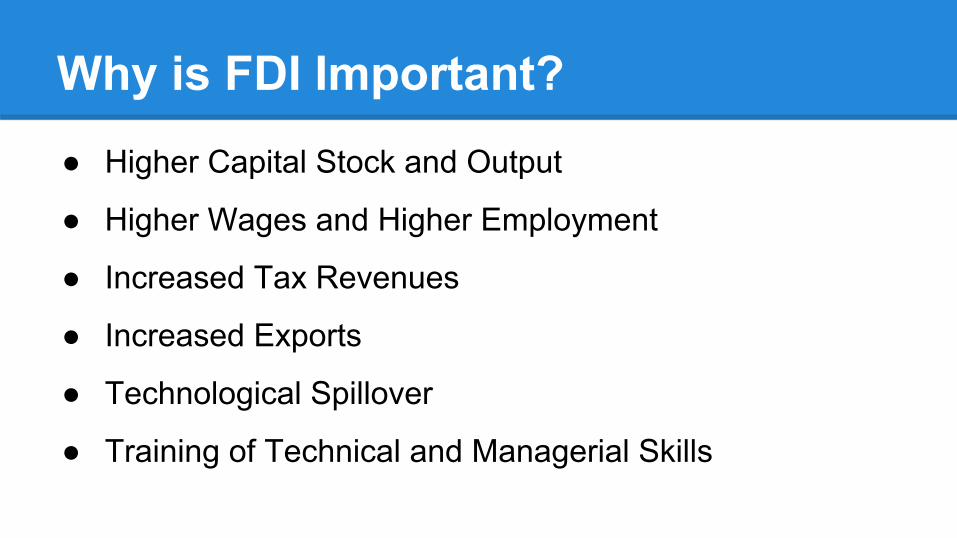
Why is FDI Important? ● Higher Capital Stock and Output
● Higher Wages and Higher Employment
● Increased Tax Revenues
● Increased Exports
● Technological Spillover
● Training of Technical and Managerial Skills
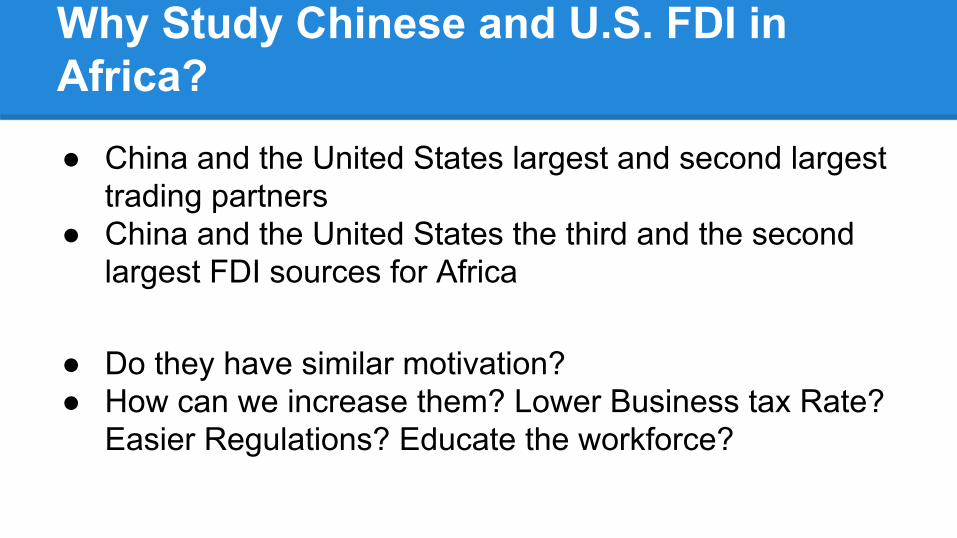
Why Study Chinese and U.S. FDI in Africa?
● China and the United States largest and second largest trading partners
● China and the United States the third and the second largest FDI sources for Africa
● Do they have similar motivation? ● How can we increase them? Lower Business tax Rate?
Easier Regulations? Educate the workforce?

Theoretical Framework
● OLI (Ownership, Location, Internalisation) Theory
● Investment Theory
Investment Theory● Very popular before the 1950s
● Capital should flow to the countries with higher returns
● This would have been the case in a perfect market, but MNCs don’t operate in perfect market (Hymer, 1960; Kindleberger, 1969)
● Useful for analysing developed vs developing countries, but not nearly as much for different developing countries.
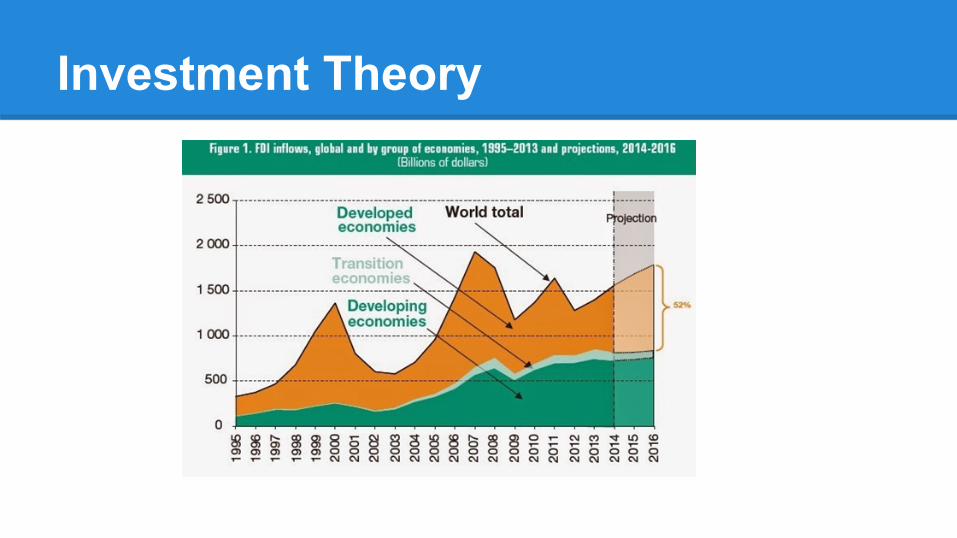
Investment Theory
OLI Framework (Dunning)● Ownership Advantages, Location, and Internalisation
Advantages
● Developed by John Dunning in the 1980s
● More useful framework for my purposes
Ownership Advantages● There has to be a reason why a firm wants to enter a
foreign market
● Something about the foreign firm has to be better than the domestic firms
● Asset, patent, technology, production technique, better design
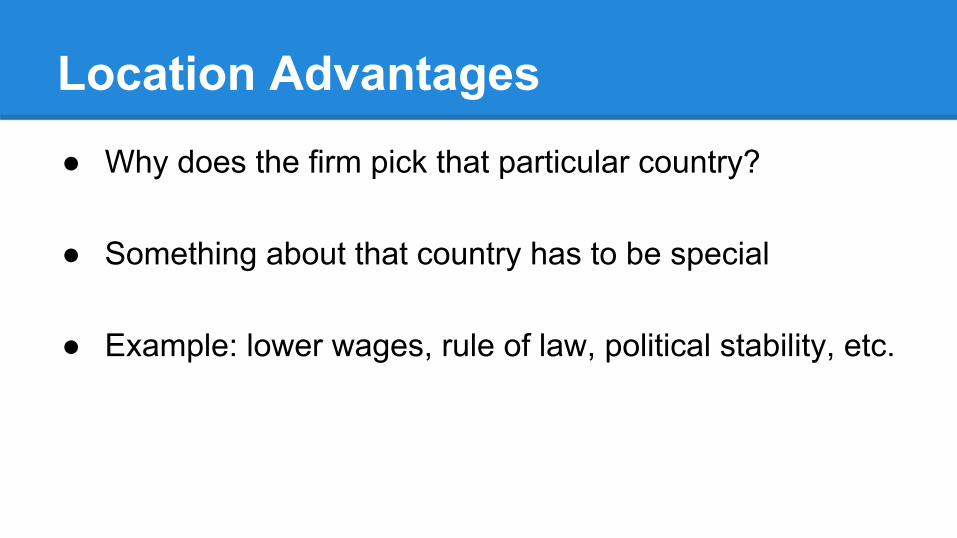
Location Advantages● Why does the firm pick that particular country?
● Something about that country has to be special
● Example: lower wages, rule of law, political stability, etc.

Internalisation Advantages● Why must that firm, and not a licensee, produce the
product?
● It might not want others to duplicate its technology
● Internalisation advantage hardest under licensing, so firms may opt for FDI
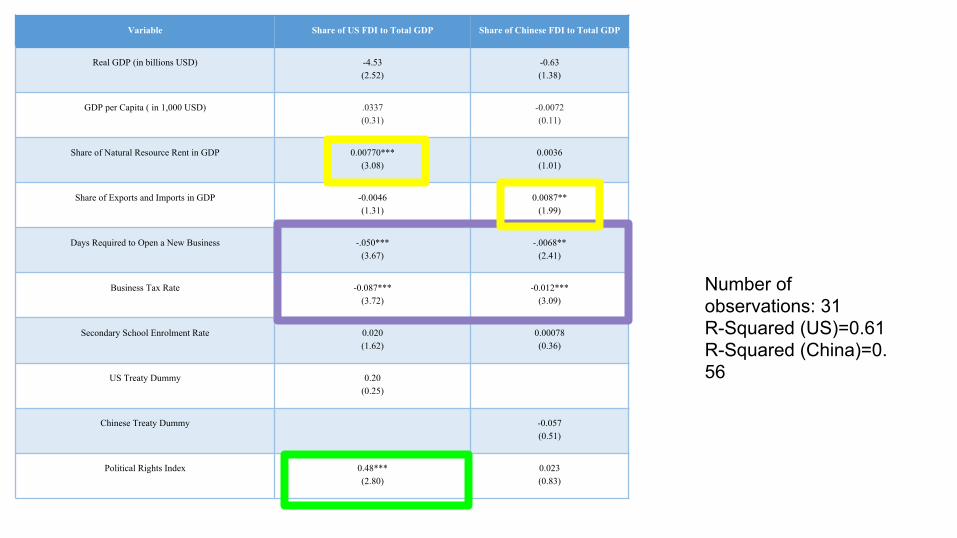
Variable Share of US FDI to Total GDP Share of Chinese FDI to Total GDP
Real GDP (in billions USD) -4.53(2.52)
-0.63(1.38)
GDP per Capita ( in 1,000 USD) .0337(0.31)
-0.0072(0.11)
Share of Natural Resource Rent in GDP 0.00770***(3.08)
0.0036(1.01)
Share of Exports and Imports in GDP -0.0046(1.31)
0.0087**(1.99)
Days Required to Open a New Business -.050***(3.67)
-.0068**(2.41)
Business Tax Rate -0.087***(3.72)
-0.012***(3.09)
Secondary School Enrolment Rate 0.020(1.62)
0.00078(0.36)
US Treaty Dummy 0.20(0.25)
Chinese Treaty Dummy -0.057(0.51)
Political Rights Index 0.48***(2.80)
0.023(0.83)
Number of observations: 31R-Squared (US)=0.61R-Squared (China)=0.56
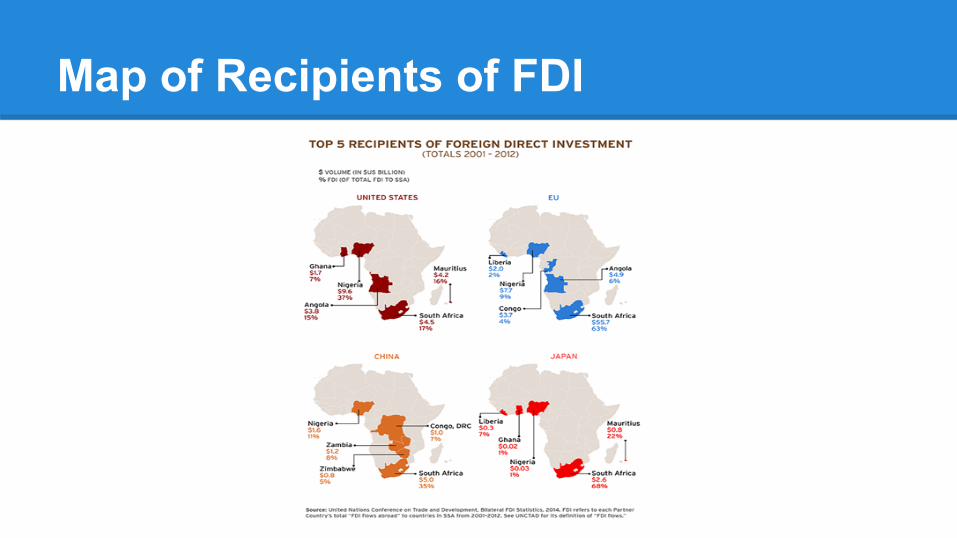
Map of Recipients of FDI
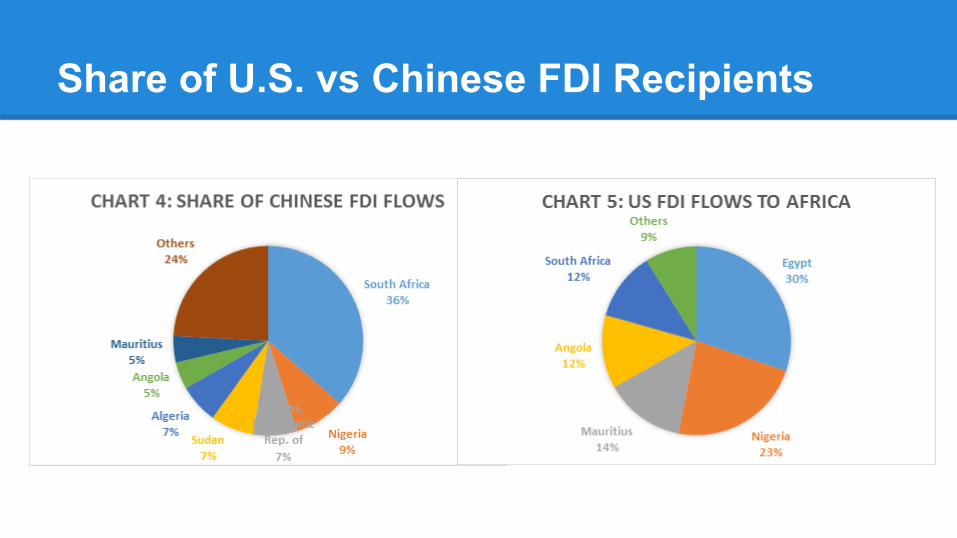
Share of U.S. vs Chinese FDI Recipients
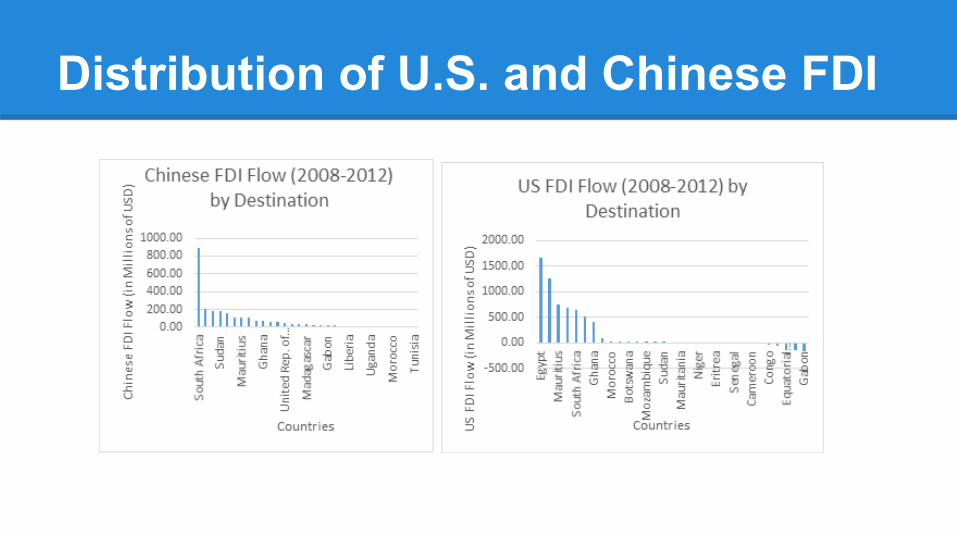
Distribution of U.S. and Chinese FDI

FDI Flow by Sectors
Sector Percentage of US FDI Stock
Percentage of Chinese FDI Stock
Mining and Extractive Industries 58.0% 30.6%
Financial Services 12.0% 19.5%
Construction 0% 16.4%
Manufacturing 5.0% 15.3%
Business and Technological Services, Geological Prospecting, Wholesale Retail
25.8% 18.2%
Total 100.0% 100.0%
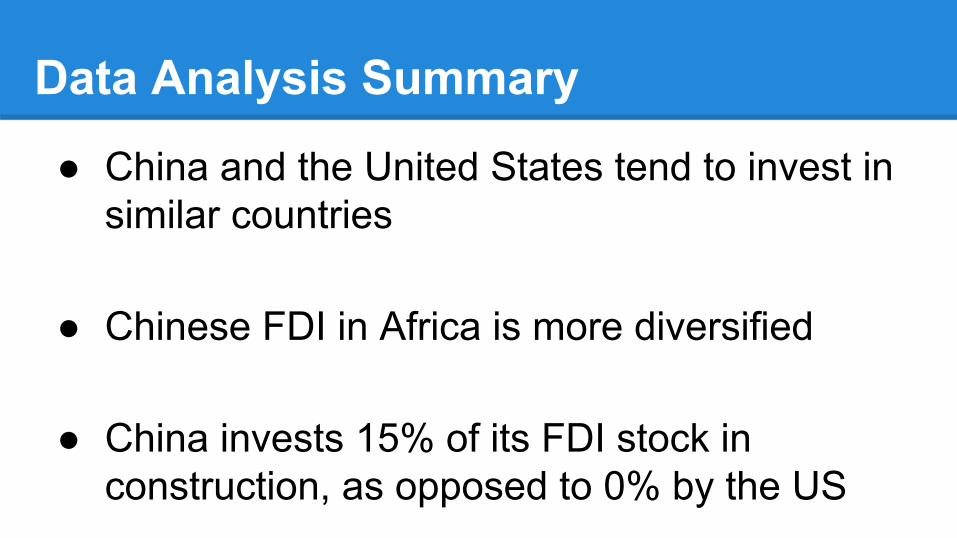
Data Analysis Summary
● China and the United States tend to invest in similar countries
● Chinese FDI in Africa is more diversified
● China invests 15% of its FDI stock in construction, as opposed to 0% by the US

Variable Share of US FDI to Total GDP Share of Chinese FDI to Total GDP
Real GDP (in billions USD) -4.53(2.52)
-0.63(1.38)
GDP per Capita ( in 1,000 USD) .0337(0.31)
-0.0072(0.11)
Share of Natural Resource Rent in GDP 0.00770***(3.08)
0.0036(1.01)
Share of Exports and Imports in GDP -0.0046(1.31)
0.0087**(1.99)
Days Required to Open a New Business -.050***(3.67)
-.0068**(2.41)
Business Tax Rate -0.087***(3.72)
-0.012***(3.09)
Secondary School Enrolment Rate 0.020(1.62)
0.00078(0.36)
US Treaty Dummy 0.20(0.25)
Chinese Treaty Dummy -0.057(0.51)
Political Rights Index 0.48***(2.80)
0.023(0.83)
Number of observations: 31R-Squared (US)=0.61R-Squared (China)=0.56
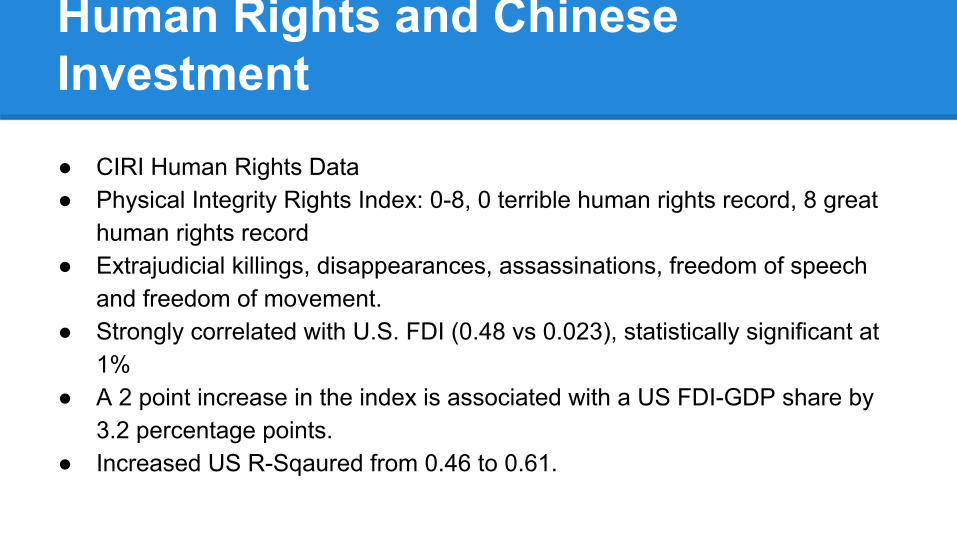
Human Rights and Chinese Investment
● CIRI Human Rights Data● Physical Integrity Rights Index: 0-8, 0 terrible human rights record, 8 great
human rights record● Extrajudicial killings, disappearances, assassinations, freedom of speech
and freedom of movement.● Strongly correlated with U.S. FDI (0.48 vs 0.023), statistically significant at
1% ● A 2 point increase in the index is associated with a US FDI-GDP share by
3.2 percentage points. ● Increased US R-Sqaured from 0.46 to 0.61.
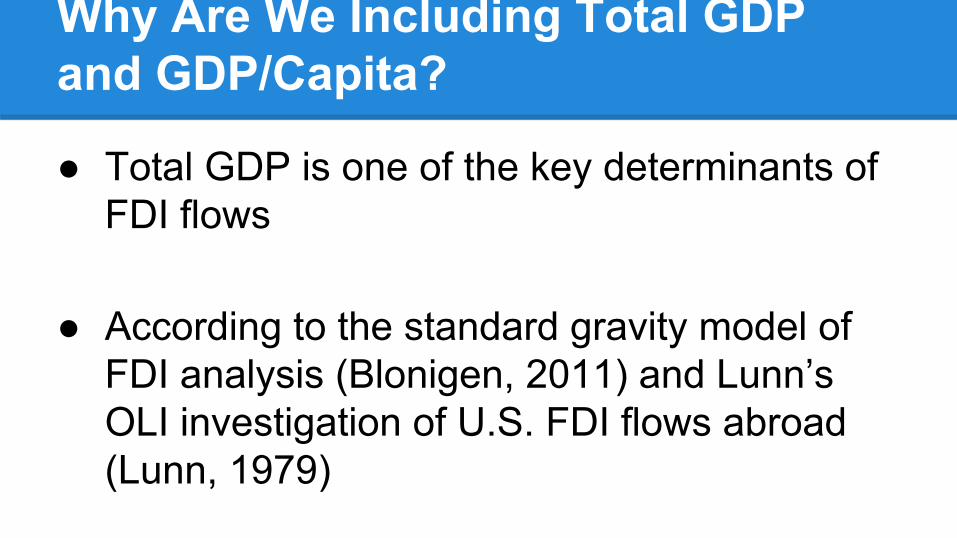
Why Are We Including Total GDP and GDP/Capita?
● Total GDP is one of the key determinants of FDI flows
● According to the standard gravity model of FDI analysis (Blonigen, 2011) and Lunn’s OLI investigation of U.S. FDI flows abroad (Lunn, 1979)
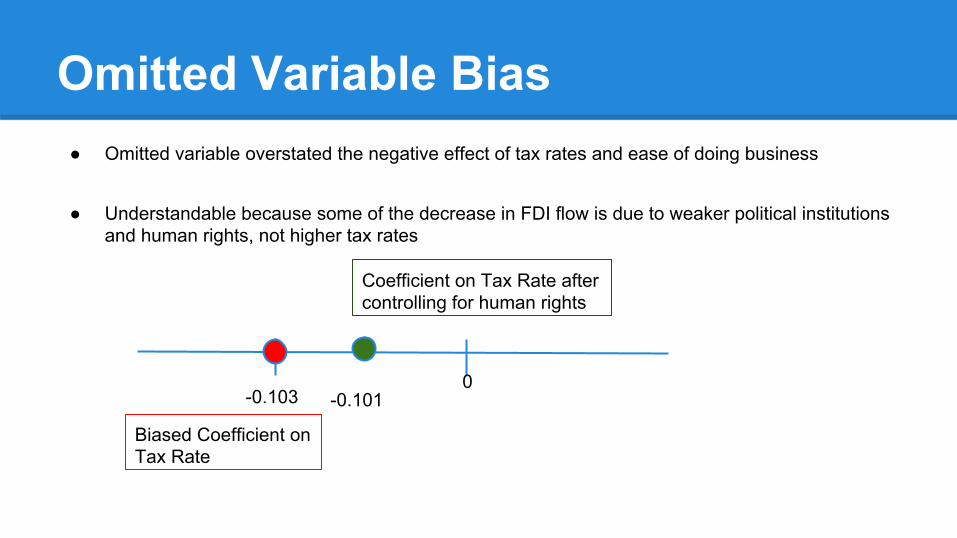
Omitted Variable Bias● Omitted variable overstated the negative effect of tax rates and ease of doing business
● Understandable because some of the decrease in FDI flow is due to weaker political institutions and human rights, not higher tax rates
0-0.101-0.103
Coefficient on Tax Rate after controlling for human rights
Biased Coefficient on Tax Rate
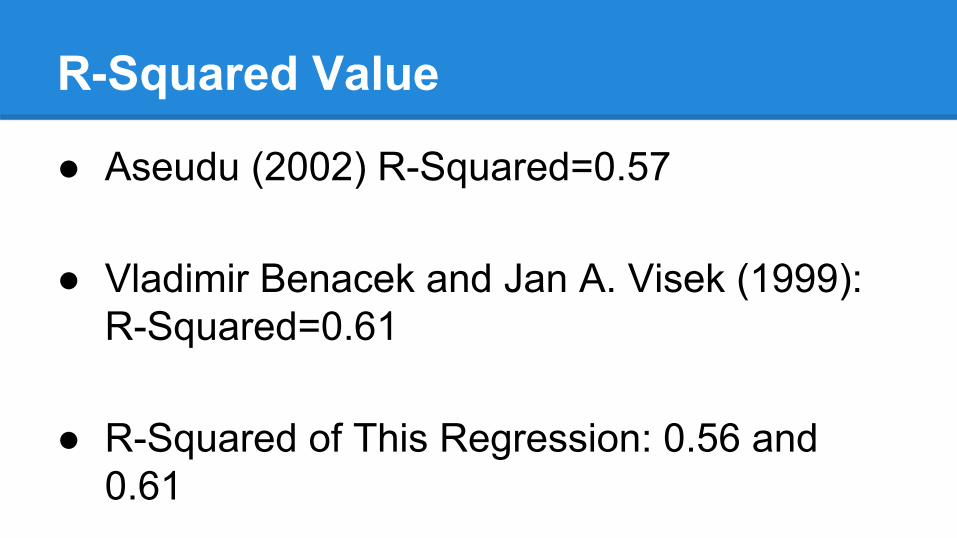
R-Squared Value
● Aseudu (2002) R-Squared=0.57
● Vladimir Benacek and Jan A. Visek (1999): R-Squared=0.61
● R-Squared of This Regression: 0.56 and 0.61
Reverse Causality: GDP and Taxes
-OLS Regression
-Problems with Causality
-Tax Breaks=>More Investment
Preferential Treatment
-No subsidies of which I am aware
-BITs for both China and U.S. investments insignificant
-However, countries that offer tax breaks tend to attract more investment (Mauritius and South Africa)
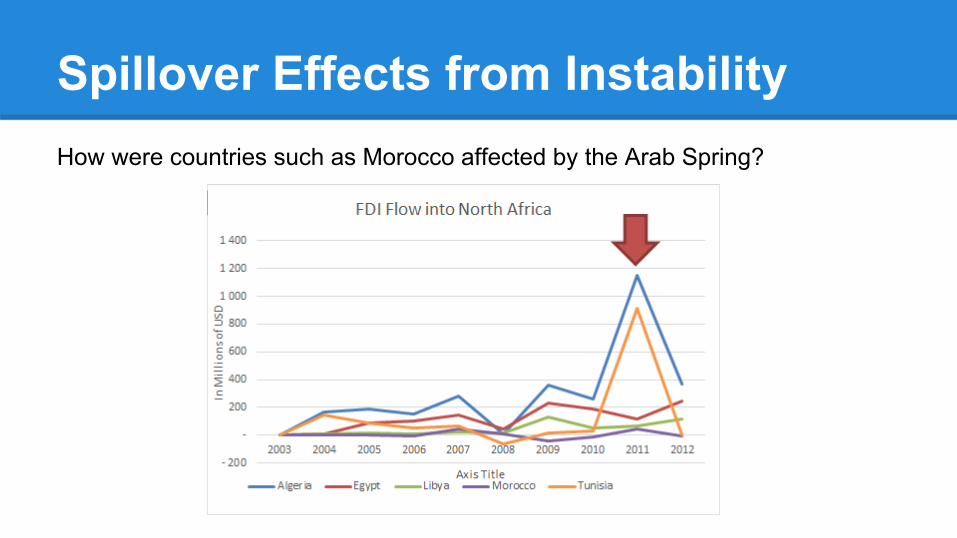
Spillover Effects from InstabilityHow were countries such as Morocco affected by the Arab Spring?
Colonialism
● Chinese aid, FDI and trade projected to grow
● Counterbalance to US and European hegemony in the region
● Complementary nature of involvement: US low-interest loans with conditionality; China: trade and infrastructure development
Colonialism?
● More Willing to Undertake Less Profitable Projects in Certain Sectors, for instance mining and railways in Nigeria
● Willing to invest in high-risk and postconflict countries such as Burundi, Sierra Leone and Congo
Domestic Manufacturing
● Is Chinese FDI replacing domestic investors?
● African and Chinese exports overlap only in textile and clothing
● Export Similarity Index is only 7.3 percent
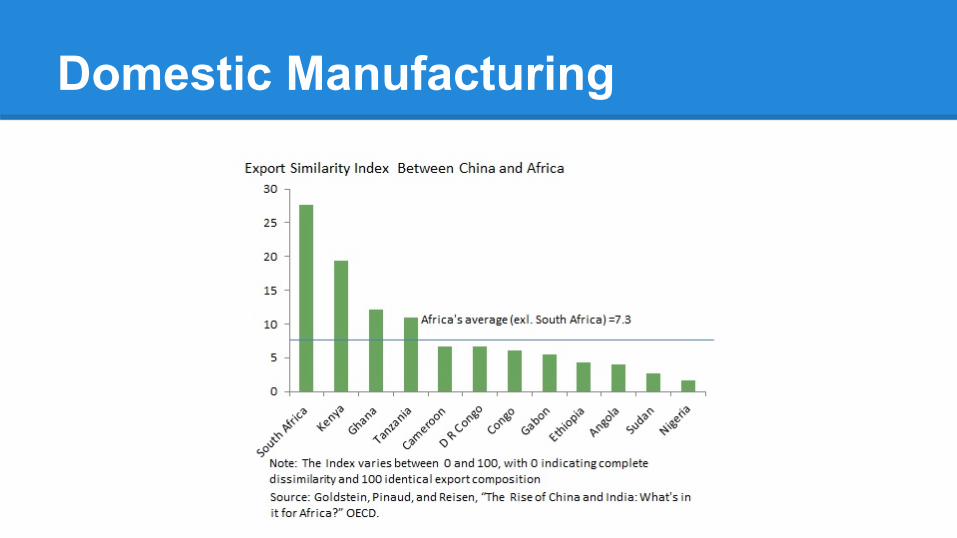
Domestic Manufacturing
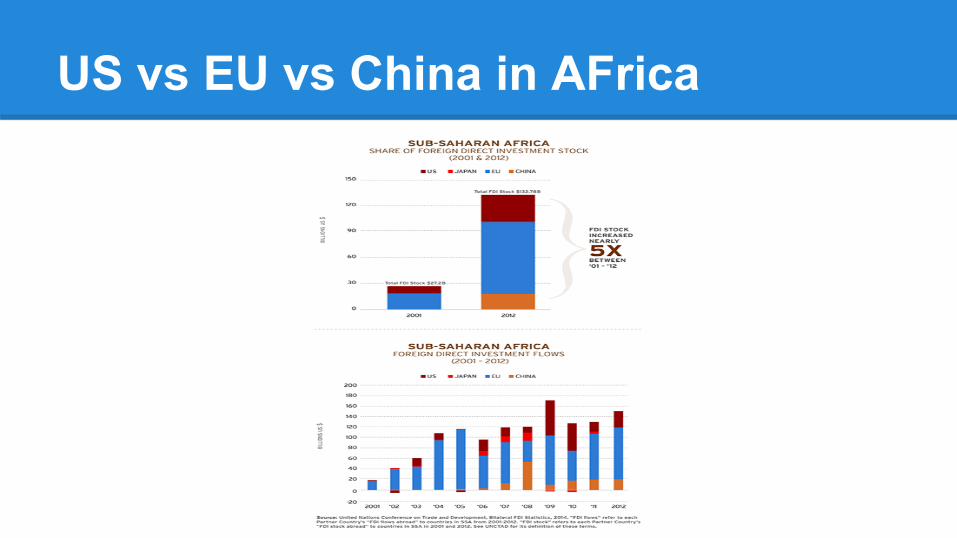
US vs EU vs China in AFrica
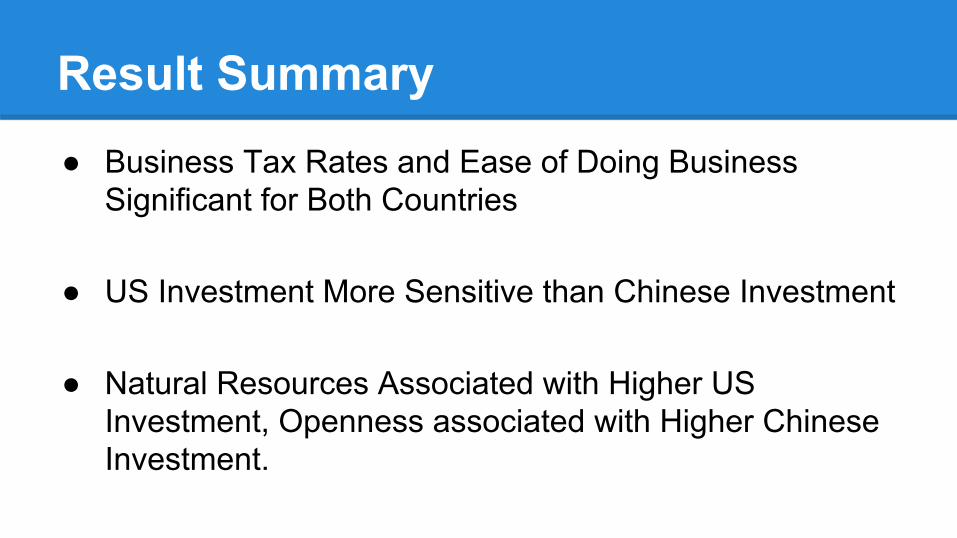
Result Summary● Business Tax Rates and Ease of Doing Business
Significant for Both Countries
● US Investment More Sensitive than Chinese Investment
● Natural Resources Associated with Higher US Investment, Openness associated with Higher Chinese Investment.