Embed Size (px)
Citation preview

Kinepolis GroupResults Half 1 2013
Analyst & Press MeetingAugust 29, 2013

Business Review Half 1 2013CEO, Mr Eddy Duquenne
2

Key Financials€m H1 2013 H1 2012 Better / (Worse)
Visitors (‘000) 8.369 9.414 (11,1)%
Revenue 109,7 117,3 (6,5)%
EBITDA 30,9 31,7 (2,4)%
REBITDA 30,7 32,1 (4,5)%
REBITDA Margin 27,9% 27,4%
EBIT 21,6 22,1 (2,5)%
REBIT 21,0 22,2 (5,5)%
REBIT Margin 19,1% 18,9%
Net Earnings 14,3 14,9 (4,1)%
Current Net Earnings 13,9 15,0 (7,6)%
EPS (in €) 2,59 2,46 5,3%
Free Cash Flow 7,6 15,6 (51,1)%
€m 30th Jun 2013 31st Dec 2012 Better / (Worse)
Net Financial Debt (NFD) 107,5 90,2 (17,3)
29 augustus 2013
€ 3,66/Vis € 3,41/Vis
3
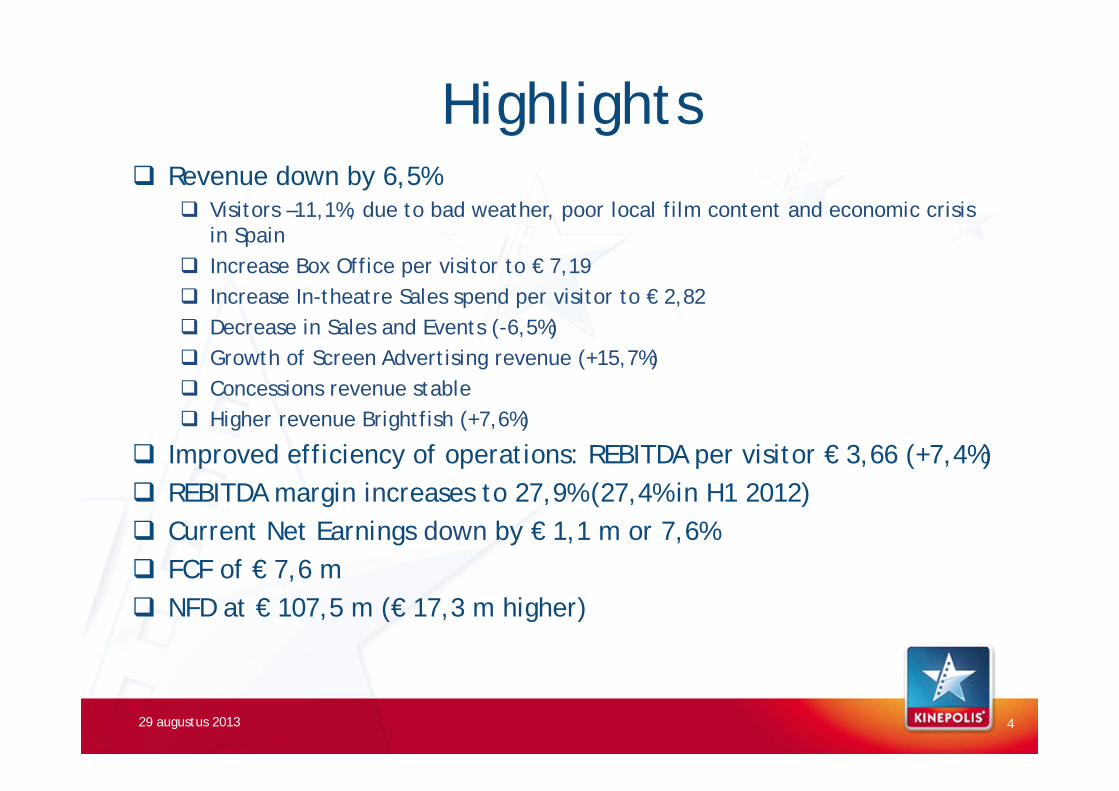
Highlights Revenue down by 6,5%
Visitors –11,1%, due to bad weather, poor local film content and economic crisis in Spain
Increase Box Office per visitor to € 7,19 Increase In-theatre Sales spend per visitor to € 2,82 Decrease in Sales and Events (-6,5%) Growth of Screen Advertising revenue (+15,7%) Concessions revenue stable Higher revenue Brightfish (+7,6%)
Improved efficiency of operations: REBITDA per visitor € 3,66 (+7,4%) REBITDA margin increases to 27,9% (27,4% in H1 2012) Current Net Earnings down by € 1,1 m or 7,6% FCF of € 7,6 m NFD at € 107,5 m (€ 17,3 m higher)
29 augustus 2013 4

Major events H1 2013 results reflect Strategic Pillars set out in 2008
Best Marketer Best Cinema Operator Best Property Manager
Further development and implementation of Strategy in 2013 Positive result in proceedings with TPB (Belgium) Sale of land in Poland (surplus value of € 0,9 m) Green Star report published Share Buy-Back
Acquisition of 117.268 shares for € 12,2 m in H1 2013 Sale of 7.200 shares (exercise stock options) for € 0,1 m (former employee) Cumulative capital optimization 2011 – 2012 - H1 2013 of € 109,9 m
29 augustus 2013 5

Market Share: Belgium: to be announced**
France: 3,4%
Spain: 4,7%
297 digital screens (100% digitised***)
Of which 93 screens with 3D
Kinepolis complexes todayKINEPOLIS GROUP Complexes ScreensBelgium 11 138
France 7 87
Spain 3 64
Poland * 1 20
Switzerland 1 8
Total 23 317
29 augustus 2013
11
* Operated by ITIT ** New data platform expected to be available in H2 2013*** Excluding ITIT
6
Belgium57%France
26%
Spain 15%
SwitzerlandPoland
2%
Belgium60%
France26%
Spain 12%
SwitzerlandPoland
2%
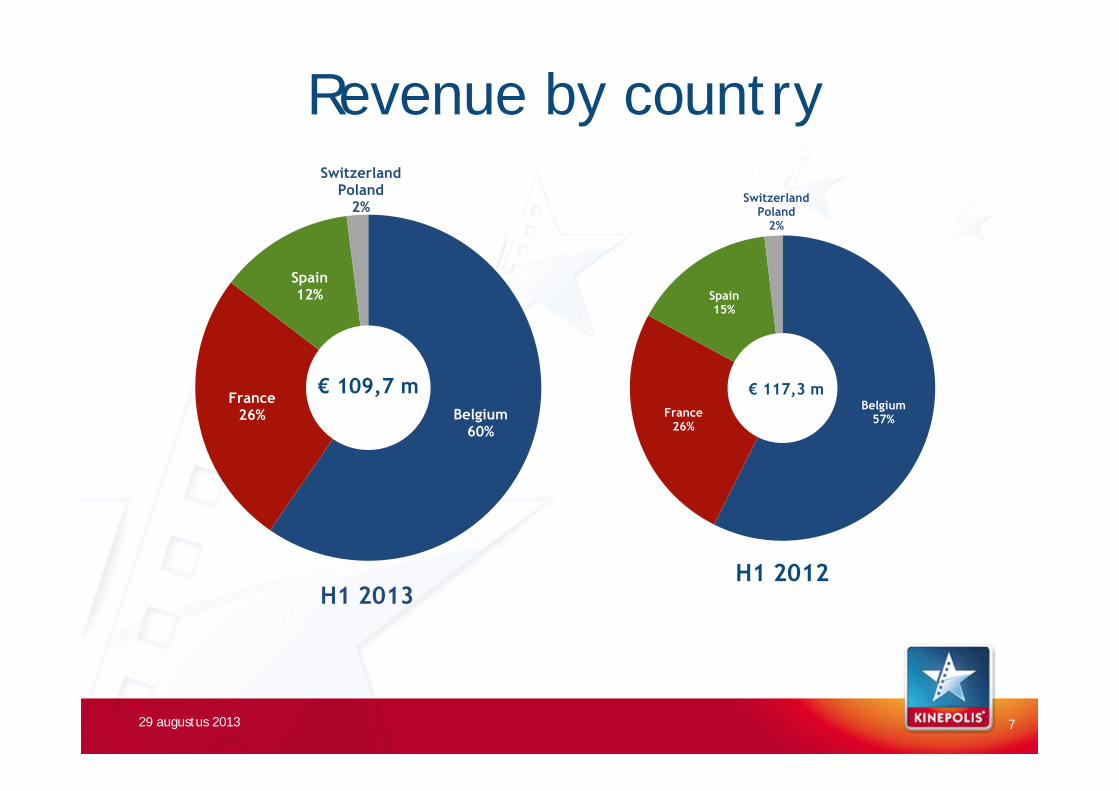
Revenue by country
29 augustus 2013
€ 109,7 m
H1 2013H1 2012
€ 117,3 m
7

Box Office56%
In-theatre Sales21%
B2B*14%
Concessions4%
Brightfish4%
Film Distribution
1%
Box Office55%
In-theatre Sales22%
B2B*14%
Concessions4%
Brightfish4%
Film Distribution
1%
Revenue by activity
29 augustus 2013
€ 109,7 m
H1 2013H1 2012
€ 117,3 m
8
* Including Cinema Screen Advertising

9
Visitors & Movies Visitors (000’s) H1 2013 % of Tot H1 2012 % of Tot % Δ YoYBelgium 4.051 48,4% 4.398 46,7% (7,9)%
France 2.848 34,0% 3.106 33,0% (8,3)%
Spain 1.398 16,7% 1.843 19,6% (24,1)%
Switzerland 72 0,9% 67 0,7% 7,5%
Total 8.369 100% 9.414 100% (11,1)%
29 augustus 2013
Top 5 Movies H1 2013 3D Visitors (000’s)
1. Iron Man 3 ✓ 415
2. Fast and Furious 6 399
3. Django Unchained 364
4. The Croods ✓ 359
5. The Hobbit: Un UnexpectedJourney
✓ 240
Top 5 1.777Weight Top 5 21,2%
Top 5 Movies H1 2012 3D Visitors (000’s)
1. The Avengers ✓ 517
2. The Hunger Games 394
3. Sherlock Holmes: A Game of Shadows
285
4. Intouchables 274
5. Sur la piste du Marsupilami 238
Top 5 1.708Weight Top 5 18,1%

Ratios
21,7%
27,2%27,0% 27,4%
27,9%
15%
20%
25%
30%
35%
H12009
H12010
H12011
H12012
H12013
REBITDA Margin
12%
16%
19,8%21,8%
20,9%
0%
5%
10%
15%
20%
25%
2009 2010 2011 2012 2013H1*
ROCE
0,67
0,43
0,57
0,83
1,11
0%
20%
40%
60%
80%
100%
120%
2009 2010 2011 2012 2013H1
Gearing
29 augustus 2013 10
*: 12 months rolling

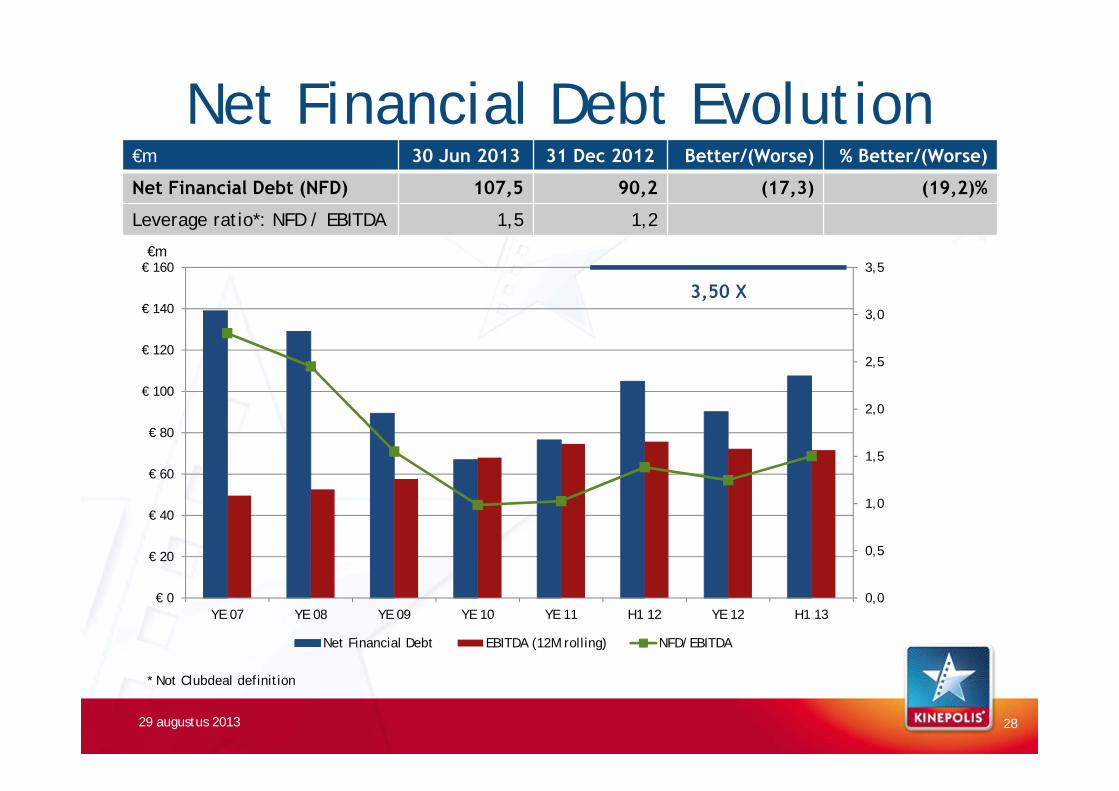
Net Financial Debt Evolution
29 augustus 2013
€m 30 Jun 2013 31 Dec 2012 Better/(Worse) % Better/(Worse)
Net Financial Debt (NFD) 107,5 90,2 (17,3) (19,2)%
Leverage ratio*: NFD / EBITDA 1,5 1,2
0,0
0,5
1,0
1,5
2,0
2,5
3,0
3,5
€ 0
€ 20
€ 40
€ 60
€ 80
€ 100
€ 120
€ 140
€ 160
YE 07 YE 08 YE 09 YE 10 YE 11 H1 12 YE 12 H1 13
Net Financial Debt EBITDA (12M rolling) NFD/EBITDA
3,50 X
* Not Clubdeal definition
11
€m
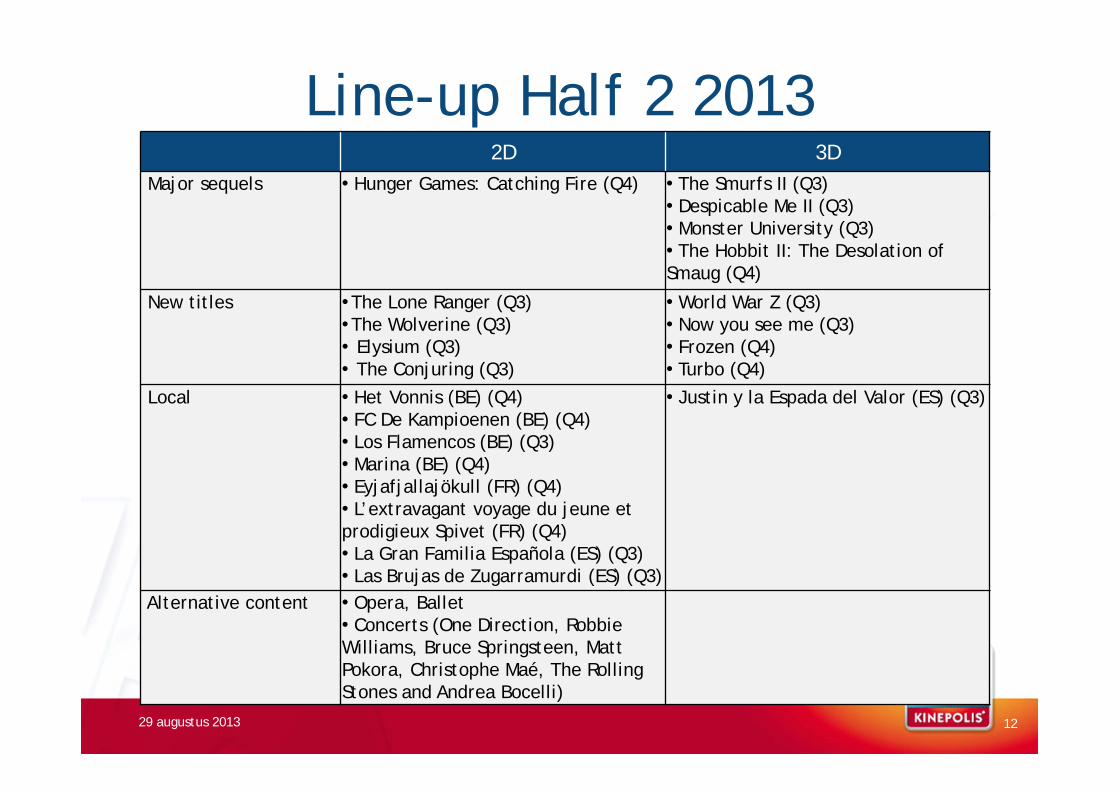
Line-up Half 2 2013
29 augustus 2013 12
2D 3DMajor sequels • Hunger Games: Catching Fire (Q4) • The Smurfs II (Q3)
• Despicable Me II (Q3)• Monster University (Q3)• The Hobbit II: The Desolation of Smaug (Q4)
New titles •The Lone Ranger (Q3)•The Wolverine (Q3)• Elysium (Q3)• The Conjuring (Q3)
• World War Z (Q3)• Now you see me (Q3)• Frozen (Q4)• Turbo (Q4)
Local • Het Vonnis (BE) (Q4)• FC De Kampioenen (BE) (Q4)• Los Flamencos (BE) (Q3)• Marina (BE) (Q4)• Eyjafjallajökull (FR) (Q4)• L’extravagant voyage du jeune et prodigieux Spivet (FR) (Q4)• La Gran Familia Española (ES) (Q3)• Las Brujas de Zugarramurdi (ES) (Q3)
• Justin y la Espada del Valor (ES) (Q3)
Alternative content • Opera, Ballet• Concerts (One Direction, Robbie Williams, Bruce Springsteen, Matt Pokora, Christophe Maé, The Rolling Stones and Andrea Bocelli)

Financial Review Half 1 2013CFO, Mr Nicolas De Clercq
13

14
Revenue by country
29 augustus 2013
€m H1 2013 % of Tot H1 2012 % of Tot % Δ YoYBelgium 65,4 59,6% 67,4 57,4% (2,9)%
France 28,3 25,8% 29,9 25,5% (5,5)%
Spain 13,8 12,6% 17,8 15,2% (22,8)%
Switzerland & Poland 2,2 2,0% 2,2 1,9% 1,4%
Total 109,7 100% 117,3 100% (6,5)%

7,037,09
7,19
5,50 €
6,00 €
6,50 €
7,00 €
7,50 €
8,00 €
8,50 €
H1 2012 H2 2012 H1 2013
Box office / Visitor
+2,2%
Evolution Box Office & ITS
29 augustus 2013 15
2,632,72
2,82
1,00 €
1,50 €
2,00 €
2,50 €
3,00 €
3,50 €
4,00 €
H1 2012 H2 2012 H1 2013
ITS / Visitor
+7,4%

0
2
4
6
8
10
12
14
16
18
20
H1 2012 H2 2012 H1 2013
Sales & Events€m
Revenue by Business
29 augustus 2013
0,0
0,5
1,0
1,5
2,0
2,5
3,0
3,5
4,0
H1 2012 H2 2012 H1 2013
Screen Advertising€m
+15,7%
16
* *
* Excluding Brightfish * Excluding Brightfish
-6,5%
20
30
40
50
60
70
80
90
100
110
H1 2012 H2 2012 H1 2013
Cinema Revenue€m
-7,9%
Visitors 8,49,4 10,4

1,8
2,3
2,8
3,3
3,8
4,3
4,8
H1 2012 H2 2012 H1 2013
Concessions @ flat FX€m
Revenue by Business (2)
29 augustus 2013
0,0
0,4
0,8
1,2
1,6
2,0
H1 2012 H2 2012 H1 2013
Film Distribution€m
17
# releases
1415 19
-22,9%
-2,7%
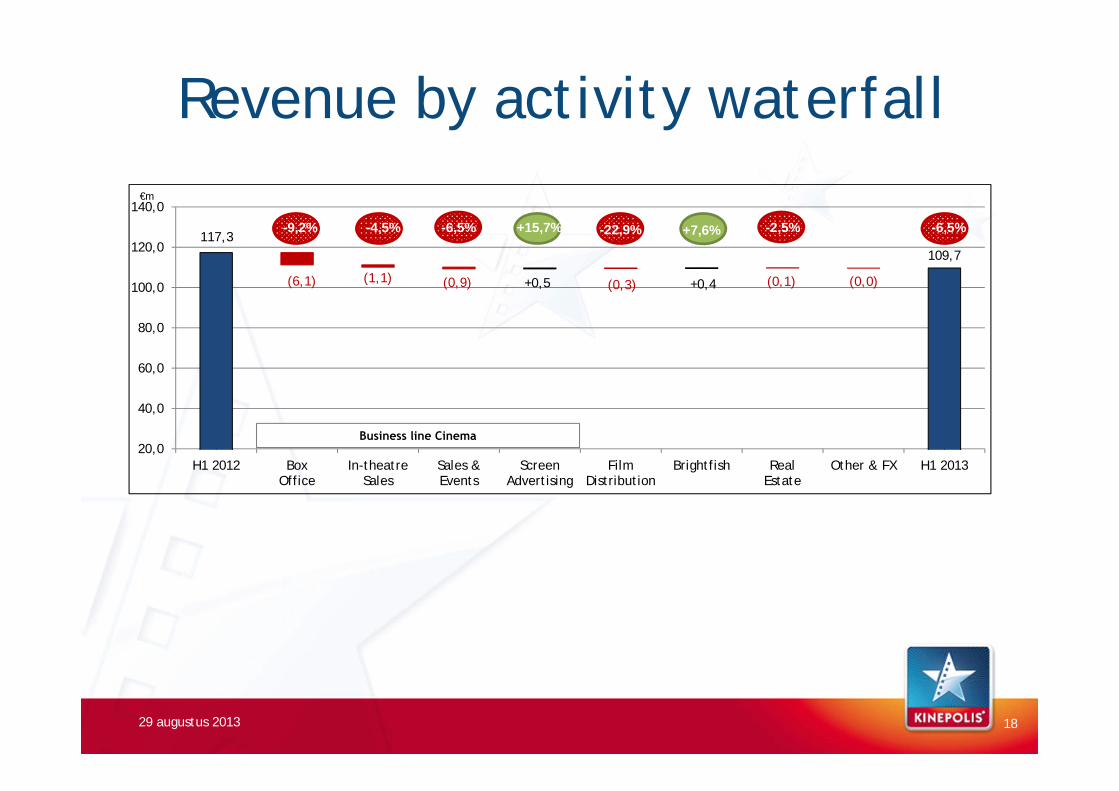
117,3
(6,1) (1,1) (0,9) +0,5 (0,3) +0,4 (0,1) (0,0)
109,7
20,0
40,0
60,0
80,0
100,0
120,0
140,0
H1 2012 BoxOffice
In-theatreSales
Sales &Events
ScreenAdvertising
FilmDistribution
Brightfish RealEstate
Other & FX H1 2013
+7,6%
Revenue by activity waterfall
29 augustus 2013 18
Business line Cinema
-9,2% -6,5% +15,7%-4,5%
-0,3%
-2,5%
€m
-22,9% -6,5%

Operating Costs€m H1 2013 H1 2012 % Better / (Worse)
Marketing & Selling Expenses (5,7) (6,0) 5,4%
Administrative Expenses (7,1) (7,6) 7,2%
Other Operating Income/(Costs) 1,6 0,8 96,1%
Total Operating Costs (11,1) (12,8) 12,9%
Non-Current 0,9 0,0
Current Operating Costs (12,0) (12,8) 6,4%
29 augustus 2013 19
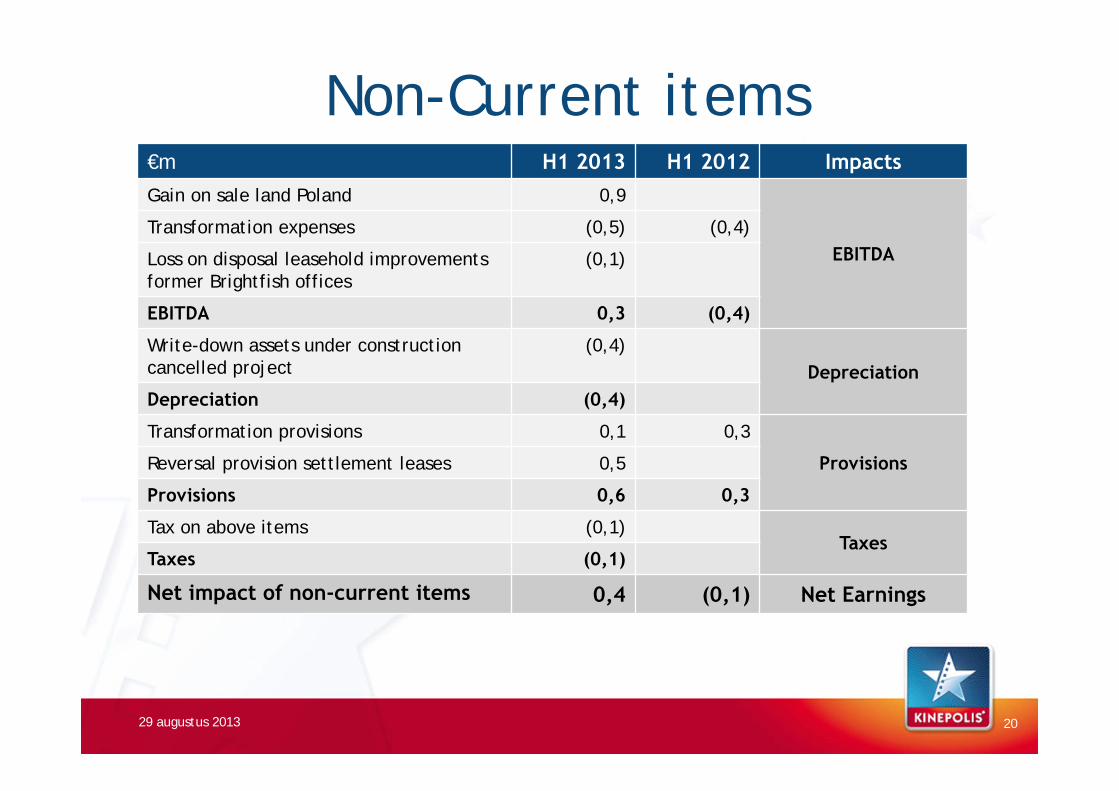
Non-Current items€m H1 2013 H1 2012 ImpactsGain on sale land Poland 0,9
EBITDATransformation expenses (0,5) (0,4)
Loss on disposal leasehold improvements former Brightfish offices
(0,1)
EBITDA 0,3 (0,4)
Write-down assets under construction cancelled project
(0,4)Depreciation
Depreciation (0,4)
Transformation provisions 0,1 0,3
ProvisionsReversal provision settlement leases 0,5
Provisions 0,6 0,3
Tax on above items (0,1)Taxes
Taxes (0,1)
Net impact of non-current items 0,4 (0,1) Net Earnings
29 augustus 2013 20

27,4%
33,3%
33,9%
34,1%
27,9%
36,1%
36,6%
37,7%
Total
Switz.& Poland
* Spain
France
** Belgium
REBITDA Margin % (on a comparable basis)H1 2013 H1 2012
REBITDA by Country
29 augustus 2013
REBITDA €m H1 2013 % of Total H1 2012 % of Total % Better/(Worse)
Belgium 16,3 53,1% 16,2 50,6% 0,2%
France 10,5 34,3% 10,3 32,0% 2,2%
Spain 3,1 10,0% 4,9 15,1% (37,0)%
Switzerland & Poland 0,8 2,6% 0,7 2,3 10,3%
TOTAL 30,7 100% 32,1 100% (4,5)%
* REBITDAR (i.e. REBITDA excluding rent for Valencia complex) ** Excluding corporate entities, KFD, Brightfish
21
32,4%29,7%

REBITDA Margin
29 augustus 2013 22
REBITDA/Visitor
27,0%
29,2%
27,4%
30,5%
27,9%
9.619
11.643
9.414
10.385
8.369
0
2.000
4.000
6.000
8.000
10.000
12.000
14.000
22%
24%
26%
28%
30%
32%
34%
36%
38%
H1 2011 H2 2011 H1 2012 H2 2012 H1 2013
Rebitda Margin Visitors ('000)
€ 3,41€ 3,57€ 3,13 € 3,66€ 4,03
Financial Result
29 augustus 2013
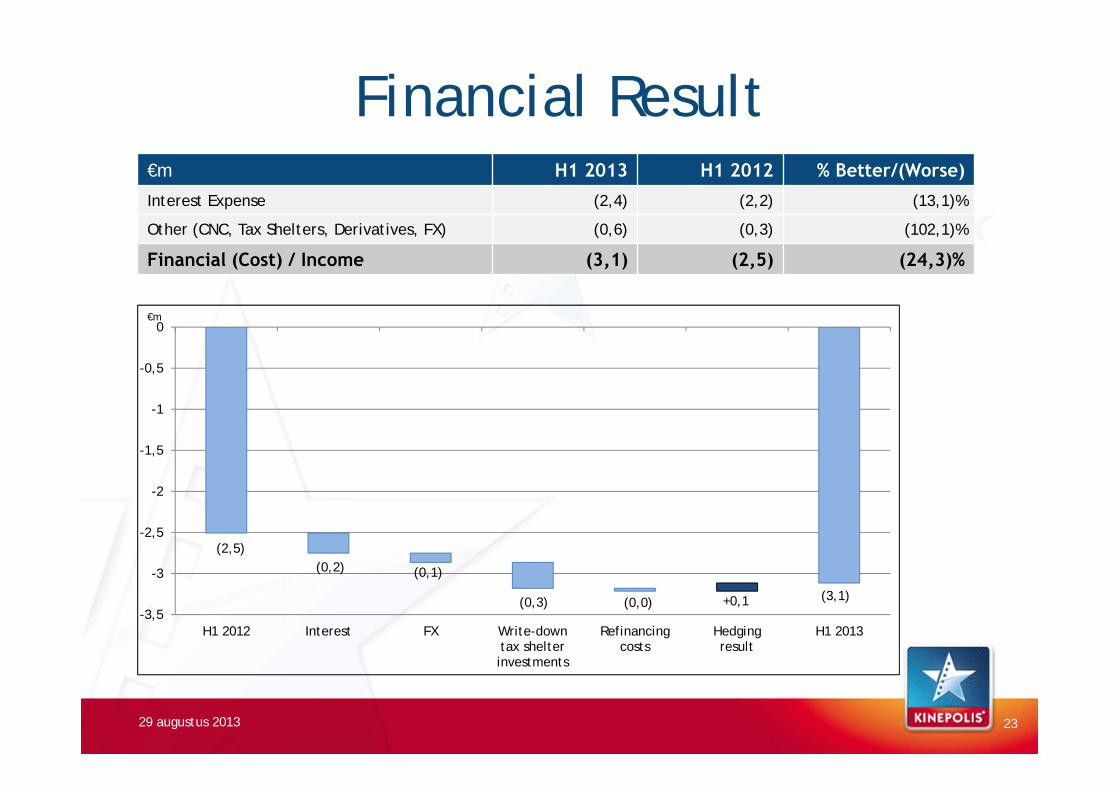
€m H1 2013 H1 2012 % Better/(Worse)
Interest Expense (2,4) (2,2) (13,1)%
Other (CNC, Tax Shelters, Derivatives, FX) (0,6) (0,3) (102,1)%
Financial (Cost) / Income (3,1) (2,5) (24,3)%
23
(2,5)(0,2) (0,1)
(0,3) (0,0) +0,1 (3,1)-3,5
-3
-2,5
-2
-1,5
-1
-0,5
0
H1 2012 Interest FX Write-downtax shelterinvestments
Refinancingcosts
Hedgingresult
H1 2013
€m

Taxes€m H1 2013 H1 2012 % Better /(Worse)
Profit before Taxes 18,4 19,6 (5,9)%
Taxes (4,1) (4,7) 11,6%
Net Profit 14,3 14,9 (4,1)%
Effective Tax Rate (‘ETR’) 22,4% 23,8%
29 augustus 2013 24
(4,7) +0,0 (4,7) +0,3+0,5
-0,1 (4,0) (0,1) (4,1)
-6
-5
-4
-3
-2
-1
0
H1 2012 Non-currentH1 2012
CurrentH1 2012
Tax shelter &NID
Lowerpre-tax
result H1 2013
No moreTLCF
CurrentH1 2013
Non-currentH1 2013
H1 2013
€m
ETR23,8%
ETR23,9%
ETR22,4%
ETR22,6%
Free Cash Flow Half 1 2013
29 augustus 2013 25
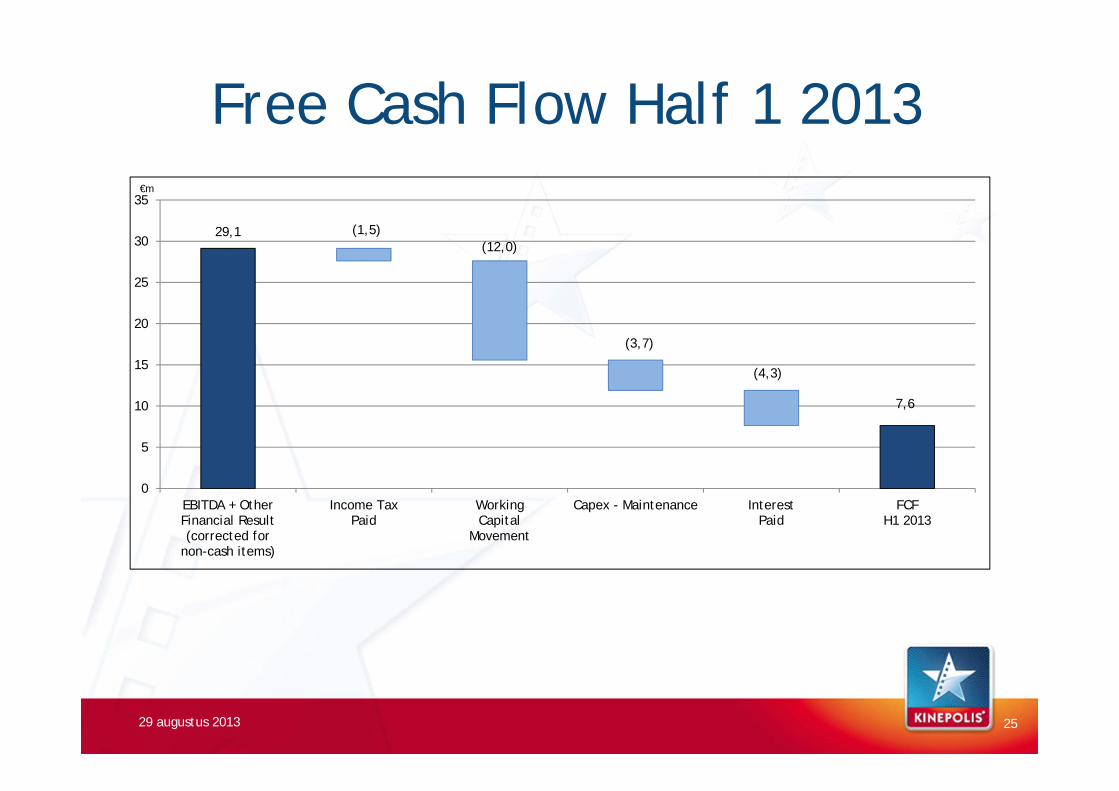
29,1 (1,5)(12,0)
(3,7)
(4,3)
7,6
0
5
10
15
20
25
30
35
EBITDA + OtherFinancial Result(corrected for
non-cash items)
Income TaxPaid
WorkingCapital
Movement
Capex - Maintenance InterestPaid
FCFH1 2013
€m
Free Cash Flow H1 2013 vs H1 2012
29 augustus 2013 26
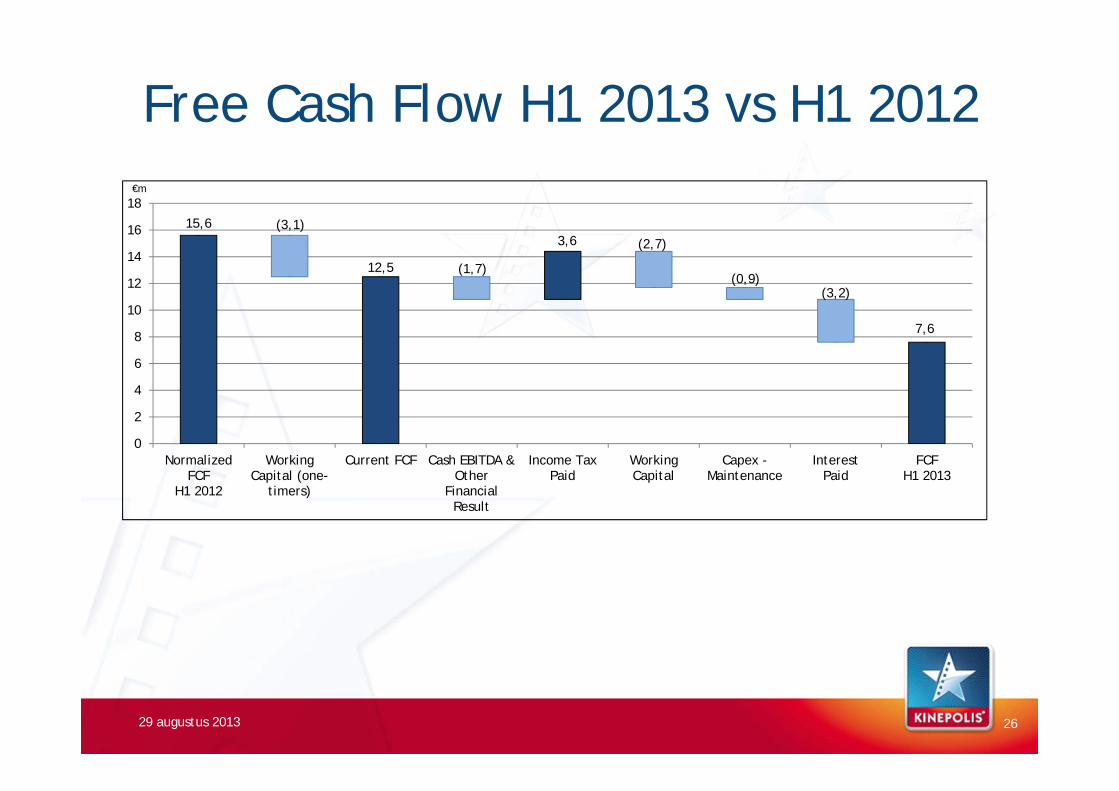
15,6 (3,1)
12,5 (1,7)
3,6 (2,7)
(0,9)(3,2)
7,6
0
2
4
6
8
10
12
14
16
18
NormalizedFCF
H1 2012
WorkingCapital (one-
timers)
Current FCF Cash EBITDA &Other
FinancialResult
Income TaxPaid
WorkingCapital
Capex -Maintenance
InterestPaid
FCFH1 2013
€m

Maintenance48%
2,8 €mRemodeling39%
2,2 €m
Digitization13%
0,7 €m
Capex – Depreciation
29 augustus 2013
Capex €m H1 2013 H1 2012
Belgium 2,9 3,4
France 1,6 0,7
Spain 1,0 1,5
Other 0,0 0,1
TOTAL 5,5 5,7
27
H1 2012:5,7 €m
€m
(9,6)(0,3) (9,9) +0,2 (9,7) +0,3 (9,4)
-12
-10
-8
-6
-4
-2
0
H1 2012 Non-currentH1 2012
CurrentH1 2012
Normaldiff's
CurrentH1 2013
Non-currentH1 2013
H1 2013
Depreciations, Amortizations & Provisions
Maintenance67%
3,7 €m
Remodeling33%
1,8 €m H1 2013:5,5 €m
Net Financial Debt Evolution
29 augustus 2013
€m 30 Jun 2013 31 Dec 2012 Better/(Worse) % Better/(Worse)
Net Financial Debt (NFD) 107,5 90,2 (17,3) (19,2)%
Leverage ratio*: NFD / EBITDA 1,5 1,2
0,0
0,5
1,0
1,5
2,0
2,5
3,0
3,5
€ 0
€ 20
€ 40
€ 60
€ 80
€ 100
€ 120
€ 140
€ 160
YE 07 YE 08 YE 09 YE 10 YE 11 H1 12 YE 12 H1 13
Net Financial Debt EBITDA (12M rolling) NFD/EBITDA
3,50 X
* Not Clubdeal definition
28
€m

Balance sheet€m 30 Jun
2013% of Total
31 Dec2012
% of Total
€m 30 Jun2013
% of Total
31 Dec2012
% of Total
Intangible assets 3,3 1% 3,3 1% Equity 97,3 32% 108,7 33%
Goodwill 18,8 6% 18,8 6% LT financial debt 86,2 28% 81,7 25%
Land & buildings 180,8 59% 184,6 56% Provisions(1) 3,0 1% 3,8 1%
Other fixed assets 39,7 13% 41,3 13% Deferred taxes 17,8 6% 17,4 5%
Deferred taxes 0,9 0% 0,7 0% Other payables 8,4 3% 8,6 3%
Other receivables 13,6 4% 13,2 4% Derivatives 0,0 0% 0,1 0%
Non-current assets 257,1 84% 261,9 80% Non-current liabilities 115,4 37% 111,7 34%
Assets held for sale 7,8 3% 8,7 3% ST financial debt 40,1 13% 37,7 12%
Working capital 23,6 8% 26,1 8% Provisions 0,3 0% 0,3 0%
Current taxes 0,7 0% 1,7 1% Working capital 48,3 16% 64,3 20%
Financial assets 0,0 0% 0,4 0% Current taxes 5,9 2% 4,4 1%
Cash & cash equivalents 18,4 6% 28,8 9% Derivatives 0,3 0% 0,5 0%
Current assets 50,5 16% 65,7 20% Current liabilities 94,9 31% 107,2 33%
Assets 307,6 100% 327,6 100% Equity & Liabilities 307,6 100% 327,6 100%
29 augustus 2013 29
(1): Including employee benefits liabilities
*: Gearing ratio: Net Financial Debt / Equity**: Current ratio: Current Assets / Current Liabilities***: Solvency ratio: Total Equity / Total Equity & Liabilities****: ROCE: Current operating profit / Capital employed
30 Jun2013
31 Dec2012
Gearing ratio* 1,11 0,83
Current ratio** 0,53 0,61
Solvency ratio*** 31,6% 33,2%
ROCE***** 20,9% 21,8%

Shareholders23/08/2013 19/01/2013
# Shares % # Shares %
Total Shares outstanding 5.856.508 100 % 5.856.508 100 %
29 augustus 2013
* Resulting from transparency notices received
Other* # Shares % # Shares %Axa SA 304.711 5,20% 278.885 4,76%
Ameriprise Financial Inc – Threadneedle AMH Ltd 266.256 4,55% 266.256 4,55%
BNP Paribas Investment Partners SA 194.659 3,32% 194.659 3,32%
Refence Shareholders & Free Float # Shares % # Shares %Kinohold Bis and Mr. Joost Bert 2.581.610 44,08% 2.581.610 44,08%
Treasury shares (Own shares) 451.569 7,71% 311.885 5,33%
Free Float 2.823.329 48,21% 2.963.013 50,59%
30
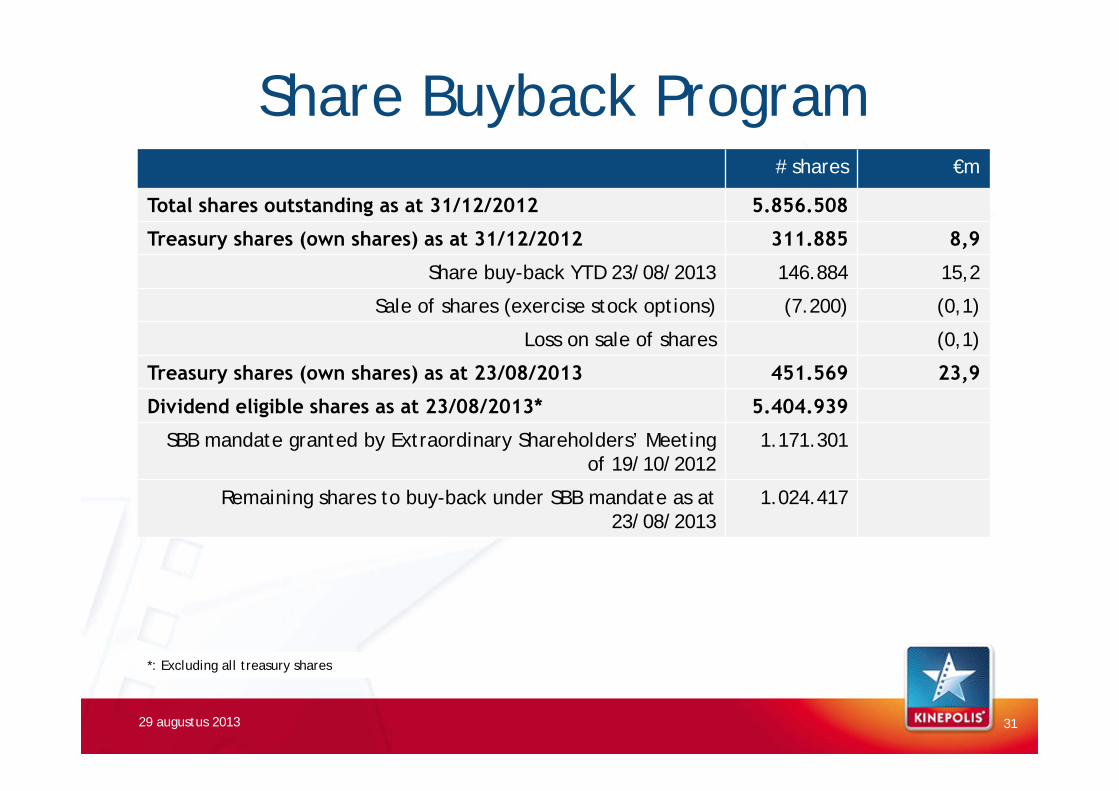
Share Buyback Program# shares €m
Total shares outstanding as at 31/12/2012 5.856.508
Treasury shares (own shares) as at 31/12/2012 311.885 8,9
Share buy-back YTD 23/08/2013 146.884 15,2
Sale of shares (exercise stock options) (7.200) (0,1)
Loss on sale of shares (0,1)
Treasury shares (own shares) as at 23/08/2013 451.569 23,9
Dividend eligible shares as at 23/08/2013* 5.404.939
SBB mandate granted by Extraordinary Shareholders’ Meeting of 19/10/2012
1.171.301
Remaining shares to buy-back under SBB mandate as at 23/08/2013
1.024.417
29 augustus 2013 31
*: Excluding all treasury shares

Financial Calendar
29 augustus 2013
Thursday 14/11/2013 Business update Q3 2013
Thursday 20/02/2014 Analysts and Press Meeting FY 2013
Thursday 15/05/2014 Business update Q1 2014
Friday 16/05/2014 Annual Shareholders’ Meeting
32

Q & A
Thank You.
29 augustus 2013 33

AnnexesFinancial Statements
Results Half 1 2013
34

Consolidated Income Statement €m H1 2013 H1 2012 % Better /
(Worse)Revenue 109,7 117,3 (6,5)%
Cost of sales (77,0) (82,5) 6,6%
Gross profit 32,7 34,9 (6,3)%
Gross profit % 29,8% 29,7%
Marketing & selling expenses (5,7) (6,0) 5,4%
Administrative expenses (7,1) (7,6) 7,2%
Other operating income and expenses 1,6 0,8 96,1%
EBIT 21,5 22,1 (2,5)%
EBIT % 19,6% 18,8%
Financial result (3,1) (2,5) (24,3)%
Profit before tax 18,4 19,6 (5,9)%
Income tax expense (4,1) (4,7) 11,6%
Profit 14,3 14,9 (4,1)%
Profit % 13,0% 12,7%
EBITDA 30,9 31,7 (2,4)%
EBITDA % 28,2% 27,0%
29 augustus 2013 35

Current Income Statement €m H1 2013 H1 2012 % Better /
(Worse)Revenue 109,7 117,3 (6,5)%
Cost of sales (76,7) (82,3) 6,8%
Gross profit 33,0 35,0 (5,8)%
Gross profit % 30,1% 29,9%
Marketing & selling expenses (5,7) (6,0) 5,1%
Administrative expenses (6,9) (7,1) 4,0%
Other operating income & expenses 0,6 0,3 70,1%
REBIT 21,0 22,2 (5,5)%
REBIT % 19,1% 18,9%
Financial result (3,1) (2,5) (24,3)%
Profit before tax 17,9 19,7 (9,3)%
Income tax expense (4,0) (4,7) 14,5%
Current profit 13,9 15,0 (7,6)%
Current profit % 12,6% 12,8%
REBITDA 30,7 32,1 (4,5)%
REBITDA % 27,9% 27,4%
29 augustus 2013 36

Consolidated Balance Sheet (1)€m 30/06/2013 31/12/2012 % Better /
(Worse)Intangible assets 3,3 3,3 1,0%
Goodwill 18,8 18,8 0,0%
Property, plant & equipment 209,8 214,4 (2,2)%
Investment property 10,7 11,5 (6,8)%
Deferred tax assets 0,9 0,7 23,9%
Other receivables 13,6 13,2 3,7%
Other financial assets 0,0 0,0 0,0%
Total non-current assets 257,1 261,9 (1,8)%
Assets held for sale 7,8 8,7 (10,1)%
Inventories 3,1 3,2 (3,4)%
Trade & other receivables 20,5 23,3 (12,0)%
Current income taxes 0,7 1,7 (57,1)%
Cash & cash equivalents 18,4 28,8 (36,3)%
Total current assets 50,5 65,7 (23,1)%
TOTAL ASSETS 307,6 327,6 (6,1)%
29 augustus 2013 37

Consolidated Balance Sheet (2)€m 30/06/2013 31/12/2012 % Better /
(Worse)Capital & Share premium 20,1 20,1 0,0%
Consolidated reserves 79,2 89,8 (11,8)%
Translation differences (2,0) (1,2) (71,5)%
Equity attributable to equity holders of the parents 97,3 108,7 (10,5)%
Non-controlling interests 0,0 0,0 0,0%
Total equity 97,3 108,7 (10,5)%
Interest bearing loans & borrowings 86,2 81,7 5,5%
Provisions & employee benefits 3,0 3,8 (21,6)%
Deferred tax liabilities 17,8 17,4 2,2%
Derivatives 0,0 0,1 (100,0%)
Other payables 8,4 8,6 (2,8)%
Total non-current liabilities 115,4 111,7 3,3%
Interest bearing loans & borrowings & Bank overdrafts 40,1 37,7 6,3%
Trade & other payables 48,3 64,3 (24,8)%
Provisions 0,3 0,3 12,7%
Derivatives 0,3 0,5 (48,2)%
Current income tax liabilities 5,9 4,4 35,5%
Total current liabilities 94,9 107,2 (11,4)%
TOTAL EQUITY & LIABILITIES 307,6 327,6 (6,1)%
29 augustus 2013 38
29 augustus 2013
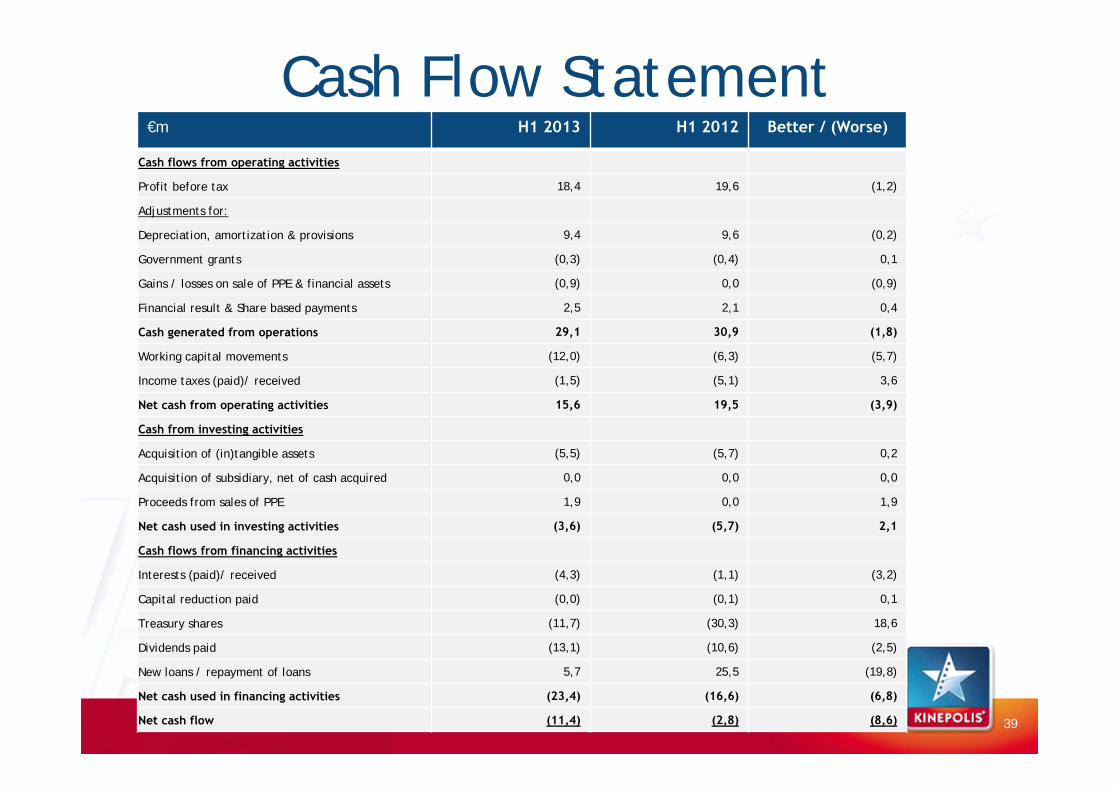
Cash Flow Statement€m H1 2013 H1 2012 Better / (Worse)
Cash flows from operating activities
Profit before tax 18,4 19,6 (1,2)
Adjustments for:
Depreciation, amortization & provisions 9,4 9,6 (0,2)
Government grants (0,3) (0,4) 0,1
Gains / losses on sale of PPE & financial assets (0,9) 0,0 (0,9)
Financial result & Share based payments 2,5 2,1 0,4
Cash generated from operations 29,1 30,9 (1,8)
Working capital movements (12,0) (6,3) (5,7)
Income taxes (paid)/ received (1,5) (5,1) 3,6
Net cash from operating activities 15,6 19,5 (3,9)
Cash from investing activities
Acquisition of (in)tangible assets (5,5) (5,7) 0,2
Acquisition of subsidiary, net of cash acquired 0,0 0,0 0,0
Proceeds from sales of PPE 1,9 0,0 1,9
Net cash used in investing activities (3,6) (5,7) 2,1
Cash flows from financing activities
Interests (paid)/ received (4,3) (1,1) (3,2)
Capital reduction paid (0,0) (0,1) 0,1
Treasury shares (11,7) (30,3) 18,6
Dividends paid (13,1) (10,6) (2,5)
New loans / repayment of loans 5,7 25,5 (19,8)
Net cash used in financing activities (23,4) (16,6) (6,8)
Net cash flow (11,4) (2,8) (8,6) 39

Free Cash Flow€m H1 2013 H1 2012 Better /
(Worse)Cash Flow before WC movements & tax paid 29,1 30,8 (1,7)
Income taxes paid (1,5) (5,1) 3,6
Working capital (12,0) (6,2) (5,8)
Capital exp – maintenance (3,7) (2,8) (0,9)
Interest paid (4,3) (1,1) (3,2)
Free cash flow 7,6 15,6 (8,0)
Capital exp - digitalization, expansion, remodeling (1,8) (2,9) 1,1
Sale financial assets & PPE 1,9 0,0 1,9
Capital reduction paid (0,0) (0,1) 0,1
Treasury shares (11,7) (30,3) 18,6
Dividend payments (13,1) (10,6) (2,5)
CF after expansion exp, dividends & treasury shares
(17,1) (28,3) 11,2
29 augustus 2013 40


![IS LEASING 2012.pptx [Read-Only]...TL Million 31 December 2011 31 December 2012 Change (%) Leasing Receivables, Net 1.398 1.391 -1% Non Performing Receivables 110 102 -7% Provisions](https://img.pdfslide.us/doc/110x75/60cec6936015e4156a7f51fd/is-leasing-2012pptx-read-only-tl-million-31-december-2011-31-december-2012.jpg)

