Embed Size (px)
Citation preview

Falabella Peru Corporate Presentation
September 2 0 1 7
CONTENTS FALABELLA GROUP
FALABELLA PERU:
GENERAL INFORMATION
BUSINESS UNITS OVERVIEW
CONSOLIDATED FINANCIALS
FALABELLA GROUP
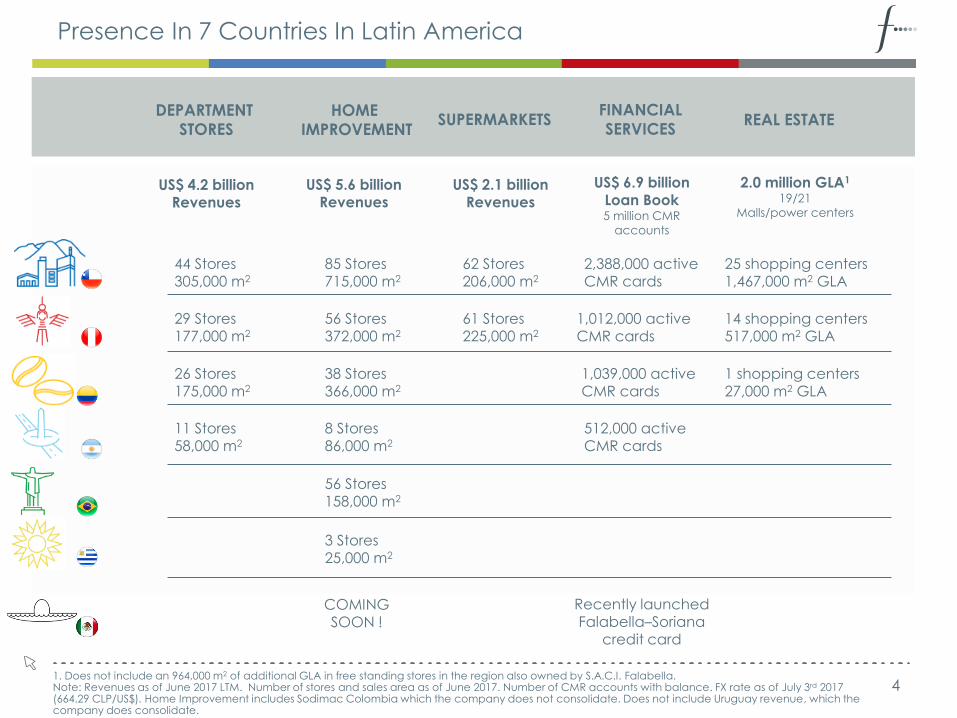
Presence In 7 Countries In Latin America
US$ 4.2 billion
Revenues
1. Does not include an 964,000 m2 of additional GLA in free standing stores in the region also owned by S.A.C.I. Falabella. Note: Revenues as of June 2017 LTM. Number of stores and sales area as of June 2017. Number of CMR accounts with balance. FX rate as of July 3rd 2017 (664.29 CLP/US$). Home Improvement includes Sodimac Colombia which the company does not consolidate. Does not include Uruguay revenue, which the company does consolidate.
DEPARTMENT
STORES HOME
IMPROVEMENT SUPERMARKETS
FINANCIAL
SERVICES REAL ESTATE
44 Stores 305,000 m2
29 Stores
177,000 m2
26 Stores
175,000 m2
11 Stores 58,000 m2
85 Stores 715,000 m2
56 Stores
372,000 m2
38 Stores
366,000 m2
8 Stores 86,000 m2
US$ 5.6 billion Revenues
62 Stores 206,000 m2
61 Stores
225,000 m2
US$ 2.1 billion Revenues
2,388,000 active CMR cards
1,012,000 active
CMR cards
1,039,000 active CMR cards
512,000 active CMR cards
US$ 6.9 billion
Loan Book 5 million CMR
accounts
25 shopping centers 1,467,000 m2 GLA
14 shopping centers
517,000 m2 GLA
1 shopping centers
27,000 m2 GLA
2.0 million GLA1
19/21
Malls/power centers
56 Stores 158,000 m2
3 Stores 25,000 m2
COMING SOON !
Recently launched Falabella–Soriana
credit card
4
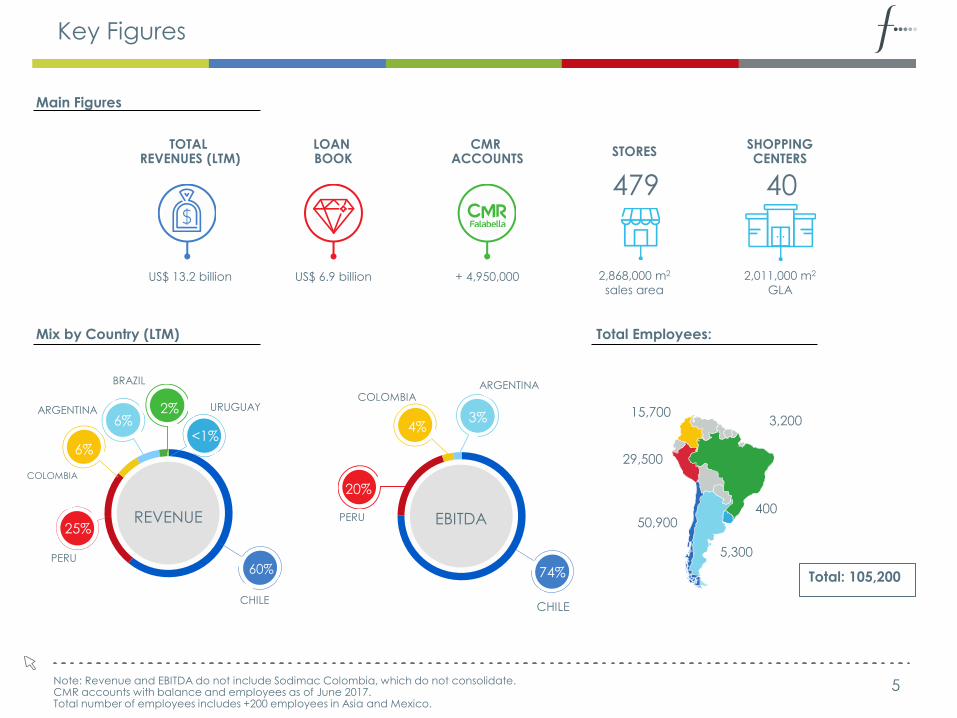
Key Figures
3% 4%
20%
74%
Note: Revenue and EBITDA do not include Sodimac Colombia, which do not consolidate. CMR accounts with balance and employees as of June 2017. Total number of employees includes +200 employees in Asia and Mexico.
US$ 13.2 billion
Main Figures
Mix by Country (LTM)
CMR ACCOUNTS
STORES SHOPPING CENTERS
LOAN BOOK
TOTAL REVENUES (LTM)
US$ 6.9 billion 2,868,000 m2
sales area
2,011,000 m2
GLA
479 40
Total Employees:
3,200 15,700
400
29,500
50,900
5,300
6%
6%
25%
<1%
60%
2% ARGENTINA
COLOMBIA
PERU
URUGUAY
BRAZIL
CHILE
REVENUE
+ 4,950,000
EBITDA
ARGENTINA COLOMBIA
PERU
CHILE
Total: 105,200
5
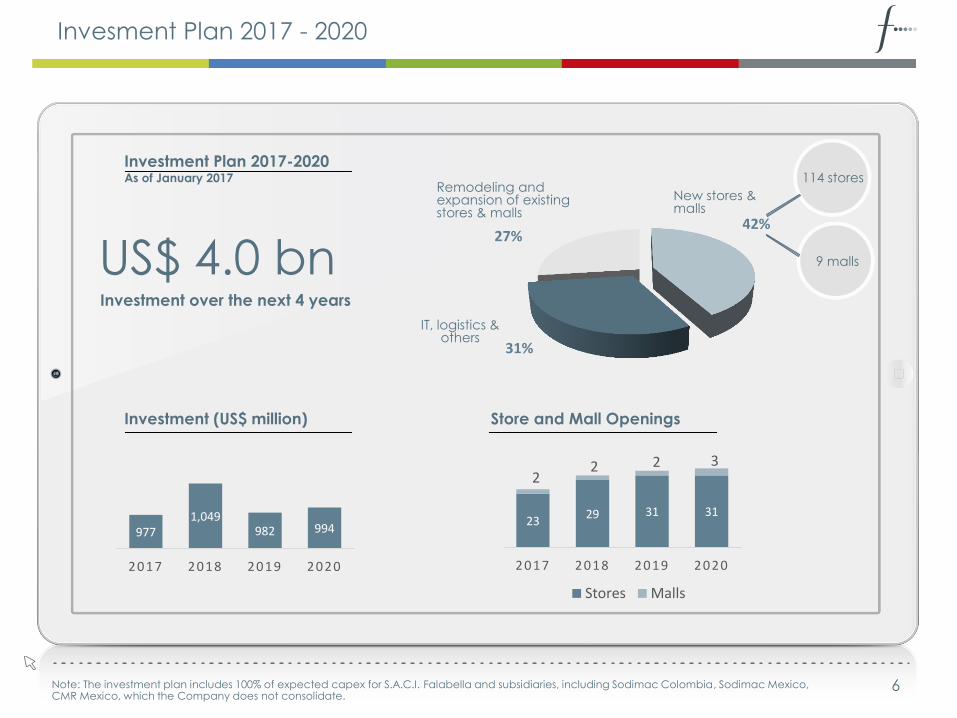
Invesment Plan 2017 - 2020
Investment Plan 2017-2020 As of January 2017
Store and Mall Openings Investment (US$ million)
US$ 4.0 bn Investment over the next 4 years
Remodeling and expansion of existing stores & malls
23 29 31 31
2 2 2 3
2017 2018 2019 2020
Stores Malls
977 1,049
982 994
2017 2018 2019 2020
42%
31%
27%
New stores & malls
IT, logistics & others
114 stores
9 malls
Note: The investment plan includes 100% of expected capex for S.A.C.I. Falabella and subsidiaries, including Sodimac Colombia, Sodimac Mexico, CMR Mexico, which the Company does not consolidate.
6

FALABELLA PERU:
GENERAL INFORMATION
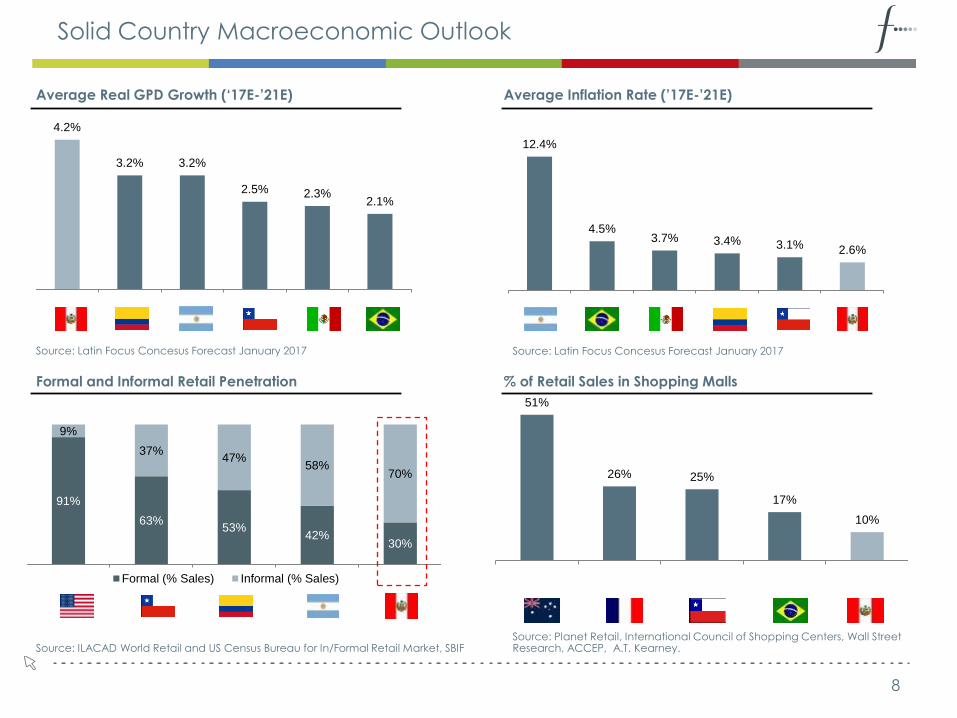
Solid Country Macroeconomic Outlook
Average Real GPD Growth (‘17E-’21E)
51%
26% 25%
17%
10%
91%
63% 53%
42% 30%
9%
37% 47%
58% 70%
Formal (% Sales) Informal (% Sales)
4.2%
3.2% 3.2%
2.5% 2.3% 2.1%
Average Inflation Rate (’17E-’21E)
Source: Latin Focus Concesus Forecast January 2017
12.4%
4.5% 3.7% 3.4% 3.1% 2.6%
Source: Latin Focus Concesus Forecast January 2017
Formal and Informal Retail Penetration % of Retail Sales in Shopping Malls
Source: ILACAD World Retail and US Census Bureau for In/Formal Retail Market, SBIF Source: Planet Retail, International Council of Shopping Centers, Wall Street Research, ACCEP, A.T. Kearney.
8
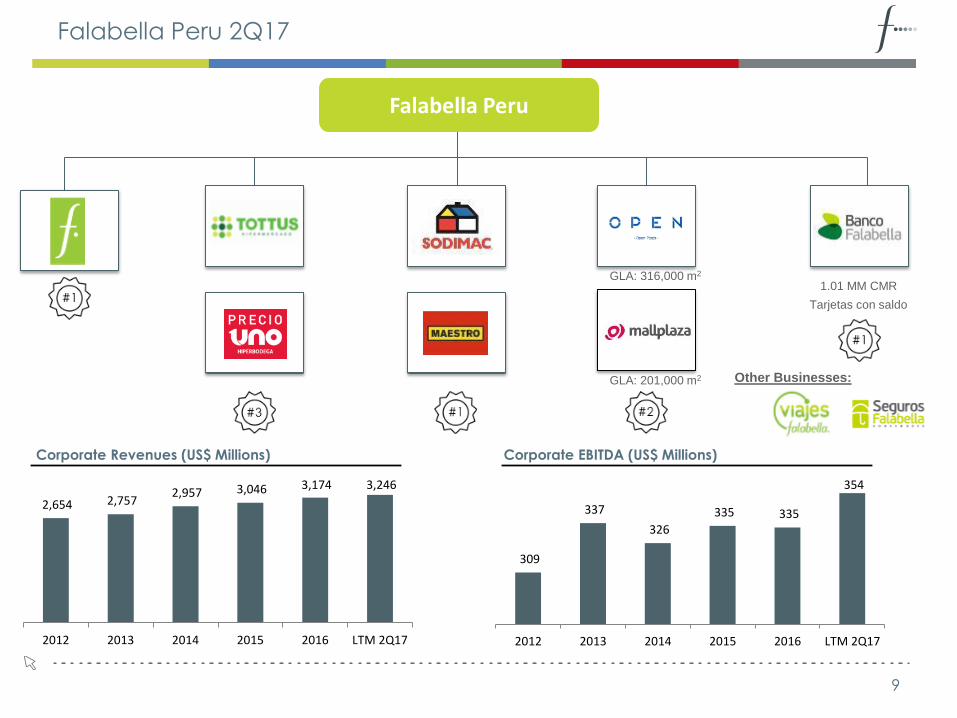
Falabella Peru 2Q17
Corporate Revenues (US$ Millions) Corporate EBITDA (US$ Millions)
Other Businesses: — GLA: 201,000 m2
1.01 MM CMR
Tarjetas con saldo
— GLA: 316,000 m2
Falabella Peru
9
2,654 2,757 2,957 3,046 3,174 3,246
2012 2013 2014 2015 2016 LTM 2Q17
309
337
326
335 335
354
2012 2013 2014 2015 2016 LTM 2Q17
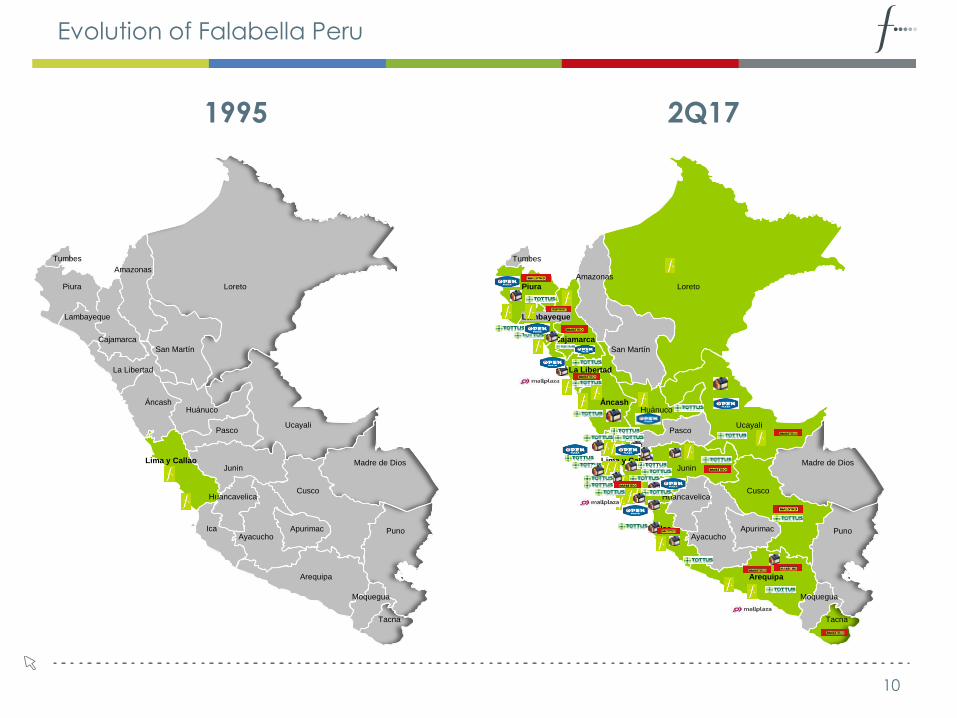
Evolution of Falabella Peru
2Q17 1995
Loreto
Amazonas
Piura
Tumbes
Lambayeque
Cajamarca
San Martín
La Libertad
Áncash Huánuco
Pasco Ucayali
Junin Lima y Callao Madre de Dios
Cusco Huancavelica
Ayacucho
Arequipa
Puno
Moquegua
Tacna
Ica Apurimac
Loreto
Amazonas
Piura
Tumbes
Lambayeque
Cajamarca
San Martín
La Libertad
Áncash Huánuco
Pasco Ucayali
Junin Lima y Callao Madre de Dios
Cusco Huancavelica
Ayacucho
Arequipa
Puno
Moquegua
Tacna
Ica Apurimac
10
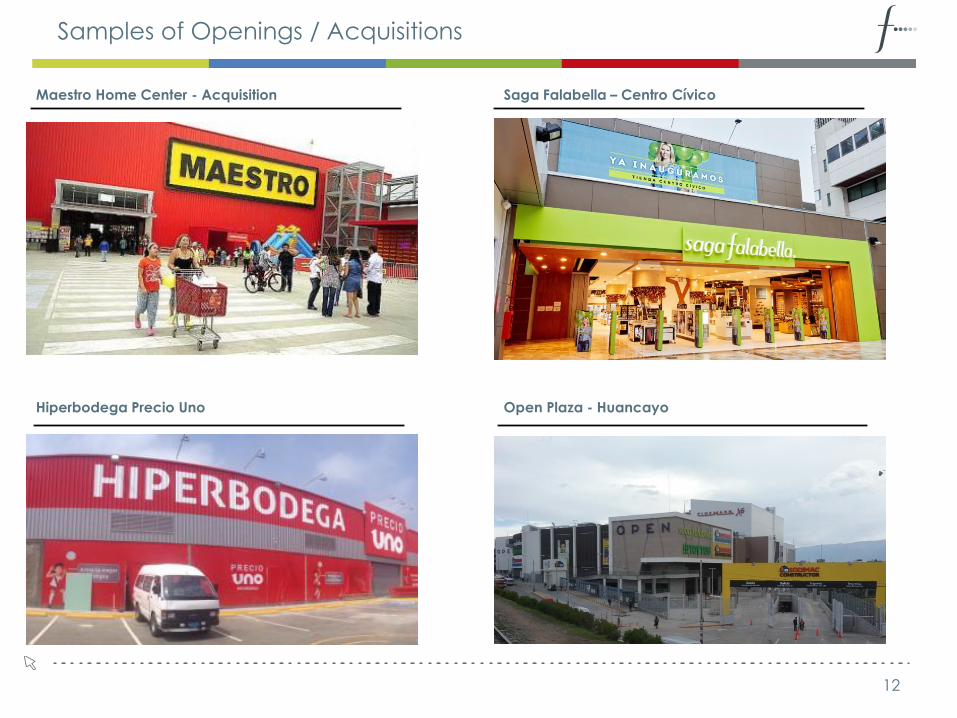
Samples of Openings / Acquisitions
Maestro Home Center - Acquisition Saga Falabella – Centro Cívico
Hiperbodega Precio Uno Open Plaza - Huancayo
12
FALABELLA PERU:
BUSINESS UNITS OVERVIEW
16
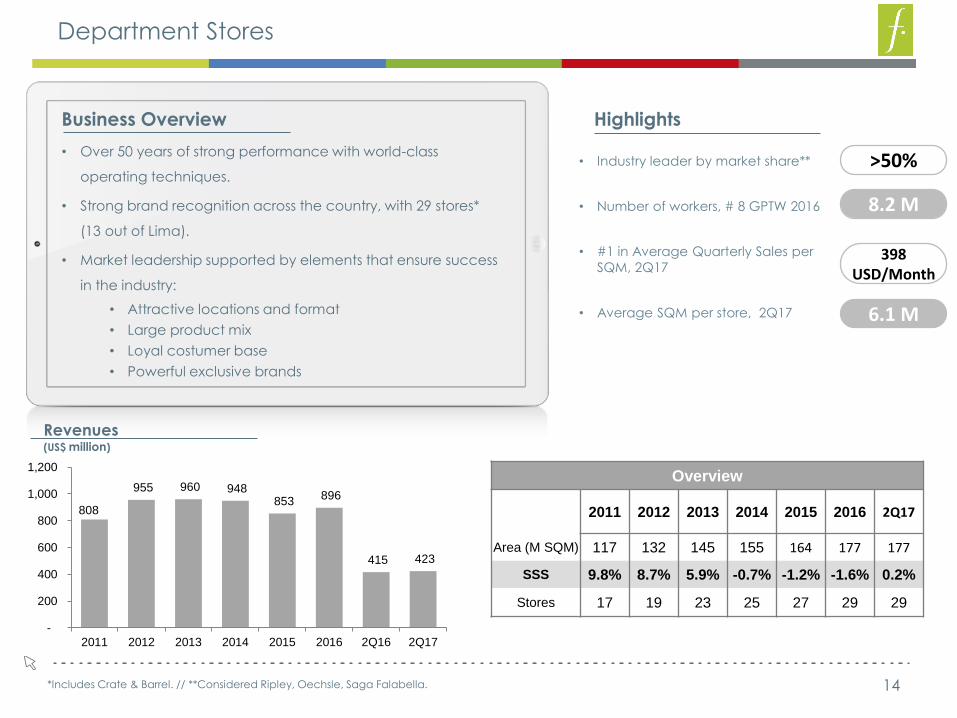
Department Stores
14
Highlights
• Industry leader by market share**
• Number of workers, # 8 GPTW 2016
• #1 in Average Quarterly Sales per
SQM, 2Q17
• Average SQM per store, 2Q17
Overview
2011 2012 2013 2014 2015 2016 2Q17
Area (M SQM) 117 132 145 155 164 177 177
SSS 9.8% 8.7% 5.9% -0.7% -1.2% -1.6% 0.2%
Stores 17 19 23 25 27 29 29
Revenues (US$ million)
8.2 M
>50%
398 USD/Month
6.1 M
Business Overview
• Over 50 years of strong performance with world-class
operating techniques.
• Strong brand recognition across the country, with 29 stores*
(13 out of Lima).
• Market leadership supported by elements that ensure success
in the industry:
• Attractive locations and format
• Large product mix
• Loyal costumer base
• Powerful exclusive brands
*Includes Crate & Barrel. // **Considered Ripley, Oechsle, Saga Falabella.
808
955 960 948 853
896
415 423
2011 2012 2013 2014 2015 2016 2Q16 2Q17
-
200
400
600
800
1,000
1,200
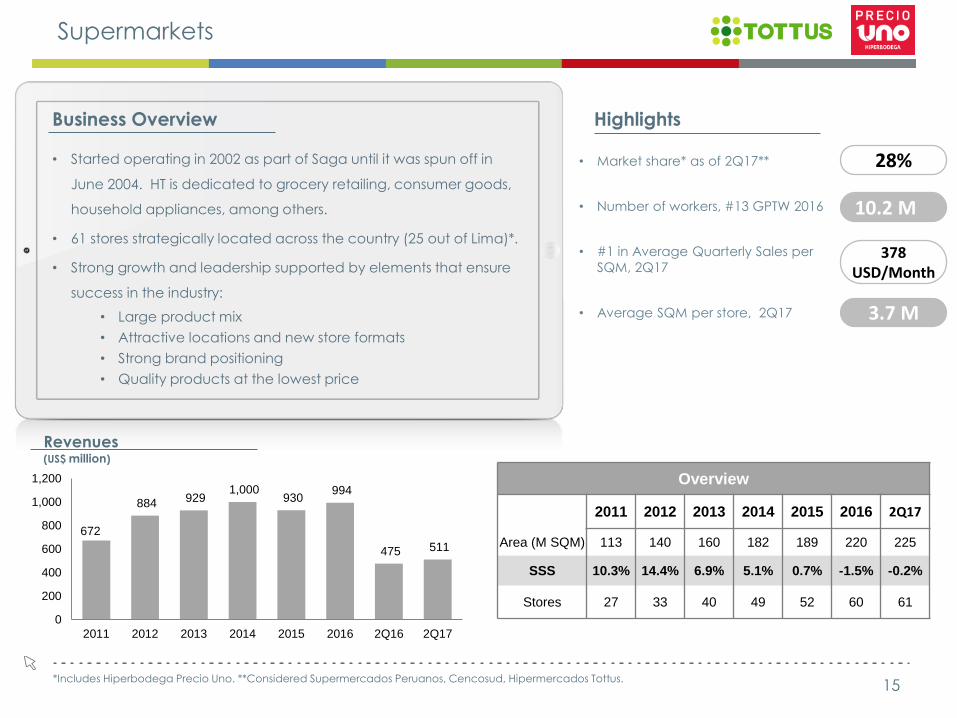
Supermarkets
15
• Started operating in 2002 as part of Saga until it was spun off in
June 2004. HT is dedicated to grocery retailing, consumer goods,
household appliances, among others.
• 61 stores strategically located across the country (25 out of Lima)*.
• Strong growth and leadership supported by elements that ensure
success in the industry:
• Large product mix
• Attractive locations and new store formats
• Strong brand positioning
• Quality products at the lowest price
Business Overview
• Market share* as of 2Q17**
• Number of workers, #13 GPTW 2016
• #1 in Average Quarterly Sales per
SQM, 2Q17
• Average SQM per store, 2Q17
10.2 M
28%
378 USD/Month
3.7 M
Revenues (US$ million)
Overview
2011 2012 2013 2014 2015 2016 2Q17
Area (M SQM) 113 140 160 182 189 220 225
SSS 10.3% 14.4% 6.9% 5.1% 0.7% -1.5% -0.2%
Stores 27 33 40 49 52 60 61
Highlights
*Includes Hiperbodega Precio Uno. **Considered Supermercados Peruanos, Cencosud, Hipermercados Tottus.
672
884 929 1,000
930 994
475 511
0
200
400
600
800
1,000
1,200
2011 2012 2013 2014 2015 2016 2Q16 2Q17
Home Improvement
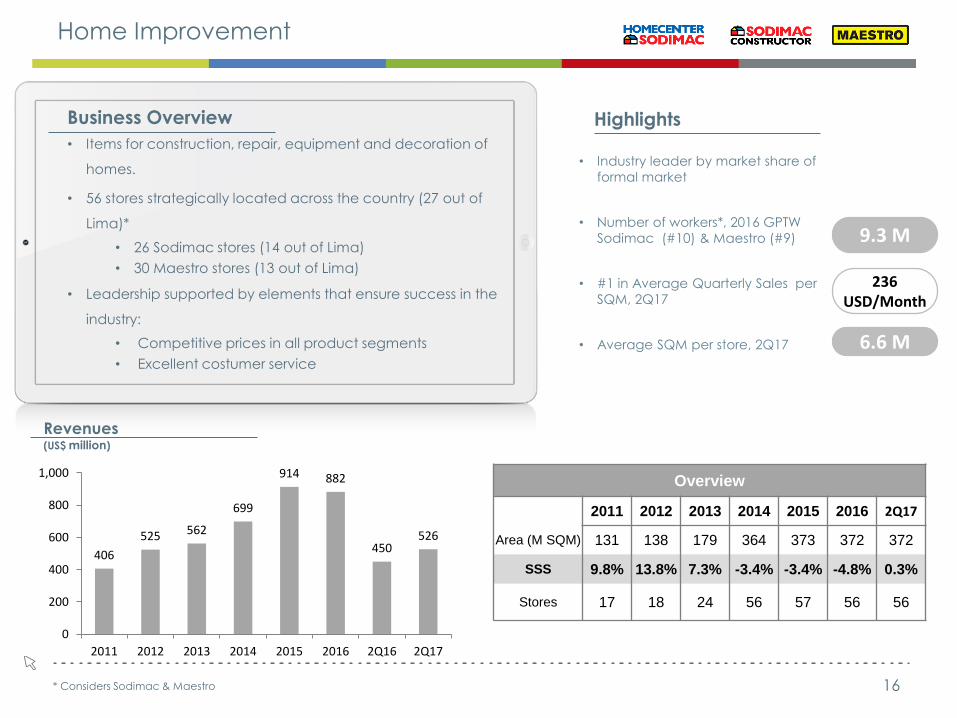
16 * Considers Sodimac & Maestro
• Items for construction, repair, equipment and decoration of
homes.
• 56 stores strategically located across the country (27 out of
Lima)*
• 26 Sodimac stores (14 out of Lima)
• 30 Maestro stores (13 out of Lima)
• Leadership supported by elements that ensure success in the
industry:
• Competitive prices in all product segments
• Excellent costumer service
Business Overview
• Industry leader by market share of
formal market
• Number of workers*, 2016 GPTW
Sodimac (#10) & Maestro (#9)
• #1 in Average Quarterly Sales per
SQM, 2Q17
• Average SQM per store, 2Q17
9.3 M
236 USD/Month
6.6 M
Highlights
Revenues (US$ million)
Overview
2011 2012 2013 2014 2015 2016 2Q17
Area (M SQM) 131 138 179 364 373 372 372
SSS 9.8% 13.8% 7.3% -3.4% -3.4% -4.8% 0.3%
Stores 17 18 24 56 57 56 56
406
525 562
699
914 882
450 526
0
200
400
600
800
1,000
2011 2012 2013 2014 2015 2016 2Q16 2Q17
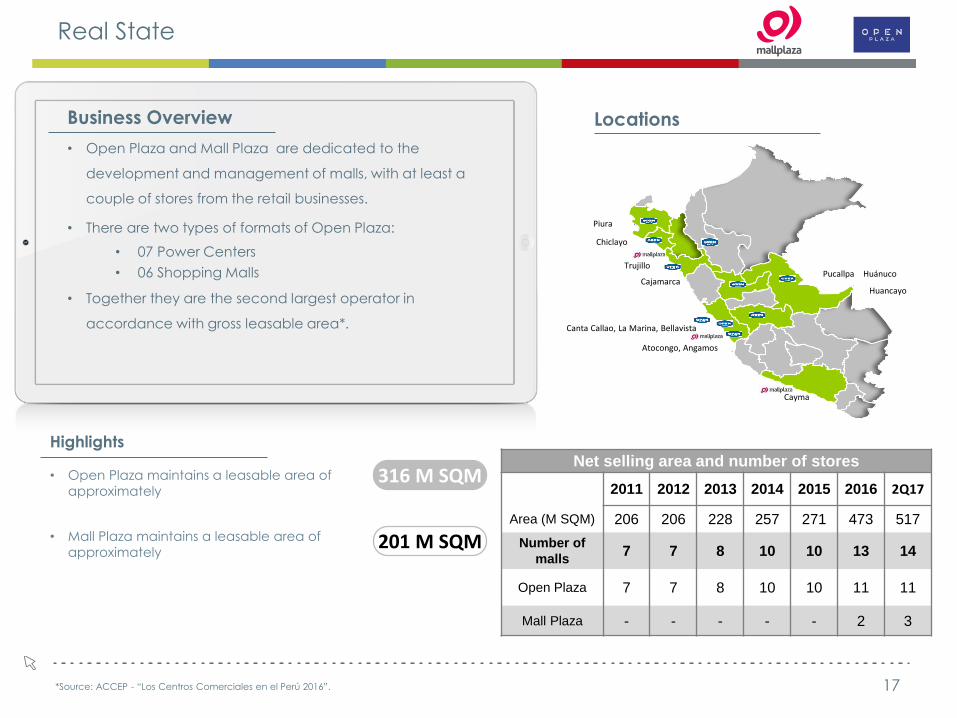
Real State
17
• Open Plaza and Mall Plaza are dedicated to the
development and management of malls, with at least a
couple of stores from the retail businesses.
• There are two types of formats of Open Plaza:
• 07 Power Centers
• 06 Shopping Malls
• Together they are the second largest operator in
accordance with gross leasable area*.
Business Overview Locations
Net selling area and number of stores
2011 2012 2013 2014 2015 2016 2Q17
Area (M SQM) 206 206 228 257 271 473 517
Number of
malls 7 7 8 10 10 13 14
Open Plaza 7 7 8 10 10 11 11
Mall Plaza - - - - - 2 3
Highlights
• Open Plaza maintains a leasable area of
approximately
• Mall Plaza maintains a leasable area of
approximately
316 M SQM
201 M SQM
*Source: ACCEP - “Los Centros Comerciales en el Perú 2016”.
Piura
Chiclayo
Trujillo
Canta Callao, La Marina, Bellavista
Atocongo, Angamos
Pucallpa Huánuco Cajamarca
Huancayo
Cayma
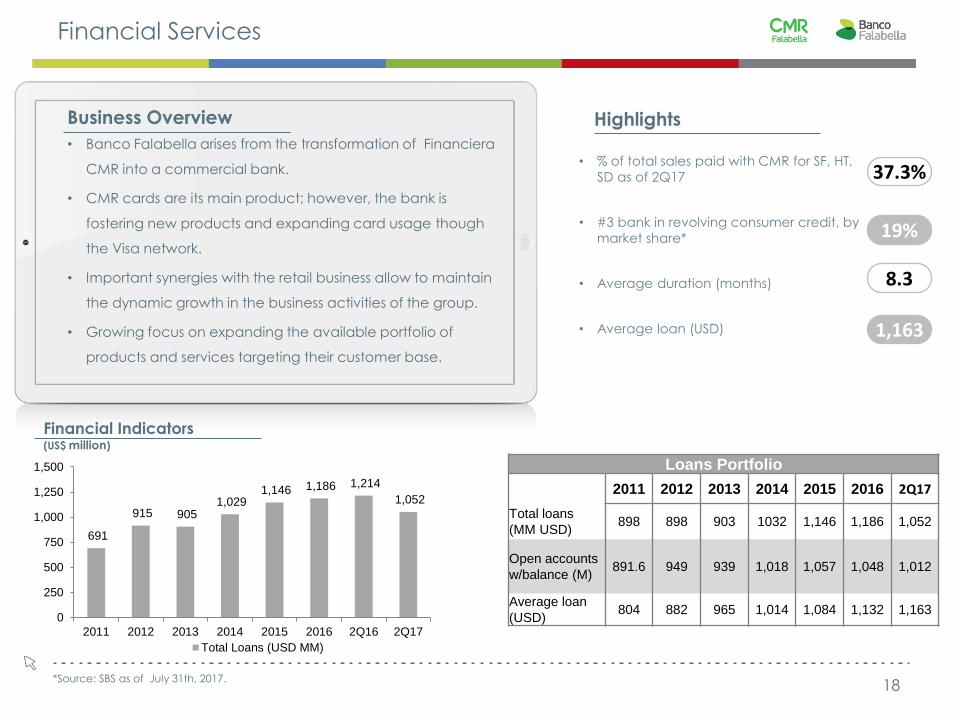
Financial Services
18
• Banco Falabella arises from the transformation of Financiera
CMR into a commercial bank.
• CMR cards are its main product; however, the bank is
fostering new products and expanding card usage though
the Visa network.
• Important synergies with the retail business allow to maintain
the dynamic growth in the business activities of the group.
• Growing focus on expanding the available portfolio of
products and services targeting their customer base.
Business Overview
• % of total sales paid with CMR for SF, HT,
SD as of 2Q17
• #3 bank in revolving consumer credit, by
market share*
• Average duration (months)
• Average loan (USD)
Highlights
Financial Indicators (US$ million)
19%
37.3%
8.3
1,163
Loans Portfolio
2011 2012 2013 2014 2015 2016 2Q17
Total loans
(MM USD) 898 898 903 1032 1,146 1,186 1,052
Open accounts
w/balance (M) 891.6 949 939 1,018 1,057 1,048 1,012
Average loan
(USD) 804 882 965 1,014 1,084 1,132 1,163
*Source: SBS as of July 31th, 2017.
691
915 905 1,029
1,146 1,186 1,214
1,052
2011 2012 2013 2014 2015 2016 2Q16 2Q17
0
250
500
750
1,000
1,250
1,500
Total Loans (USD MM)
FALABELLA PERU:
CONSOLIDATED FINANCIALS
22
Consolidated Statements
20
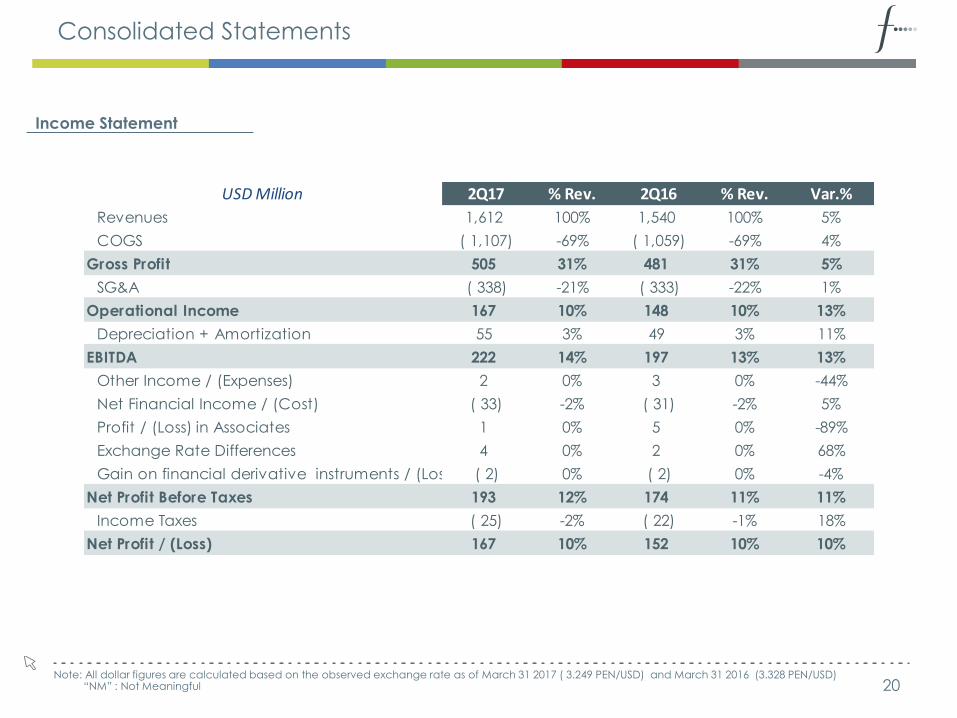
Income Statement
Note: All dollar figures are calculated based on the observed exchange rate as of March 31 2017 ( 3.249 PEN/USD) and March 31 2016 (3.328 PEN/USD) “NM” : Not Meaningful
USD Million 2Q17 % Rev. 2Q16 % Rev. Var.%
Revenues 1,612 100% 1,540 100% 5%
COGS ( 1,107) -69% ( 1,059) -69% 4%
Gross Profit 505 31% 481 31% 5%
SG&A ( 338) -21% ( 333) -22% 1%
Operational Income 167 10% 148 10% 13%
Depreciation + Amortization 55 3% 49 3% 11%
EBITDA 222 14% 197 13% 13%
Other Income / (Expenses) 2 0% 3 0% -44%
Net Financial Income / (Cost) ( 33) -2% ( 31) -2% 5%
Profit / (Loss) in Associates 1 0% 5 0% -89%
Exchange Rate Differences 4 0% 2 0% 68%
Gain on financial derivative instruments / (Loss) ( 2) 0% ( 2) 0% -4%
Net Profit Before Taxes 193 12% 174 11% 11%
Income Taxes ( 25) -2% ( 22) -1% 18%
Net Profit / (Loss) 167 10% 152 10% 10%
Consolidated Statements
21
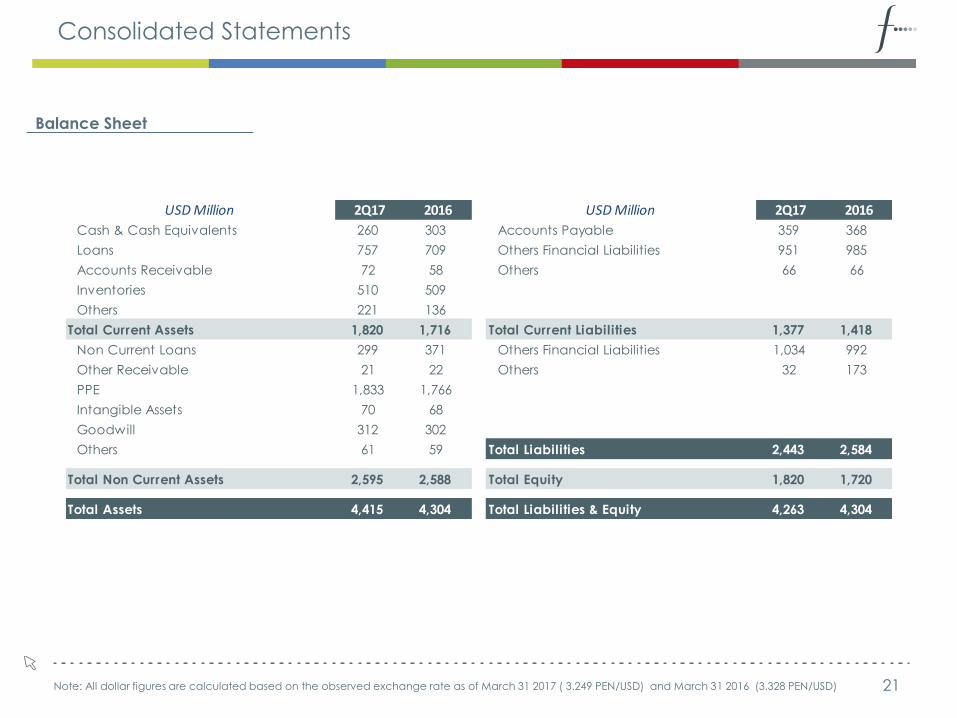
Balance Sheet
Note: All dollar figures are calculated based on the observed exchange rate as of March 31 2017 ( 3.249 PEN/USD) and March 31 2016 (3.328 PEN/USD)
USD Million 2Q17 2016 USD Million 2Q17 2016
Cash & Cash Equivalents 260 303 Accounts Payable 359 368
Loans 757 709 Others Financial Liabilities 951 985
Accounts Receivable 72 58 Others 66 66
Inventories 510 509
Others 221 136
Total Current Assets 1,820 1,716 Total Current Liabilities 1,377 1,418
Non Current Loans 299 371 Others Financial Liabilities 1,034 992
Other Receivable 21 22 Others 32 173
PPE 1,833 1,766
Intangible Assets 70 68
Goodwill 312 302
Others 61 59 Total Liabilities 2,443 2,584
Total Non Current Assets 2,595 2,588 Total Equity 1,820 1,720
Total Assets 4,415 4,304 Total Liabilities & Equity 4,263 4,304
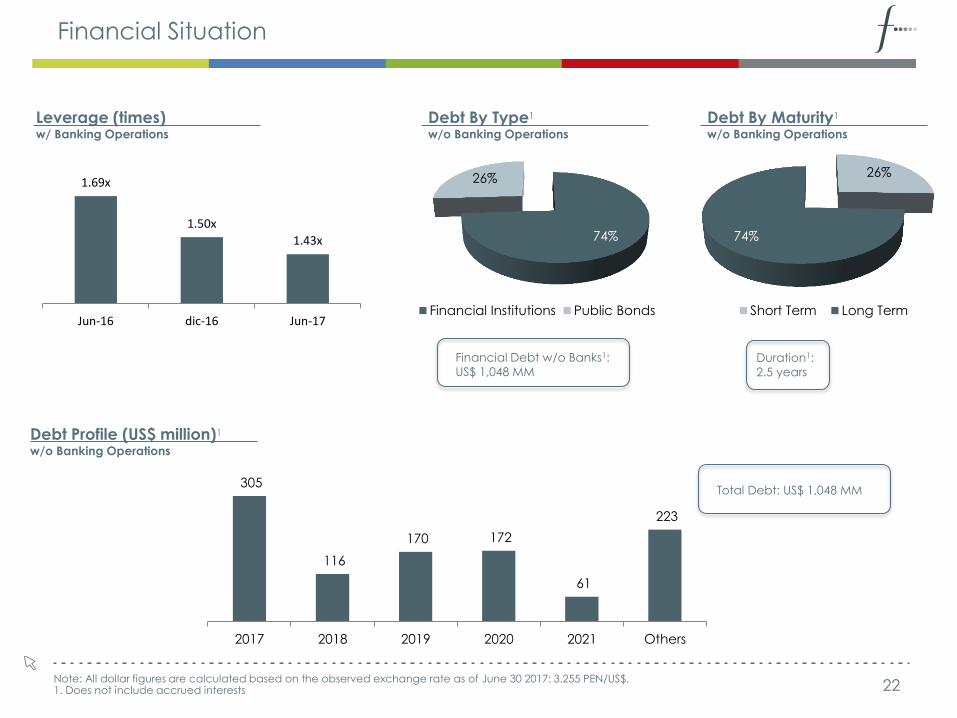
Financial Situation
22
Debt Profile (US$ million)1 w/o Banking Operations
Leverage (times) w/ Banking Operations
Debt By Type1 w/o Banking Operations
Debt By Maturity1 w/o Banking Operations
Financial Debt w/o Banks1:
US$ 1,048 MM Duration1:
2.5 years
Note: All dollar figures are calculated based on the observed exchange rate as of June 30 2017: 3.255 PEN/US$. 1. Does not include accrued interests
Total Debt: US$ 1,048 MM
1.69x
1.50x
1.43x
Jun-16 dic-16 Jun-17
26%
74%
Short Term Long Term
74%
26%
Financial Institutions Public Bonds
305
116
170 172
61
223
2017 2018 2019 2020 2021 Others

Falabella Peru Corporate Presentation
September 2 0 1 7