Embed Size (px)
Citation preview

0
Unicaja Banco
1Q 2020 Results Presentation
4th May 2020

1
Disclaimer
This presentation (the Presentation) has been prepared by Unicaja Banco, S.A. (the Company or Unicaja Banco) for informational use only.
The recipient of this presentation has the obligation of undertaking its own analysis of the Company. The information provided herein is not to be relied upon in substitution for the recipient's own exercise of independent judgment with regard
to the operations, financial condition and prospects of the Company. The information contained in this presentation does not purport to be comprehensive or to contain all the information that a prospective purchaser of securities of the
Company may desire or require in deciding whether or not to purchase such securities, and, unless otherwise stated, it has not been verified by the Company or any other person.
The information contained in the Presentation may be subject to change without notice and must not be relied upon for any purpose. Neither the Company nor any of affiliates, advisors or agents makes any representation or warranty,
express or implied, as to the fairness, accuracy, completeness or correctness of any information contained in this document and, by hereby, shall not be taken for granted. Each Unicaja Banco and its affiliates, advisors or agents expressly
disclaims any and all liabilities which may be based on this document, the information contained or referred to therein, any errors therein or omissions therefrom. Neither the Company, nor any of its affiliates, advisors or agents undertake
any obligation to provide the recipients with access to additional information or to update this document or to correct any inaccuracies in the information contained or referred to in the Presentation.
Unicaja Banco cautions that this Presentation may contain forward looking statements with respect to the business, financial condition, results of operations, strategy, plans and objectives of the Unicaja Banco and its affiliates. While these
forward looking statements represent Unicaja Banco’s judgment and future expectations concerning the development of its business, a certain number of risks, uncertainties and other important factors could cause actual developments and
results to differ materially from the current expectations of Unicaja Banco and its affiliates. These factors include, but are not limited to, (1) general market, macroeconomic, governmental, political and regulatory trends; (2) movements in
local and international securities markets, currency exchange rate and interest rates; (3) competitive pressures; (4) technical developments; and (5) changes in the financial position or credit worthiness of Unicaja Banco’s and its affiliates
customers, obligors and counterparts. These and other risk factors published in past and future filings and reports of Unicaja Banco, including those with the Spanish Securities and Exchange Commission (CNMV) and available to the public
both in Unicaja Banco’s website (https://www.unicajabanco.com) and in the CNMV’s website (https://www.cnmv.es), as well as other risk factors currently unknown or not foreseeable, which may be beyond Unicaja Banco’s control, could
adversely affect its business and financial performance and cause actual results to differ materially from those implied in the forward-looking statements.
Market and competitive position data in the Presentation has generally been obtained from industry publications and surveys or studies conducted by third-party sources. Peer firm information presented herein has been taken from peer firm
public reports. There are limitations with respect to the availability, accuracy, completeness and comparability of such data. Unicaja Banco has not independently verified such data and can provide no assurance of its accuracy or
completeness. Likewise, certain statements in the Presentation regarding the market and competitive position data are based on the internal analyses of Unicaja Banco, which involve certain assumptions and estimates. These internal
analyses have not been verified by any independent source and there can be no assurance that the assumptions or estimates are accurate. Accordingly, undue reliance should not be placed on any of the industry, market or Unicaja
Banco’s competitive position data contained in the Presentation.
This Presentation includes accounts and estimations issued by the management, which may have not been audited by the Company’s auditors. In addition, this document includes certain Alternative Performance Measures (APMs) as
defined in the guidelines on Alternative Performance Measures published by the European Securities and Markets Authority on 5 October 2015 (ESMA/2015/1415es) (the ESMA guidelines). This report uses certain APMs, which are
performance measures that have been calculated using the financial information from Unicaja Banco and its affiliates but that are not defined or detailed in the applicable financial framework and therefore have neither been audited nor are
capable of being completely audited. These APMs are aimed to enable a better understanding of Unicaja Banco’s and its affiliates’ financial performance but should be considered only as additional disclosures and in no case as a
replacement of the financial information prepared under International Financial Reporting Standards (IFRS). Moreover, the way the Unicaja Banco defines and calculates these measures may differ to the way these are calculated by other
companies, and therefore they may not be comparable. Please refer to Unicaja Banco’s past and future filings and reports including those with CNMV and available to the public both in Unicaja Banco’s website
(https://www.unicajabanco.com) and in the CNMV’s website (https://www.cnmv.es) for further details of the APMs used, including its definition or a reconciliation between any applicable management indicators and the financial data
presented in the consolidated financial statements prepared under IFRS. In any case, the financial information included in this Presentation has not been reviewed to the extent of its accuracy and completeness and, therefore, neither such
financial information nor the APMs shall be relied upon.
Neither this presentation nor any copy of it may be taken, transmitted into, disclosed or distributed in the United States, Canada, Australia or Japan. The distribution of this presentation in other jurisdictions may also be restricted by law and
persons into whose possession this presentation comes should inform themselves about and observe any such restrictions. The securities of the Company have not been and, should there be an offering, will not be registered under the
U.S. Securities Act of 1933, as amended (the Securities Act), or the U.S. Investment Company Act of 1940, as amended (the Investment Company Act). Such securities may not be offered or sold in the United States except on a limited
basis, if at all, to Qualified Institutional Buyers (as defined in Rule 144A under the Securities Act) in reliance on Rule 144A or another exemption from, or transaction not subject to, the registration requirements of the Securities Act. The
securities of the Company have not been and, should there be an offering, will not be registered under the applicable securities laws of any state or jurisdiction of Canada or Japan and, subject to certain exceptions, may not be offered or
sold within Canada or Japan or to or for the benefit of any national, resident or citizen of Canada or Japan.
THIS PRESENTATION DOES NOT CONSTITUTE OR FORM PART OF ANY OFFER FOR SALE OR SOLICITATION OF ANY OFFER TO BUY ANY SECURITIES NOR SHALL IT OR ANY PART OF IT FORM THE BASIS OF OR BE
RELIED ON IN CONNECTION WITH ANY CONTRACT OR COMMITMENT TO PURCHASE SHARES. ANY DECISION TO PURCHASE SHARES IN ANY OFFERING SHOULD BE MADE SOLELY ON THE BASIS OF PUBLICLY
AVAILABLE INFORMATION ON THE COMPANY.
By receiving or accessing to this Presentation you accept and agree to be bound by the foregoing terms, conditions and restrictions.
2
Index
Key highlights
Results & business
Asset quality, liquidity & solvency

3
Index
Key highlights
Results & business
Asset quality, liquidity & solvency
4
Summary of 1Q 2020 results
Business
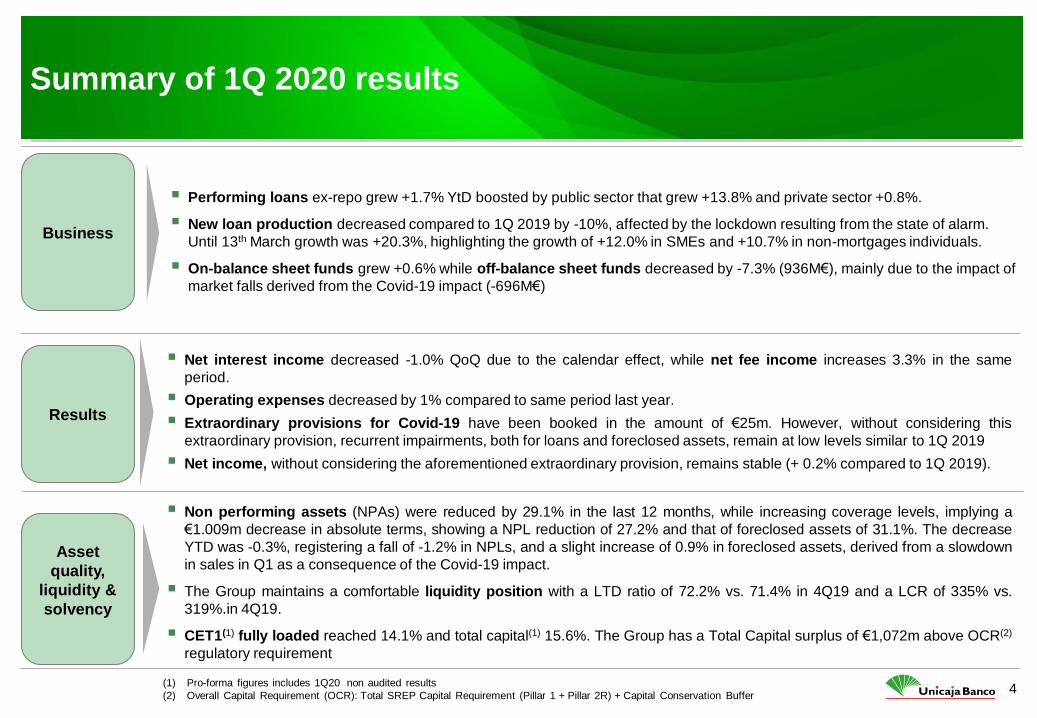
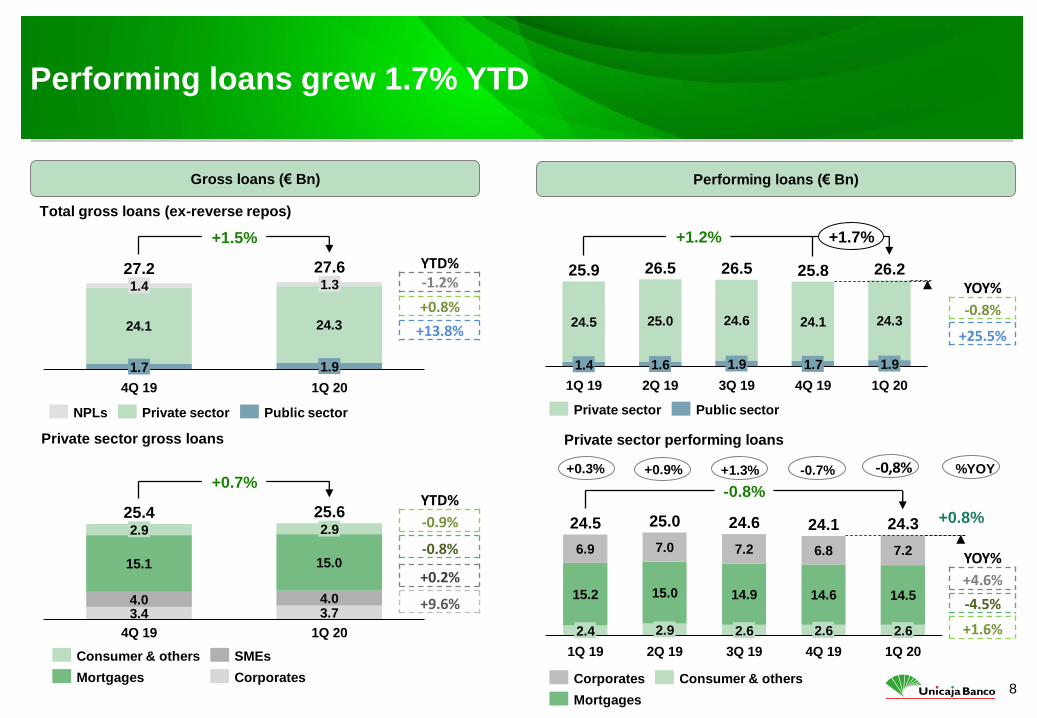
Performing loans ex-repo grew +1.7% YtD boosted by public sector that grew +13.8% and private sector +0.8%.
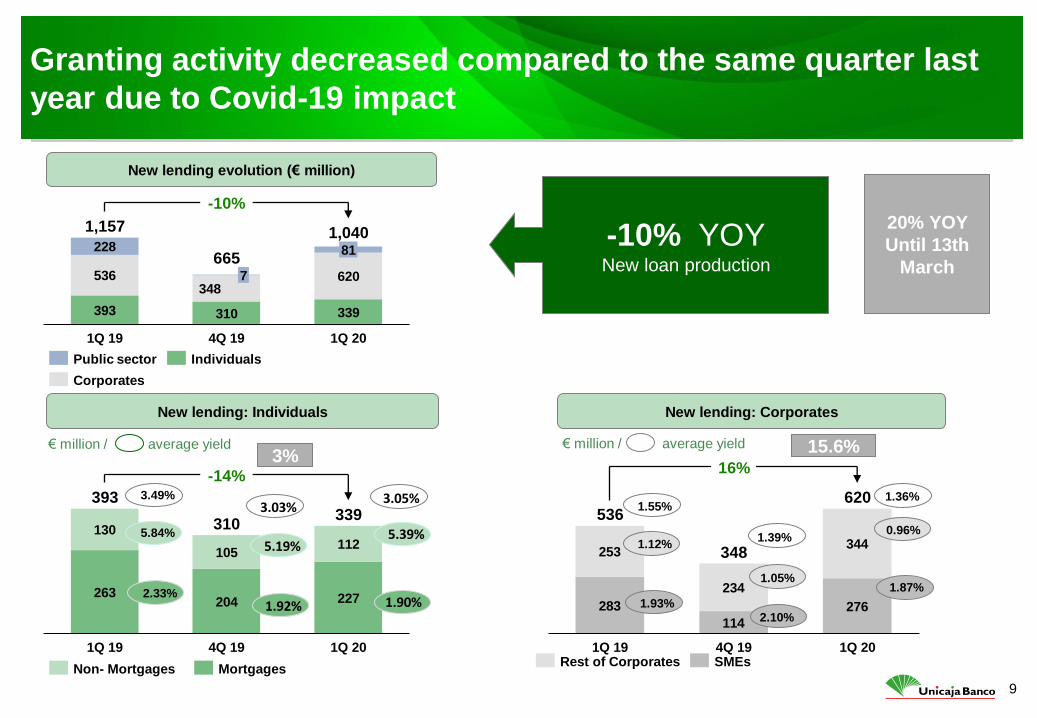
New loan production decreased compared to 1Q 2019 by -10%, affected by the lockdown resulting from the state of alarm.
Until 13th March growth was +20.3%, highlighting the growth of +12.0% in SMEs and +10.7% in non-mortgages individuals.
On-balance sheet funds grew +0.6% while off-balance sheet funds decreased by -7.3% (936M€), mainly due to the impact of
market falls derived from the Covid-19 impact (-696M€)
Results
Asset
quality,
liquidity &
solvency
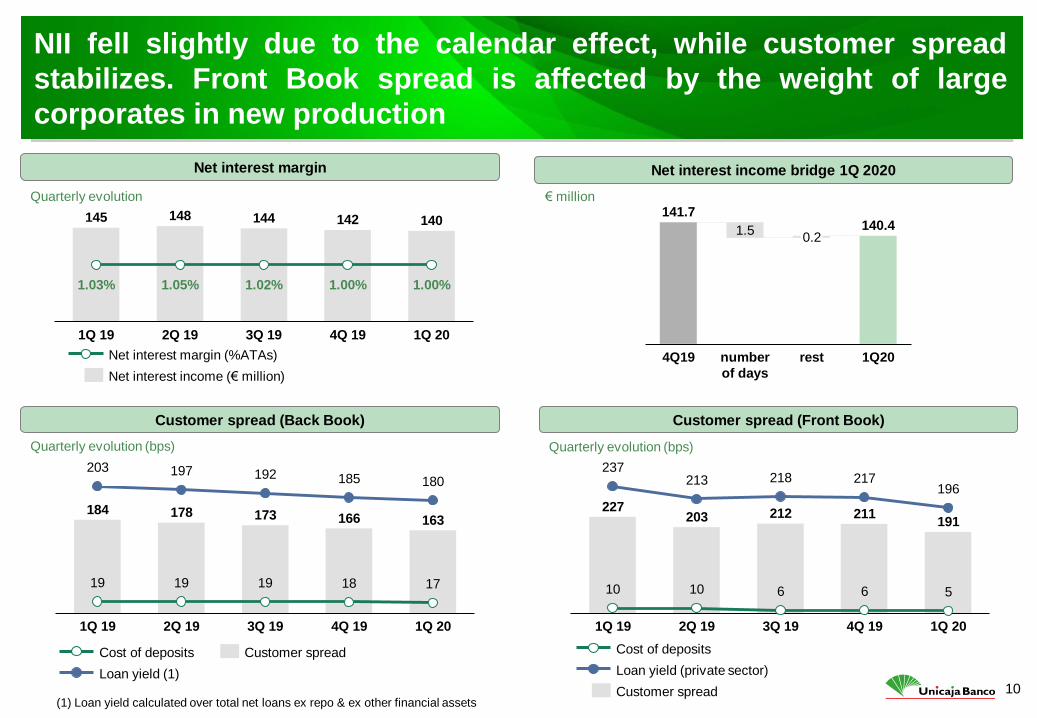
Net interest income decreased -1.0% QoQ due to the calendar effect, while net fee income increases 3.3% in the same
period.
Operating expenses decreased by 1% compared to same period last year.
Extraordinary provisions for Covid-19 have been booked in the amount of €25m. However, without considering this
extraordinary provision, recurrent impairments, both for loans and foreclosed assets, remain at low levels similar to 1Q 2019
Net income, without considering the aforementioned extraordinary provision, remains stable (+ 0.2% compared to 1Q 2019).
Non performing assets (NPAs) were reduced by 29.1% in the last 12 months, while increasing coverage levels, implying a
€1.009m decrease in absolute terms, showing a NPL reduction of 27.2% and that of foreclosed assets of 31.1%. The decrease
YTD was -0.3%, registering a fall of -1.2% in NPLs, and a slight increase of 0.9% in foreclosed assets, derived from a slowdown
in sales in Q1 as a consequence of the Covid-19 impact.
The Group maintains a comfortable liquidity position with a LTD ratio of 72.2% vs. 71.4% in 4Q19 and a LCR of 335% vs.
319%.in 4Q19.
CET1(1) fully loaded reached 14.1% and total capital(1) 15.6%. The Group has a Total Capital surplus of €1,072m above OCR(2)
regulatory requirement
(1) Pro-forma figures includes 1Q20 non audited results
(2) Overall Capital Requirement (OCR): Total SREP Capital Requirement (Pillar 1 + Pillar 2R) + Capital Conservation Buffer

5
Index
Key highlights
Results & business
Asset quality, liquidity & solvency
6
The Group's net profit, without the effect of the Covid-19
provisions remains stable
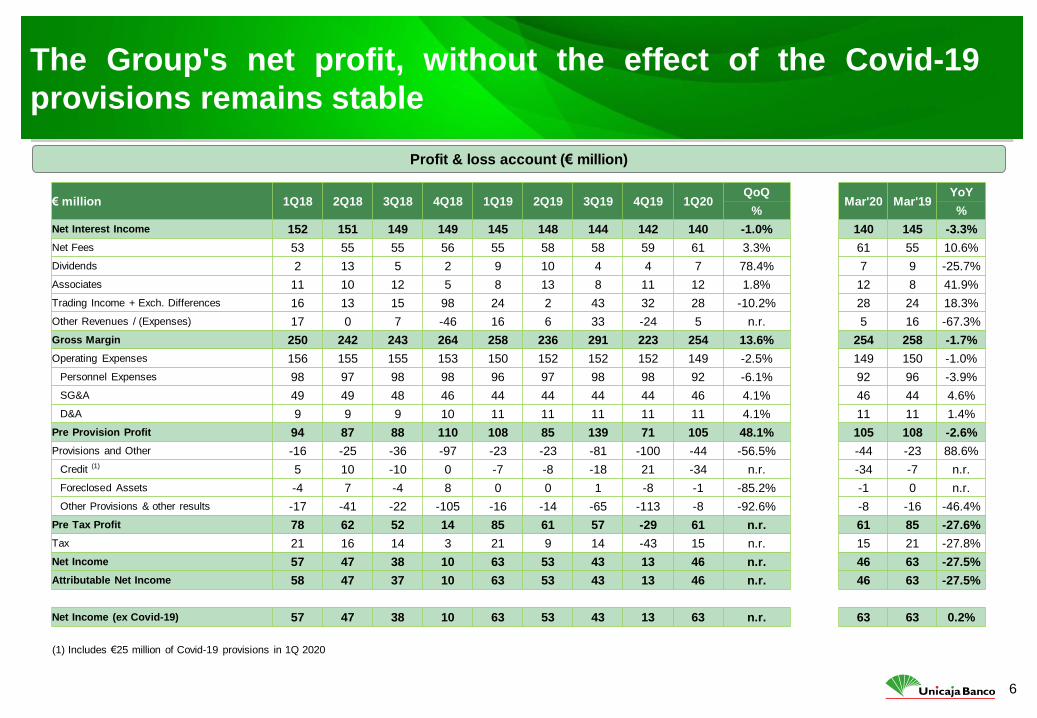
Profit & loss account (€ million)
€ million 1Q18 2Q18 3Q18 4Q18 1Q19 2Q19 3Q19 4Q19 1Q20 QoQ
Mar'20 Mar'19 YoY
% %
Net Interest Income 152 151 149 149 145 148 144 142 140 -1.0% 140 145 -3.3%
Net Fees 53 55 55 56 55 58 58 59 61 3.3% 61 55 10.6%
Dividends 2 13 5 2 9 10 4 4 7 78.4% 7 9 -25.7%
Associates 11 10 12 5 8 13 8 11 12 1.8% 12 8 41.9%
Trading Income + Exch. Differences 16 13 15 98 24 2 43 32 28 -10.2% 28 24 18.3%
Other Revenues / (Expenses) 17 0 7 -46 16 6 33 -24 5 n.r. 5 16 -67.3%
Gross Margin 250 242 243 264 258 236 291 223 254 13.6% 254 258 -1.7%
Operating Expenses 156 155 155 153 150 152 152 152 149 -2.5% 149 150 -1.0%
Personnel Expenses 98 97 98 98 96 97 98 98 92 -6.1% 92 96 -3.9%
SG&A 49 49 48 46 44 44 44 44 46 4.1% 46 44 4.6%
D&A 9 9 9 10 11 11 11 11 11 4.1% 11 11 1.4%
Pre Provision Profit 94 87 88 110 108 85 139 71 105 48.1% 105 108 -2.6%
Provisions and Other -16 -25 -36 -97 -23 -23 -81 -100 -44 -56.5% -44 -23 88.6%
Credit (1) 5 10 -10 0 -7 -8 -18 21 -34 n.r. -34 -7 n.r.
Foreclosed Assets -4 7 -4 8 0 0 1 -8 -1 -85.2% -1 0 n.r.
Other Provisions & other results -17 -41 -22 -105 -16 -14 -65 -113 -8 -92.6% -8 -16 -46.4%
Pre Tax Profit 78 62 52 14 85 61 57 -29 61 n.r. 61 85 -27.6%
Tax 21 16 14 3 21 9 14 -43 15 n.r. 15 21 -27.8%
Net Income 57 47 38 10 63 53 43 13 46 n.r. 46 63 -27.5%
Attributable Net Income 58 47 37 10 63 53 43 13 46 n.r. 46 63 -27.5%
Net Income (ex Covid-19) 57 47 38 10 63 53 43 13 63 n.r. 63 63 0.2%
(1) Includes €25 million of Covid-19 provisions in 1Q 2020
7
On-balance sheet customer funds grew 0.6% YTD, while off-
balance sheet customer funds decreased -7.3% due to the
strong valuation impact (-5.4%)
Off-balance sheet & insurance QoQ evolution (€ bn)
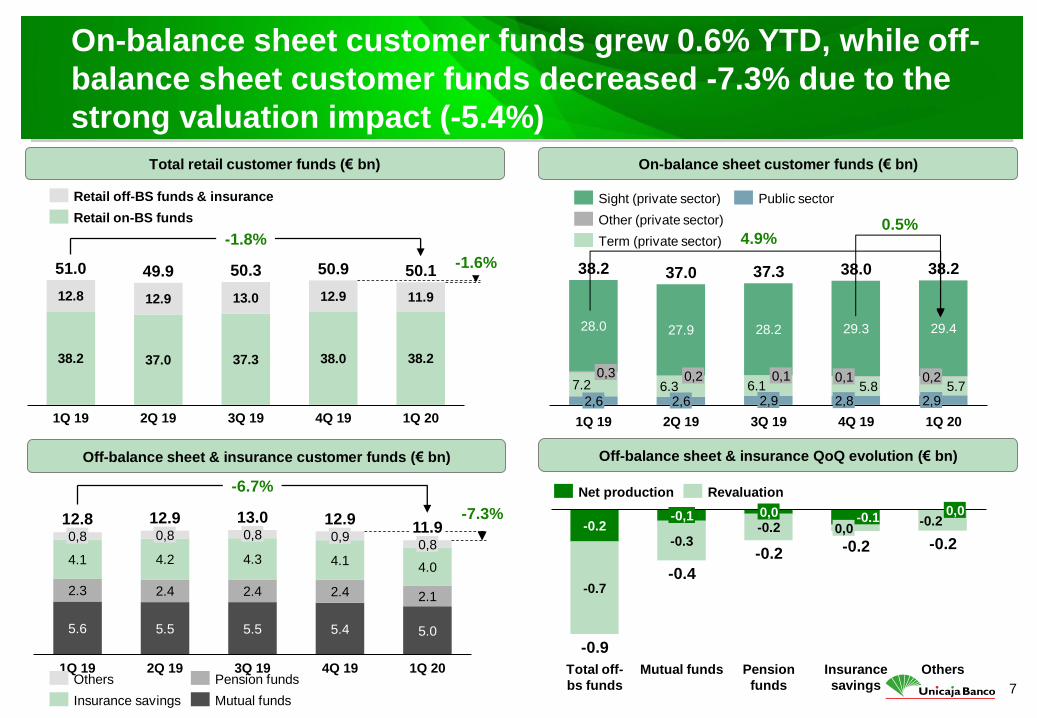
38.2 37.0 37.3 38.0 38.2
12.8 12.9 13.0 12.9 11.9
49.9
1Q 20 1Q 19 2Q 19 3Q 19 4Q 19
51.0 50.3 50.9 50.1 -1.6%
-1.8%
Retail off-BS funds & insurance
Retail on-BS funds
7.2 6.3 6.1 5.8 5.7
28.0 27.9 28.2 29.3 29.4
2,9
0,3
2,6
1Q 19 3Q 19
0,2
2Q 19
2,6
0,1 0,1
2,8
4Q 19
0,2
2,9
1Q 20
38.2 37.0 37.3 38.0 38.2
Sight (private sector)
Term (private sector)
Other (private sector)
Public sector
5.6 5.5 5.5 5.4 5.0
2.3 2.4 2.4 2.4 2.1
4.1 4.2 4.3 4.1 4.0
0,8
12.8
1Q 19
0,8
2Q 19
0,8
3Q 19 4Q 19
0,9 0,8
1Q 20
12.9 13.0 12.9 11.9
-7.3%
-6.7%
Others
Insurance savings
Pension funds
Mutual funds
-0.2 -0.1
-0.7
-0.3 -0.2
-0.2
Total off-
bs funds
Insurance
savings
0,0 -0,1
Mutual funds Pension
funds
0,0
0,0
Others
-0.2
-0.9
-0.4
-0.2 -0.2
Net production Revaluation
On-balance sheet customer funds (€ bn) Total retail customer funds (€ bn)
Off-balance sheet & insurance customer funds (€ bn)
4.9% 0.5%
8
Performing loans grew 1.7% YTD
24.1 24.3
1.4
1.7
4Q 19
1.3
1.9
1Q 20
27.2 27.6
+1.5%
NPLs Private sector Public sector
3.4 3.7 4.0 4.0
15.1 15.0
2.9
1Q 20 4Q 19
2.9
25.4 25.6
+0.7%
Consumer & others SMEs
Mortgages Corporates
24.5 25.0 24.6 24.1 24.3
2Q 19
1.4 1.6
1Q 19
1.9
4Q 19 3Q 19
1.7 1.9
1Q 20
26.2 25.9 26.5 26.5 25.8
+1.2% +1.7%
Public sector Private sector
15.2 15.0 14.9 14.6 14.5
6.9 7.0 7.2 6.8 7.2
2.6 2.9
24.1 24.5
2.4
1Q 19
2.6
2Q 19 3Q 19 4Q 19
25.0
2.6
1Q 20
24.6 24.3 +0.8%
-0.8%
Corporates
Mortgages
Consumer & others
+1.3% -0.7% %YOY +0.3% +0.9% -0,8%
Performing loans (€ Bn) Gross loans (€ Bn)
Total gross loans (ex-reverse repos)
Private sector gross loans Private sector performing loans
YTD% -1.2%
+0.8%
+13.8%
YTD%
-0.9%
-0.8%
+0.2%
+9.6%
YOY%
-0.8%
+25.5%
YOY%
+4.6%
-4.5%
+1.6%
9
263 204 227
130
105 112
4Q 19 1Q 19
339
1Q 20
393
310
-14%
283
114
276
253
234
344
536
1Q 20 1Q 19 4Q 19
348
620
16%
Granting activity decreased compared to the same quarter last
year due to Covid-19 impact
-10% YOY New loan production
393 310 339
536 348
620
228 81
1Q 19
7
4Q 19 1Q 20
1,157
665
1,040
-10%
Public sector
Corporates
Individuals
Non- Mortgages Mortgages Rest of Corporates SMEs
3.49%
5.84%
2.33%
1.55%
1.12%
1.93%
20% YOY
Until 13th
March
3% 15.6%
New lending evolution (€ million)
New lending: Individuals New lending: Corporates
€ million / average yield € million / average yield
1.90%
3.05%
5.39%
3.03%
5.19%
1.92%
1.39%
1.05%
2.10%
1.36%
0.96%
1.87%
10
NII fell slightly due to the calendar effect, while customer spread
stabilizes. Front Book spread is affected by the weight of large
corporates in new production
145 148 144 142 140
1.05%
4Q 19
1.00%
2Q 19
1.03% 1.02%
1Q 19 3Q 19
1.00%
1Q 20
Net interest margin (%ATAs)
Net interest income (€ million)
184 178 173 166 163
19 19 19 18 17
203 197 192 185 180
2Q 19 1Q 19 3Q 19 4Q 19 1Q 20
Cost of deposits Customer spread
Loan yield (1)
227 203 212 211
191
10 10 6 6 5
237 213 218 217
196
1Q 19 2Q 19 3Q 19 4Q 19 1Q 20
Cost of deposits
Customer spread
Loan yield (private sector)
141.7 140.4 1.5
4Q19 rest number
of days
0.2
1Q20
Net interest income bridge 1Q 2020 Net interest margin
€ million Quarterly evolution
Customer spread (Back Book) Customer spread (Front Book)
Quarterly evolution (bps) Quarterly evolution (bps)
(1) Loan yield calculated over total net loans ex repo & ex other financial assets
11
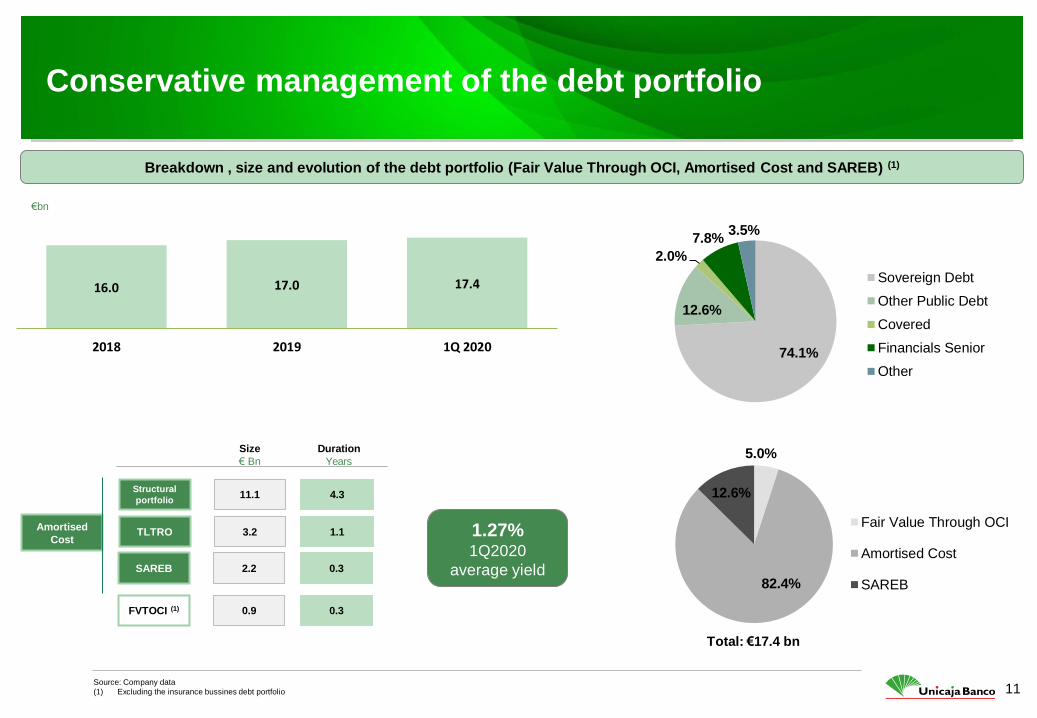
5.0%
82.4%
12.6%
Fair Value Through OCI
Amortised Cost
SAREB
€bn
Conservative management of the debt portfolio
(1)
4.3 11.1
1.1 3.2
0.3
0.3
2.2
0.9
74.1%
12.6%
2.0%
7.8% 3.5%
Sovereign Debt
Other Public Debt
Covered
Financials Senior
Other
16.0 17.0 17.4
2018 2019 1Q 2020
Total: €17.4 bn
Breakdown , size and evolution of the debt portfolio (Fair Value Through OCI, Amortised Cost and SAREB) (1)
Source: Company data
(1) Excluding the insurance bussines debt portfolio
Structural
portfolio
TLTRO Amortised
Cost
SAREB
FVTOCI (1)
Size
€ Bn
Duration
Years
1.27% 1Q2020
average yield
12
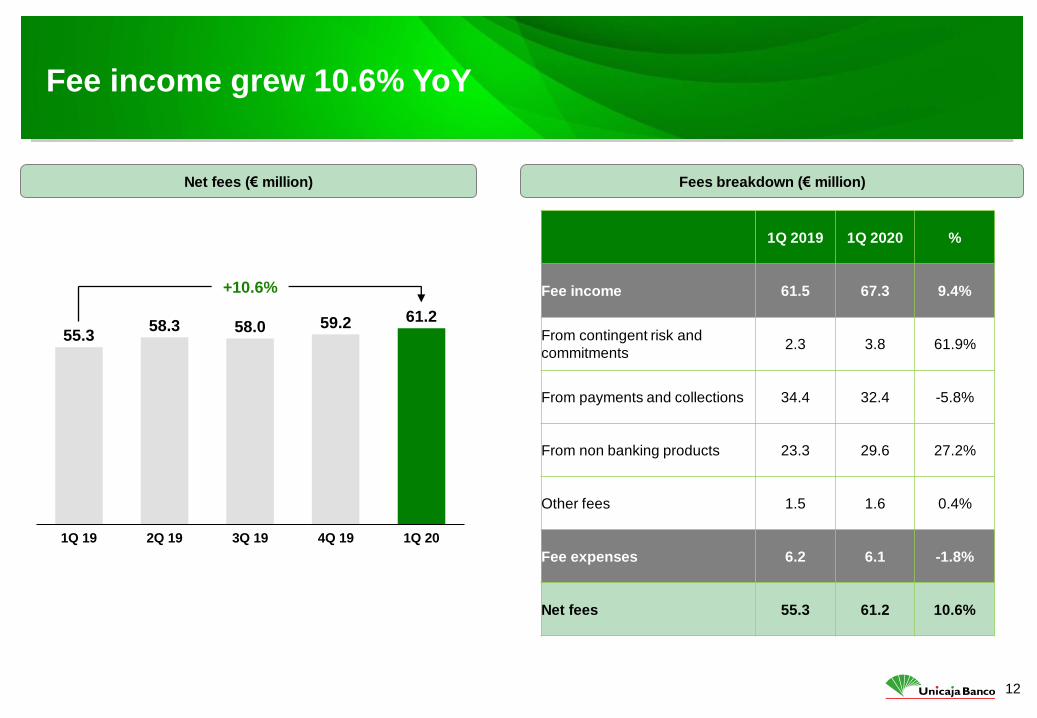
Fee income grew 10.6% YoY
55.3 58.3 58.0 59.2 61.2
1Q 19 2Q 19 3Q 19 4Q 19 1Q 20
+10.6%
Net fees (€ million) Fees breakdown (€ million)
1Q 2019 1Q 2020 %
Fee income 61.5 67.3 9.4%
From contingent risk and
commitments 2.3 3.8 61.9%
From payments and collections 34.4 32.4 -5.8%
From non banking products 23.3 29.6 27.2%
Other fees 1.5 1.6 0.4%
Fee expenses 6.2 6.1 -1.8%
Net fees 55.3 61.2 10.6%
13
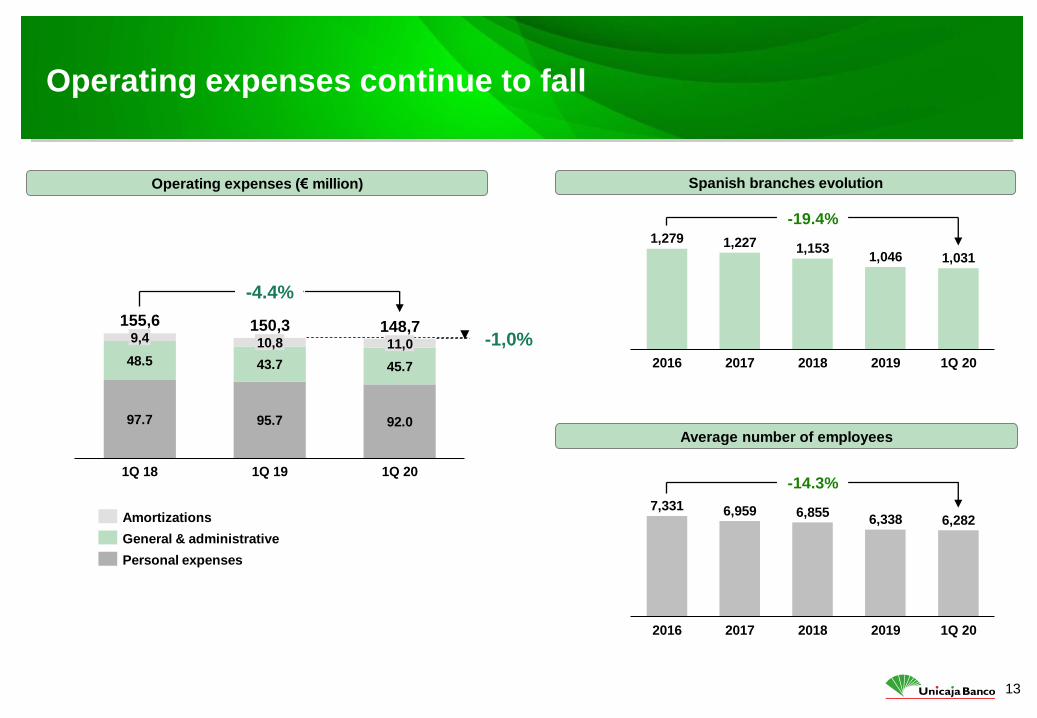
Operating expenses continue to fall
97.7 95.7 92.0
48.5 43.7 45.7
11,0 9,4
1Q 18
10,8
1Q 20 1Q 19
155,6 150,3 148,7 -1,0%
-4.4%
General & administrative
Amortizations
Personal expenses
1,279 1,227 1,153 1,046 1,031
1Q 20 2018 2016 2017 2019
-19.4%
7,331 6,959 6,855 6,338 6,282
2016 2017 2018 2019 1Q 20
-14.3%
Spanish branches evolution Operating expenses (€ million)
Average number of employees
14
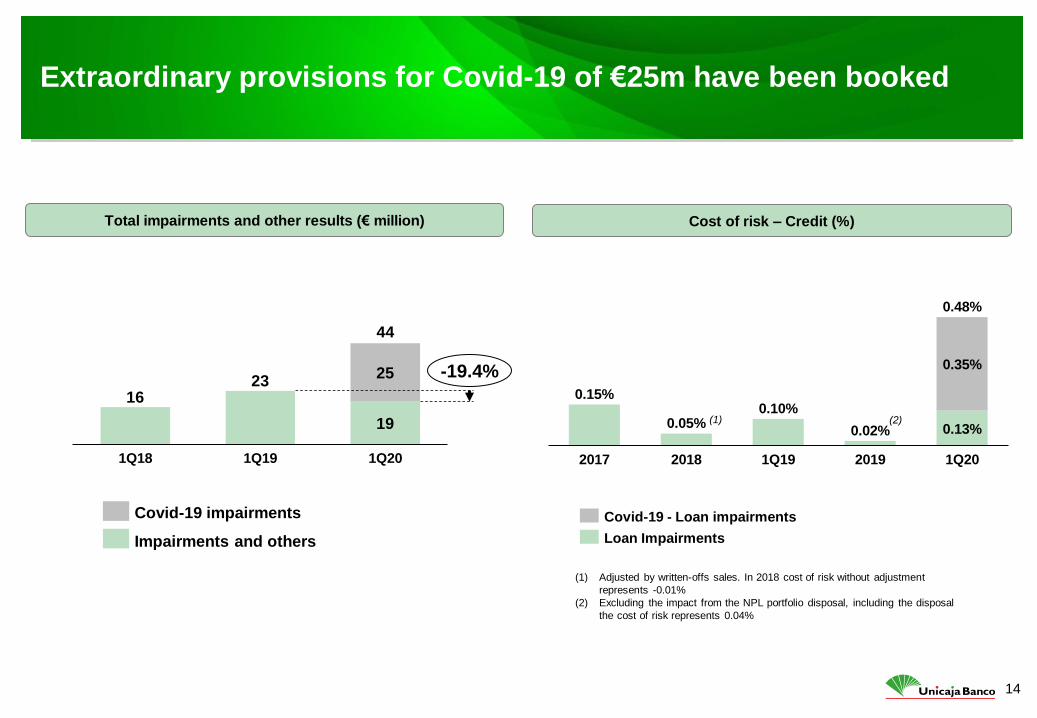
Extraordinary provisions for Covid-19 of €25m have been booked
Total impairments and other results (€ million) Cost of risk – Credit (%)
(1) Adjusted by written-offs sales. In 2018 cost of risk without adjustment
represents -0.01%
(2) Excluding the impact from the NPL portfolio disposal, including the disposal
the cost of risk represents 0.04%
16 23
19
25
1Q18 1Q19 1Q20
44
-19.4%
Covid-19 impairments
Impairments and others
(1) (2) 0.13%
2019 2018 2017 1Q19
0.35%
1Q20
0.15%
0.05% 0.10%
0.02%
0.48%
Covid-19 - Loan impairments
Loan Impairments

15
Index
Key highlights
Results & business
Asset quality, liquidity & solvency
16
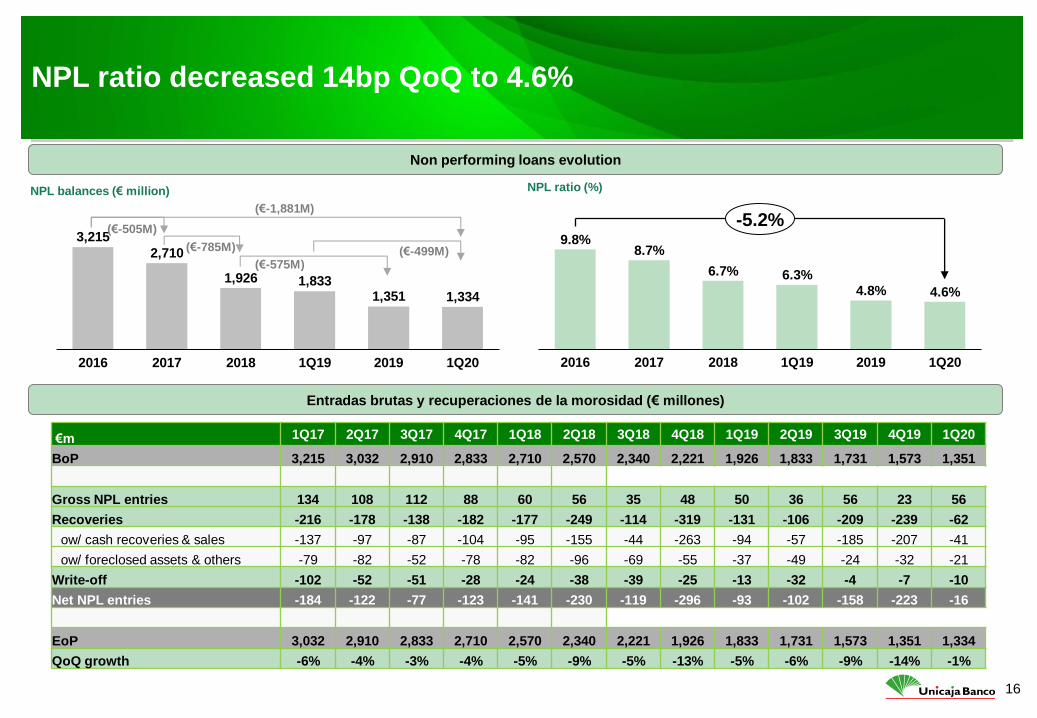
NPL ratio decreased 14bp QoQ to 4.6%
Non performing loans evolution
NPL balances (€ million) NPL ratio (%)
Entradas brutas y recuperaciones de la morosidad (€ millones)
€m 1Q17 2Q17 3Q17 4Q17 1Q18 2Q18 3Q18 4Q18 1Q19 2Q19 3Q19 4Q19 1Q20
BoP 3,215 3,032 2,910 2,833 2,710 2,570 2,340 2,221 1,926 1,833 1,731 1,573 1,351
Gross NPL entries 134 108 112 88 60 56 35 48 50 36 56 23 56
Recoveries -216 -178 -138 -182 -177 -249 -114 -319 -131 -106 -209 -239 -62
ow/ cash recoveries & sales -137 -97 -87 -104 -95 -155 -44 -263 -94 -57 -185 -207 -41
ow/ foreclosed assets & others -79 -82 -52 -78 -82 -96 -69 -55 -37 -49 -24 -32 -21
Write-off -102 -52 -51 -28 -24 -38 -39 -25 -13 -32 -4 -7 -10
Net NPL entries -184 -122 -77 -123 -141 -230 -119 -296 -93 -102 -158 -223 -16
EoP 3,032 2,910 2,833 2,710 2,570 2,340 2,221 1,926 1,833 1,731 1,573 1,351 1,334
QoQ growth -6% -4% -3% -4% -5% -9% -5% -13% -5% -6% -9% -14% -1%
3,215
2,710
1,926 1,833 1,351 1,334
2019 2017 2016 1Q19 2018 1Q20 1Q20 2016 2017 2018 2019
9.8% 8.7%
6.7%
4.8% 4.6%
1Q19
6.3%
-5.2% (€-505M)
(€-785M)
(€-575M) (€-499M)
(€-1,881M)
17
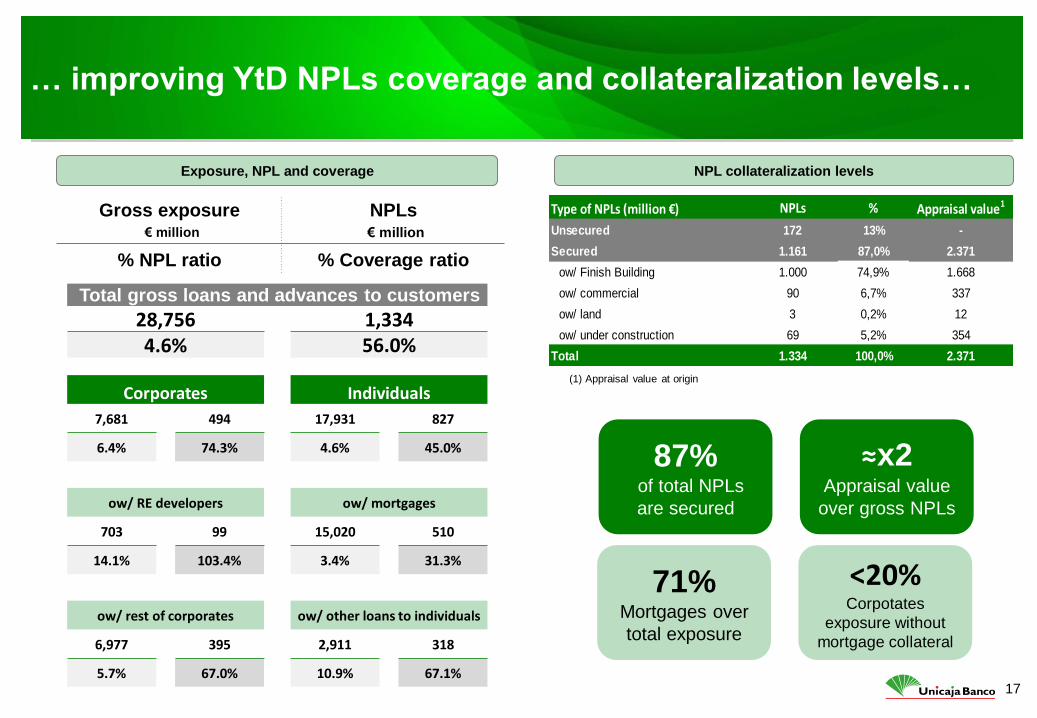
… improving YtD NPLs coverage and collateralization levels…
87% of total NPLs
are secured
≈x2 Appraisal value
over gross NPLs
Type of NPLs (million €) NPLs % Appraisal value1
Unsecured 172 13% -
Secured 1.161 87,0% 2.371
ow/ Finish Building 1.000 74,9% 1.668
ow/ commercial 90 6,7% 337
ow/ land 3 0,2% 12
ow/ under construction 69 5,2% 354
Total 1.334 100,0% 2.371
NPL collateralization levels Exposure, NPL and coverage
Gross exposure
€ million
NPLs
€ million
% NPL ratio % Coverage ratio
71% Mortgages over
total exposure
<20% Corpotates
exposure without
mortgage collateral
(1) Appraisal value at origin
Total gross loans and advances to customers
28,756 1,334 4.6% 56.0%
Corporates Individuals
7,681 494 17,931 827
6.4% 74.3% 4.6% 45.0%
ow/ RE developers ow/ mortgages
703 99 15,020 510
14.1% 103.4% 3.4% 31.3%
ow/ rest of corporates ow/ other loans to individuals
6,977 395 2,911 318
5.7% 67.0% 10.9% 67.1%
18
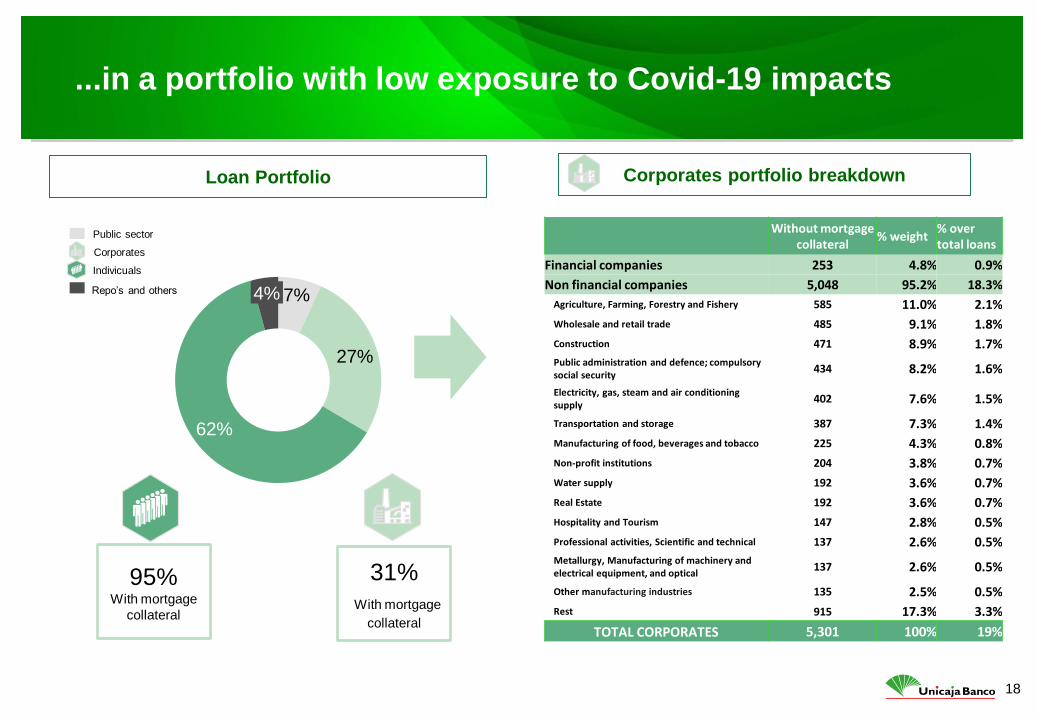
Loan Portfolio Corporates portfolio breakdown
7%
27%
62%
4%
Public sector
Corporates
Repo’s and others
Indivicuals
95% With mortgage
collateral
31%
With mortgage
collateral
...in a portfolio with low exposure to Covid-19 impacts
Without mortgage
collateral % weight
% over total loans
Financial companies 253 4.8% 0.9%
Non financial companies 5,048 95.2% 18.3%
Agriculture, Farming, Forestry and Fishery 585 11.0% 2.1%
Wholesale and retail trade 485 9.1% 1.8%
Construction 471 8.9% 1.7% Public administration and defence; compulsory social security
434 8.2% 1.6%
Electricity, gas, steam and air conditioning supply
402 7.6% 1.5%
Transportation and storage 387 7.3% 1.4%
Manufacturing of food, beverages and tobacco 225 4.3% 0.8%
Non-profit institutions 204 3.8% 0.7%
Water supply 192 3.6% 0.7%
Real Estate 192 3.6% 0.7%
Hospitality and Tourism 147 2.8% 0.5%
Professional activities, Scientific and technical 137 2.6% 0.5% Metallurgy, Manufacturing of machinery and electrical equipment, and optical
137 2.6% 0.5%
Other manufacturing industries 135 2.5% 0.5%
Rest 915 17.3% 3.3%
TOTAL CORPORATES 5,301 100% 19%
19
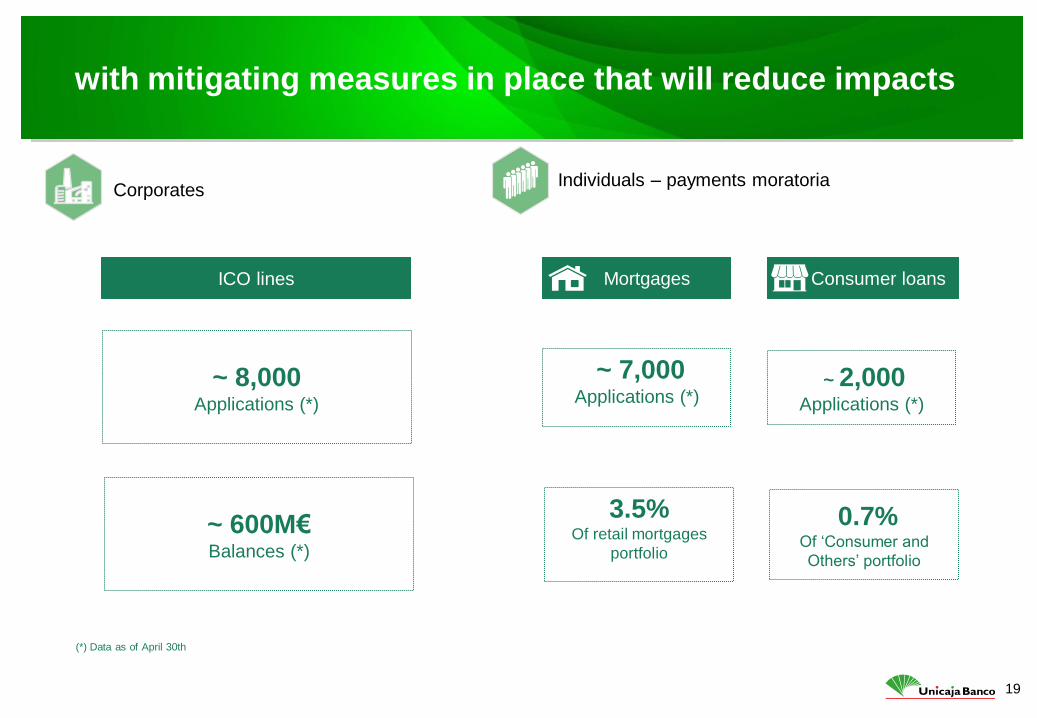
~ 2,000 Applications (*)
~ 7,000 Applications (*)
Consumer loans Mortgages
with mitigating measures in place that will reduce impacts
Corporates Individuals – payments moratoria
ICO lines
~ 8,000 Applications (*)
(*) Data as of April 30th
~ 600M€ Balances (*)
3.5% Of retail mortgages
portfolio
0.7% Of ‘Consumer and
Others’ portfolio
20
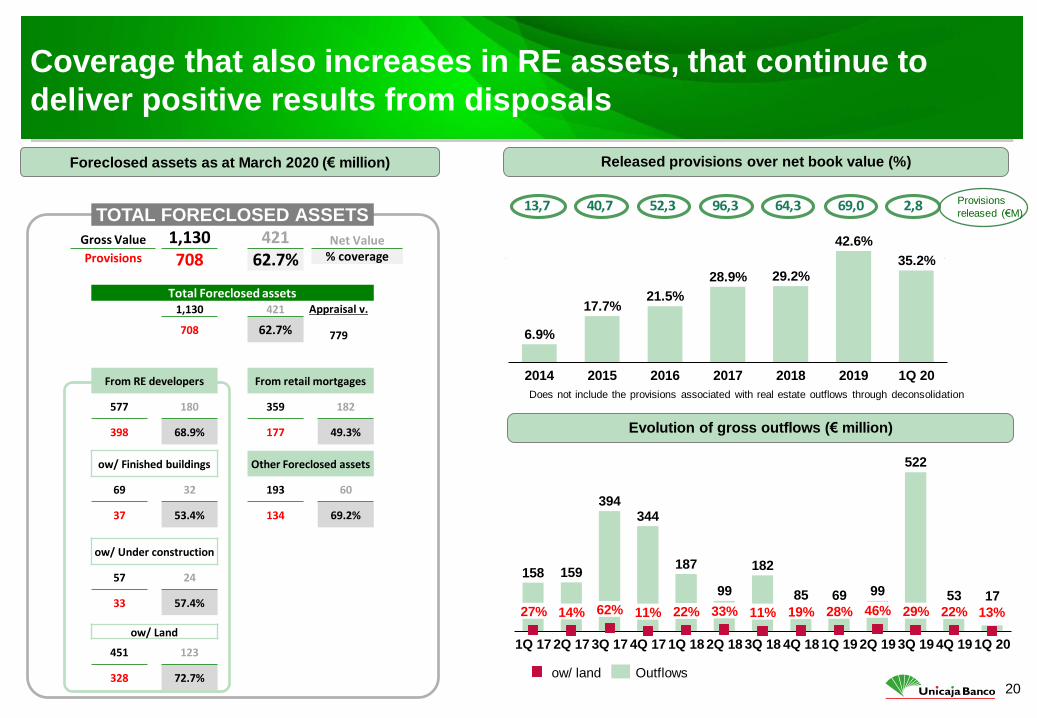
13,7 40,7 52,3 96,3 64,3 69,0 2,8
Coverage that also increases in RE assets, that continue to
deliver positive results from disposals
2015 2014
6.9%
1Q 20 2019 2016
35.2%
2017 2018
17.7% 21.5%
28.9% 29.2%
42.6%
158 159
394 344
187
99
182
85 69 99
522
53 17
1Q 18
28% 27% 11%
3Q 17 1Q 17 4Q 17
46% 62% 14%
2Q 17
22% 33%
2Q 18
22% 29% 11%
3Q 18
19%
4Q 18 1Q 19 2Q 19 3Q 19 4Q 19
13%
1Q 20
ow/ land Outflows
Foreclosed assets as at March 2020 (€ million) Released provisions over net book value (%)
Provisions
released (€M) TOTAL FORECLOSED ASSETS
1,130 421 708 62.7%
Total Foreclosed assets 1,130 421 Appraisal v.
708 62.7% 779
From RE developers From retail mortgages
577 180 359 182
398 68.9% 177 49.3%
ow/ Finished buildings Other Foreclosed assets
69 32 193 60
37 53.4% 134 69.2%
ow/ Under construction
57 24
33 57.4%
ow/ Land
451 123
328 72.7%
Gross Value
Provisions
Net Value % coverage
Evolution of gross outflows (€ million)
Does not include the provisions associated with real estate outflows through deconsolidation
21
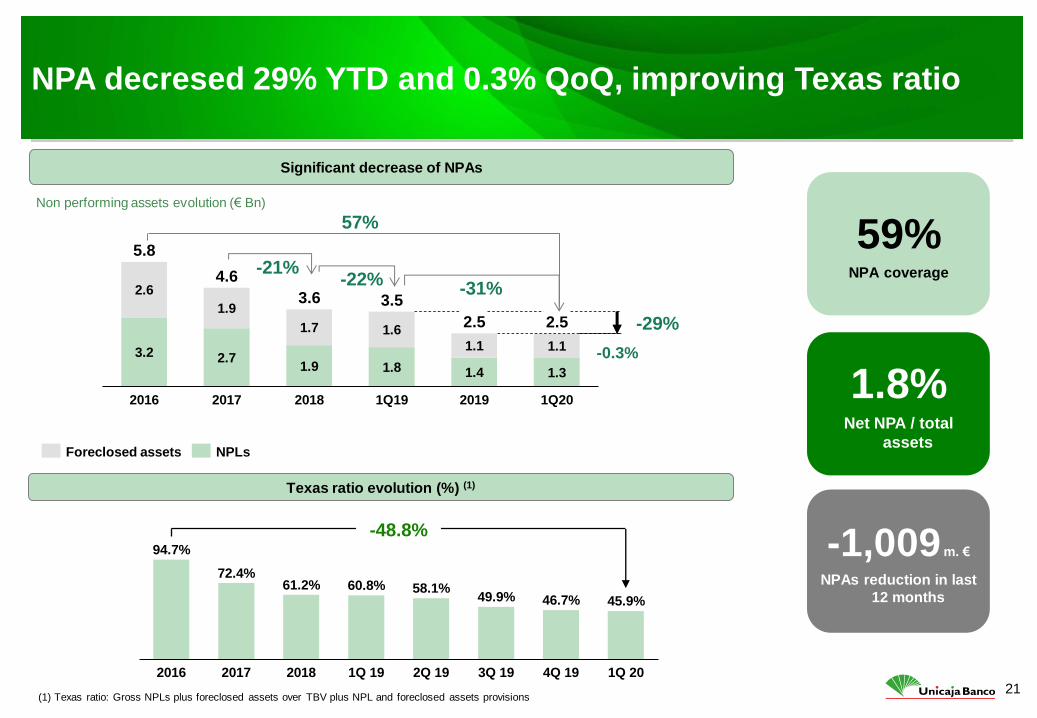
NPA decresed 29% YTD and 0.3% QoQ, improving Texas ratio
59% NPA coverage
1.8% Net NPA / total
assets
-1,009 m. €
NPAs reduction in last
12 months
Foreclosed assets NPLs
4Q 19 2016 1Q 20 2017 2018 1Q 19 2Q 19 3Q 19
58.1%
94.7%
72.4% 61.2% 60.8%
49.9% 46.7% 45.9%
-48.8%
Significant decrease of NPAs
Non performing assets evolution (€ Bn)
Texas ratio evolution (%) (1)
(1) Texas ratio: Gross NPLs plus foreclosed assets over TBV plus NPL and foreclosed assets provisions
3.2 2.7 1.9 1.8 1.4 1.3
2.6
1.9
1.7 1.6
1.1 1.1
1Q19 2019 2016 2017
2.5
2018 1Q20
3.6
5.8
4.6
3.5
2.5 -29%
-0.3%
-22% -21%
-31%
57%
22
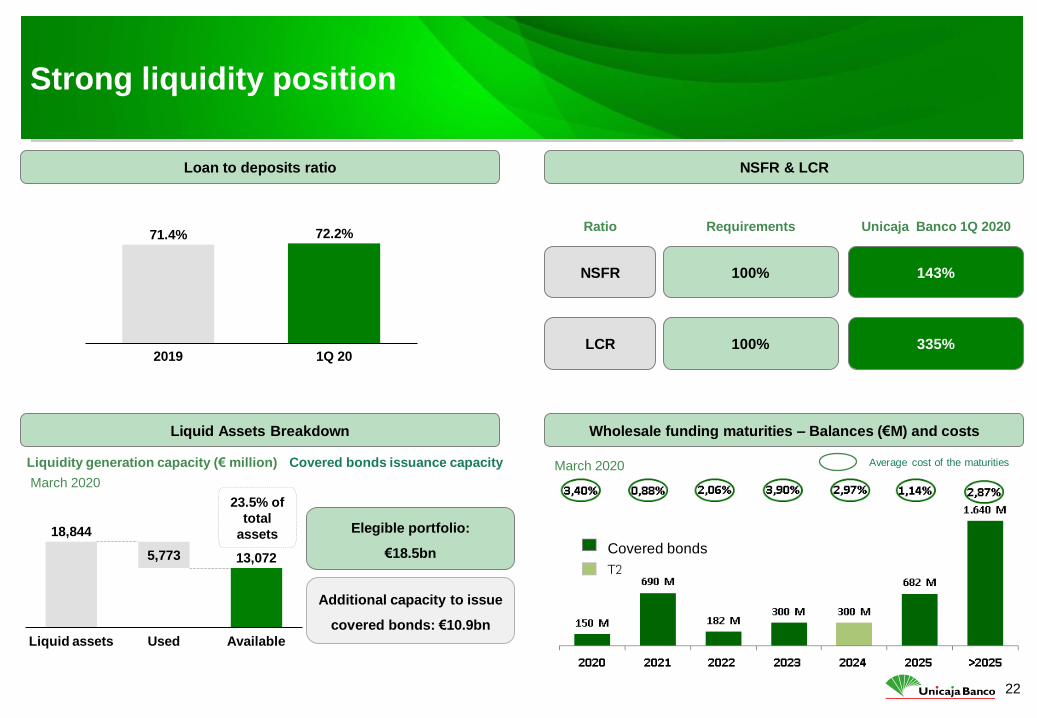
18,844
13,072 5,773
Available Liquid assets Used
23.5% of
total
assets Elegible portfolio:
€18.5bn
Additional capacity to issue
covered bonds: €10.9bn
NSFR
LCR
100%
100%
143%
335%
Strong liquidity position
72.2%
2019 1Q 20
71.4%
Loan to deposits ratio NSFR & LCR
Ratio Requirements Unicaja Banco 1Q 2020
March 2020
Wholesale funding maturities – Balances (€M) and costs
Average cost of the maturities
March 2020
Liquid Assets Breakdown
Liquidity generation capacity (€ million) Covered bonds issuance capacity
Covered bonds
23
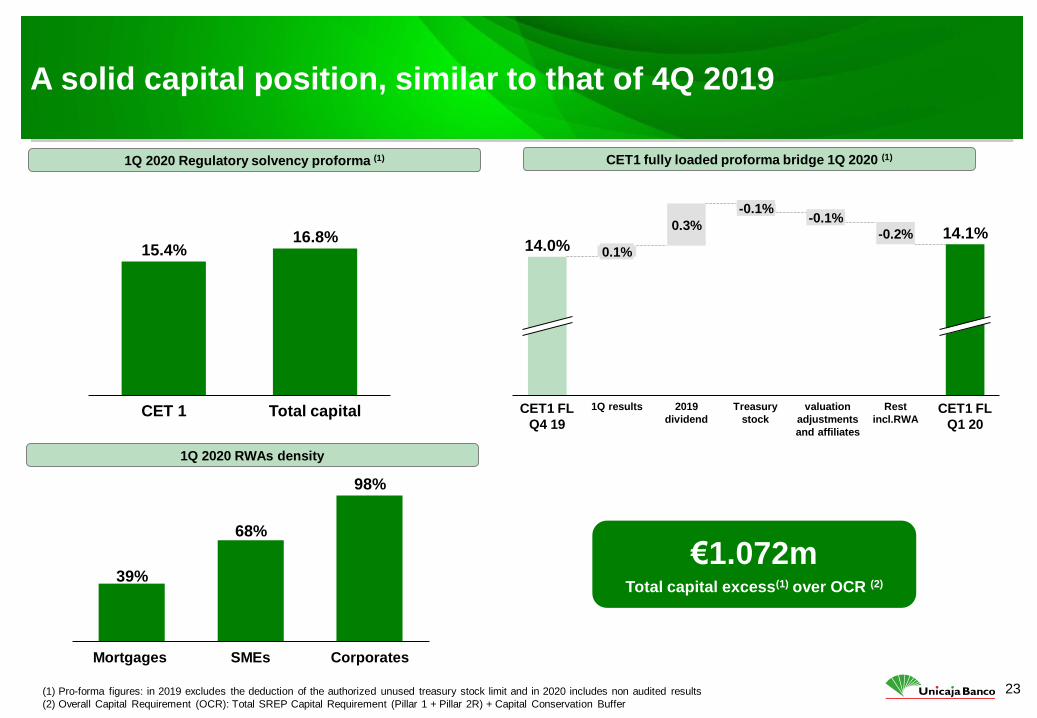
1Q 2020 RWAs density
1Q 2020 Regulatory solvency proforma (1)
€1.072m Total capital excess(1) over OCR (2)
A solid capital position, similar to that of 4Q 2019
CET1 fully loaded proforma bridge 1Q 2020 (1)
15.4%
Total capital CET 1
16.8%
98%
68%
Corporates Mortgages SMEs
39%
(1) Pro-forma figures: in 2019 excludes the deduction of the authorized unused treasury stock limit and in 2020 includes non audited results
(2) Overall Capital Requirement (OCR): Total SREP Capital Requirement (Pillar 1 + Pillar 2R) + Capital Conservation Buffer
1Q results
0.1%
CET1 FL
Q4 19
0.3%
2019
dividend
-0.1%
Treasury
stock
-0.1%
valuation
adjustments
and affiliates
CET1 FL
Q1 20
-0.2%
Rest
incl.RWA
14.0% 14.1%

25
Additional Information
Appendix
26
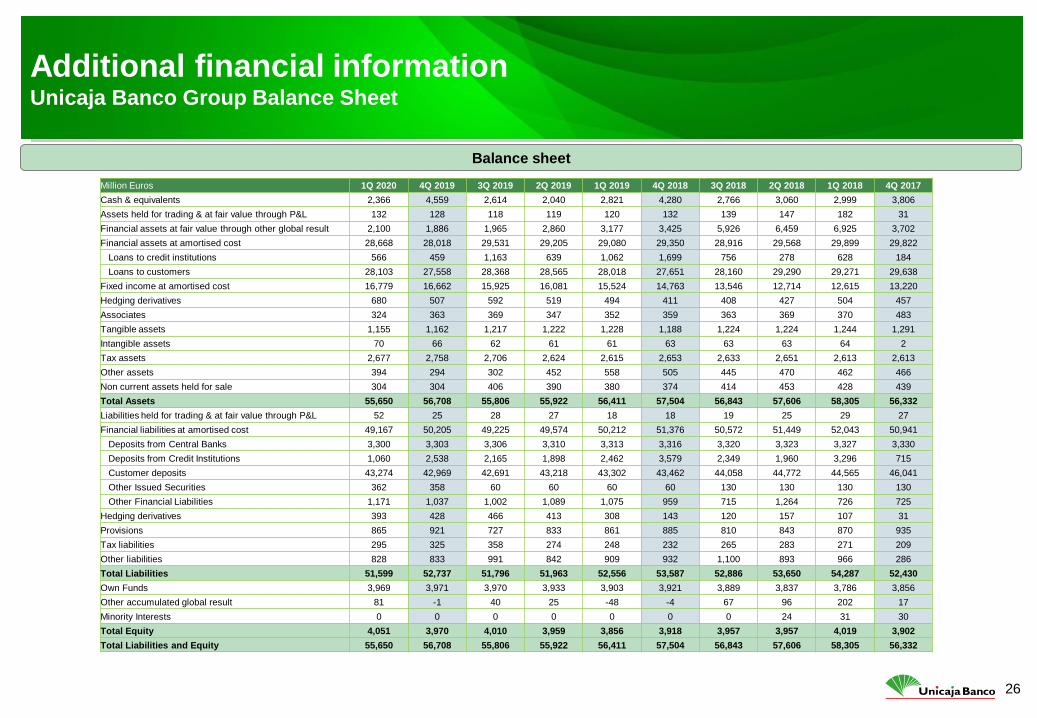
Balance sheet
Additional financial information Unicaja Banco Group Balance Sheet
Million Euros 1Q 2020 4Q 2019 3Q 2019 2Q 2019 1Q 2019 4Q 2018 3Q 2018 2Q 2018 1Q 2018 4Q 2017
Cash & equivalents 2,366 4,559 2,614 2,040 2,821 4,280 2,766 3,060 2,999 3,806
Assets held for trading & at fair value through P&L 132 128 118 119 120 132 139 147 182 31
Financial assets at fair value through other global result 2,100 1,886 1,965 2,860 3,177 3,425 5,926 6,459 6,925 3,702
Financial assets at amortised cost 28,668 28,018 29,531 29,205 29,080 29,350 28,916 29,568 29,899 29,822
Loans to credit institutions 566 459 1,163 639 1,062 1,699 756 278 628 184
Loans to customers 28,103 27,558 28,368 28,565 28,018 27,651 28,160 29,290 29,271 29,638
Fixed income at amortised cost 16,779 16,662 15,925 16,081 15,524 14,763 13,546 12,714 12,615 13,220
Hedging derivatives 680 507 592 519 494 411 408 427 504 457
Associates 324 363 369 347 352 359 363 369 370 483
Tangible assets 1,155 1,162 1,217 1,222 1,228 1,188 1,224 1,224 1,244 1,291
Intangible assets 70 66 62 61 61 63 63 63 64 2
Tax assets 2,677 2,758 2,706 2,624 2,615 2,653 2,633 2,651 2,613 2,613
Other assets 394 294 302 452 558 505 445 470 462 466
Non current assets held for sale 304 304 406 390 380 374 414 453 428 439
Total Assets 55,650 56,708 55,806 55,922 56,411 57,504 56,843 57,606 58,305 56,332
Liabilities held for trading & at fair value through P&L 52 25 28 27 18 18 19 25 29 27
Financial liabilities at amortised cost 49,167 50,205 49,225 49,574 50,212 51,376 50,572 51,449 52,043 50,941
Deposits from Central Banks 3,300 3,303 3,306 3,310 3,313 3,316 3,320 3,323 3,327 3,330
Deposits from Credit Institutions 1,060 2,538 2,165 1,898 2,462 3,579 2,349 1,960 3,296 715
Customer deposits 43,274 42,969 42,691 43,218 43,302 43,462 44,058 44,772 44,565 46,041
Other Issued Securities 362 358 60 60 60 60 130 130 130 130
Other Financial Liabilities 1,171 1,037 1,002 1,089 1,075 959 715 1,264 726 725
Hedging derivatives 393 428 466 413 308 143 120 157 107 31
Provisions 865 921 727 833 861 885 810 843 870 935
Tax liabilities 295 325 358 274 248 232 265 283 271 209
Other liabilities 828 833 991 842 909 932 1,100 893 966 286
Total Liabilities 51,599 52,737 51,796 51,963 52,556 53,587 52,886 53,650 54,287 52,430
Own Funds 3,969 3,971 3,970 3,933 3,903 3,921 3,889 3,837 3,786 3,856
Other accumulated global result 81 -1 40 25 -48 -4 67 96 202 17
Minority Interests 0 0 0 0 0 0 0 24 31 30
Total Equity 4,051 3,970 4,010 3,959 3,856 3,918 3,957 3,957 4,019 3,902
Total Liabilities and Equity 55,650 56,708 55,806 55,922 56,411 57,504 56,843 57,606 58,305 56,332
27
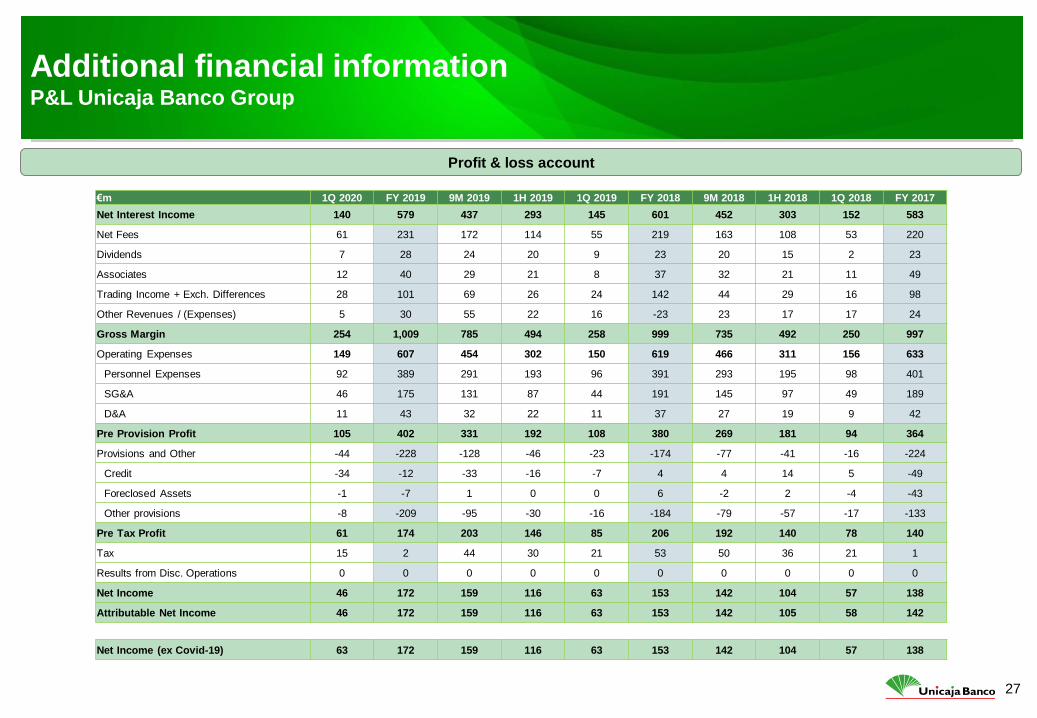
Additional financial information P&L Unicaja Banco Group
Profit & loss account
€m 1Q 2020 FY 2019 9M 2019 1H 2019 1Q 2019 FY 2018 9M 2018 1H 2018 1Q 2018 FY 2017
Net Interest Income 140 579 437 293 145 601 452 303 152 583
Net Fees 61 231 172 114 55 219 163 108 53 220
Dividends 7 28 24 20 9 23 20 15 2 23
Associates 12 40 29 21 8 37 32 21 11 49
Trading Income + Exch. Differences 28 101 69 26 24 142 44 29 16 98
Other Revenues / (Expenses) 5 30 55 22 16 -23 23 17 17 24
Gross Margin 254 1,009 785 494 258 999 735 492 250 997
Operating Expenses 149 607 454 302 150 619 466 311 156 633
Personnel Expenses 92 389 291 193 96 391 293 195 98 401
SG&A 46 175 131 87 44 191 145 97 49 189
D&A 11 43 32 22 11 37 27 19 9 42
Pre Provision Profit 105 402 331 192 108 380 269 181 94 364
Provisions and Other -44 -228 -128 -46 -23 -174 -77 -41 -16 -224
Credit -34 -12 -33 -16 -7 4 4 14 5 -49
Foreclosed Assets -1 -7 1 0 0 6 -2 2 -4 -43
Other provisions -8 -209 -95 -30 -16 -184 -79 -57 -17 -133
Pre Tax Profit 61 174 203 146 85 206 192 140 78 140
Tax 15 2 44 30 21 53 50 36 21 1
Results from Disc. Operations 0 0 0 0 0 0 0 0 0 0
Net Income 46 172 159 116 63 153 142 104 57 138
Attributable Net Income 46 172 159 116 63 153 142 105 58 142
Net Income (ex Covid-19) 63 172 159 116 63 153 142 104 57 138