Embed Size (px)
Citation preview
January 2015
Santander Presentation
2
GRAVITATED2014\Presentation\2014 11 3 - Equity Story Outline\42 Project Santander Investors Presentation.pptx
178,178,
178
255,0,0
72,72,72
255,170,
170
255,0,0
230,230,
230
255,255,
255
0,0,0
218,158,
8
0,0,0
Body Text
Background
Table highlight
Message Box
Slide Heading or
Heading Boxes
Chart 1
Chart 2
Chart 3
Chart 4
Chart 5
Chart 6
255,204,
204
First choice
1
1
On a red background
On a white background
0.0%
Important Information
This document is of a merely informative nature. This document is not a registration document or a prospectus and must not be treated as an offer of any kind and only constitutes
information.
The information contained herein is not for release, publication or distribution, directly or indirectly, in or into the United States, Canada, Australia or Japan or any other jurisdiction in which
the distribution or release would be unlawful.
These materials do not constitute an offer to sell, or a solicitation of offers to purchase or subscribe for, securities in the United States. The securities referred to herein have not been, and
will not be, registered under the U.S. Securities Act of 1933, as amended, and may not be offered or sold in the United States absent registration or an applicable exemption from registration
requirements. There is no intention to register any portion of the offering in the United States or to conduct a public offering of securities in the United States. This document does not solicit
money, securities or any other type of consideration and, if any money, securities or other type of consideration is sent in response hereto, it will not be accepted.
The issue or sale of securities in the offering are subject to specific legal or regulatory restrictions in certain jurisdictions. Santander assumes no responsibility in the event there is a violation
by any person of such restrictions.
The information contained herein shall not constitute an offer to sell or the solicitation of an offer to buy, nor shall there be any sale of the securities referred to herein, in any jurisdiction in
which such offer, solicitation or sale would be unlawful. In particular, documents relating to the offering of securities, as well as the information contained therein, may not be supplied to the
public in Brazil, as the offering of the securities is not a public offering of securities in Brazil, nor may they be used in connection with any offer for sale of securities to the public in Brazil.
We have not taken, and will not take, any action in any jurisdiction to permit a public offering of the securities referred to herein, or the possession or distribution of this document or any other
documents relating to the offering, in any country or jurisdiction where any such action may be required.
Santander has not authorized any offer to the public of securities in any Member State of the European Economic Area. With respect to each Member State of the European Economic Area
which has implemented the Prospectus Directive (each, a “Relevant Member State”), no action has been undertaken or will be undertaken to make an offer to the public of securities
requiring publication of a prospectus in any Relevant Member State. As a result, the securities may only be offered in Relevant Member States (a) to any legal entity which is a qualified
investor as defined in Article 2(1)(e) of the Prospectus Directive; or (b) in any other circumstances which do not require the publication by Santander of a prospectus pursuant to Article 3 of
the Prospectus Directive. For the purposes of this paragraph, the expression an “offer of securities to the public” means the communication in any form and by any means of sufficient
information on the terms of the offer and the securities to be offered so as to enable an investor to decide to purchase the securities, as the same may be varied in that Member State by any
measure implementing the Prospectus Directive in that Member State and the expression “Prospectus Directive” means Directive 2003/71/EC (as amended, including by Directive
2010/73/EU), and includes any relevant implementing measure in the Relevant Member State.
This communication is directed only at (i) persons who are outside the United Kingdom or (ii) in the United Kingdom, persons who have professional experience in matters relating to
investments falling within Article 19(5) of the Financial Services and Markets Act 2000 (Financial Promotion) Order 2005, as amended (the “Order”), or who are high net worth entities, and
other persons to whom it may lawfully be communicated, falling within Article 49(2) of the Order (all such persons together being referred to as “relevant persons”). Any investment or
investment activity to which this communication relates will only be available to and will only be engaged in with, relevant persons. Any person who is not a relevant person must not act or
rely on this document or any of its contents.
Forward-looking statements
This communication contains forward-looking statements within the meaning of the US Private Securities Litigation Reform Act of 1995. Forward looking statements may be identified by
words such as “expects”, “anticipates”, “intends”, “plans”, “believes”, “seeks”, “estimates”, “will” or words of similar meaning and include, but are not limited to, statements about the expected
changes in Banco Santander’s shareholder remuneration policy. These statements are based on management’s current expectations and are inherently subject to uncertainties and changes
in circumstance. Banco Santander does not undertake any obligations to update the forward-looking statements to reflect actual results, or any change in events, conditions, assumptions or
other factors. Numerous factors, including those discussed in “Key Information—Risk Factors” in Banco Santander’s Annual Report on Form 20-F as well as in “Chapter 4—Risk Factors” in
Banco Santander’s Share Registry Document (as annually filed with the Comisión Nacional del Mercado de Valores –CNMV–), could affect Banco Santander’s future results and could cause
those results or other outcomes to differ materially from those anticipated in any forward-looking statement.
3
GRAVITATED2014\Presentation\2014 11 3 - Equity Story Outline\42 Project Santander Investors Presentation.pptx
178,178,
178
255,0,0
72,72,72
255,170,
170
255,0,0
230,230,
230
255,255,
255
0,0,0
218,158,
8
0,0,0
Body Text
Background
Table highlight
Message Box
Slide Heading or
Heading Boxes
Chart 1
Chart 2
Chart 3
Chart 4
Chart 5
Chart 6
255,204,
204
First choice
1
1
On a red background
On a white background
0.0%
I. Transaction Terms
II. Transaction Rationale
III. Financial Impacts and Conclusions
4
GRAVITATED2014\Presentation\2014 11 3 - Equity Story Outline\42 Project Santander Investors Presentation.pptx
178,178,
178
255,0,0
72,72,72
255,170,
170
255,0,0
230,230,
230
255,255,
255
0,0,0
218,158,
8
0,0,0
Body Text
Background
Table highlight
Message Box
Slide Heading or
Heading Boxes
Chart 1
Chart 2
Chart 3
Chart 4
Chart 5
Chart 6
255,204,
204
First choice
1
1
On a red background
On a white background
0.0%
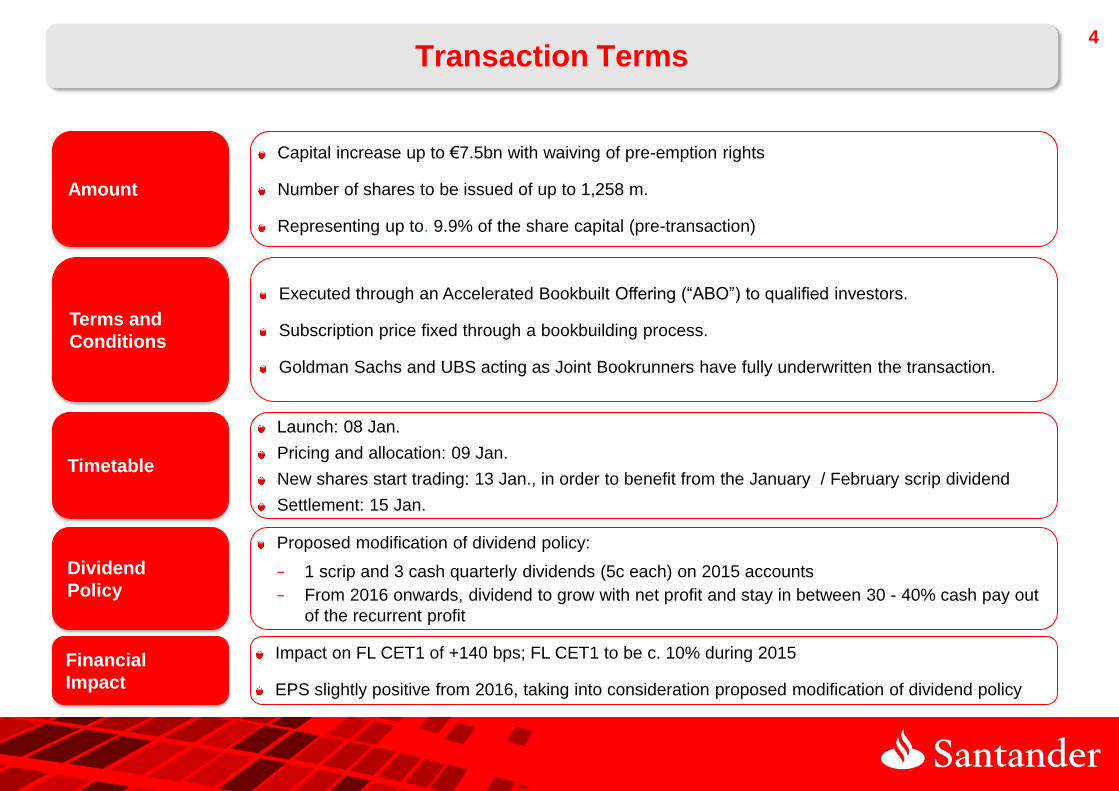
Transaction Terms
Amount
Terms and
Conditions
Timetable
Financial
Impact
Capital increase up to €7.5bn with waiving of pre-emption rights
Number of shares to be issued of up to 1,258 m.
Representing up to. 9.9% of the share capital (pre-transaction)
Executed through an Accelerated Bookbuilt Offering (“ABO”) to qualified investors.
Subscription price fixed through a bookbuilding process.
Goldman Sachs and UBS acting as Joint Bookrunners have fully underwritten the transaction.
Launch: 08 Jan.
Pricing and allocation: 09 Jan.
New shares start trading: 13 Jan., in order to benefit from the January / February scrip dividend
Settlement: 15 Jan.
Impact on FL CET1 of +140 bps; FL CET1 to be c. 10% during 2015
EPS slightly positive from 2016, taking into consideration proposed modification of dividend policy
Dividend
Policy
Proposed modification of dividend policy:
− 1 scrip and 3 cash quarterly dividends (5c each) on 2015 accounts
− From 2016 onwards, dividend to grow with net profit and stay in between 30 - 40% cash pay out
of the recurrent profit
5
GRAVITATED2014\Presentation\2014 11 3 - Equity Story Outline\42 Project Santander Investors Presentation.pptx
178,178,
178
255,0,0
72,72,72
255,170,
170
255,0,0
230,230,
230
255,255,
255
0,0,0
218,158,
8
0,0,0
Body Text
Background
Table highlight
Message Box
Slide Heading or
Heading Boxes
Chart 1
Chart 2
Chart 3
Chart 4
Chart 5
Chart 6
255,204,
204
First choice
1
1
On a red background
On a white background
0.0%
I. Transaction Terms
II. Transaction Rationale
III. Financial Impacts and Conclusions
6
GRAVITATED2014\Presentation\2014 11 3 - Equity Story Outline\42 Project Santander Investors Presentation.pptx
178,178,
178
255,0,0
72,72,72
255,170,
170
255,0,0
230,230,
230
255,255,
255
0,0,0
218,158,
8
0,0,0
Body Text
Background
Table highlight
Message Box
Slide Heading or
Heading Boxes
Chart 1
Chart 2
Chart 3
Chart 4
Chart 5
Chart 6
255,204,
204
First choice
1
1
On a red background
On a white background
0.0%
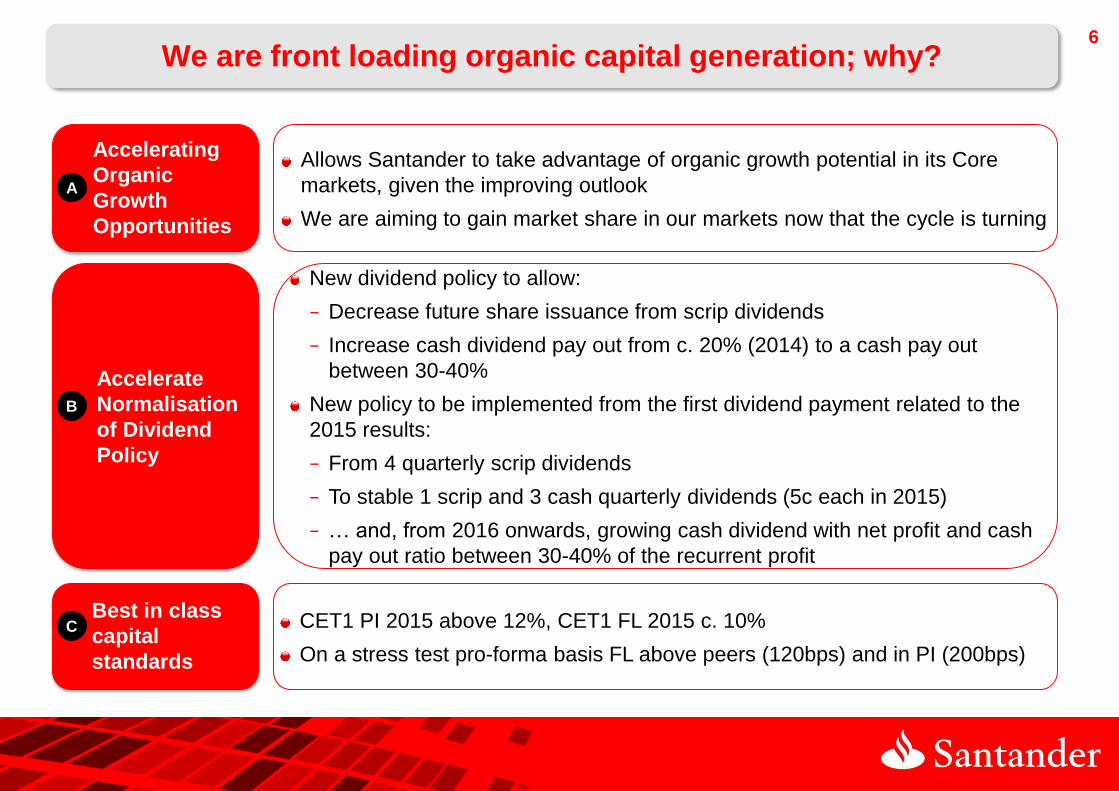
We are front loading organic capital generation; why?
Accelerate
Normalisation
of Dividend
Policy
New dividend policy to allow:
− Decrease future share issuance from scrip dividends
− Increase cash dividend pay out from c. 20% (2014) to a cash pay out
between 30-40%
New policy to be implemented from the first dividend payment related to the
2015 results:
− From 4 quarterly scrip dividends
− To stable 1 scrip and 3 cash quarterly dividends (5c each in 2015)
− … and, from 2016 onwards, growing cash dividend with net profit and cash
pay out ratio between 30-40% of the recurrent profit
B
Accelerating
Organic
Growth
Opportunities
Allows Santander to take advantage of organic growth potential in its Core
markets, given the improving outlook
We are aiming to gain market share in our markets now that the cycle is turning
A
Best in class
capital
standards
CET1 PI 2015 above 12%, CET1 FL 2015 c. 10%
On a stress test pro-forma basis FL above peers (120bps) and in PI (200bps)
C
7
GRAVITATED2014\Presentation\2014 11 3 - Equity Story Outline\42 Project Santander Investors Presentation.pptx
178,178,
178
255,0,0
72,72,72
255,170,
170
255,0,0
230,230,
230
255,255,
255
0,0,0
218,158,
8
0,0,0
Body Text
Background
Table highlight
Message Box
Slide Heading or
Heading Boxes
Chart 1
Chart 2
Chart 3
Chart 4
Chart 5
Chart 6
255,204,
204
First choice
1
1
On a red background
On a white background
0.0%
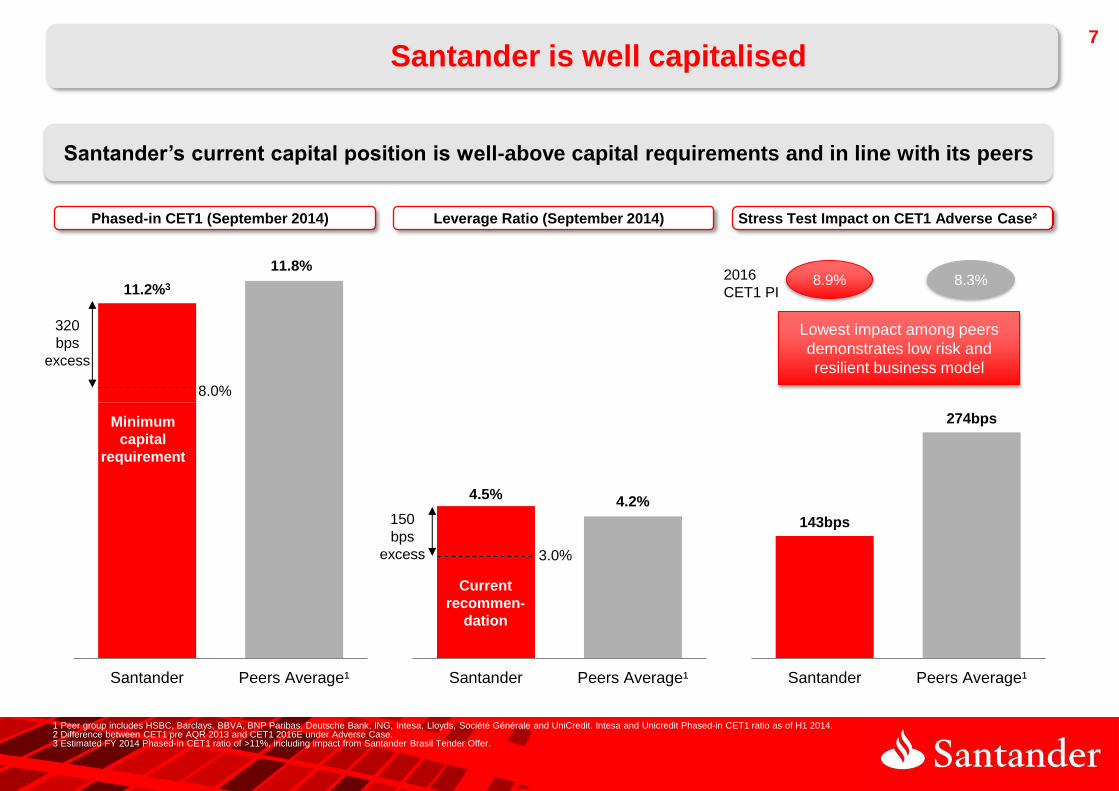
Santander is well capitalised
Leverage Ratio (September 2014) Phased-in CET1 (September 2014)
Santander’s current capital position is well-above capital requirements and in line with its peers
Stress Test Impact on CET1 Adverse Case²
143bps
274bps
Santander Peers Average¹
1 Peer group includes HSBC, Barclays, BBVA, BNP Paribas, Deutsche Bank, ING, Intesa, Lloyds, Société Générale and UniCredit. Intesa and Unicredit Phased-in CET1 ratio as of H1 2014. 2 Difference between CET1 pre AQR 2013 and CET1 2016E under Adverse Case. 3 Estimated FY 2014 Phased-in CET1 ratio of >11%, including impact from Santander Brasil Tender Offer.
11.8%
11.2%3
Santander Peers Average¹
8.0%
Minimum
capital
requirement
320
bps
excess
4.2% 4.5%
Santander Peers Average¹
3.0%
Current
recommen-
dation
150
bps
excess
8.9% 8.3%
Lowest impact among peers
demonstrates low risk and
resilient business model
2016
CET1 PI
8
GRAVITATED2014\Presentation\2014 11 3 - Equity Story Outline\42 Project Santander Investors Presentation.pptx
178,178,
178
255,0,0
72,72,72
255,170,
170
255,0,0
230,230,
230
255,255,
255
0,0,0
218,158,
8
0,0,0
Body Text
Background
Table highlight
Message Box
Slide Heading or
Heading Boxes
Chart 1
Chart 2
Chart 3
Chart 4
Chart 5
Chart 6
255,204,
204
First choice
1
1
On a red background
On a white background
0.0%
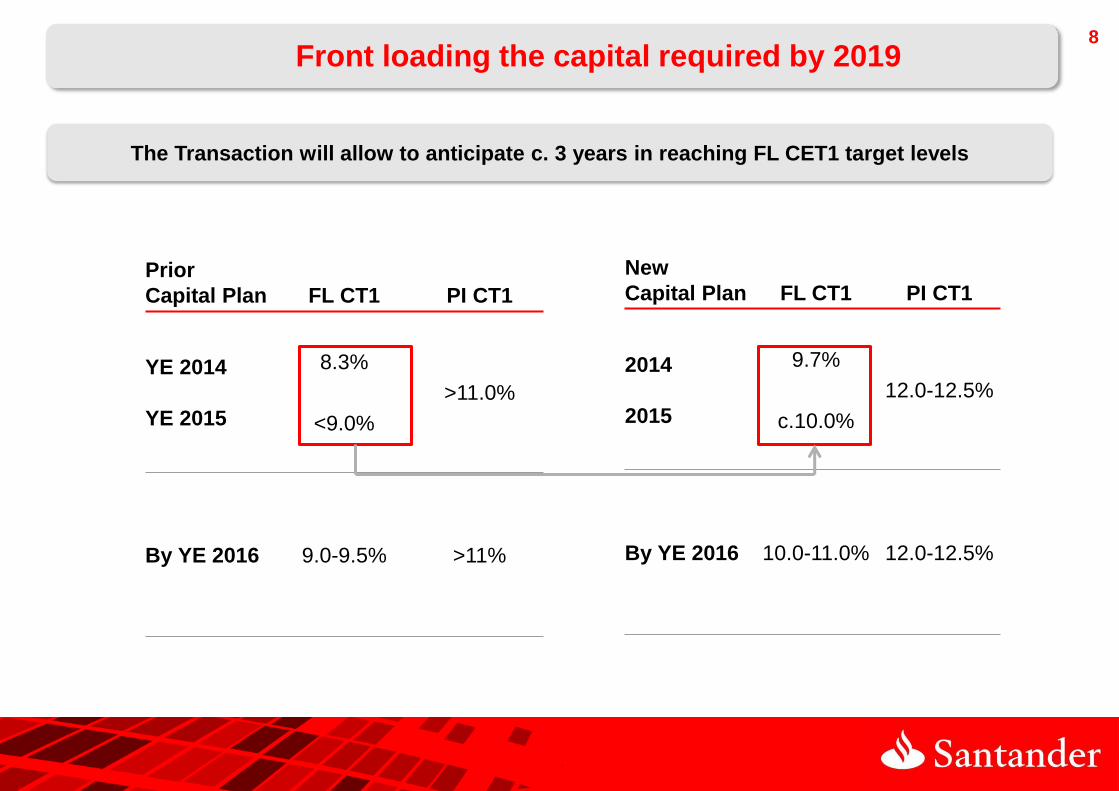
Front loading the capital required by 2019
The Transaction will allow to anticipate c. 3 years in reaching FL CET1 target levels
Prior
Capital Plan FL CT1 PI CT1
YE 2014
YE 2015
8.3%
<9.0%
>11.0%
By YE 2016 9.0-9.5% >11%
New
Capital Plan FL CT1 PI CT1
2014
2015
9.7%
c.10.0%
12.0-12.5%
By YE 2016 10.0-11.0% 12.0-12.5%

9
GRAVITATED2014\Presentation\2014 11 3 - Equity Story Outline\42 Project Santander Investors Presentation.pptx
178,178,
178
255,0,0
72,72,72
255,170,
170
255,0,0
230,230,
230
255,255,
255
0,0,0
218,158,
8
0,0,0
Body Text
Background
Table highlight
Message Box
Slide Heading or
Heading Boxes
Chart 1
Chart 2
Chart 3
Chart 4
Chart 5
Chart 6
255,204,
204
First choice
1
1
On a red background
On a white background
0.0%
Accelerating Organic Growth Opportunity A
Temporary slowdown before
returning to growth
Growing
Coming out of the crisis
Recovering
Chile
Brazil
Spain
Portugal
UK
USA
Poland Mexico
Average 2016
GDP growth in
Santander core
markets above
3%
Santander will benefit from significant organic growth opportunities in all its core markets, given
the improved outlook
10
GRAVITATED2014\Presentation\2014 11 3 - Equity Story Outline\42 Project Santander Investors Presentation.pptx
178,178,
178
255,0,0
72,72,72
255,170,
170
255,0,0
230,230,
230
255,255,
255
0,0,0
218,158,
8
0,0,0
Body Text
Background
Table highlight
Message Box
Slide Heading or
Heading Boxes
Chart 1
Chart 2
Chart 3
Chart 4
Chart 5
Chart 6
255,204,
204
First choice
1
1
On a red background
On a white background
0.0%
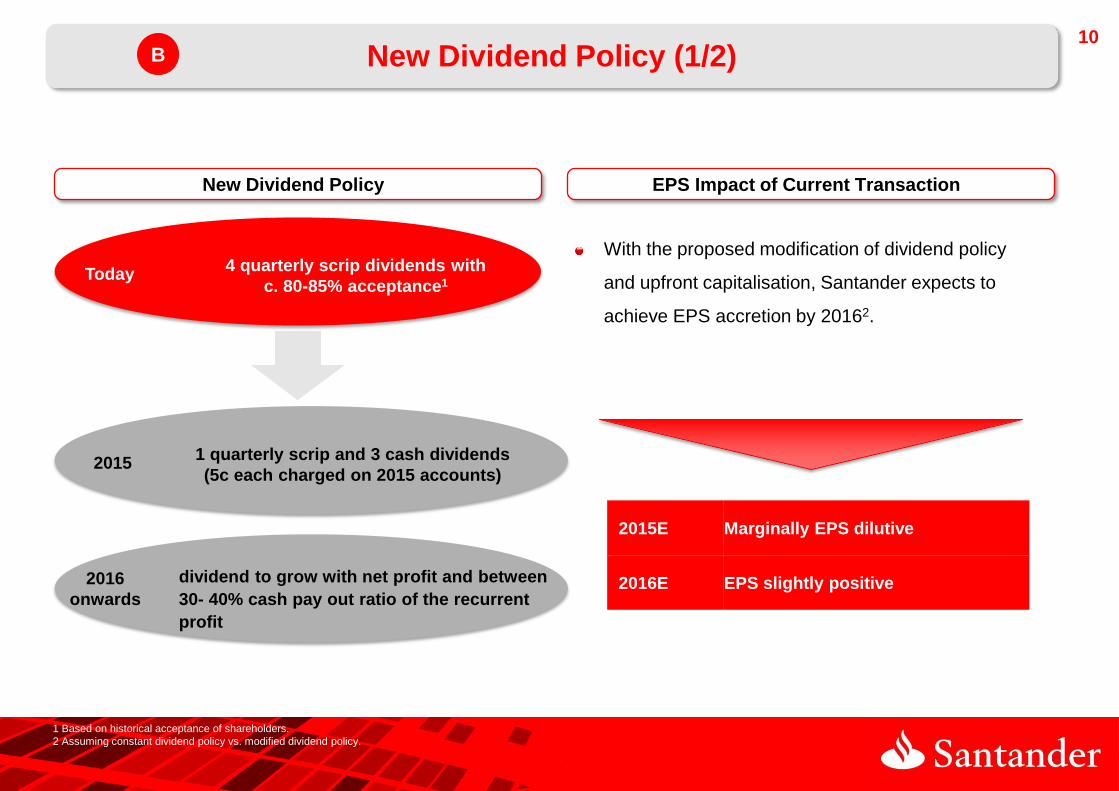
With the proposed modification of dividend policy
and upfront capitalisation, Santander expects to
achieve EPS accretion by 20162.
2015E Marginally EPS dilutive
2016E EPS slightly positive
New Dividend Policy (1/2) B
New Dividend Policy EPS Impact of Current Transaction
Today 4 quarterly scrip dividends with
c. 80-85% acceptance1
2015 1 quarterly scrip and 3 cash dividends
(5c each charged on 2015 accounts)
1 Based on historical acceptance of shareholders.
2 Assuming constant dividend policy vs. modified dividend policy.
2016
onwards
dividend to grow with net profit and between
30- 40% cash pay out ratio of the recurrent
profit
11
GRAVITATED2014\Presentation\2014 11 3 - Equity Story Outline\42 Project Santander Investors Presentation.pptx
178,178,
178
255,0,0
72,72,72
255,170,
170
255,0,0
230,230,
230
255,255,
255
0,0,0
218,158,
8
0,0,0
Body Text
Background
Table highlight
Message Box
Slide Heading or
Heading Boxes
Chart 1
Chart 2
Chart 3
Chart 4
Chart 5
Chart 6
255,204,
204
First choice
1
1
On a red background
On a white background
0.0%
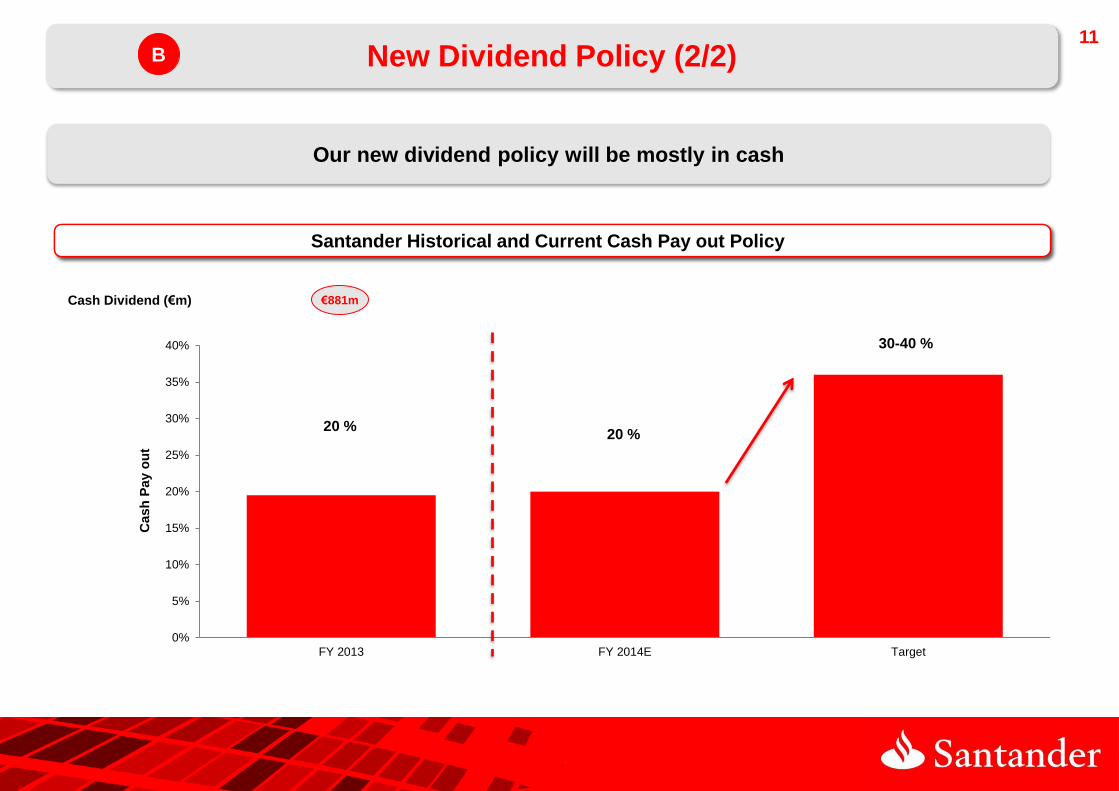
New Dividend Policy (2/2) B
Our new dividend policy will be mostly in cash
Santander Historical and Current Cash Pay-out Policy
20 % 20 %
30-40 %
0%
5%
10%
15%
20%
25%
30%
35%
40%
FY 2013 FY 2014E Target
Cash
Pay o
ut
€881m Cash Dividend (€m)
Santander Historical and Current Cash Pay out Policy
12
GRAVITATED2014\Presentation\2014 11 3 - Equity Story Outline\42 Project Santander Investors Presentation.pptx
178,178,
178
255,0,0
72,72,72
255,170,
170
255,0,0
230,230,
230
255,255,
255
0,0,0
218,158,
8
0,0,0
Body Text
Background
Table highlight
Message Box
Slide Heading or
Heading Boxes
Chart 1
Chart 2
Chart 3
Chart 4
Chart 5
Chart 6
255,204,
204
First choice
1
1
On a red background
On a white background
0.0%
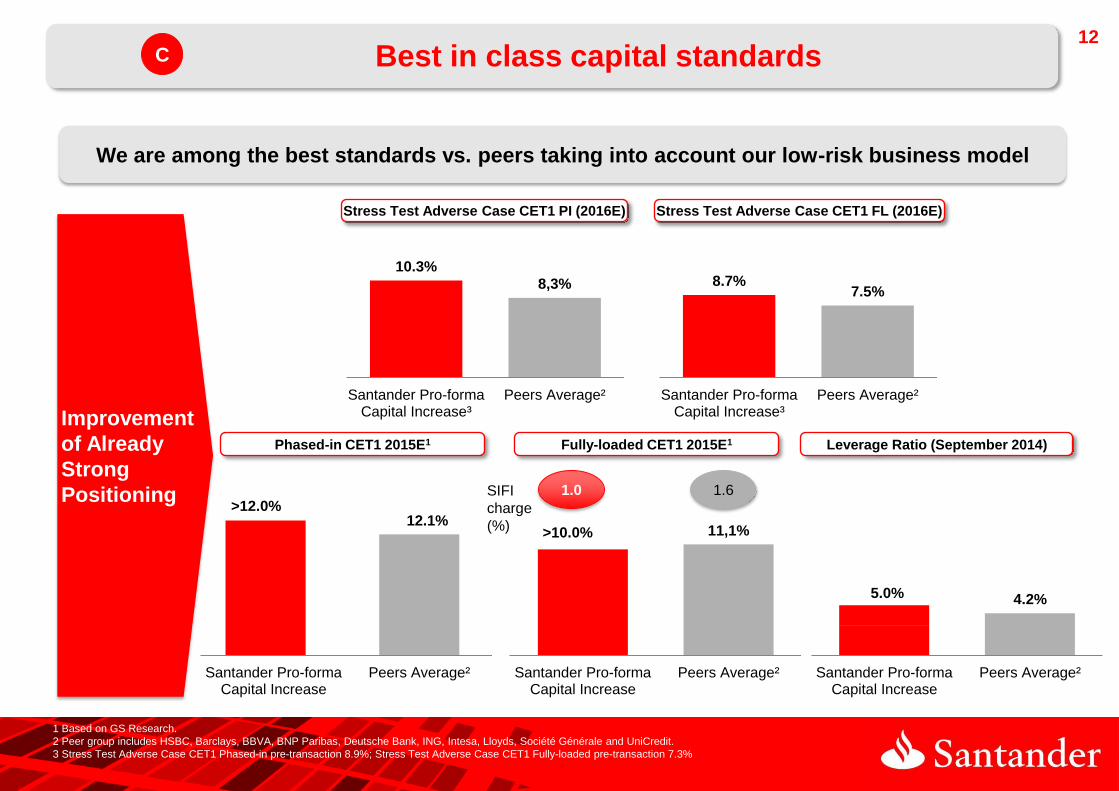
Stress Test Adverse Case CET1 PI (2016E)
11,1%
Santander Pro-formaCapital Increase
Peers Average²
>10.0%
8.7% 7.5%
Santander Pro-formaCapital Increase³
Peers Average²
Best in class capital standards
We are among the best standards vs. peers taking into account our low-risk business model
1 Based on GS Research.
2 Peer group includes HSBC, Barclays, BBVA, BNP Paribas, Deutsche Bank, ING, Intesa, Lloyds, Société Générale and UniCredit.
3 Stress Test Adverse Case CET1 Phased-in pre-transaction 8.9%; Stress Test Adverse Case CET1 Fully-loaded pre-transaction 7.3%
Improvement
of Already
Strong
Positioning
Fully-loaded CET1 2015E1
Stress Test Adverse Case CET1 FL (2016E)
4.2% 5.0%
Santander Pro-formaCapital Increase
Peers Average²
10.3%
8,3%
Santander Pro-formaCapital Increase³
Peers Average²
Phased-in CET1 2015E1 Leverage Ratio (September 2014)
12.1%
Santander Pro-formaCapital Increase
Peers Average²
>12.0%
C
1.0 1.6 SIFI
charge
(%)
13
GRAVITATED2014\Presentation\2014 11 3 - Equity Story Outline\42 Project Santander Investors Presentation.pptx
178,178,
178
255,0,0
72,72,72
255,170,
170
255,0,0
230,230,
230
255,255,
255
0,0,0
218,158,
8
0,0,0
Body Text
Background
Table highlight
Message Box
Slide Heading or
Heading Boxes
Chart 1
Chart 2
Chart 3
Chart 4
Chart 5
Chart 6
255,204,
204
First choice
1
1
On a red background
On a white background
0.0%
I. Transaction Terms
II. Transaction Rationale
III. Financial Impacts and Conclusions
14
GRAVITATED2014\Presentation\2014 11 3 - Equity Story Outline\42 Project Santander Investors Presentation.pptx
178,178,
178
255,0,0
72,72,72
255,170,
170
255,0,0
230,230,
230
255,255,
255
0,0,0
218,158,
8
0,0,0
Body Text
Background
Table highlight
Message Box
Slide Heading or
Heading Boxes
Chart 1
Chart 2
Chart 3
Chart 4
Chart 5
Chart 6
255,204,
204
First choice
1
1
On a red background
On a white background
0.0%
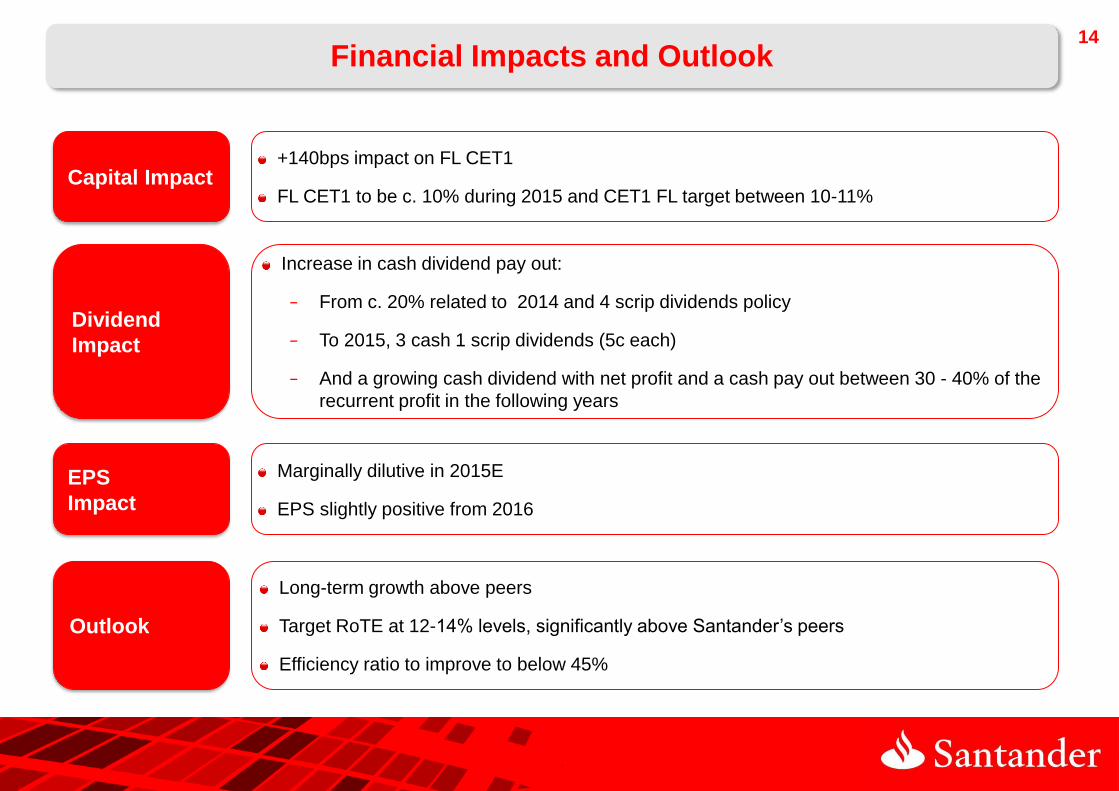
Financial Impacts and Outlook
Capital Impact
EPS
Impact
Dividend
Impact
+140bps impact on FL CET1
FL CET1 to be c. 10% during 2015 and CET1 FL target between 10-11%
Marginally dilutive in 2015E
EPS slightly positive from 2016
Increase in cash dividend pay out:
− From c. 20% related to 2014 and 4 scrip dividends policy
− To 2015, 3 cash 1 scrip dividends (5c each)
− And a growing cash dividend with net profit and a cash pay out between 30 - 40% of the
recurrent profit in the following years
Outlook
Long-term growth above peers
Target RoTE at 12-14% levels, significantly above Santander’s peers
Efficiency ratio to improve to below 45%
16
GRAVITATED2014\Presentation\2014 11 3 - Equity Story Outline\42 Project Santander Investors Presentation.pptx
178,178,
178
255,0,0
72,72,72
255,170,
170
255,0,0
230,230,
230
255,255,
255
0,0,0
218,158,
8
0,0,0
Body Text
Background
Table highlight
Message Box
Slide Heading or
Heading Boxes
Chart 1
Chart 2
Chart 3
Chart 4
Chart 5
Chart 6
255,204,
204
First choice
1
1
On a red background
On a white background
0.0%
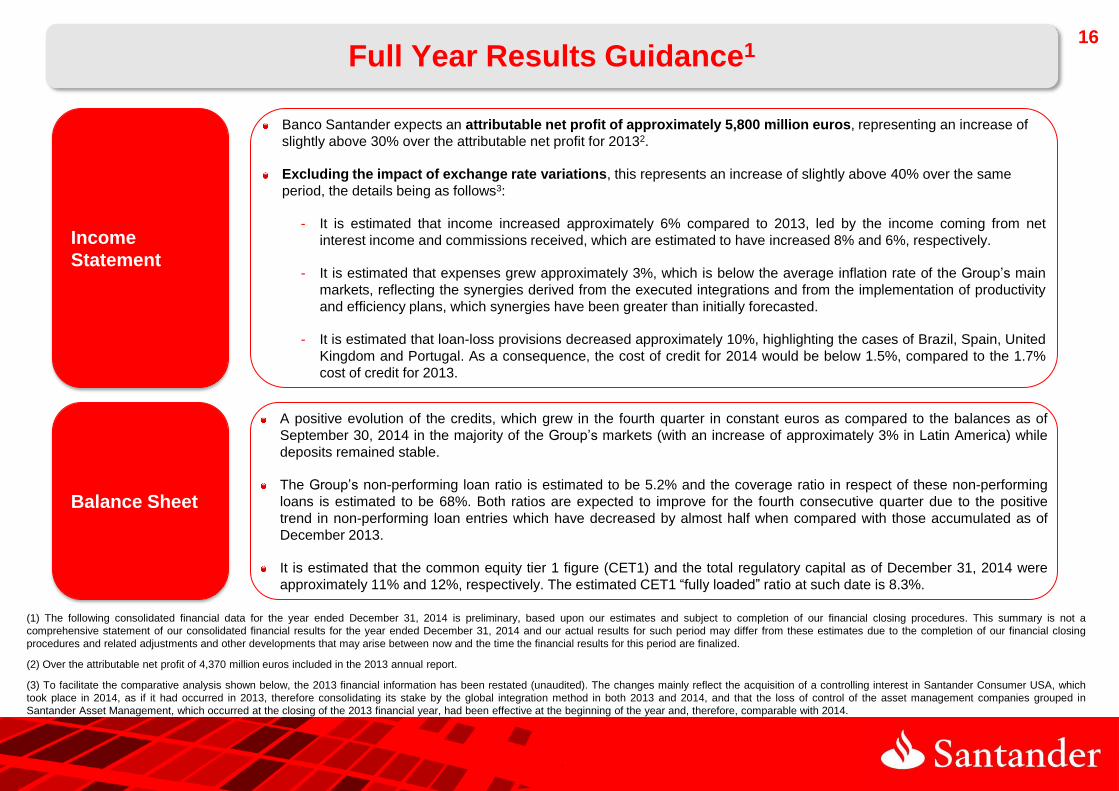
Full Year Results Guidance1
Income
Statement
Balance Sheet
Banco Santander expects an attributable net profit of approximately 5,800 million euros, representing an increase of
slightly above 30% over the attributable net profit for 20132.
Excluding the impact of exchange rate variations, this represents an increase of slightly above 40% over the same
period, the details being as follows3:
- It is estimated that income increased approximately 6% compared to 2013, led by the income coming from net
interest income and commissions received, which are estimated to have increased 8% and 6%, respectively.
- It is estimated that expenses grew approximately 3%, which is below the average inflation rate of the Group’s main
markets, reflecting the synergies derived from the executed integrations and from the implementation of productivity
and efficiency plans, which synergies have been greater than initially forecasted.
- It is estimated that loan-loss provisions decreased approximately 10%, highlighting the cases of Brazil, Spain, United
Kingdom and Portugal. As a consequence, the cost of credit for 2014 would be below 1.5%, compared to the 1.7%
cost of credit for 2013.
A positive evolution of the credits, which grew in the fourth quarter in constant euros as compared to the balances as of
September 30, 2014 in the majority of the Group’s markets (with an increase of approximately 3% in Latin America) while
deposits remained stable.
The Group’s non-performing loan ratio is estimated to be 5.2% and the coverage ratio in respect of these non-performing
loans is estimated to be 68%. Both ratios are expected to improve for the fourth consecutive quarter due to the positive
trend in non-performing loan entries which have decreased by almost half when compared with those accumulated as of
December 2013.
It is estimated that the common equity tier 1 figure (CET1) and the total regulatory capital as of December 31, 2014 were
approximately 11% and 12%, respectively. The estimated CET1 “fully loaded” ratio at such date is 8.3%.
(1) The following consolidated financial data for the year ended December 31, 2014 is preliminary, based upon our estimates and subject to completion of our financial closing procedures. This summary is not a
comprehensive statement of our consolidated financial results for the year ended December 31, 2014 and our actual results for such period may differ from these estimates due to the completion of our financial closing
procedures and related adjustments and other developments that may arise between now and the time the financial results for this period are finalized.
(2) Over the attributable net profit of 4,370 million euros included in the 2013 annual report.
(3) To facilitate the comparative analysis shown below, the 2013 financial information has been restated (unaudited). The changes mainly reflect the acquisition of a controlling interest in Santander Consumer USA, which
took place in 2014, as if it had occurred in 2013, therefore consolidating its stake by the global integration method in both 2013 and 2014, and that the loss of control of the asset management companies grouped in
Santander Asset Management, which occurred at the closing of the 2013 financial year, had been effective at the beginning of the year and, therefore, comparable with 2014.