Embed Size (px)
Citation preview

Cementos ArgosCorporate presentation
December, 2019

Growing multinational, producer of building materials with focus on value creation
Successful track-record deploying
a disciplined expansion strategy
Value generation by
closing efficiency gaps:
BEST program
Healthy financial position
and flexibility to pursue growth
The best footprint
in the Americas
Segmented value proposition
for market differentiation1 2 3
4 5

The best footprint in the Americas

23M MTCement installed capacity
RMC installed capacity
16 M M3
Colombia
USA
Caribbean and Central America
▪ Logistic synergies
▪ Balance between emerging and developed economies
▪ Markets with high growth potential
▪ Negative correlation between economic cycles
Interconnected footprint to maximize value generation
Operating EBITDA by
region*
Revenues by
segment*
Revenues by
region*
*LTM figures, EBITDA without IFRS 16
Cement; 61%
RMC; 39%
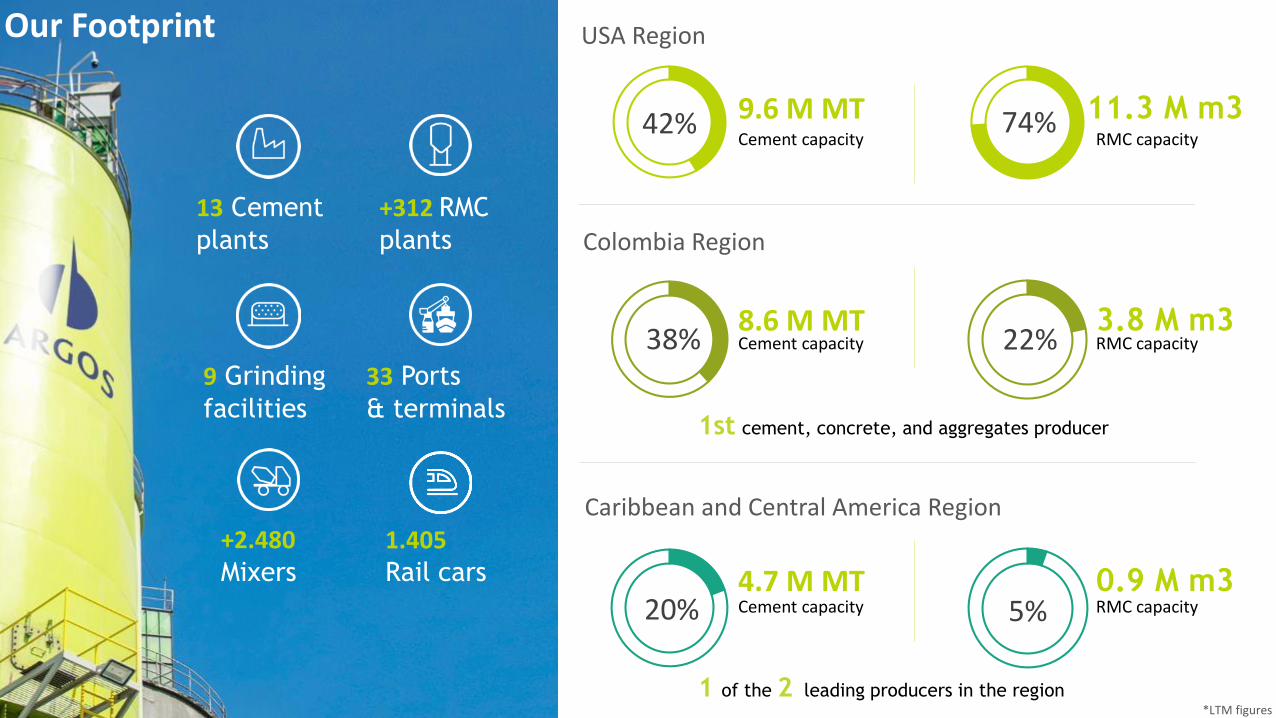
74%
22%
0.9 M m3RMC capacity5%
Caribbean and Central America Region
Colombia Region
USA Region
13 Cement
plants
+312 RMC
plants
9 Grinding
facilities
33 Ports
& terminals
+2.480 Mixers
1.405Rail cars
Our Footprint
Cement capacity
9.6 M MT 11.3 M m3RMC capacity
1st cement, concrete, and aggregates producer
8.6 M MTCement capacity
3.8 M m3RMC capacity
4.7 M MTCement capacity
1 of the 2 leading producers in the region*LTM figures
42%
38%
20%

6
Cement plants
RMC plants
Grinding facilities
Ports/Terminals
US Region: Recovery drives operational growth and EBITDA margin normalization
USD 78.3 MUSD 391 M4Q19 Revenues 4Q19 EBITDA*
20%4Q19 EBITDA margin*
Strategic location close to growing demand centers
Interconnected and privileged assets network:
Imports potential:
Leadership, with relevant market share
Focus on urban centers in RMC business
1.274 rail cars 36% cement sales to RMC operations
9 Ports 5.5 M Tons capacity
Value generation through innovation15 VASP** and/or LEED products
*EBITDA and EBITDA margin under IFRS 16
**Value Added Specialized Products
Construction drivers
Installed Capacity Cement
11.3 M M39.6M MTRMC
Infrastructure ResidentialCommercial
Positive macro fundamentals and reduction in interest rates maintains market stability
Plans at state level materializing
Evident infrastructure needs
Positive momentum in the segment with more relative importance for Argos

COLOMBIA Region: National coverage offers a strong competitive advantage to capture infrastructure and housing growth
COP 157.2 BnCOP 604.1 Bn 26.0%
4Q19 Revenues 4Q19 EBITDA* 4Q19 EBITDA margin
Cement plants
RMC plants
Ports/Terminals
7 Cement plants
1 Port
48 RMC plants
8.7M MT 3.8M M3
Installed Capacity
Cement RMC
Multi-plant player, present across the country with the best logistic interconnection
+9,000 clients in retail segment
Presence in 801 municipalities (71% of the total territory)
15% of the country’s load is mobilized by Argos
+5,700 hardware stores trust us
Differentiated value proposition for the industrial and retail segment
Efficiency and competitiveness
Reduction of more USD 12/MT in 2017 through BEST
30% of revenues generated by innovative products in 2018
*Operating EBITDA y EBITDA margin under IFRS 16
Infrastructure drives construction for Argos strongest segment
Government strategies seek to boost the social housing and reduce inventory levels in regular housing segment
Leaders with more than 80 years of history and broad presence
Reduced imports and macro stability support price recovery

8
Tailor made business model
Positive moment of the market in Dominican Republic: Puerto Rico Reconstruction Plan underway:
7% of GDP growth in 2018
Growth economic activity year to day
5.9% Feb-19 USD 20 BnFunds approved in 1Q19 for reconstruction.
Reconstruction needs estimated at USD 139 Bn
Trading and vertical integration through the Caribbean Sea
47% market share in clinker and cement trading
Transport synergies through an interconnected network of ports, terminals and grinding facilities
11 puertos y terminales
Logistic flexibility
Supply to the Region from plant in Cartagena
Region with the highest ROCE (double digit)
Sources: Banco Central de la República Dominicana, US Department of Housing and Urban Development
*EBITDA y EBITDA margin under IFRS 16
4.7M MTCement RMC
0.9M M3
Installed Capacity
Caribbean and Central America Region: Presence in diversified markets offers flexibility
USD 28.5 MUSD 118 M 24.2%
4Q19 Revenues 4Q19 EBITDA* 4Q19 EBITDA margin
Cement plants
RMC plants
Grinding facilities
Ports/Terminals

Value generation through efficiency:
BEST Program

10
BESTBuilding efficiency and
sustainability for tomorrow Operational
transformation
Alternative
fuels
Reduction of
non core assetsAdministrative
synergies
Clinker to
cement ratio
Leaner and faster Improve ROCE Cost champions Sustainability leadersCustomer centered

11
What have we done?
What are we doing?:
+USD 530M
▪ Working capital optimization
▪ Capex optimization
▪ Additional divestments of non-core assets
▪ Growth through allies (Eg. Agregados Argos)
▪ Increase the operating free cash flow
▪ Fire power to grow
▪ ROCE improvement
▪ Focus on core assets
Goals:
divestments
BEST: Optimization of our assets base as a growth lever
Reduce leverage: 3.2x Net debt / EBITDA + dividends by end of 2020
12
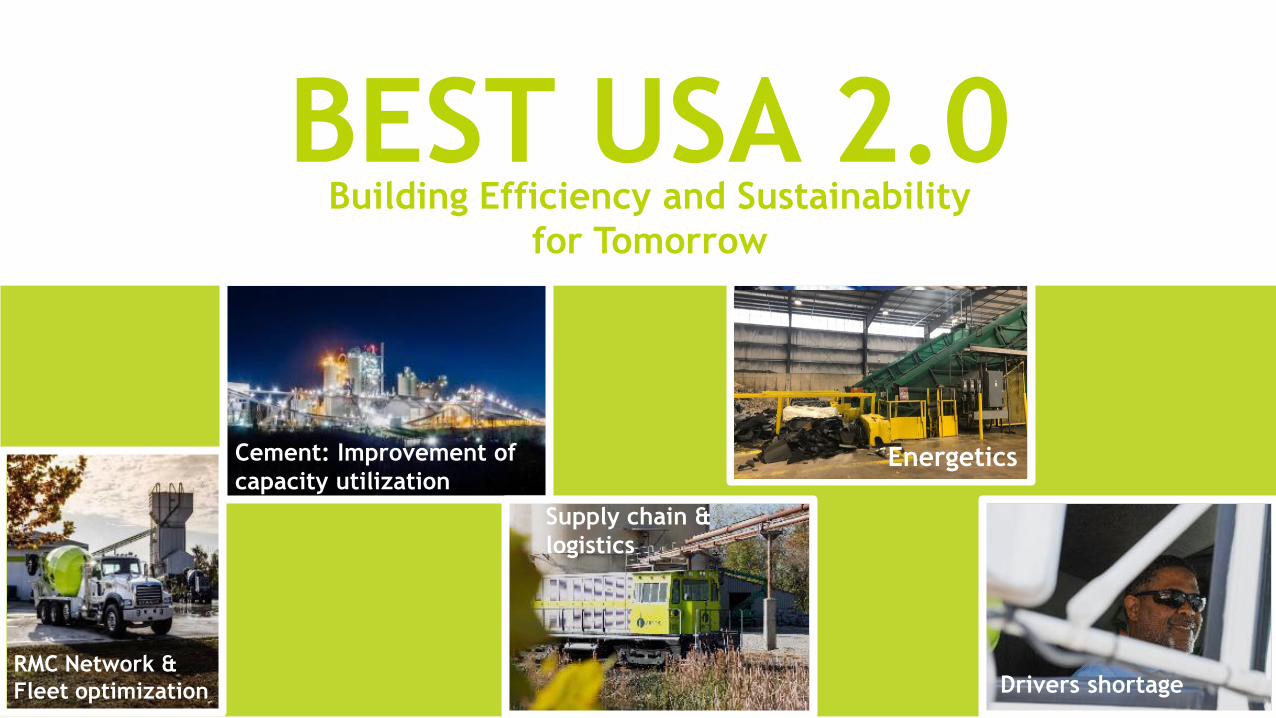
Logistics
BEST: Next steps
Cement: Improvement of
capacity utilization
RMC Network &
Fleet optimization
Supply chain &
logistics
Drivers shortage
Building Efficiency and Sustainability
for Tomorrow
BEST USA 2.0
Energetics
Segmented value proposition
for market differentiation

14
Differentiated value propositionValue added for our customers
Experience and track record
+80 years of experience
Technical Know-how
Participation on emblematic projects in the Americas
Tailor-made service
Tailor-made products and processes
Innovative products
Microcement, advanced concrete, among others
Confidence and backup
Technical experts in high complexity projects
Customer centric
Constant focus on our customers needs
Knowledge transference
Constant training to our customers and suppliers
Accessibility
Presence in +15 countries, 14 states in the USA and
+800 municipalities in Colombia
QualityHigh quality product portfolio
Reputation
DJSI and Merco Colombia supports our trajectory, responsibility and commitment
Industrial Segment Retail Segment
Customer ally Recognized brand Privileged and interconnected network of assets+ +

v
...contributing to the productivity of our customers projects
Argos, at the forefront of the industry´s digital revolution.
▪ Self service from beginning to end
▪ Make online orders
▪ Track the delivery of orders
▪ Generate quality reports
▪ Visualize historical transactions
▪ Make online payments
Successful track-record deploying a
disciplined growth strategy

17
+USD 4.3Bn invested in the last 10 years
13%CAGR revenues
2012-2018
9%CAGR EBITDA
2012-2018
EBITDA* (COP billion)Revenue (COP billion)
USD M 482385 447 524 484 553 547
+ +
Organic growth
▪ 2005: Merge of 8 cement companies in
Colombia
▪ 2012: Non-cement assets spin-off
▪ 2016: BEST as a program to maximize
competitivity
Disciplined growth strategy Boosting the EBITDA growth and value generation
Puerto Rico USD 8 M
West Virginia USD 660 MPuerto Rico terminal USD 18 MFrench Guiana USD 69 MVulcan FL USD 720 MLafarge Honduras USD 305 MLafarge USA USD 760 MHolcim Caribbean USD 157 MRMCC USA USD 243 MCemento Andino USD 192 MSSC USA USD 245 M
Acquisitions
Cartagena USD 560M
Rioclaro USD 93M
Energy plants in Colombia USD 68M
Panama grinding facility expansion USD 65M
Harleyville VCM USD 58M
Cartagena´s distribution center USD 35M
White cement conversion USD 23M
Oil-well cement development USD 1M
Note: COLGAAP figures 2010-2013, IFRS figures 2014-2019
USD M 2,437 2,656 2,833 2,881 2,790 2,892 2,848
* Operating EBITDA without adoption of IFRS 16: excluding, among others, non-recurring income related to the sale of self-generators in Colombia (COP 27 BN 4Q19) and land valuation in Colombia (COP 25 BN 4Q19)
(organic and inorganic)
Focus and reorganization
4.3804.968
5.817
7.9128.597 8.586 8.418
9.375
2012 2013 2014 2015 2016 2017 2018 2019
2,856
791
978 968
1.519
1.672
1.481 1.486 1.536
18,1%19,7%
16,6%19,2% 19,4%
17,2% 17,7% 16,4%
2012 2013 2014 2015 2016 2017 2018 2019
468
2.218 2.503
2.108 2.348
-
1.000
2.000
3.000
4.000
5.000
6.000
2018 2019
3Q 4Q
425 388
413 421
-
100
200
300
400
500
600
700
800
900
2018 2019
3Q 4Q

Track record of successfully implementing a disciplined growth strategy
WV, USA – Heidelberg (2016)
USD 660M
Cement Plant 2.2 M MT
Terminals 8 Florida, USA – Vulcan Cement Investment (2014)
USD 720M
Cement Plant 1.6 M MT
Ports
Grinding facilities 1.9 M MT
RMX 3.3 M m3
Blocks 109 M units / year
2
French Guiana – Lafarge (2014)
€50M
Grinding Facility 0.2 M MT
(100% ownership)
Port concession
€231 M
Cement Plant
Grinding facility
1.0 M MT
0.3 M m3
(53% ownership)
Puerto Rico
2015: USD18.3M
Port
(60% ownership)
2017: USD 8M(60% ownership)
Cement Plant
0.6 M MT
USA – Lafarge (2011)
USD 760M
Honduras – Lafarge (2013)
Colombia
USA
Caribbean and Central America
Ports & terminals
Grinding facilities 1
RMX 79 plants
6
Cement Plant 2

Healthy financial position and
flexibility to pursue growth

20
Match between currencies and EBITDA generation and competitive cost of debt
Extended debt’s average life for enhanced flexibility
Expedite access to the Colombian capital markets
▪ Recognized as a recurrent issuer
Local and international banks
Stock portfolio provides additional flexibility
▪ Two types of shares (CEMARGOS and PFCEMARGOS)
Debt Structure per currency (December 2019)
Access to diverse sources of financial flexibility
▪ Grupo Sura: 6% (Common share)
Flexible debt structure and access to funding sources to finance growth
Cost of debt:
▪ 7.6% COP
▪ 4.1% USD
310 300 211420
121303
159312 388
184 126
401
165
999983
0
0
0
19
2620
00
0
0
200
400
600
800
1.000
1.200
1.400
2021 2022 2023 2024 2025 2026 2027 2028 2029 2030 2031 2038 2042
Bonds Banks

21
Delivering on our plan to reduce leverage
▪ Non Core assets divestment plan
▪ Capex Optimization
▪ Working capital improvement
▪ EBITDA growth
3.2x Net debt / EBITDA
www.argos.co/ir
[email protected] recognition, given by the Colombian Stock
Exchange, does not certify the quality of the registered
stock, nor does it guarantee the solvency of the issuer.