Embed Size (px)
Citation preview

Scale
2
pillars
Diversification Sustainability

structure
4
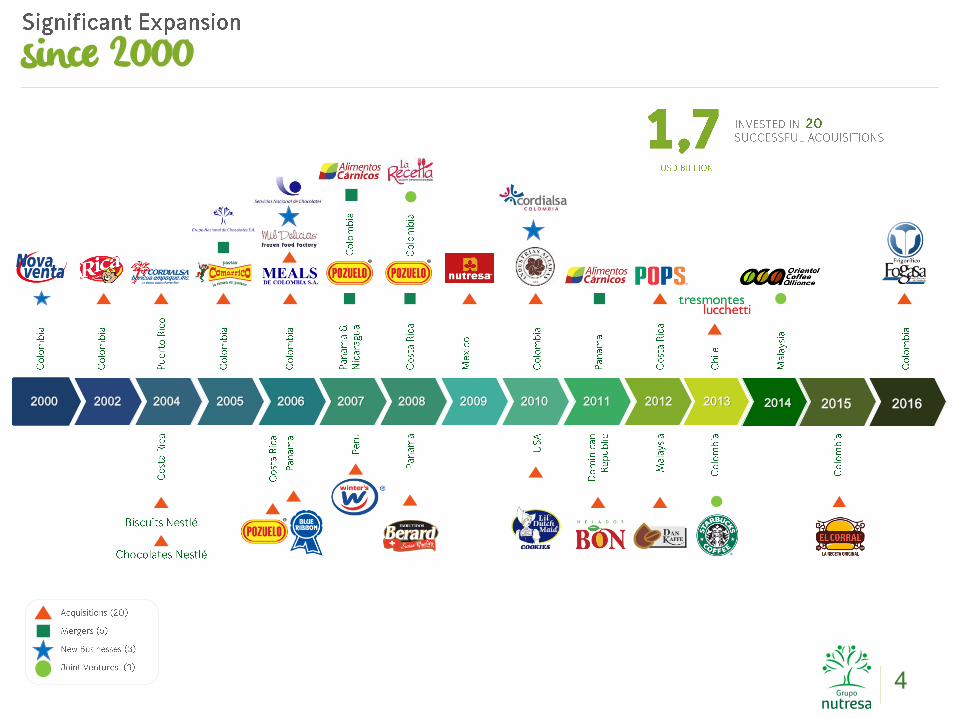
since 2000
2000 2002 2004 2005 2006 2007 2008 2009 2010 2011 2012 2013 2014 2015 2016
5
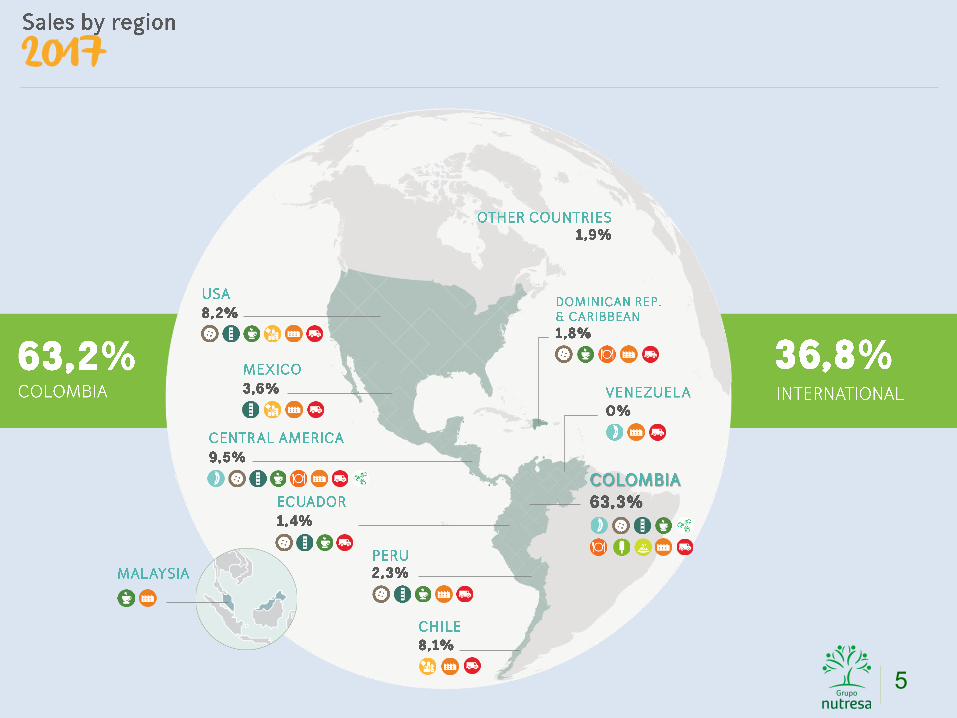
2017

Biscuits Chocolates CoffeeCold Cuts TMLUC Ice Cream Pasta
6
Retail Food
Colombia + TMLUC

Distribution
7

31%
28%17%
13%
6%
5%
21%
20%
17%12%
11%
8%
5%
3%
21%
20%
20%
12%
12%
8%
4%
3%
2017
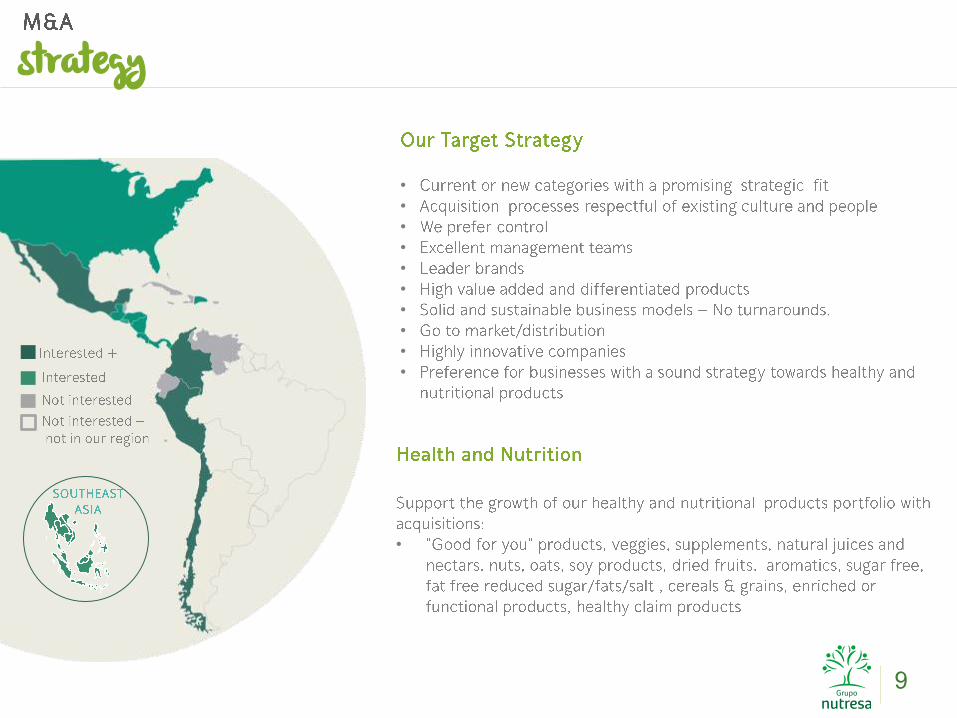
•
•
•
•
•
•
•
•
•
•
9
•
strategy

10
Strategic Goal
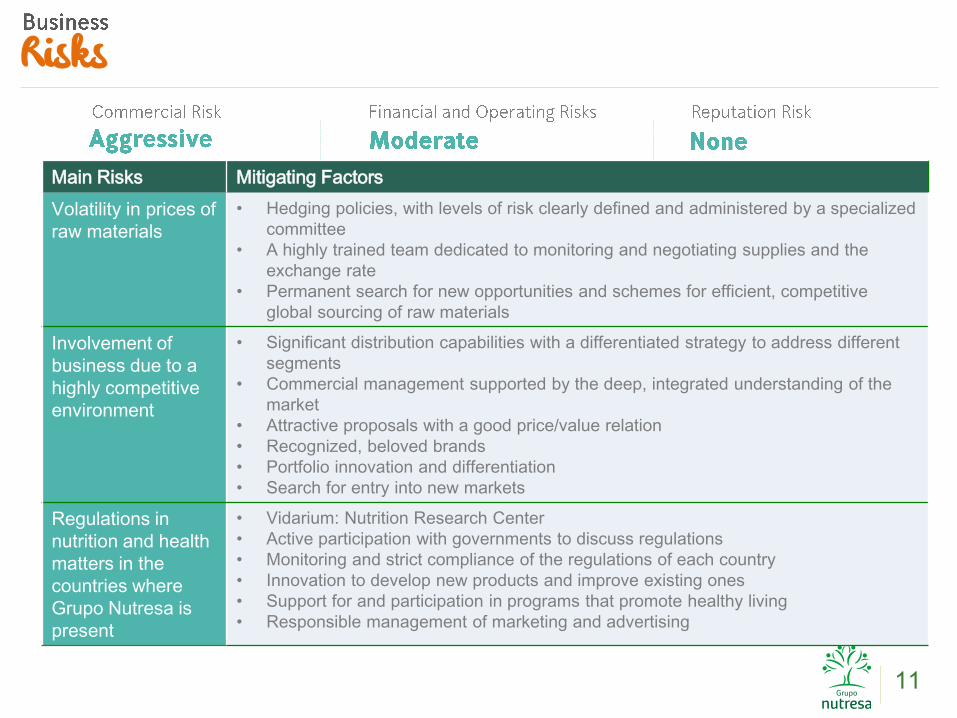
Main Risks Mitigating Factors
Volatility in prices of
raw materials
• Hedging policies, with levels of risk clearly defined and administered by a specialized
committee
• A highly trained team dedicated to monitoring and negotiating supplies and the
exchange rate
• Permanent search for new opportunities and schemes for efficient, competitive
global sourcing of raw materials
Involvement of
business due to a
highly competitive
environment
• Significant distribution capabilities with a differentiated strategy to address different
segments
• Commercial management supported by the deep, integrated understanding of the
market
• Attractive proposals with a good price/value relation
• Recognized, beloved brands
• Portfolio innovation and differentiation
• Search for entry into new markets
Regulations in
nutrition and health
matters in the
countries where
Grupo Nutresa is
present
• Vidarium: Nutrition Research Center
• Active participation with governments to discuss regulations
• Monitoring and strict compliance of the regulations of each country
• Innovation to develop new products and improve existing ones
• Support for and participation in programs that promote healthy living
• Responsible management of marketing and advertising
11
Risks

governance
1 2 3 5
2 5 711
2 3
12
1 7
52
4
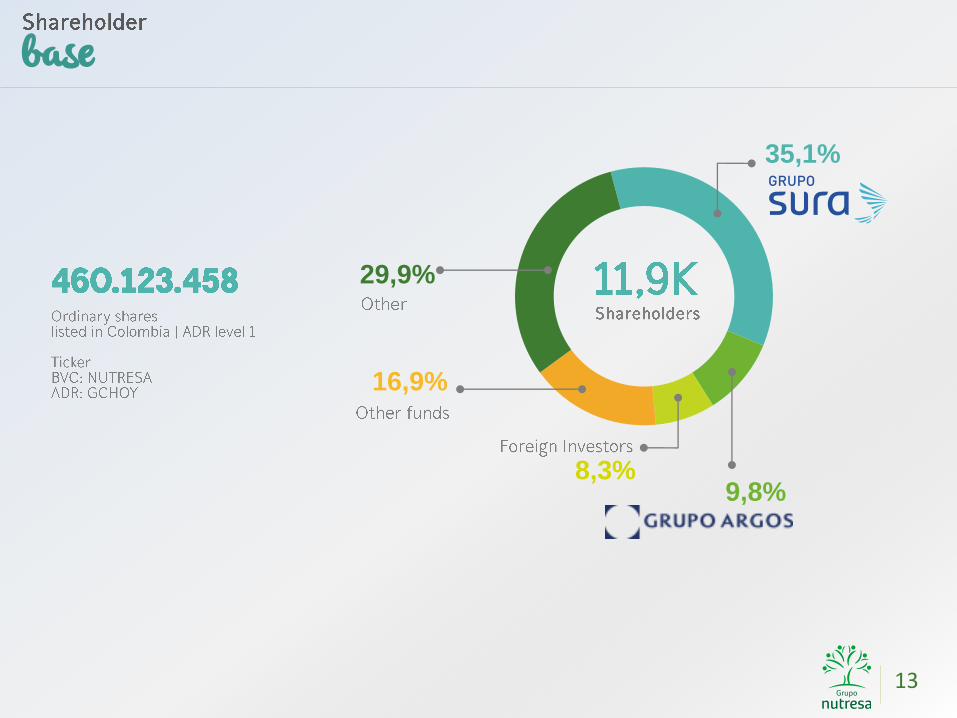
13
35,1%
9,8%8,3%
16,9%
29,9%
base

Annexes
15
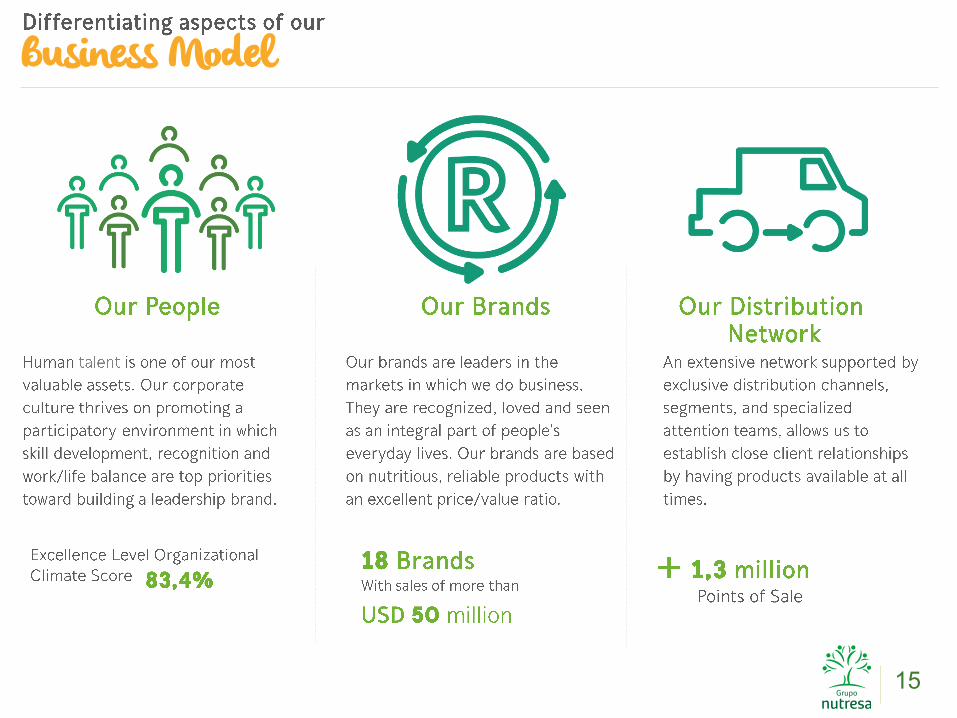
Business Model

Our people
16
people
17
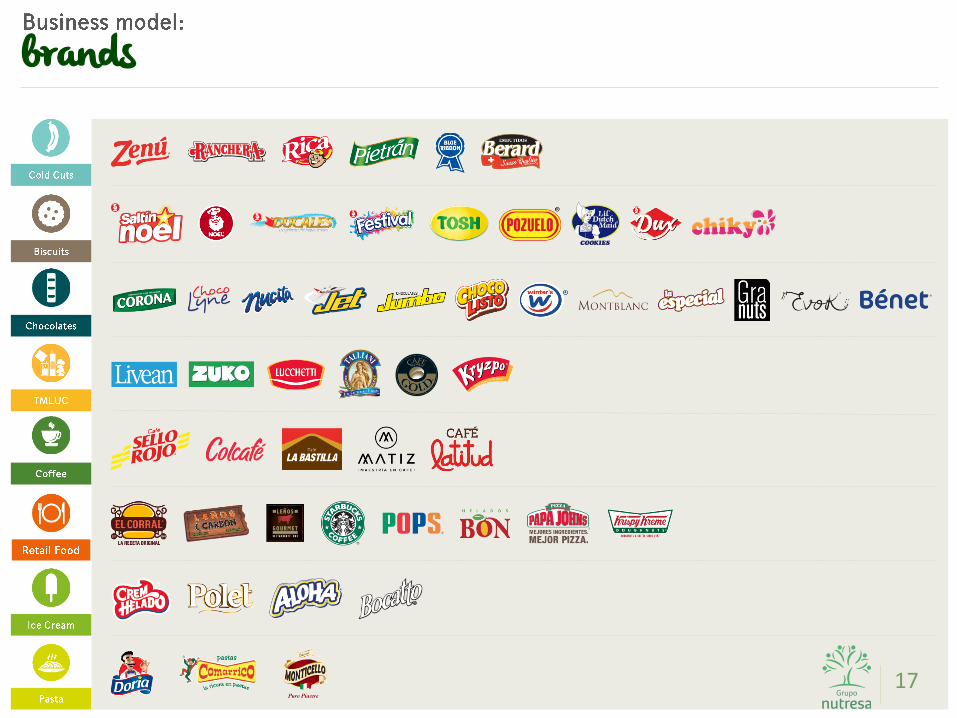
brands

18
brands
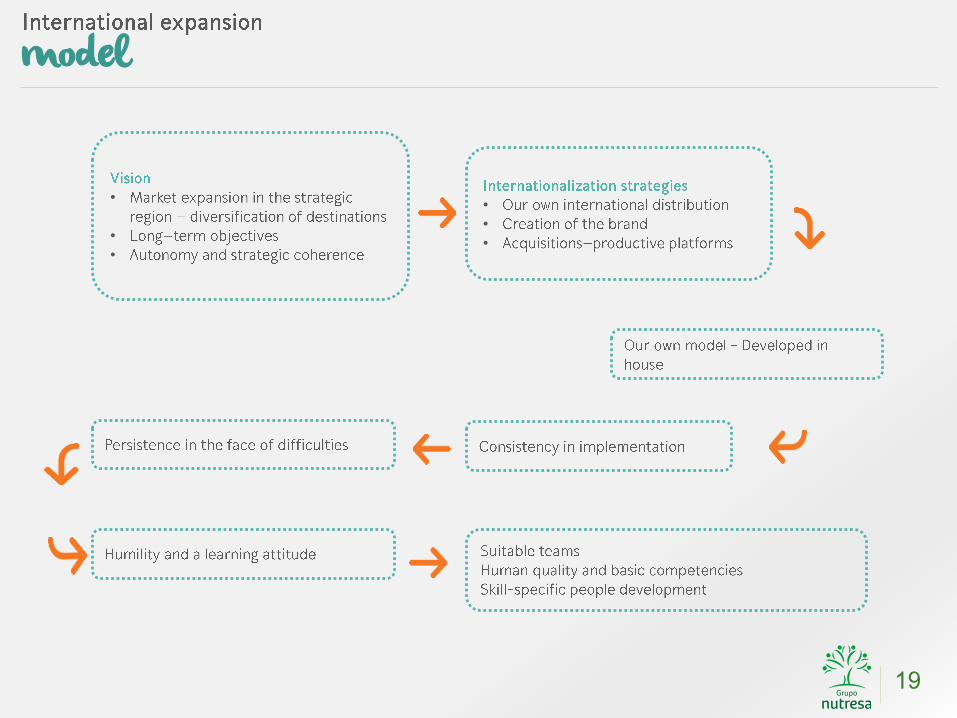
19
model
•
•
•
•
•
•

20
phases

21
performance

El Reconocimiento Emisores – IR otorgado por la Bolsa de Valores de Colombia S.A.
no es una certificación sobre la bondad de los valores inscritos ni sobre la solvencia del
emisor
22
growth

24
10,0
14,2
10,2 10,1
12,6
16,7
12,9 12,0 12,1 12,5
9,8 10,0 9,9
17,0
20,3
14,713,1
18,1
23,8
18,5 18,016,5 17,3
13,4 14,0 14,1
0
5
10
15
20
25
2005 2006 2007 2008 2009 2010 2011 2012 2013 2014 2015 2016 2017
EV/EBITDA
EV/EBITDA Alimentos - food EV/EBITDA Total
FIGURES IN COP$ MM
(1) Calculated over total shareholder equity
(2) Food companies / 12 months
(3) Last 12 months
Indicators - as of December 31, 2017
Closing price 27.820 Dividend Yield (3) 2,1%
Closing price 12 months prior 24.900 Share Price Return (3) 11,7%
Max. 52 weeks 28.000 Total Return (3) 14,0%
Min. 52 weeks 23.120 Change in COLCAP (3) 12,0%
Market Cap. (COPMM) 12.800.635
Return on Equity (2) 8,2%
Intrinsic value (1) 19.452 Return on Invested Capital (2) 8,4%
P/E Ratio (2) 23,2
P/BV (2) 1,8 Outstanding Shares 460.123.458
EV / EBITDA (2) 10,6 Number of Shareholders 11.900
Earnings per Share (3) 913 Bursatility High
Dividend per share-month 44,5
December 2017
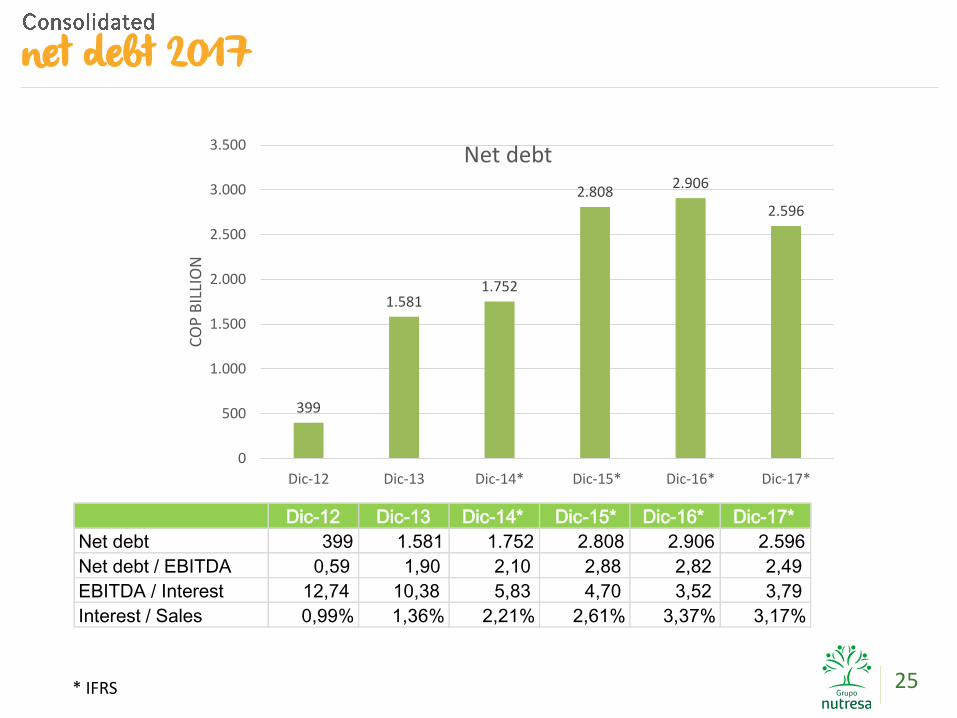
25* IFRS
399
1.5811.752
2.8082.906
2.596
0
500
1.000
1.500
2.000
2.500
3.000
3.500
Dic-12 Dic-13 Dic-14* Dic-15* Dic-16* Dic-17*
CO
P B
ILLI
ON
Net debt
Dic-12 Dic-13 Dic-14* Dic-15* Dic-16* Dic-17*
Net debt 399 1.581 1.752 2.808 2.906 2.596
Net debt / EBITDA 0,59 1,90 2,10 2,88 2,82 2,49
EBITDA / Interest 12,74 10,38 5,83 4,70 3,52 3,79
Interest / Sales 0,99% 1,36% 2,21% 2,61% 3,37% 3,17%
net debt 2017
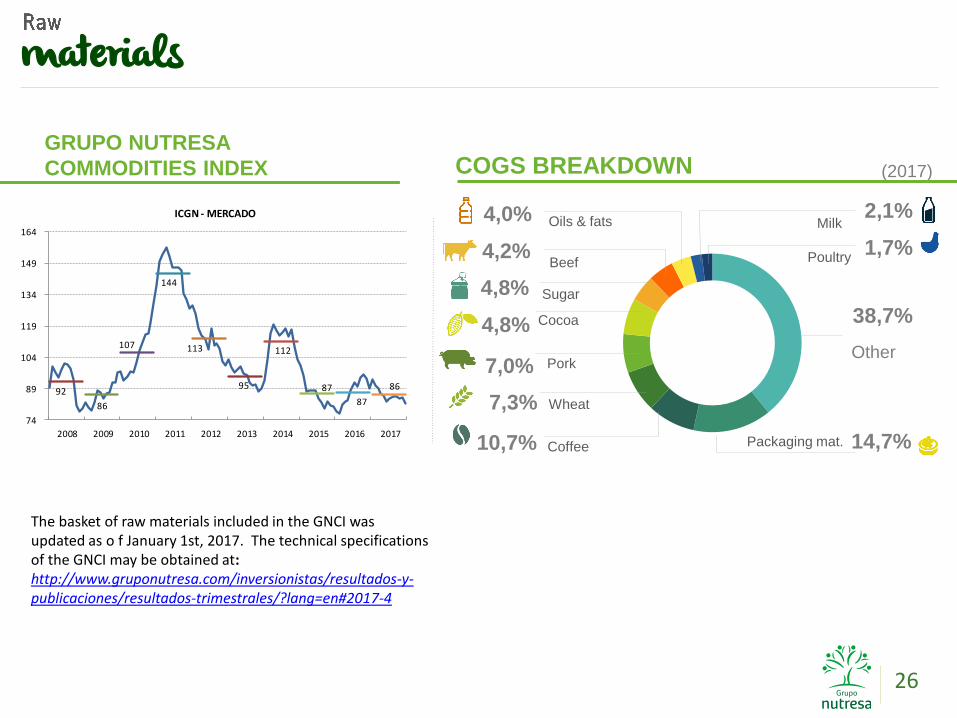
GRUPO NUTRESA
COMMODITIES INDEX
26
38,7%
14,7%10,7%
7,3%
7,0%
4,8%
4,8%
4,2%
4,0%
1,7%
2,1%
COGS BREAKDOWN (2017)
Packaging mat.Coffee
Pork
Wheat
Cocoa
Sugar
Oils & fats
Beef
Milk
Other
Poultry
The basket of raw materials included in the GNCI was updated as o f January 1st, 2017. The technical specifications of the GNCI may be obtained at:http://www.gruponutresa.com/inversionistas/resultados-y-publicaciones/resultados-trimestrales/?lang=en#2017-4
92
86
107
144
113
95
112
87
87
86
74
89
104
119
134
149
164
2008 2009 2010 2011 2012 2013 2014 2015 2016 2017
ICGN - MERCADO
materials

4T17 Results

SALES PERBUSINESS UNIT
4Q - 2017
Colombia salesCOP 1.449,4 mm +0,7%Cop billion
28
International SalesUSD 286,2 mm +5,5%
COP 854,8 +4,5%Cop billion
Percentage variation in
volume (Q) and prices (P)
% chg. YoY Million dollars
% chg. YoY Billion pesos
Retail Food
Cold cuts Biscuits Chocolates Coffee
Cold Cuts Biscuits Chocolates CoffeeTMLUC
RetailFood
PastaIce cream
* Variation doesn’t include
Retail Food
456,9
232,4 227,5
150,6 133,0106,9
72,5
050
100150200250300350400450500
CO
P B
ILL
ION
17,4
81,0
58,1
80,8
30,6
18,1
0
10
20
30
40
50
60
70
80
90
US
D M
ILLIO
N
-3,6%
-1,7%
+1,2%+5,0%
-0,9%
Q: -2,0P: +1,9*
-1,2%
+6,3%
+14,7%
+0,8%
+9,6%
Q:-3,1
P:-0,6
Q:-3,8
P:+2,7
Q:+0,8
P:-2,5
Q:-0,9
P:+2,1
-10,4%
Q:+0,9
P:+4,1
Q:-2,9
P:+2,0
+9,7%
+31,4%
Colombia & international
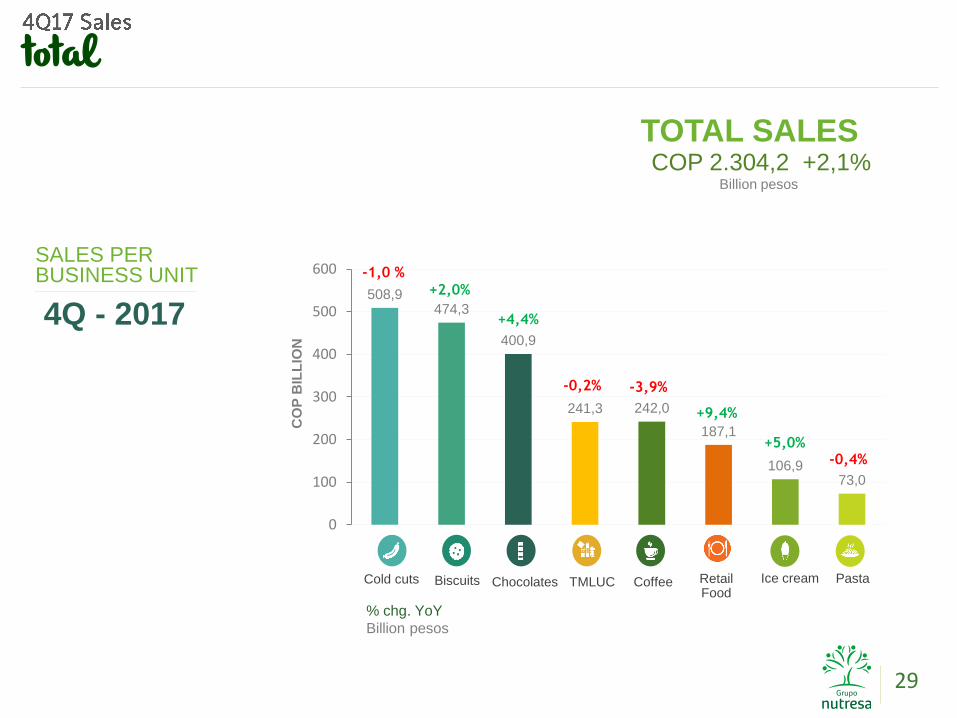
COP 2.304,2 +2,1%
29
% chg. YoY
Billion pesos
SALES PERBUSINESS UNIT
4Q - 2017
TOTAL SALES
Cold cuts Biscuits Chocolates CoffeeTMLUC PastaRetailFood
Ice cream
Billion pesos
508,9 474,3
400,9
241,3 242,0
187,1
106,9 73,0
0
100
200
300
400
500
600
CO
P B
ILL
ION
+2,0%
+4,4%
+5,0%
-0,2% -3,9%
-0,4%
+9,4%
-1,0 %
total

SALES PERBUSINESS UNIT
2017
Colombia salesCOP 5.495,4 mm +2,5%Cop billion
30
International SalesEx-Venezuela 2016
USD 1.083,9 mm +5,7%
COP 3.200,2 +2,4%Cop billion
Percentage variation in
volume (Q) and prices (P)
% chg. YoY Million dollars
% chg. YoY Billion pesos
Retail Food
Cold cuts Biscuits Chocolates Coffee
Cold Cuts Biscuits Chocolates CoffeeTMLUC
RetailFood
PastaIce cream
* Variation doesn’t include
Retail Food
(Since October 2016, investments in
Venezuela are accounted as financial
instruments)
• Ex-Venezuela 2016
Including Venezuela 2016
USD -0,3%
COP -3,4%
1.660,2
877,0 919,4
594,2484,6 423,5
292,7
0200400600800
1.0001.2001.4001.6001.800
CO
P B
ILL
ION
55,5
301,9
184,1
331,5
138,2
71,9
0
50
100
150
200
250
300
350
US
D M
ILLIO
N
-1,1%
+3,2%
+4,5%
-3,0%+2,3%
Q: -2,6P: +4,6*
+2,6%
+4,3%
+5,6%
+3,0%
+4,0%
Q:-2,8
P:+1,8
Q: -3,8
P:+6,6
Q:-1,3
P:+4,6
Q:+3,8
P: +0,7
+9,3%
Q:-8,9
P: +6,6
Q:+1,5
P: +0,8
+8,7%
+34,5%*
Colombia & international
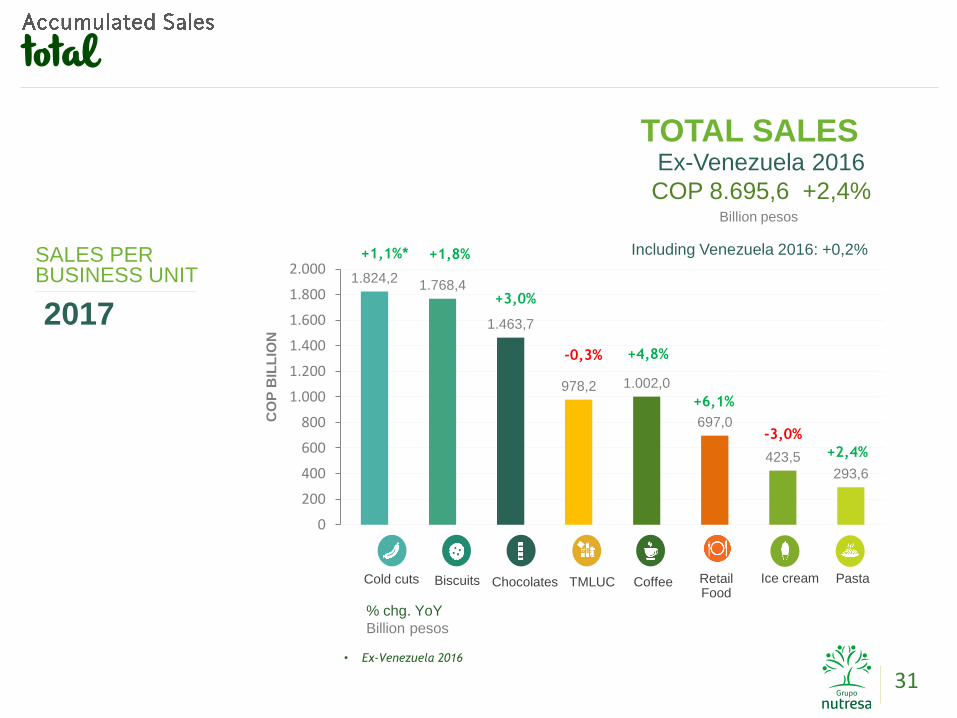
1.824,2 1.768,4
1.463,7
978,2 1.002,0
697,0
423,5
293,6
0
200
400
600
800
1.000
1.200
1.400
1.600
1.800
2.000C
OP
BIL
LIO
N
Ex-Venezuela 2016
COP 8.695,6 +2,4%
31
% chg. YoY
Billion pesos
SALES PERBUSINESS UNIT
2017
TOTAL SALES
Cold cuts Biscuits Chocolates CoffeeTMLUC PastaRetailFood
Ice cream
Billion pesos
Including Venezuela 2016: +0,2%
• Ex-Venezuela 2016
+1,8%
+3,0%
-3,0%
-0,3% +4,8%
+2,4%
+6,1%
+1,1%*
total
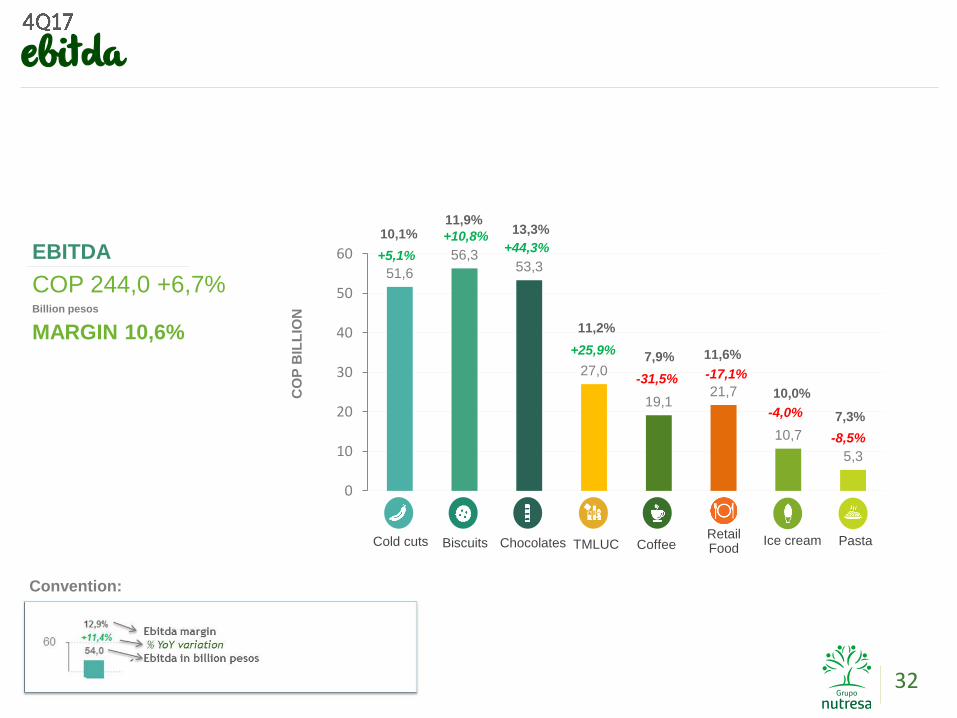
EBITDA
COP 244,0 +6,7%Billion pesos
MARGIN 10,6%
32
Convention:
Cold cuts Biscuits Chocolates CoffeeTMLUC PastaRetail Food
Ice cream
51,6
56,3 53,3
27,0
19,1 21,7
10,7
5,3
0
10
20
30
40
50
60
CO
P B
ILL
ION
13,3%
+44,3%
11,6%
-17,1%
10,1%
+5,1%
11,9%
+10,8%
11,2%
+25,9%
10,0%
-4,0%
7,9%
-31,5%
7,3%
-8,5%
ebitda
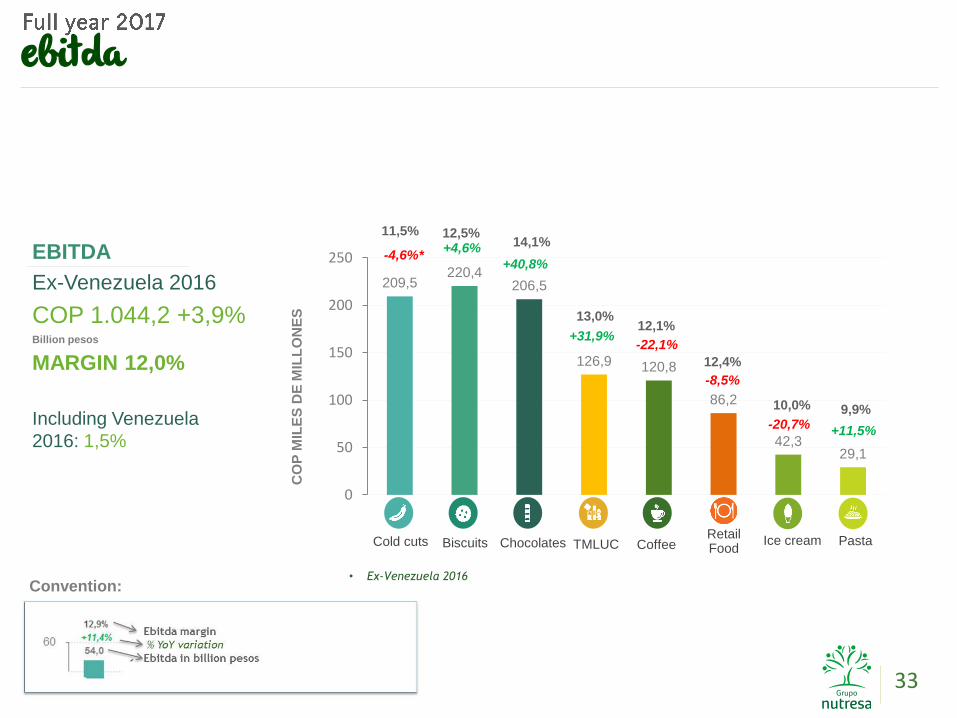
EBITDA
Ex-Venezuela 2016
COP 1.044,2 +3,9%Billion pesos
MARGIN 12,0%
33
Convention:
Cold cuts Biscuits Chocolates CoffeeTMLUC PastaRetail Food
Ice cream
Including Venezuela
2016: 1,5%
• Ex-Venezuela 2016
209,5 220,4
206,5
126,9 120,8
86,2
42,3 29,1
0
50
100
150
200
250
CO
P M
ILE
S D
E M
ILL
ON
ES
14,1%
+40,8%
12,4%
-8,5%
11,5%
-4,6%*
12,5%+4,6%
13,0%
+31,9%
10,0%
-20,7%
12,1%
-22,1%
9,9%
+11,5%
ebitda
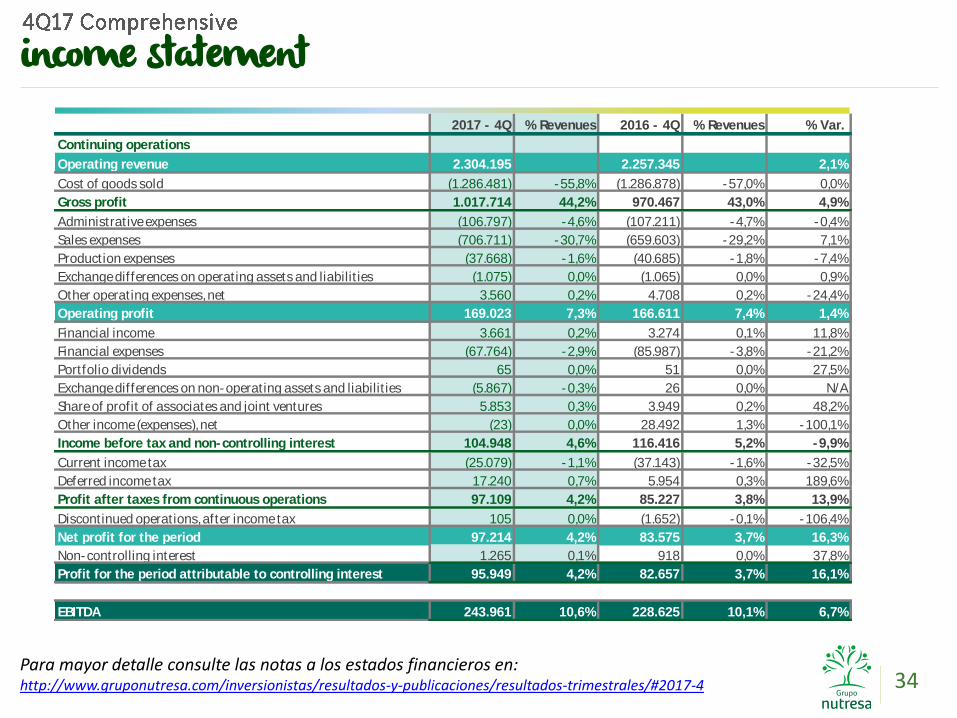
34Para mayor detalle consulte las notas a los estados financieros en:http://www.gruponutresa.com/inversionistas/resultados-y-publicaciones/resultados-trimestrales/#2017-4
2017 - 4Q % Revenues 2016 - 4Q % Revenues % Var.
Continuing operations
Operating revenue 2.304.195 2.257.345 2,1%
Cost of goods sold (1.286.481) -55,8% (1.286.878) -57,0% 0,0%
Gross profit 1.017.714 44,2% 970.467 43,0% 4,9%
Administrative expenses (106.797) -4,6% (107.211) -4,7% -0,4%
Sales expenses (706.711) -30,7% (659.603) -29,2% 7,1%
Production expenses (37.668) -1,6% (40.685) -1,8% -7,4%
Exchange differences on operating assets and liabilit ies (1.075) 0,0% (1.065) 0,0% 0,9%
Other operating expenses, net 3.560 0,2% 4.708 0,2% -24,4%
Operating profit 169.023 7,3% 166.611 7,4% 1,4%
Financial income 3.661 0,2% 3.274 0,1% 11,8%
Financial expenses (67.764) -2,9% (85.987) -3,8% -21,2%
Portfolio dividends 65 0,0% 51 0,0% 27,5%
Exchange differences on non-operating assets and liabilit ies (5.867) -0,3% 26 0,0% N/A
Share of profit of associates and joint ventures 5.853 0,3% 3.949 0,2% 48,2%
Other income (expenses), net (23) 0,0% 28.492 1,3% -100,1%
Income before tax and non-controlling interest 104.948 4,6% 116.416 5,2% -9,9%
Current income tax (25.079) -1,1% (37.143) -1,6% -32,5%
Deferred income tax 17.240 0,7% 5.954 0,3% 189,6%
Profit after taxes from continuous operations 97.109 4,2% 85.227 3,8% 13,9%
Discontinued operations, after income tax 105 0,0% (1.652) -0,1% -106,4%
Net profit for the period 97.214 4,2% 83.575 3,7% 16,3%
Non-controlling interest 1.265 0,1% 918 0,0% 37,8%
Profit for the period attributable to controlling interest 95.949 4,2% 82.657 3,7% 16,1%
EBITDA 243.961 10,6% 228.625 10,1% 6,7%
income statement
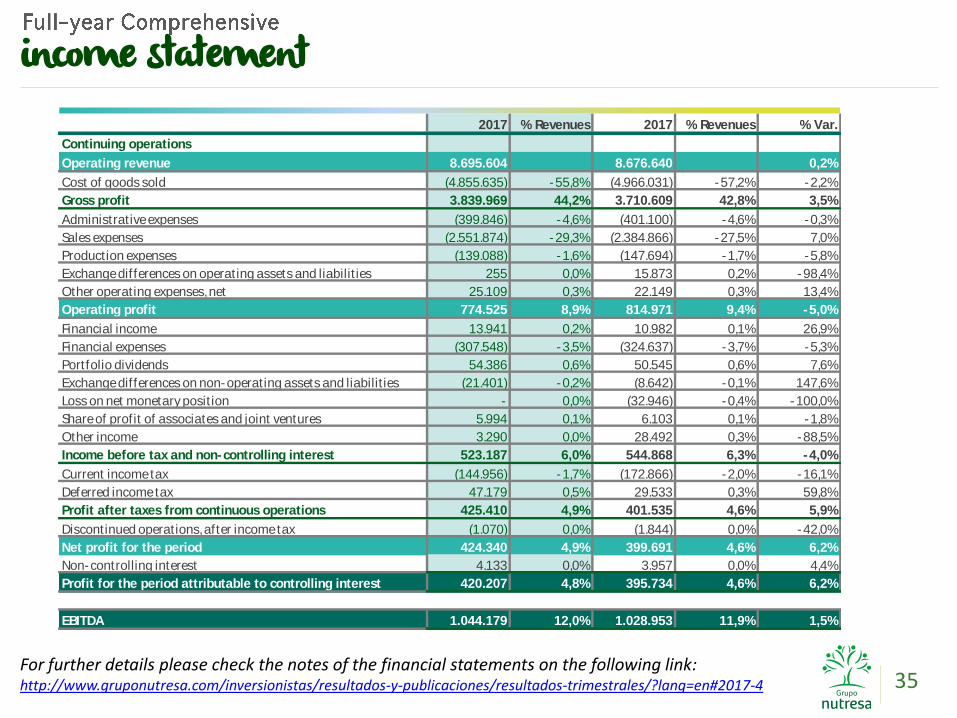
35For further details please check the notes of the financial statements on the following link:http://www.gruponutresa.com/inversionistas/resultados-y-publicaciones/resultados-trimestrales/?lang=en#2017-4
2017 % Revenues 2017 % Revenues % Var.
Continuing operations
Operating revenue 8.695.604 8.676.640 0,2%
Cost of goods sold (4.855.635) -55,8% (4.966.031) -57,2% -2,2%
Gross profit 3.839.969 44,2% 3.710.609 42,8% 3,5%
Administrative expenses (399.846) -4,6% (401.100) -4,6% -0,3%
Sales expenses (2.551.874) -29,3% (2.384.866) -27,5% 7,0%
Production expenses (139.088) -1,6% (147.694) -1,7% -5,8%
Exchange differences on operating assets and liabilit ies 255 0,0% 15.873 0,2% -98,4%
Other operating expenses, net 25.109 0,3% 22.149 0,3% 13,4%
Operating profit 774.525 8,9% 814.971 9,4% -5,0%
Financial income 13.941 0,2% 10.982 0,1% 26,9%
Financial expenses (307.548) -3,5% (324.637) -3,7% -5,3%
Portfolio dividends 54.386 0,6% 50.545 0,6% 7,6%
Exchange differences on non-operating assets and liabilit ies (21.401) -0,2% (8.642) -0,1% 147,6%
Loss on net monetary posit ion - 0,0% (32.946) -0,4% -100,0%
Share of profit of associates and joint ventures 5.994 0,1% 6.103 0,1% -1,8%
Other income 3.290 0,0% 28.492 0,3% -88,5%
Income before tax and non-controlling interest 523.187 6,0% 544.868 6,3% -4,0%
Current income tax (144.956) -1,7% (172.866) -2,0% -16,1%
Deferred income tax 47.179 0,5% 29.533 0,3% 59,8%
Profit after taxes from continuous operations 425.410 4,9% 401.535 4,6% 5,9%
Discontinued operations, after income tax (1.070) 0,0% (1.844) 0,0% -42,0%
Net profit for the period 424.340 4,9% 399.691 4,6% 6,2%
Non-controlling interest 4.133 0,0% 3.957 0,0% 4,4%
Profit for the period attributable to controlling interest 420.207 4,8% 395.734 4,6% 6,2%
EBITDA 1.044.179 12,0% 1.028.953 11,9% 1,5%
income statement

36
For further details please check the notes of the financial statements on the following link:http://www.gruponutresa.com/inversionistas/resultados-y-publicaciones/resultados-trimestrales/?lang=en#2017-4
December 2017 December 2016 % Var.
ASSETS
Current assets
Cash and cash equivalents 435.643 219.322 98,6%
Trade and other receivables 957.568 889.197 7,7%
Inventories 982.816 1.028.417 -4,4%
Biological assets 81.518 75.677 7,7%
Other current assets 221.475 246.832 -10,3%
Non-current assets held for sale 6.557 100.330 -93,5%
Total current assets 2.685.577 2.559.775 4,9%
Non-current assets
Trade and other receivables 26.509 23.495 12,8%
Investments in associated and joint ventures 180.451 164.510 9,7%
Other f inancial non-current assets 4.133.963 3.885.206 6,4%
Property, plant and equipment, net 3.395.671 3.390.946 0,1%
Investment properties 72.306 71.842 0,6%
Goodwill 2.118.226 2.034.454 4,1%
Other intangible assets 1.181.350 1.163.671 1,5%
Deferred tax assets 415.072 356.994 16,3%
Other non-current assets 100.352 48.661 106,2%
Total non-current assets 11.623.900 11.139.779 4,3%
TOTAL ASSETS 14.309.477 13.699.554 4,5%
financial position
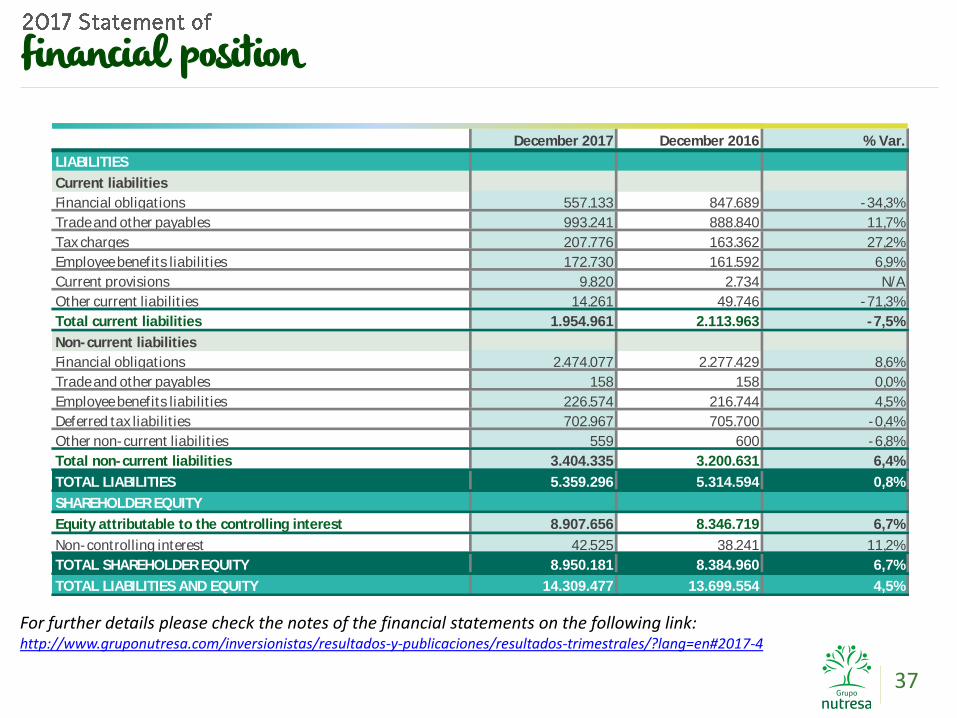
37
For further details please check the notes of the financial statements on the following link:http://www.gruponutresa.com/inversionistas/resultados-y-publicaciones/resultados-trimestrales/?lang=en#2017-4
December 2017 December 2016 % Var.
LIABILITIES
Current liabilities
Financial obligations 557.133 847.689 -34,3%
Trade and other payables 993.241 888.840 11,7%
Tax charges 207.776 163.362 27,2%
Employee benefits liabilit ies 172.730 161.592 6,9%
Current provisions 9.820 2.734 N/A
Other current liabilit ies 14.261 49.746 -71,3%
Total current liabilities 1.954.961 2.113.963 -7,5%
Non-current liabilities
Financial obligations 2.474.077 2.277.429 8,6%
Trade and other payables 158 158 0,0%
Employee benefits liabilit ies 226.574 216.744 4,5%
Deferred tax liabilit ies 702.967 705.700 -0,4%
Other non-current liabilit ies 559 600 -6,8%
Total non-current liabilities 3.404.335 3.200.631 6,4%
TOTAL LIABILITIES 5.359.296 5.314.594 0,8%
SHAREHOLDER EQUITY
Equity attributable to the controlling interest 8.907.656 8.346.719 6,7%
Non-controlling interest 42.525 38.241 11,2%
TOTAL SHAREHOLDER EQUITY 8.950.181 8.384.960 6,7%
TOTAL LIABILITIES AND EQUITY 14.309.477 13.699.554 4,5%
financial position

This presentation and further detailed
information can be found in the following link in
our section "Grupo Nutresa Valuation Kit":
http://www.gruponutresa.com/es/content/grupo-
nutresa-valuation-kit-gnvk
Catherine ChaconInvestor Relations Director
Tel: (+574) 3258731
email: [email protected]
www.gruponutresa.com
For more information regarding Grupo Nutresa´s level 1ADR, please call
The Bank of New York Mellon marketing desk
NEW YORK
BNYM – Latin America
Gloria Mata
Telephone 212 815 5822
BNYM – Sell-Side
Kristen Resch
Telephone 212 815 2213
BNYM – Buy-Side
Angelo Fazio
Telephone 212 815 2892
BNYM – Sell-Side/Buy-Side
Mark Lewis
Telephone 44 207 964 6415
NEW YORK NEW YORK LONDON
38
details

This document can contain forward looking statements related to Grupo Nutresa
S.A. and its subordinated companies, under assumptions and estimations made
by company management. For better illustration and decision making purposes
Grupo Nutresa’s figures are consolidated; for this reason they can differ from the
ones presented to official entities. Grupo Nutresa S.A. does not assume any
obligation to update or correct the information contained in this document.
“The Issuers Recognition – IR granted by the Colombian Stock Exchange is not a certification about thequality of the securities listed at the BVC nor the solvency of the issuer”
39
disclaimer


![mkt.de: MKT Metall-Kunststoff-Technik - Hollow Core Anchor Easy · Approved loads1) (for c > ccr) F1) [kN] 0,7 1,4 2,6 3,9 0,7 1,4 2,6 4,8 1,1 2,0 4,8 4,8 1,2 2,0 4,8 5,7 Minimum](https://img.pdfslide.us/doc/110x75/5fa8a6876e4c942e687425ab/mktde-mkt-metall-kunststoff-technik-hollow-core-anchor-easy-approved-loads1.jpg)


![BBraun Proxima web Update · PDF filegb_hz]r!. 4, !3/-4,8 !3/.4,8 gb_hz]r!.’ 0, !30-0,8 ) gb_hz]r!.’ 1, !30-1,8 ) gb_hz]r!.’ 2, !30-2,8 ) gb_hz]r!.’ 4, !30-4,8 ) 5qainable"potcher"](https://img.pdfslide.us/doc/110x75/5a86aa7f7f8b9ac96a8d3f53/bbraun-proxima-web-update-r-4-3-48-348-gbhzr-0-30-08-gbhzr.jpg)


![SCREENOVÉ CLONY · Max.plo-cha [m2] motor klika motor klika motor klika motor klika LOCKSCREEN Válcovaný box 89 700 500 2000 2000 2400 2400 4,8 4,8 103 700 500 4000 2000 3000 2400](https://img.pdfslide.us/doc/110x75/605ea422b97cb00cc327afc3/screenov-clony-maxplo-cha-m2-motor-klika-motor-klika-motor-klika-motor-klika.jpg)