Embed Size (px)
Citation preview
Presentation to
Symposium agriculture
Octave Wiehe Auditorium – Réduit, Mauritius 29-31 October 2003
Agriculture: a Source of Green Energy
By Lindsay JollyΩ
Senior Economist
International Sugar Organization 1 Canada Square,
Canary Wharf London E14 5AA United Kingdom
tel: +44 – 20 – 7513 1144 fax: +44 – 20 – 7513 1146,
e-mail: [email protected]
Ω with assistance from Dr J. Woods, Biomass Energy Researcher, Imperial College, London. Email: [email protected]
_____________________________________________________________________
Agriculture: a Source of Green Energy
Introduction Renewable or green energy and agriculture can be a winning combination,
and could provide significant rural economic development opportunities in
many countries. Technically, agriculture biomass energy produced from plants
and organic wastes can produce an array of energy products including
electricity; liquid, solid and gaseous fuels; heat; and chemicals. The extent to
which countries around the world have developed the green energy potential
of agriculture varies enormously with perhaps the two most well known
examples including the biofuel schemes of the United States and Brazil. A
key driver for realising more of the undoubted substantial potential for green
energy from agriculture is the climate change debate and the near-ratification
of the Kyoto protocol with its reduction targets for green house gas emissions.
Biomass energy is the main energy source that is CO2 neutral, meaning it
does not increase the amount of CO2 in the atmosphere.
The dominance of sugar to the agriculture sector of Mauritius primarily puts
the spotlight on the potential for sugarcane biomass as a source of green
energy. In spite of its renewable energy potential the commercial value of
sugarcane for centuries has been based on the extraction of sucrose for use
as a sweetener. Only more recently has it been more widely recognized that
the sugarcane plant offers bioenergy resources that are potentially more
valuable than sugar. The sugar industry of Mauritius was one of the first to
identify the value of bagasse as a fuel for electricity generation. Brazil was the
first during the 1970s to recognise the potential for sugarcane biomass as a
feedstock for fuel ethanol. Crucially renewed enthusiasm for biofuels is
presently being manifested as new policy initiatives and the establishment of
fledgling fuel ethanol schemes in an increasing number of countries, which
together are about to unleash massive global demand for fuel-ethanol. A likely
1
_____________________________________________________________________
growing international trade in ethanol could afford an interesting opportunity
for Mauritius.
Although the majority of arable land in Mauritius is under sugarcane, there
are other agriculture crops and activities from which green energy possibilities
may exist, so the first part of this presentation overviews the array of possible
agriculture biomass to green energy chains. Attention is then focussed on
cane biomass and its two major green energy possibilities – biopower and
biofuels. The biopower from bagasse option is to be addressed by other
speakers, so the emphasis is on fuel ethanol from sugarcane, with particular
consideration of the factors driving commercial viability.
For Mauritius, as for many other countries, the key question when considering
green energy as a strategy for longer term viability is how to close the gap
between current utilisation of sugarcane for sucrose and the tremendous
potential that could be gained through bioenergy – a real-world issue in light
of the expectations for continued erosion of preferential trade benefiting ACP
countries together with little prospect for a world sugar market price over the
medium to longer term of greater than 8-10 US cents/lb. In this context,
there is an important regional initiative that is working towards closing the
gap: the Cane Resources Network for Southern Africa – or the
CARENSA network, which includes Mauritius in its membership.
Green Energy: background Renewable or green energy is any energy source that can be either
replenished continuously or within a moderate timeframe, as a result of
natural energy flows. The term” renewable” captures: solar energy, wind
power, hydropower, geothermal power and biomass energy. Biomass energy,
or bio energy is the key focus for agriculture. Biomass is composed of many
raw material sources1 and therefore bioenergy can be derived from a wide
1 The term biomass means any plant derived organic matter available on a renewable basis, including dedicated energy crops and trees, agricultural food and feed crops, agricultural crop 2
_____________________________________________________________________
range of “organic” raw materials and produced in a variety or ways. Biomass
fuel can be processed via combustion, distillation, gasification, fermentation
and pyrolysis2.
For agriculture: there are 4 key biomass – energy chains:
• Wet co-products (like manure) for methanisation;
• Dry-co products like straw and trash for thermo-chemical conversion;
• Dedicated lingo cellulose crops for thermo-chemical conversion; and
• Growing conventional crops (depending on geographic location) for
liquid biofuels production - ethanol and biodiesel.
In short, agricultural biomass can come from traditional food crops (for
instance sugarcane, grains such as corn, and oilseeds) as well as dedicated
energy crops (Herbaceous crops, woody crops), crop residues, and other
animal residues (manure). An array of bioenergy technologies converts
biomass resources into several energy related products including electricity;
liquid, solid and gaseous fuels; heat; chemicals, and other materials.
Generally, its convenient to consider two major categories of green energy
from agricultural biomass: biopower and biofuels.
Bio power
Bio power technologies burn biomass to generate electricity. Presently direct-
combustion technology is dominant, but the future is focused on the
introduction of high-efficiency gasification combined-cycle systems3.
Combined Heat and Power (CHP) facilities, also called cogeneration achieve
high efficiencies by using both the power and the excess heat from burning
the biomass. This not only lowers costs but also reduces emissions. There is
wastes and residues, wood wastes and residues, aquatic plants, animal wastes, biodegradable/organic fractions of municipal wastes, and other waste materials. 2 For biomass energy proponents this is a key advantage over solar and wind power which can only produce electricity, mechanical power or heat. Furthermore, biomass is not an intermittent renewable energy source. 3 Biomass is heated to convert it into a gas. The gas is used directly in a gas turbine, which drives a generator. The waste heat from the gas turbine is then used to drive a secondary steam turbine, thus converting more of the fuel energy into electricity. 3
_____________________________________________________________________
also a greater flexibility in the range of possible biomass feedstocks.
Combined heat and power (CHP) can achieve an efficiency level as high as
85%, compared to separate generation of steam and power. Despite the
obvious advantages of cogeneration, it remains an untapped potential in most
countries. For example, CHP accounts for just 6% of total electricity
production in the European Union; although about 30% of total electricity
production in Denmark, the Netherlands, and Finland is cogenerated . About
7% of total electricity generated in the U.S. is cogenerated4 . Of interest is
the fact that the United Kingdom government now offers a specific support
mechanism for CHP (providing a premium for so-called green electricity).
Biofuels:
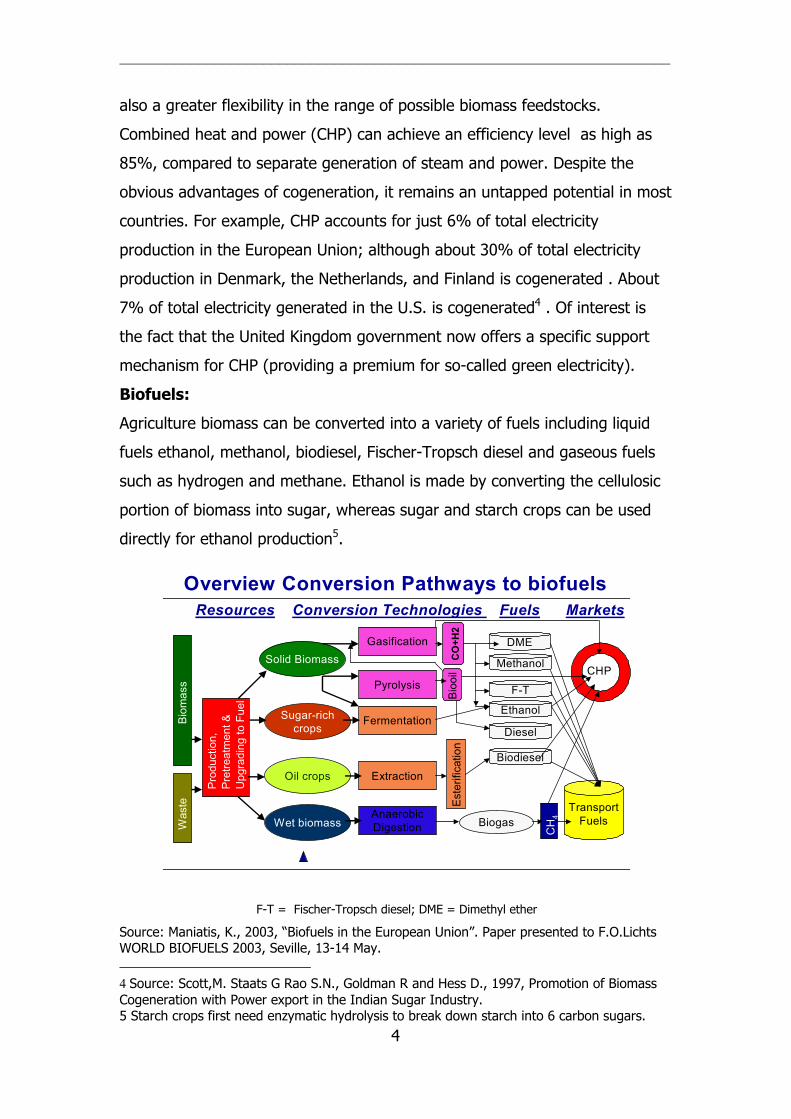
Agriculture biomass can be converted into a variety of fuels including liquid
fuels ethanol, methanol, biodiesel, Fischer-Tropsch diesel and gaseous fuels
such as hydrogen and methane. Ethanol is made by converting the cellulosic
portion of biomass into sugar, whereas sugar and starch crops can be used
directly for ethanol production5.
Bio
mas
sW
aste
Pro
duct
ion,
Pre
treat
men
t &U
pgra
ding
to F
uel
Solid Biomass
Sugar-richcrops
Oil crops
Wet biomass
Gasification
Pyrolysis
Fermentation
Extraction
AnaerobicDigestion
Resources Conversion Technologies Fuels Markets
CHP
TransportFuelsBiogas
DME
Ethanol
Methanol
F-T
Diesel
CH
4
Biodiesel
CO
+H2
Est
erifi
catio
nB
iooi
l
Overview Conversion Pathways to biofuels
F-T = Fischer-Tropsch diesel; DME = Dimethyl ether
Source: Maniatis, K., 2003, “Biofuels in the European Union”. Paper presented to F.O.Lichts WORLD BIOFUELS 2003, Seville, 13-14 May. 4 Source: Scott,M. Staats G Rao S.N., Goldman R and Hess D., 1997, Promotion of Biomass Cogeneration with Power export in the Indian Sugar Industry. 5 Starch crops first need enzymatic hydrolysis to break down starch into 6 carbon sugars. 4
_____________________________________________________________________
Cellulose is a major component of wood, and other materials such as bagasse
and grass. Cellulose consists of sugar molecules, but cellulose molecules are
polysaccharides, which are much larger than starch molecules. Again,
cellulose can be broken down into its component sugar molecules using acid
or enzymes, but other components of wood (particularly the lignin) hinder this
breakdown process. While methods for sugar recovery are known, they are
currently too expensive to make cellulose a cost competitive feedstock, so
predictions vary as to when cellulose might be used to produce ethanol
commercially. Recovery of sugars from cellulose and hemicellulose continues
to be the subject of considerable research. There are several companies with
different technologies (for instance Cargill Dow, Iogen Corporation (Canada)
with Shell Oil, BC International), but proving the technology is taking longer
than expected and the lack of a first commercially viable plant proves the
technology presently remains high risk. Even so, expectations remain for the
first commercially viable plant to be operating by 2005 (see Smith M., 2002,
“Cellulosic Biomass Ethanol: Barriers and Opportunities”. Paper presented to
F.O.Lichts World Ethanol 2002 Conference, London).
The countries that pioneered fuel ethanol production from agricultural
biomass on a large scale were Brazil (from sugarcane), and the United States
(from maize (corn)). Presently world production of fuel ethanol is around 25
bln litres annually (total ethanol at 37.9 bln litres in 2003). Crucially however,
as will be discussed later, several countries are at various stages of
implementing fledgling ethanol programs including India, Thailand, Colombia,
Australia, while new biofuel directives in the European Union and a proposed
renewable fuels standard in the United States, could see a massive jump in
world production and trade in ethanol.
Although ethanol is typically used directly as a gasoline extender or
oxygenate, it can also be used as a feedstock for the production of ethyl
tertiary butyl ether (ETBE). ETBE is made by reacting ethanol with natural gas
and petroleum derivatives (isobutylene) to produce a new clean-burning fuel
5
_____________________________________________________________________
additive. This is in fact the main way in which ethanol is used in the European
Union, and there is a growing opinion in the United States that ETBE would
significantly expand the demand for ethanol as well as to maximise the
reductions in greenhouse gas, toxins and VOC emissions. ETBE is an
environmentally superior oxygenate and enhances vehicle performance
because of a significantly lower fuel blend vapour pressure (ethanol directly
raises the vapour pressure (as measured by Reid Vapor Pressure (RVP)) of
fuels with which it is blended.
Biodiesel is produced through a process in which organically derived oils are
combined with alcohol (ethanol or methanol) in the presence of a catalyst to
form ethyl or methyl ester. This can then be blended with conventional diesel
fuel or used as neat fuel. The European Union is presently the major producer
of biodiesel (accounting for around 80 percent of an estimated world total in
2003 of 1.55 mln tonnes) (Maniatis, K., 2003). The feed stock crop used
differs in each country (rapeseed, soybean, sunflowers and vegetable oils for
instance).
Crucial Factors influencing bioenergy potential
Although the range of technical possibilities for green energy from agriculture
are impressive, the optimal biomass-energy possibilities for any particular
country is driven by several key issues, where are overviewed below.
Key issues include:
• Availability of land for energy crops production (as against for food
crops production) and other competing land uses.
• Alternative land use options for degraded land, such as protected and
recreational areas, carbon sequestration, or crops for nitrogen fixation
(for example).
• Productivity levels of energy crops, as determined by physical factors –
climate, water availability, soil quality- as well as socio-economic
factors, primarily the costs of labour and land.
6
_____________________________________________________________________
• The available technology for energy crop production, handling and
transport and conversion to energy. Technology is a major issue as it
impacts energy costs as well as being critical to ensuring optimal
carbon/energy balances, and also to lowering local emissions (air
quality issues).
• Biomass production improvements could likely improve biomass
yields (plant genetic and breeding technology), as well as to
reduce production costs and improve environmental quality. • Biomass handling issues. Handling systems can account for a
large proportion of the capital investment and operating costs of
a bioenergy conversion facility. The handling requirements vary
according to the type of biomass to be processed as well as the
feedstock preparation requirements of the conversion
technology.
• Biomass collection logistics and infrastructure: harvesting
biomass crops, collecting residues, storing and transporting are
all critical elements to consider in a biomass resource supply
chain.
• The price of biomass crops as against other crops (farmers involvement
depends on financial aspects: profitability is a key decision criteria), as
well as the ultimate production cost of the renewable energy which
determines its competitiveness with fossil fuels.
• Policy and regulatory environment, and the extent it is conducive to the
development of renewable energy opportunities.
The importance of these key issues will become all the more lucid by turning
out attention to sugarcane biomass, the dominant biomass source in Mauritius
(covering more than 80 percent of its arable land).
7
_____________________________________________________________________
Green energy from sugarcane
Sugarcane is a highly efficient converter of solar energy, and has the highest
energy-to-volume ratio among energy crops. Indeed it gives the highest
annual yield of biomass of all species. Roughly, one tonne of sugarcane
biomass – based on bagasse, foliage and ethanol output – has an energy
content equivalent to one barrel of crude oil6.
The sugarcane plant therefore takes on special significance as the world’s
most economically significant energy crop and presents exciting
opportunities as well as challenges if it is to reach its potential as a
developing country bioenergy resource. This is all the more paramount
in light of the likley increasing incentives for sugar producers around the
world to diversify their product protfolio, as the competitive pressures from
the world market are likley to increase with widely expected ongoing sugar
policy reform.
Sugar Cane Resources
Raw Sugar
Refined Sugar
Fertilizers
Industrial Uses
Sugar/solids
Industrial Uses
Commercial Products
Fertilizer
Methane
Stillage
Ethanol
Molasses/juice
Steam & Electricity
Fuel Briquettes
Agricultural Products
Industrial Products
Crop Residues
Sugar Cane
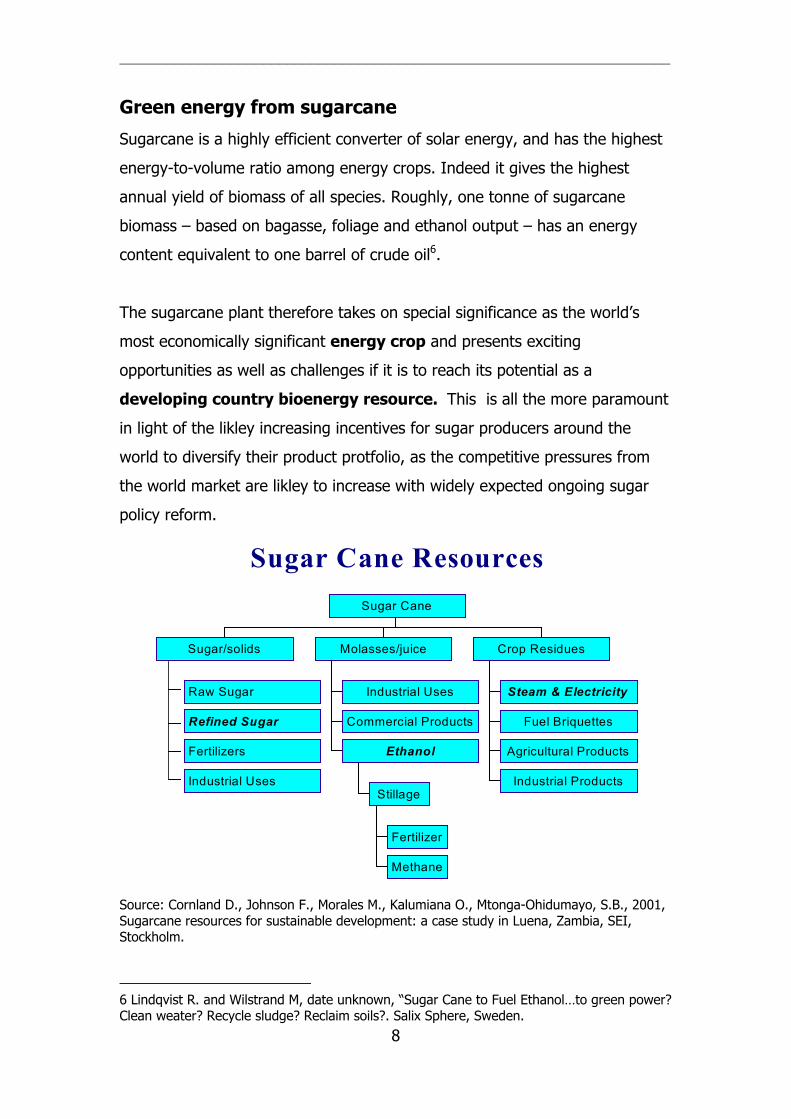
Source: Cornland D., Johnson F., Morales M., Kalumiana O., Mtonga-Ohidumayo, S.B., 2001, Sugarcane resources for sustainable development: a case study in Luena, Zambia, SEI, Stockholm.
6 Lindqvist R. and Wilstrand M, date unknown, “Sugar Cane to Fuel Ethanol…to green power? Clean weater? Recycle sludge? Reclaim soils?. Salix Sphere, Sweden. 8
_____________________________________________________________________
In this chart the sugarcane resource is broken down into three key product
streams: sugar/solids; molasses/juice and crop residues. The sugar/solids
category includes various feedstocks and intermediate products in addition to
sugar. Molasses/cane juice are valued for the fermentable sugars that can be
converted into alcohol, as well as being used as industrial and agricultural
inputs (fertilisers). Cane residues, namely bagasse and trash, are valued for
their fibre content and organic residues, as well as their use as fuel in
cogeneration plants.
In terms of green energy then, its clear that the major cane biomass-energy
chains are:
• Cane juice/molasses for conversion to ethanol;
• Bagasse for heat and electricity generation; and
o In the medium term (more than 5 years), bagasse for
conversion to ethanol.
• Stillage/vinasse for conversion to methane (methanisation).
Each of these are discussed in turn.
Cogeneration using bagasse
Mauritius was one of the first countries to establish cogeneration capacity
based on the use of cane bagasse, an option that is to be further actively
pursued as part of the country’s Sugar Sector Strategic plan7. Several studies
in India, and other parts of the world, point to the sugar industry as a prime
candidate for supplying low-cost, non conventional power via cogeneration.
The advantages of sugar mill cogeneration include relatively low capital cost
requirements and the use of a renewable, indigenous waste as a “non-
polluting” fuel. Indeed, the fact that the sugarcane plant provides its own
source of energy for sugar production in the form of bagasse has long been a
special feature of the sugar industry. In the traditional case the sugar
factory/distillery cogenerate just enough steam and electricity to meet their
7 For A target for the period 2001-2005 is to generate as much electricity from renewable sources, in particular bagasse. Available at http://ncb.intnet.mu/moa/sssp.htm 9
_____________________________________________________________________
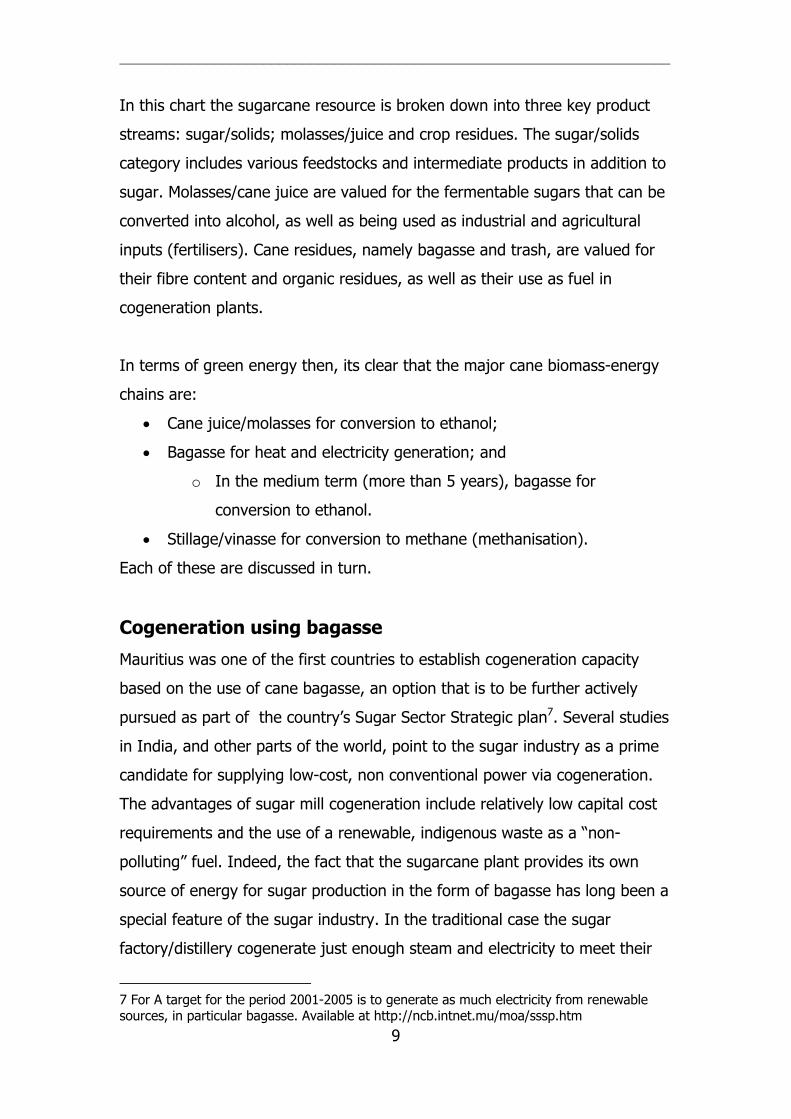
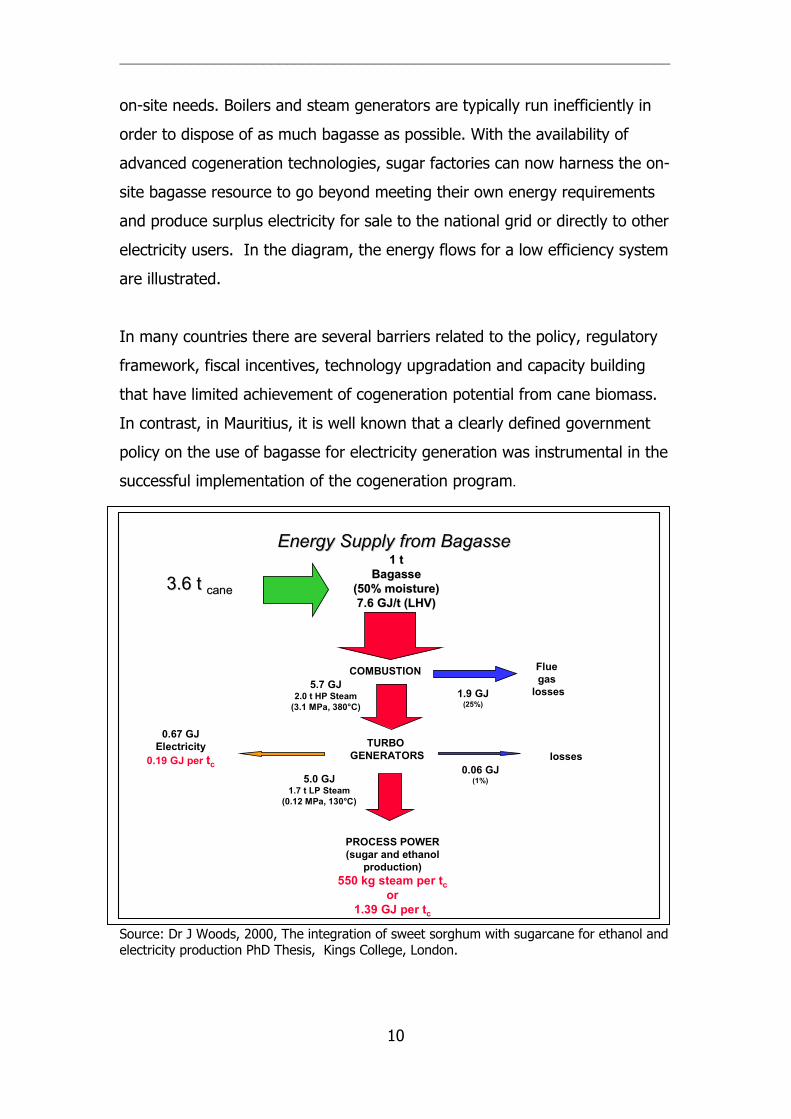
on-site needs. Boilers and steam generators are typically run inefficiently in
order to dispose of as much bagasse as possible. With the availability of
advanced cogeneration technologies, sugar factories can now harness the on-
site bagasse resource to go beyond meeting their own energy requirements
and produce surplus electricity for sale to the national grid or directly to other
electricity users. In the diagram, the energy flows for a low efficiency system
are illustrated.
In many countries there are several barriers related to the policy, regulatory
framework, fiscal incentives, technology upgradation and capacity building
that have limited achievement of cogeneration potential from cane biomass.
In contrast, in Mauritius, it is well known that a clearly defined government
policy on the use of bagasse for electricity generation was instrumental in the
successful implementation of the cogeneration program.
Source: Dr J Woods, 2000, The integration of sweet sorghum with sugarcane for ethanol and electricity production PhD Thesis, Kings College, London.
Energy Supply from BagasseEnergy Supply from Bagasse1 t1 t
Bagasse Bagasse (50% moisture)(50% moisture)7.6 GJ/t (LHV)7.6 GJ/t (LHV)
COMBUSTION Flue gas
losses1.9 GJ(25%)
5.7 GJ2.0 t HP Steam
(3.1 MPa, 380°C)
TURBO GENERATORS losses
0.06 GJ(1%)
0.67 GJElectricity
0.19 GJ per tc
PROCESS POWER(sugar and ethanol
production)550 kg steam per tc
or1.39 GJ per tc
5.0 GJ1.7 t LP Steam
(0.12 MPa, 130°C)
3.6 t 3.6 t canecane
10
_____________________________________________________________________
The next two speakers will consider the ongoing potential for additional
cogeneration in Mauritius in much more detail. Presently, there is
insufficient bagasse to allow year-round cogeneration and instead coal is used
during the “off-season”. Collection and use of cane trash could be considered
for extending the biomass fuel supply, but issues remain related to collection
and transport of the biomass. There may also be potential for the use of other
C4 tropical grasses (such as elephant grass) to be harvested in the sugarcane
off-season, using existing harvesting and transport infrastructure.
Fuel ethanol
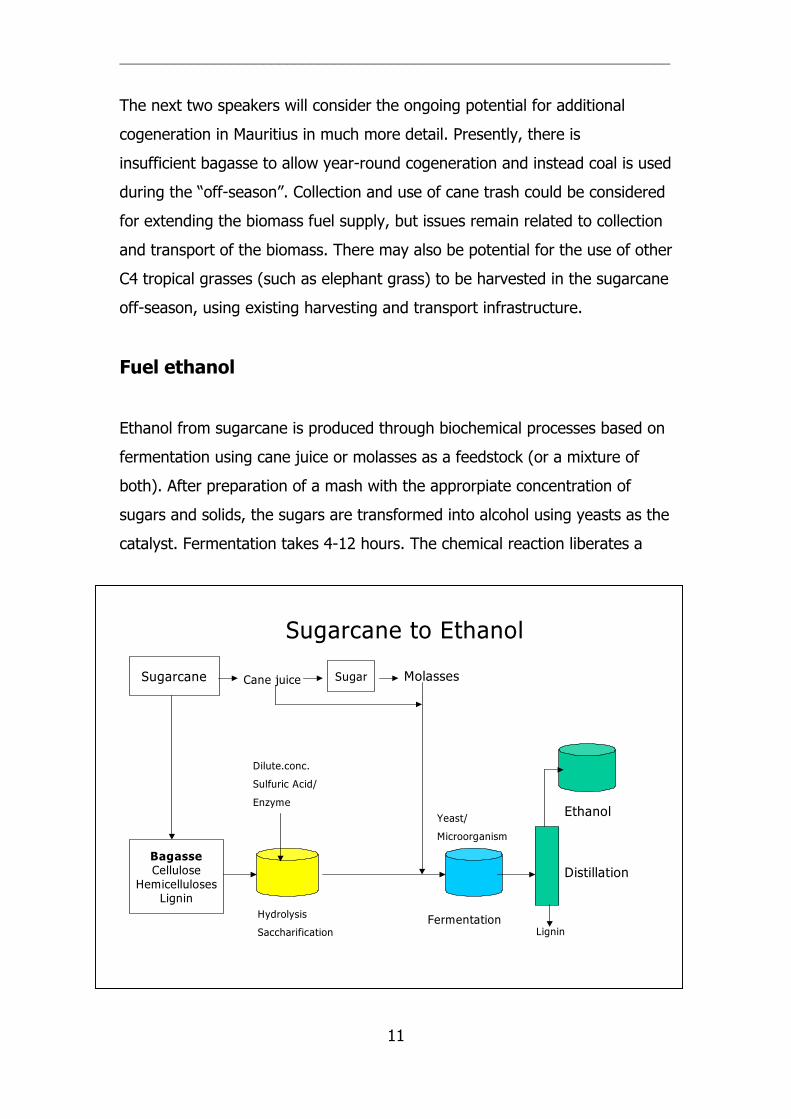
Ethanol from sugarcane is produced through biochemical processes based on
fermentation using cane juice or molasses as a feedstock (or a mixture of
both). After preparation of a mash with the approrpiate concentration of
sugars and solids, the sugars are transformed into alcohol using yeasts as the
catalyst. Fermentation takes 4-12 hours. The chemical reaction liberates a
Sugarcane Sugar
BagasseCellulose
HemicellulosesLignin
Sugarcane to Ethanol
Molasses
Ethanol
Distillation
Hydrolysis
SaccharificationFermentation
Dilute.conc.
Sulfuric Acid/
Enzyme
Yeast/
Microorganism
Cane juice
Lignin
11
_____________________________________________________________________
significant amount of CO2 and heat. After fermentation, the ethanol is distilled
from other by-products, resutling in a level of purity of around 95 percent
(hydrous ethanol). The advent of continous fermentation has increased the
productiivity of fermentation, reducing the volume capacity required for
fermentation tanks, thereby reducing costs. Similarly, in distilleries, low steam
utilization technologies use waste heat in heat exchangers, which is then
reused to increase the temperature and/or presssure of other processes.
Effectively, this approach uses less steam and leaves more steam than
otherwise for electricity generation.
Renewed enthusiasm for fuel ethanol
Crucially, renewed enthusiasm for biofuels over the past few years is now
being manifested as new policy initiatives and the establishment of fledgling
fuel ethanol8 schemes in an increasing number of countries, which together
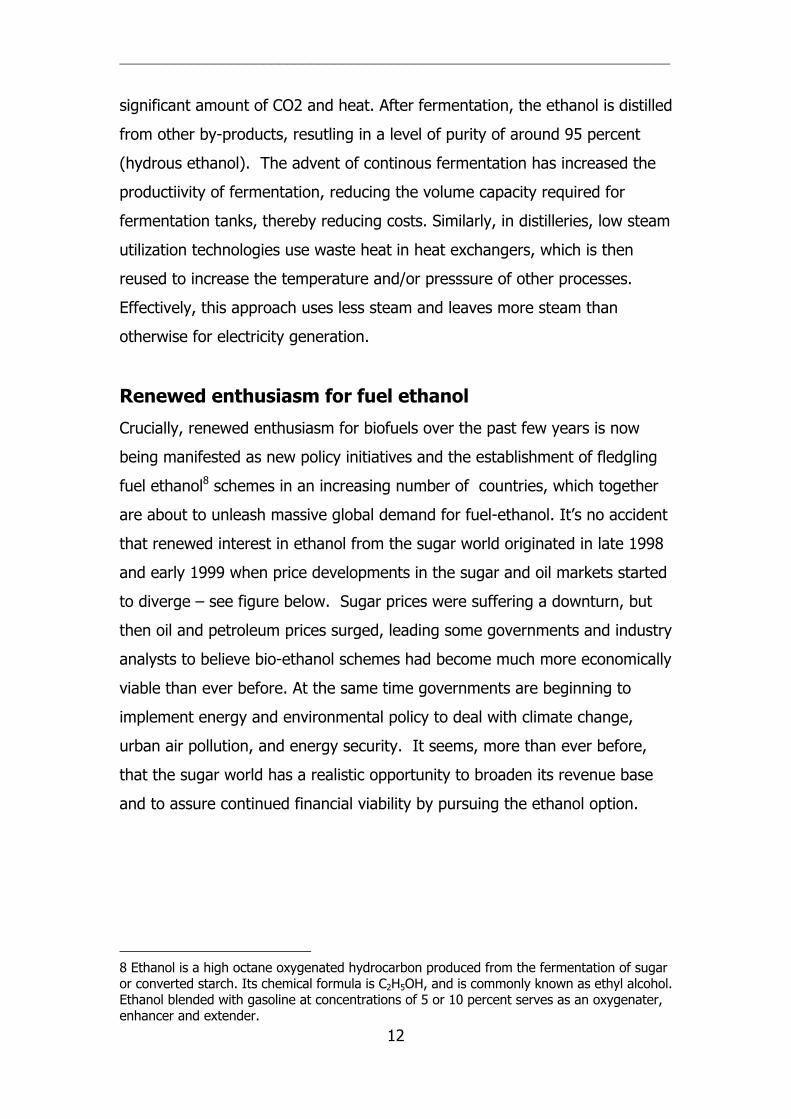
are about to unleash massive global demand for fuel-ethanol. It’s no accident
that renewed interest in ethanol from the sugar world originated in late 1998
and early 1999 when price developments in the sugar and oil markets started
to diverge – see figure below. Sugar prices were suffering a downturn, but
then oil and petroleum prices surged, leading some governments and industry
analysts to believe bio-ethanol schemes had become much more economically
viable than ever before. At the same time governments are beginning to
implement energy and environmental policy to deal with climate change,
urban air pollution, and energy security. It seems, more than ever before,
that the sugar world has a realistic opportunity to broaden its revenue base
and to assure continued financial viability by pursuing the ethanol option.
8 Ethanol is a high octane oxygenated hydrocarbon produced from the fermentation of sugar or converted starch. Its chemical formula is C2H5OH, and is commonly known as ethyl alcohol. Ethanol blended with gasoline at concentrations of 5 or 10 percent serves as an oxygenater, enhancer and extender. 12
_____________________________________________________________________
Sugar vs Oil Quotations
10.00
15.00
20.00
25.00
30.00
35.00
Jan-96Jul-9
6Jan-97
Jul-97
Jan-98Jul-9
8Jan-99
Jul-99
Jan-00Jul-0
0Jan-01
Jul-01
Jan-02Jul-0
2Jan-03
Jul-03
US$
/bar
rel
4567891011121314
US
Cen
ts/lb
average 2-month brent $/bl ISA price
Fuel ethanol from sugar crops: achieving commercial viability?
The terms “commercial viability” and “commercial feasibility” are normally
used interchangeably and refer to there being sufficient expected profitability
from ethanol production, which may be conditional on government support.
We also need to mindful of commercial viability related to the continued
operation of existing capacity as opposed to commercial viability of planned
investment in the creation or expansion of an industry.
At the simplest there are three key drivers of commercial viability. The first is
the price of sugar – as it represents the opportunity cost of the sugar crop
used to produce ethanol. The second is the price of crude oil – which drives
the price of gasoline, providing a benchmark against which to gauge the
competitiveness of ethanol. The other key determinant of commercial
viability is the existing level of government support, expectations about its
continuance, and possible new forms of future support.
Condition 1: Opportunity Cost
13
_____________________________________________________________________
The opportunity cost for ethanol production from sugar crops is the return
otherwise achievable from sucrose production. In other words, determining
the commercial feasibility of producing ethanol from sugarcane/beet involves
a comparison of alternative revenue streams from sugarcane/beet with
ethanol or raw/white sugar product forms.
More specifically, in the case of sugar cane, the implied opportunity cost of
ethanol production varies according to the feedstock used. The value of the
embodied sucrose in C molasses is far less than A and B molasses. The cost
of sugarcane juice as a fermentation feedstock would be the raw sugar values
minus savings (in operating, energy, capital) relating to the operation of the
“process end” of the sugar factory.
C molasses, typically a low value by-product of cane-based sugar (its value
often set by the livestock feed market), offers the lowest-cost substrate
(yielding 270 litres of ethanol per tonne at 50 percent fermentables). If
distillers paid the true value of sugar contained in C molasses, then ethanol
production costs would be higher. Taking sugar as a feedstock gives the
upper limit to possible feedstock costs.
Opportunity cost also varies with changes in sugar price. For example, B
molasses might be used for ethanol production when the export price of raw
sugar is at the lower end of its range.
Brazil: ethanol vs sugar
The opportunity cost of ethanol production is not of theoretical relevance.
Relative returns as between sucrose and fuel ethanol is a key factor driving
the allocation of cane as between sugar and ethanol in Brazil, the world’s
biggest sugar/ethanol industry.
14
_____________________________________________________________________
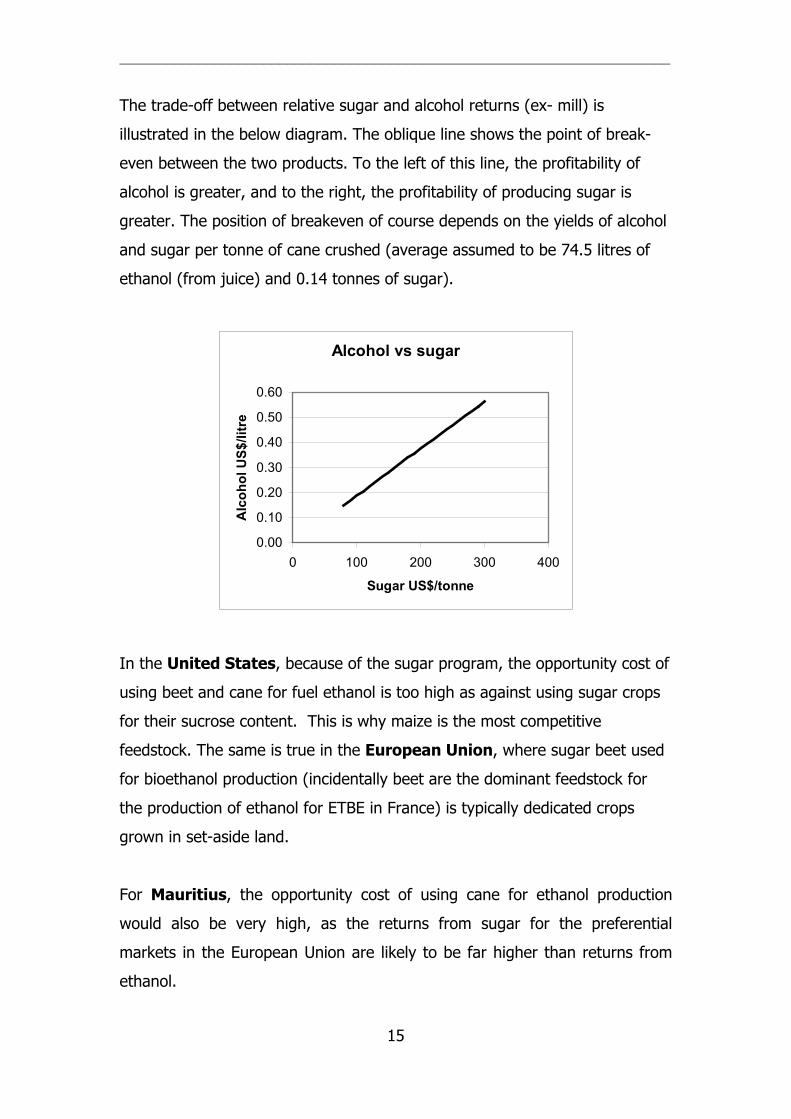
The trade-off between relative sugar and alcohol returns (ex- mill) is
illustrated in the below diagram. The oblique line shows the point of break-
even between the two products. To the left of this line, the profitability of
alcohol is greater, and to the right, the profitability of producing sugar is
greater. The position of breakeven of course depends on the yields of alcohol
and sugar per tonne of cane crushed (average assumed to be 74.5 litres of
ethanol (from juice) and 0.14 tonnes of sugar).
Alcohol vs sugar
0.00
0.10
0.20
0.30
0.40
0.50
0.60
0 100 200 300 400
Sugar US$/tonne
Alc
ohol
US$
/litr
e
In the United States, because of the sugar program, the opportunity cost of
using beet and cane for fuel ethanol is too high as against using sugar crops
for their sucrose content. This is why maize is the most competitive
feedstock. The same is true in the European Union, where sugar beet used
for bioethanol production (incidentally beet are the dominant feedstock for
the production of ethanol for ETBE in France) is typically dedicated crops
grown in set-aside land.
For Mauritius, the opportunity cost of using cane for ethanol production
would also be very high, as the returns from sugar for the preferential
markets in the European Union are likely to be far higher than returns from
ethanol.
15
_____________________________________________________________________
Condition 2: Ethanol production costs vs gasoline prices
The issue of ethanol costs versus price of gasoline is critical and underlies the
need for fiscal incentives to attract investment in biofuels productive capacity.
For a given crude oil price, an ex refinery price for gasoline can be derived.
From this can be estimated a maximum competitive price for ethanol, against
which expected costs of production can be compared. In a nutshell, over the
past decade or longer, despite technological progress in the bio fuel/ethanol
production process that has lowered the unit costs of production, the
economics spoke always in favour of conventional fossil fuels. Therefore, the
profitability of bio fuels production has depended heavily on the extent of
subsidies or other fiscal incentives afforded them by governments, and the
taxation levels imposed upon fossil fuels as against ethanol. Consequently,
development of large bio fuel sectors, including ethanol from sugar crops, has
only occurred in countries where governments have advanced support in the
form of favourable fiscal regimes and other forms of support (e.g. capital
grants).
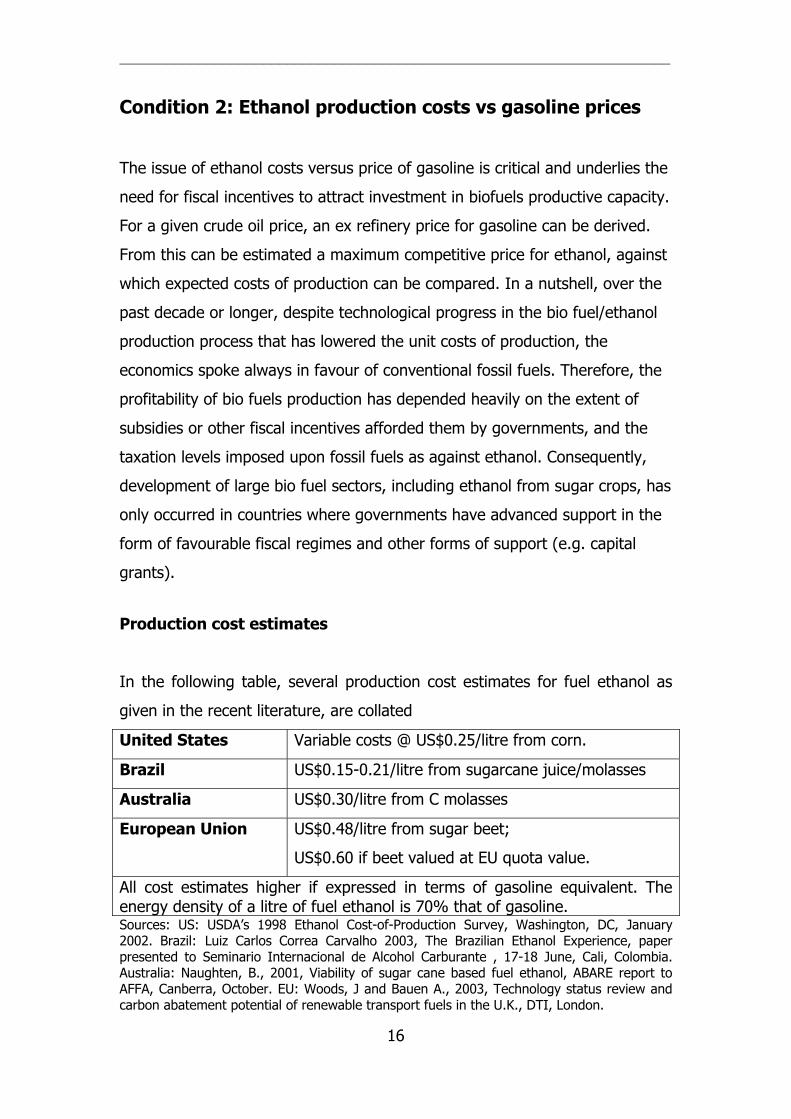
Production cost estimates In the following table, several production cost estimates for fuel ethanol as
given in the recent literature, are collated
United States Variable costs @ US$0.25/litre from corn.
Brazil US$0.15-0.21/litre from sugarcane juice/molasses
Australia US$0.30/litre from C molasses
European Union US$0.48/litre from sugar beet;
US$0.60 if beet valued at EU quota value.
All cost estimates higher if expressed in terms of gasoline equivalent. The energy density of a litre of fuel ethanol is 70% that of gasoline. Sources: US: USDA’s 1998 Ethanol Cost-of-Production Survey, Washington, DC, January 2002. Brazil: Luiz Carlos Correa Carvalho 2003, The Brazilian Ethanol Experience, paper presented to Seminario Internacional de Alcohol Carburante , 17-18 June, Cali, Colombia. Australia: Naughten, B., 2001, Viability of sugar cane based fuel ethanol, ABARE report to AFFA, Canberra, October. EU: Woods, J and Bauen A., 2003, Technology status review and carbon abatement potential of renewable transport fuels in the U.K., DTI, London.
16
_____________________________________________________________________
The highlight is the strong competitiveness of Brazil against gasoline and
crude oil. According to a leading Brazilian analyst (Natari9), by late 2000 a
new paradigm had arisen in the Brazilian industry, as ethanol was being
produced at a cost that was competitive with the price of gasoline in the
world market. Anhydrous ethanol can be produced in Centre-South Brazil at
US$28.40 per barrel (at exchange rate of R$1.96/US$) meaning that it can
compete with gasoline in the world market, when the price of crude oil is
between $22.70 and $23.70/barrel. Brazil’s currency has devalued
significantly against the US dollar since that time (reaching a high of
R$4.00/US$ mid-October 2002), making Brazilian fuel ethanol even more
competitive.
However, the scale of the Brazilian distillers is very important: these are large-
scale units achieving significant economies of scale and throughput, utilising
state of the art technology and using bagasse as a major part of the fuel
source for distillation. Costs could be significantly higher for smaller scale
distillers in other countries.
Furthermore, in Brazil, over the course to two decades, new technologies
increased sugar and fermentation yields significantly (Henrique10). Increase
field productivity, development of cane varieties, better soils and fertiliser
practices and increases in the sugar content of cane (from 9.5 percent in
1977 to 14 percent in 1999) were all important factors. New technologies and
control of industrial processes were developed with gains of up to 17 percent
in fermentation yield (from 75 percent in 1977 to up to 92 percent today). In
1997 fermentation yield was 70-80 percent in distilleries, but now it is 85-92
percent. Better extraction of the juice from cane also was important.
Together, these factors have increased ethanol productivity from 3,000-4,000
litres/ha to 5,000 to 10,000 litres/hectare (expressed in absolute ethanol/ha).
9 Dr Pilinio Mário Nastari, ‘Brazil’s Market Dominance – a reason to be frightened?’ paper presented to 9th ISO Seminar, Hot Issues for Sugar, London, November 2000. 10 Amorim Henrique, Fermentec S/C LTDA, 2000, “Brazil: the Process of Industry Consolidation”, paper presented to F.O.Licht’s World Ethanol 2000, 9&10 November, London. 17
_____________________________________________________________________
Not only has this impressive productivity gain been a key driver lowering
production costs, it also has meant a smaller sugar cane area than otherwise
to meet ethanol demand.
A study in Australia11 estimates total production costs for fuel ethanol at
$A0.56/litre, (US$ 0.30) assuming a C molasses feed stock valued at
$A50/tonne. That level was found to be competitive with gasoline with an
exchange rate of US$0.50, a crude oil price of US$32/barrel, and factoring in
an excise exemption of $A0.38/litre. Costs would be significantly higher using
A or B molasses.
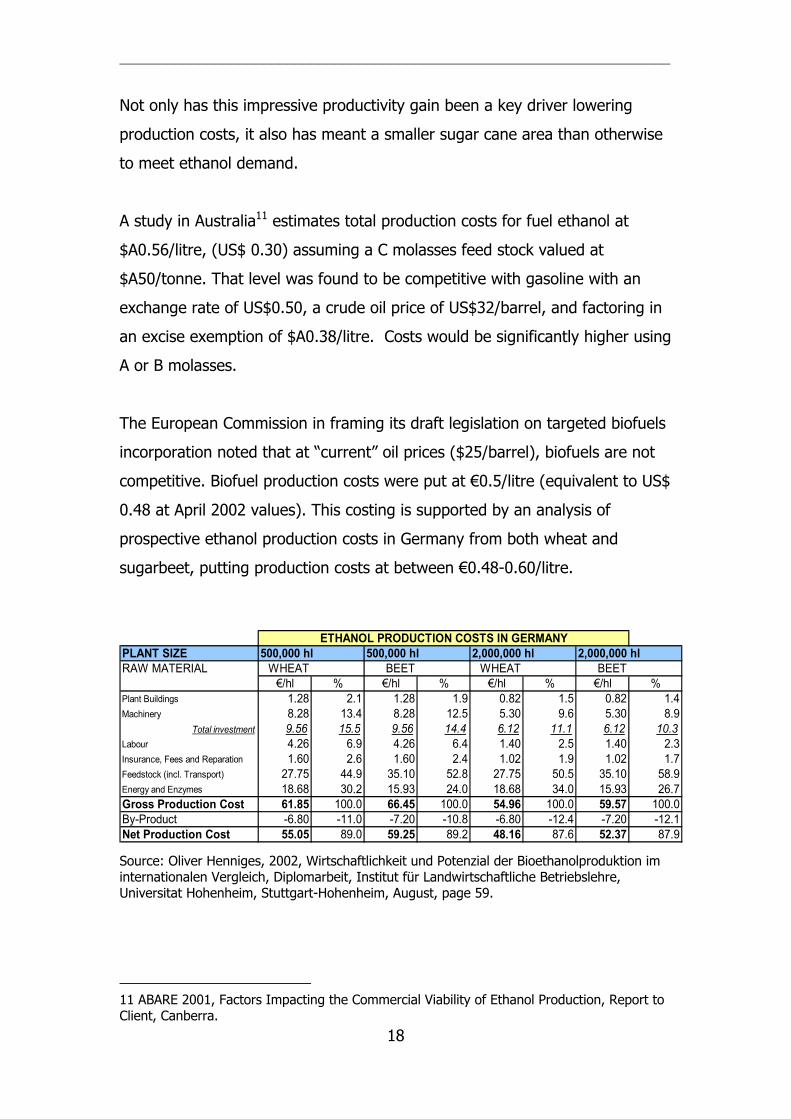
The European Commission in framing its draft legislation on targeted biofuels
incorporation noted that at “current” oil prices ($25/barrel), biofuels are not
competitive. Biofuel production costs were put at €0.5/litre (equivalent to US$
0.48 at April 2002 values). This costing is supported by an analysis of
prospective ethanol production costs in Germany from both wheat and
sugarbeet, putting production costs at between €0.48-0.60/litre.
ETHANOL PRODUCTION COSTS IN GERMANYPLANT SIZE 500,000 hl 500,000 hl 2,000,000 hl 2,000,000 hlRAW MATERIAL WHEAT BEET WHEAT BEET
€/hl % €/hl % €/hl % €/hl %Plant Buildings 1.28 2.1 1.28 1.9 0.82 1.5 0.82 1.4Machinery 8.28 13.4 8.28 12.5 5.30 9.6 5.30 8.9
Total investment 9.56 15.5 9.56 14.4 6.12 11.1 6.12 10.3Labour 4.26 6.9 4.26 6.4 1.40 2.5 1.40 2.3Insurance, Fees and Reparation 1.60 2.6 1.60 2.4 1.02 1.9 1.02 1.7Feedstock (incl. Transport) 27.75 44.9 35.10 52.8 27.75 50.5 35.10 58.9Energy and Enzymes 18.68 30.2 15.93 24.0 18.68 34.0 15.93 26.7Gross Production Cost 61.85 100.0 66.45 100.0 54.96 100.0 59.57 100.0By-Product -6.80 -11.0 -7.20 -10.8 -6.80 -12.4 -7.20 -12.1Net Production Cost 55.05 89.0 59.25 89.2 48.16 87.6 52.37 87.9 Source: Oliver Henniges, 2002, Wirtschaftlichkeit und Potenzial der Bioethanolproduktion im internationalen Vergleich, Diplomarbeit, Institut für Landwirtschaftliche Betriebslehre, Universitat Hohenheim, Stuttgart-Hohenheim, August, page 59.
11 ABARE 2001, Factors Impacting the Commercial Viability of Ethanol Production, Report to Client, Canberra. 18
_____________________________________________________________________
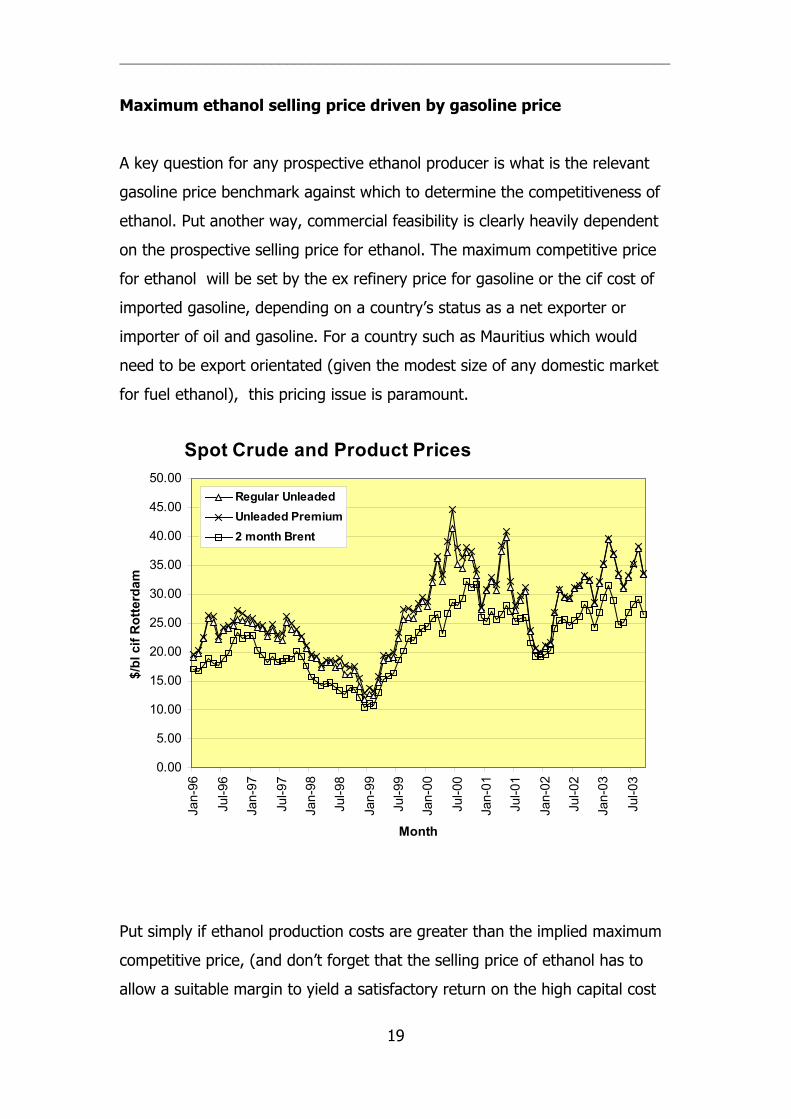
Maximum ethanol selling price driven by gasoline price
A key question for any prospective ethanol producer is what is the relevant
gasoline price benchmark against which to determine the competitiveness of
ethanol. Put another way, commercial feasibility is clearly heavily dependent
on the prospective selling price for ethanol. The maximum competitive price
for ethanol will be set by the ex refinery price for gasoline or the cif cost of
imported gasoline, depending on a country’s status as a net exporter or
importer of oil and gasoline. For a country such as Mauritius which would
need to be export orientated (given the modest size of any domestic market
for fuel ethanol), this pricing issue is paramount.
Spot Crude and Product Prices
0.00
5.00
10.00
15.00
20.00
25.00
30.00
35.00
40.00
45.00
50.00
Jan-
96
Jul-9
6
Jan-
97
Jul-9
7
Jan-
98
Jul-9
8
Jan-
99
Jul-9
9
Jan-
00
Jul-0
0
Jan-
01
Jul-0
1
Jan-
02
Jul-0
2
Jan-
03
Jul-0
3
Month
$/bl
cif
Rot
terd
am
Regular UnleadedUnleaded Premium2 month Brent
Put simply if ethanol production costs are greater than the implied maximum
competitive price, (and don’t forget that the selling price of ethanol has to
allow a suitable margin to yield a satisfactory return on the high capital cost
19
_____________________________________________________________________
of ethanol production) then commercial viability can only be achieved with
government support for ethanol.
Condition 3: Government Support
The importance of long-term government support to biofuels simply reflects
that fact established above: that the costs of ethanol generally exceeds the
price of gasoline it replaces, or the price of other oxygenates. Indeed the well
established fuel ethanol schemes of Brazil and the United States have relied
on a number of government support measures.
Brazil’s massive ethanol industry is now operating more or less in a
deregulated environment (apart from the mandatory inclusion of ethanol in
gasoline). But deregulation and reform of the fuel alcohol sector only began in
the late 1990s, whereas PROALCOOL was launched in 1975 with massive
support by the government . Today, the reformed ethanol sector still benefits
from a captive market for anhydrous alcohol but prices are freely determined
by the market. Crucial also is the fact that ethanol still benefits from a
favourable tax excise arrangement as against gasoline. Gasoline attracts a
tax of R$0.5709/litre where as anhydrous is taxed at 0.06/litre and hydrous
0.0485/litre12. This is against the pre-tax price level of R$0.75/litre for
gasoline, R$0.66 for anhydrous ethanol and R$0.60 for hydrous ethanol.
In the United States the key production incentive is the 52 cents/gallon
(13.7 cents/litre) tax break, scheduled to fall to 51 cents (13.4 cents) in 2005.
Without it, production of ethanol would not be viable against its main
competitor, gasoline. In addition, 15 States also offer production incentives.
Mandated markets have also been a key factor supporting the ethanol sector.
Key among these is the Clean Air Act of 2002, the reformulated gasoline
programme and the winter oxygenated fuels programme.
12 Source: Luiz Carlos Correa Carvalho 2003, The Brazilian Ethanol Experience, paper presented to Seminario Internacional de Alcohol Carburante , 17-18 June, Cali, Colombia. 20
_____________________________________________________________________
In France, a differentiated rate of excise duty is applied to biofuels (after EU
Council of Ministers in March 2002 approved a Derogation under Article 8.4 of
Directive 92/81/CEE. Until recently the excise duty used could not exceed
€0.53/litre for bio-ethanol used in authorised mixtures. The limits were set to
limit tax losses to the government’s budget. The French government recently
lowered the exemption to €0.38/litre because they saw too great a gain to
biofuels as a result of the high world crude oil prices.
None of the fledgling schemes in India, Thailand, and Australia for
example, envisage fully applying the Brazilian model of mandated blending
ratios of as high as 25 percent. Australia at most will blend 10 percent ethanol
in gasoline, with the government hoping the tax exemption for ethanol,
together with the incentives offered under the Greehouse Gas Abatement
Scheme will be sufficient to attract the interest of petroleum companies to
commence blending. India’s government has approved a 5 percent blend (but
in a later phase will approve a 10 percent blend), Thailand has a 10 percent
blend with fiscal and other production incentives. In the United Kingdom, the
government offers a tax incentive of £0.20/litre (29 US cents/litre). The
longer-term success of these government incentives in ensuring a
commercially viable and sustainable ethanol sector remains to be seen.
Stillage/Vinasse for methanisation
The third key energy source from sugar biomass is stillage (vinasse/dunder),
the effluent of alcohol production. As can be seen in the table, production of 1
litre of ethanol can result in a waste stream of 2.5-15 litres of vinasse,
depending on the feedstock used. Vinasse can be characterised as high in
solids and unstable organic compounds, having bad odour, dark colour and
containing toxic salts. An important issue therefore is how to optimally
extract energy from this waste steam of a distillery. Importantly, income can
21

_____________________________________________________________________
be gained by transforming vinasse into bio fertiliser and biogas, two of the
key options for the treatment of vinasse shown in the figure. Biogas can be
used as a boiler fuel whilst vinasse can also be used as a partial replacement
for molasses in animal feeds. Perhaps then, optimal utilisation of vinasse can
also contribute to attaining commercial viability for ethanol production.
Characteristics of Vinasse
8 to 15 6.5 to 7.51.5 to 2.5Total Solids (%w/w)
50,000 to 70,000
35,000 to 40,000
15,000 to 20,000
B.O.D. (mg / Lit)
1,00,000 to 1,50,000
70,000 to 80,000
25,000 to 30,000
C.O.D. (mg / Lit)
4 to 4.5 4 to 4.54 to 4.5pH
8 to 15 2.5 to 412 to 15Volume (Lit / Lit)
Molasses SyrupJuiceRaw Material Parameters
Source: PRAJ INDUSTRIES LTD.PUNE, INDIA., Latest Technologies For Treatment & Disposal Of Vinasse, presented to Seminario Internacional de Alcohol Carburante, June 17-18 2003, Cali, Colombia.
22
_____________________________________________________________________
CARENSA
From the above discussion its clear that there are different potential sources
of green energy that can be derived from agriculture but that for the
sugarcane resource, the two key opportunities are in bio power and bio fuels.
Sugar mills are also inherently CHP (cogeneration) systems, where heat is an
important product. For Mauritius, as for many other countries, the key
question is how to close the gap between current utilisation of sugarcane for
sucrose and the tremendous potential that can be gained through bioenergy –
a real-world issue in light of the expectations for continued erosion of
preferential trade benefiting ACP countries together with little prospect for a
world sugar market price over the medium to longer term of greater than 8-
10 US cents/lb.
In this context, there is an important regional initiative that is working
towards closing the gap: the Cane Resources Network for Southern
Africa – or the CARENSA network, which includes Mauritius in its
membership.
CARENSA seeks to identify appropriate technologies, effective regional policies
and feasible cane co-products strategies to sustainably harness the sugarcane
energy resource through the production of biofuel and cogeneration in
particular.
The network will facilitate improved regional cooperation and policy co-
ordination, and help to break down barriers to cane-based bioenergy through
an ongoing forum among researchers, policy-makers and industry
representatives.
Most importantly, CARENSA is a Thematic Network and NOT a research
project. It is about building partnerships, North-South, South-South, between
private and public sectors, and among all the many diverse actors and
stakeholders with an interest in bioenergy from sugarcane. The CARENSA
23
_____________________________________________________________________
network addresses these issues in a holistic manner by considering, social,
environmental and organisation issues alongside the technical and economic
parameters.
The work program to achieve CARENSA’s objectives is designed around 5 key
phases ranging through the lifecycle of the cane resource, from field to mill to
market and through to the impacts on communities and the environment,
including:
(1) Agriculture
Agronomic and harvesting practices for optimising the biomass
resource (including co-cropping of sweet sorghum for energy
production).
•
•
(2) Industry (factory and co-products)
• Sugar and fibre resource streams, agro-industrial processes and
technologies that exploit these streams
(3) Markets & Policies
Articulation of product demand and formation of markets through
appropriate government policies, regulations and economic incentives.
(4) Impacts
• Socio-economic and environmental impacts of different strategies to
ensure that local and regional benefits are reflected in decision-making
frameworks.
(5) Integrating Issues.
• Including sustainable development, risk,competitivness, international
comparisions and industry perspectives.
24
_____________________________________________________________________
The project team/Funding and partners
CARENSA was launched in September 2001 and will continue until September
2005. The Stockhold Environment Institute originated the CANENSA network,
as this institute has a long history in Southern African countries working on
biomass and links to sustainable rural development.
The European Commission’s Directorate General for Research supports
CARENSA to the amount of €0.5 mln. The EC has a clear development
funding priority in Southern Africa. The Stockholm Environment Institute
serves as Scientific and Administrative Coordinator to CARENSA .
An experienced project team with represersentatives from the research and
the policy communities are implementing the network. The project team
consists of:
four european organisations; •
•
•
•
o Imperial College, London;
o Stockholm Environment Institute;
o Interuniversity Research Centre on Sustainable Development,
Italy;
o Agricultural University of Athens, Greece;
four african organisations;
o University of Maruitius;
o University off Natal, South Africa;
o Biomass Users Netowrkd, Zimbabwe;
o Centre for Energy, Environment and Engineering, Zambia ;
three international organisations;
o International Sugar Organization;
o Food and Agriculture Organization of the United Nations;
o Southern African Development Community;
two from Brazil;
o National Reference Centre for Biomass;
25
_____________________________________________________________________
o Unicampinas;
and one from India; •
o Winrock International, India.
In practical terms the main forms of interaction within the network will include
workshops, meetings and exchanges in which participants will synthesise and
compare knowledge of the state of the art with the current status of
sugarcane resource utilisation in Southern Africa.
Final Comments
There are several key messages to draw from this presentation.
• Renewable or green energy and agriculture can be a winning
combination, even more so with the expectations that demand
for renewable energy will expand over coming years, as
governments further implement energy and environmental
policy to deal with climate change, urban air pollution, and
energy security.
• Biopower and biofuels are the two major bioenergy
opportunities from the sugarcane biomass….
• ….. but achieving commercial viability remains paramount to
ensuring these green energy opportunities are fully realised by
the cane sector in Mauritius, both in terms of within the
domestic market and within a broader regional market.
• Optimally exploiting fuel ethanol opportunities from the sugar
cane resource makes sense in an environment of likely
continuing low world sugar prices, but an outlook for continuing
firm crude oil prices.
• The CARENSA initiative offers an opportunity for which Mauritius
can work with other countries in southern Africa to close the gap
between current utilisation of sugarcane for sucrose and the
tremendous potential that can be gained through bioenergy.
26

_____________________________________________________________________
27
• Finally, Mauritius could maximise it’s benefits from the bioenergy
opportunity by exporting intellectual property pertaining to
optimal configurations and policy environments for advanced
sugarcane to energy systems.