Embed Size (px)
Citation preview

Presence of Microbial Indicators in Reid Park Wetlands
Jepson Sutton
Scott Stine
SWES 574
Purpose
• Determine the effect of water flow rate on microbial indicator concentration– Stagnant Pond, Turbulent Pond, and Waterfall
• Determine the effect of aquatic plants on microbial indicator concentrations– Open water vs. Planted area
• Presence/Effect of chlorination and pH• Compare presence of coliforms and enterococci
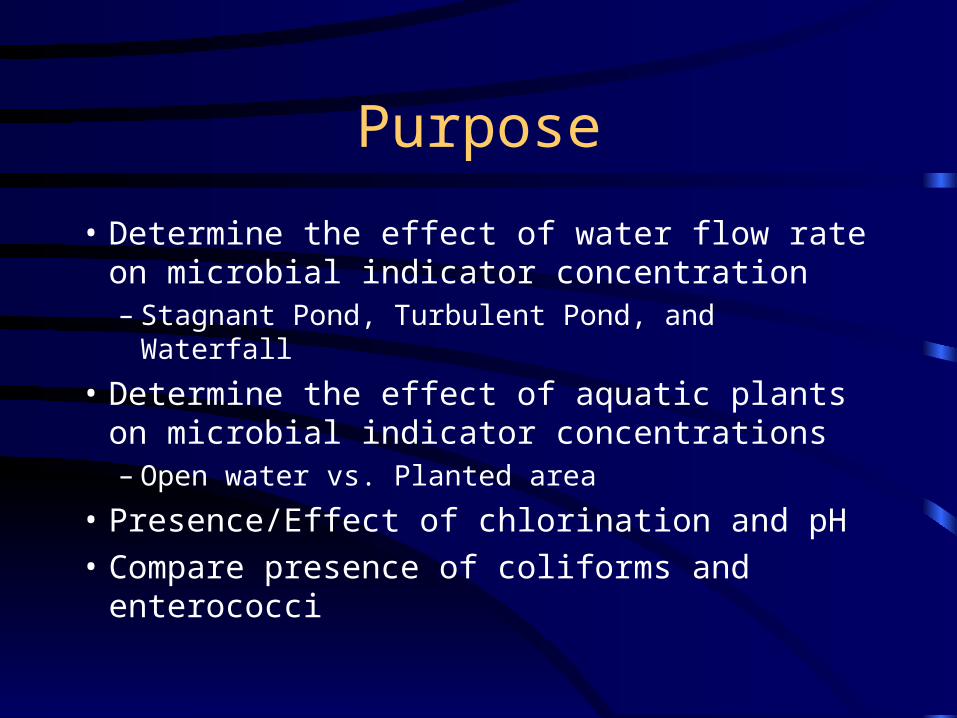
Experimental Problems
• It was determined that the ponds contained a shading dye that eliminated all plant growth.
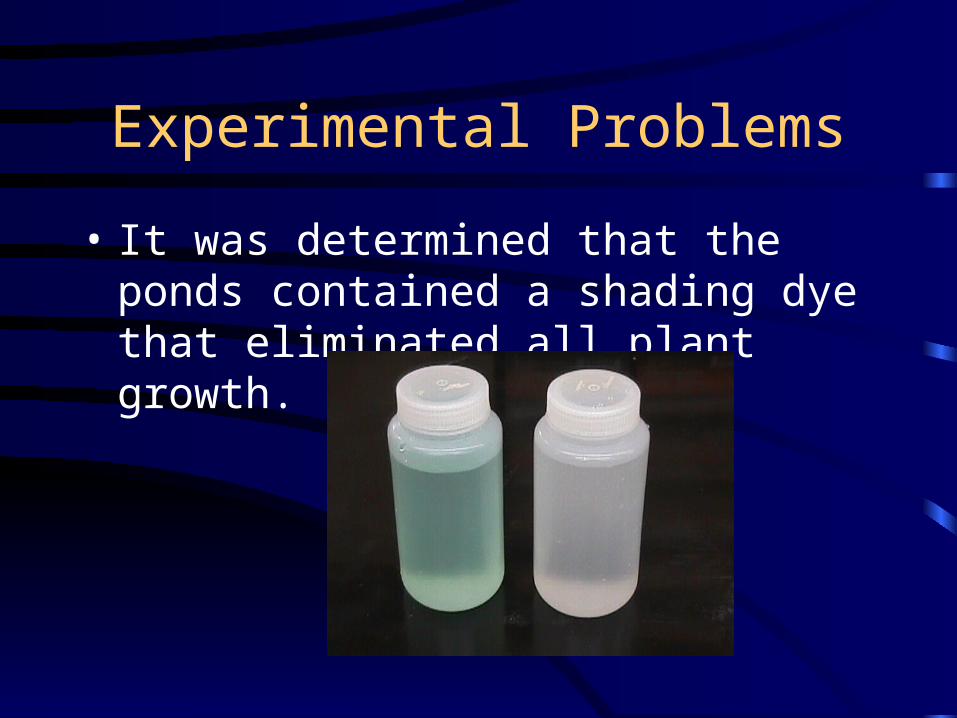
Methods
• Collect samples from three varied areas of constructed wetlands at Reid Park– Located at 22nd Street and Country Club
• Use Colilert and Enterolert (IDEXX) to determine indicator concentrations
Methods
• Make dilutions and add Colilert/Enterolert reagents

Methods
• Pour into Quantitray (IDEXX) and seal using sealer

Methods
• Count number of positive wells
• Enumerate using MPN table

Total Coliforms
• Includes Escherichia, Citrobacter, Enterobacter, and Klebsiella
• Used as a standard for assessing fecal contamination of recreational and drinking water.
• Problems in accuracy due to ability to replicate in environment.
• Colilert positive=Yellow well

Fecal Coliforms
• Includes Escherichia and Klebsiella
• Definitive indication of fecal contamination
• Unable to replicate in the environment
• Colilert can enumerate E. coli concentrations
• Colilert positive=fluoresce under UV lamp

Colilert

Colilert (IDEXX)
• Defined substrate technology (DST) simultaneous detection of total coliforms and E. coli
• Contains specific indicator nutrients: ortho-nitrophenyl-beta-D-galactopyranoside (ONPG) and 4-methyl-umbellifery-beta-D-glucuronide(MUG)

Colilert (IDEXX)
• Total coliforms react with ONPG to form yellow color.
• E. coli react with MUG to form fluorescent color
• Can detect low levels of total coliforms and E. coli (1CFU/100ml)
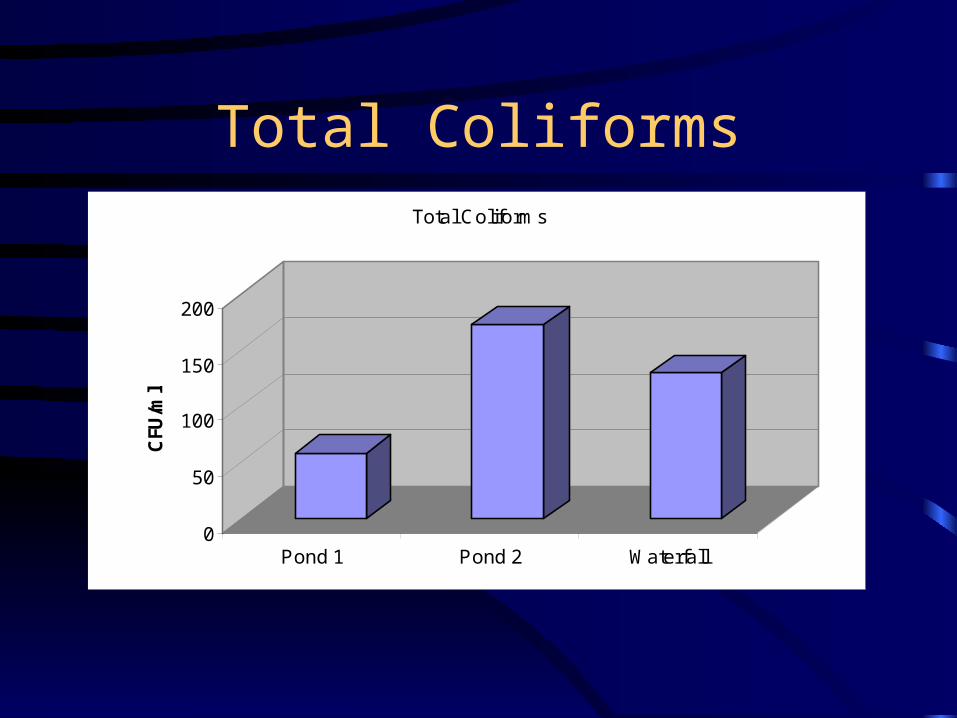
Total Coliforms
0
50
100
150
200
CFU/ml
Pond 1 Pond 2 Waterfall
Total Coliforms

E. coli
0
5
10
15
20
CFU/ml
Pond 1 Pond 2 Waterfall
E. Coli
Fecal Streptococci Indicators
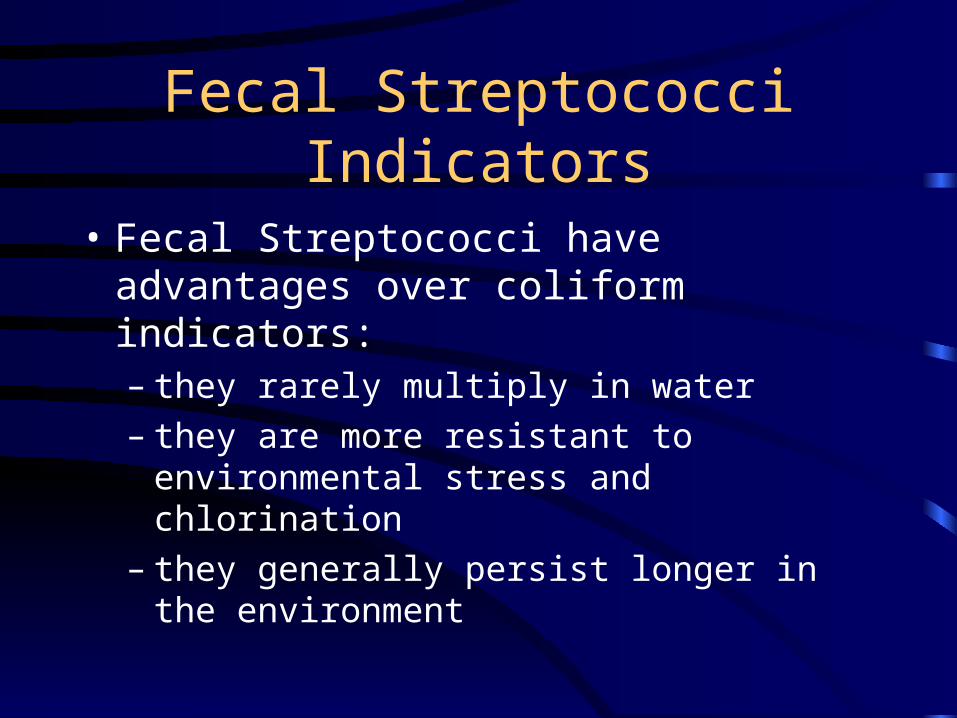
• Fecal Streptococci have advantages over coliform indicators:– they rarely multiply in water– they are more resistant to environmental stress
and chlorination– they generally persist longer in the environment

Enterococci
• Members of Lancefield Group D of Streptoccocus (fecal streptococci subgroup)
• “Enterococci” - normal colonist of the human large intestine
• Streptococcus often given as genus of this group in water industry
Enterococci
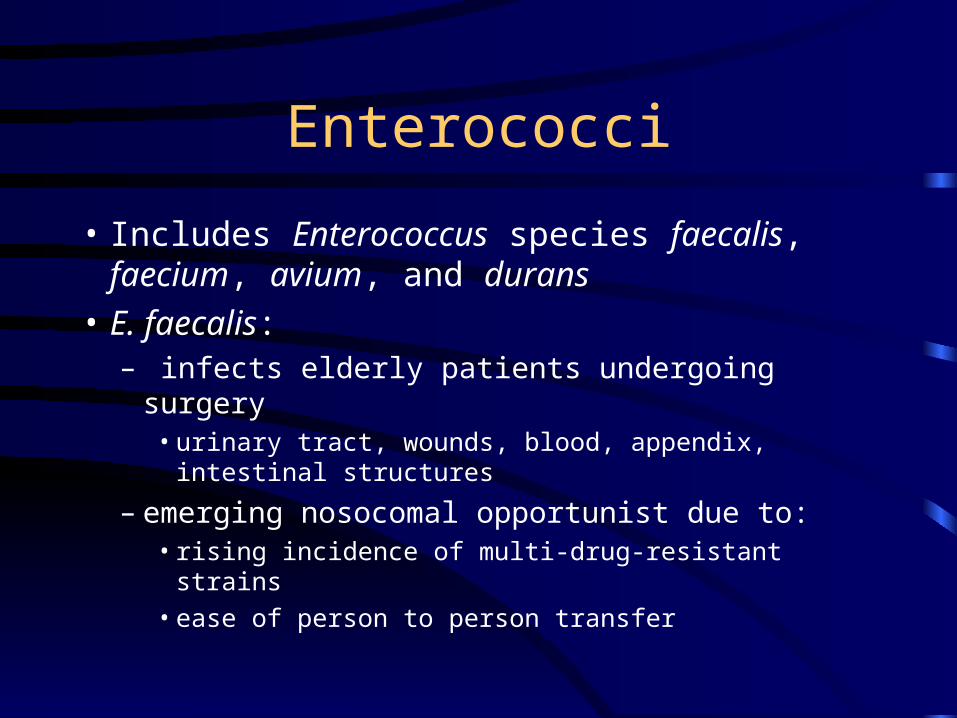
• Includes Enterococcus species faecalis, faecium, avium, and durans
• E. faecalis:– infects elderly patients undergoing surgery
• urinary tract, wounds, blood, appendix, intestinal structures
– emerging nosocomal opportunist due to:• rising incidence of multi-drug-resistant strains
• ease of person to person transfer
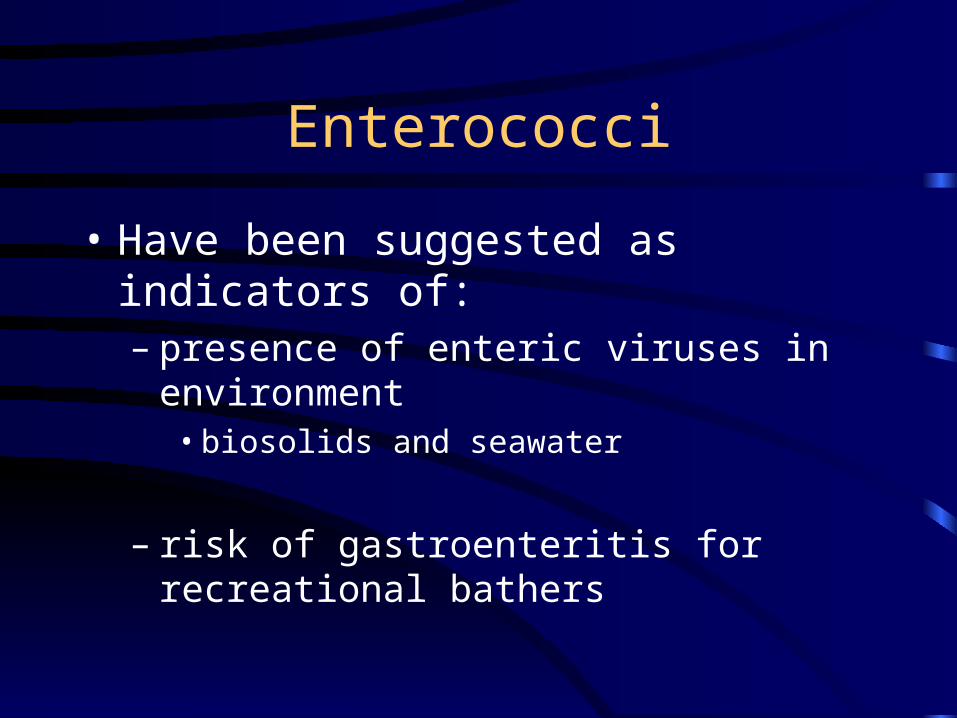
Enterococci
• Have been suggested as indicators of:– presence of enteric viruses in environment
• biosolids and seawater
– risk of gastroenteritis for recreational bathers
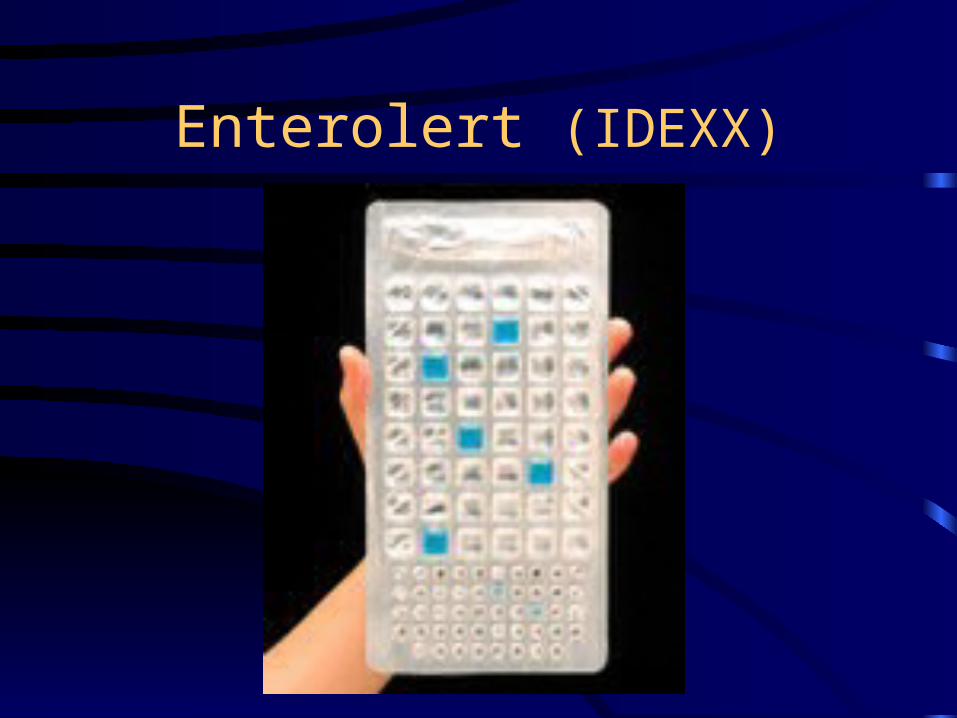
Enterolert (IDEXX)
Enterolert (IDEXX)
• Uses a nutrient-indicator to detect enterococci– fluoresces when metabolized by enterococci
• Compared to standard membrane filtration (MF) method:– 50% fewer false positives– 95% fewer false negatives
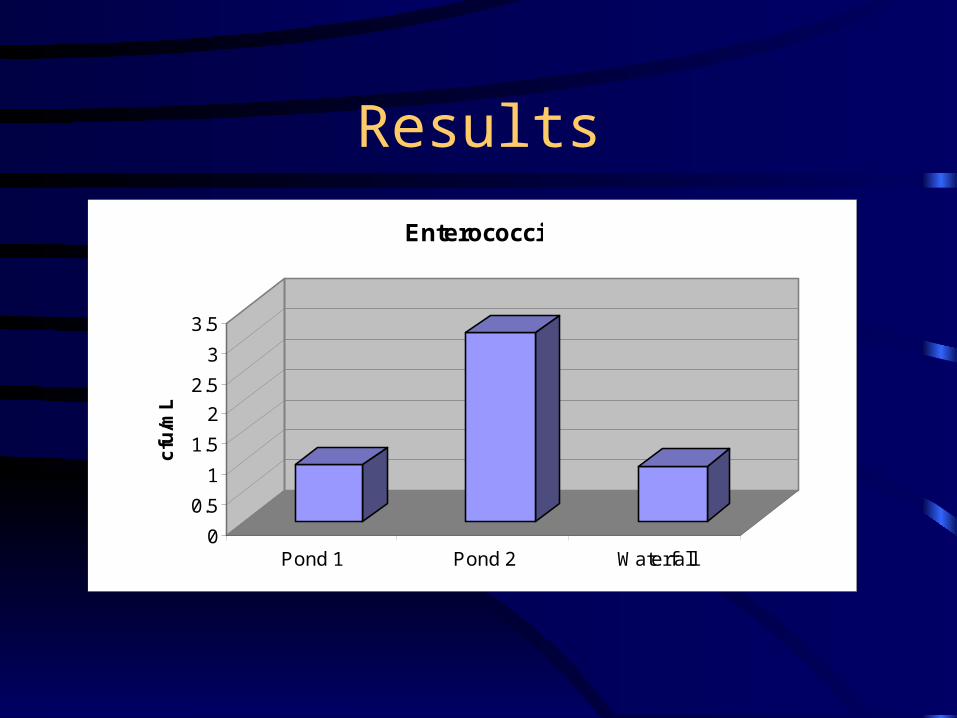
Results
0
0.5
1
1.5
2
2.5
3
3.5
cfu/mL
Pond 1 Pond 2 Waterfall
Enterococci
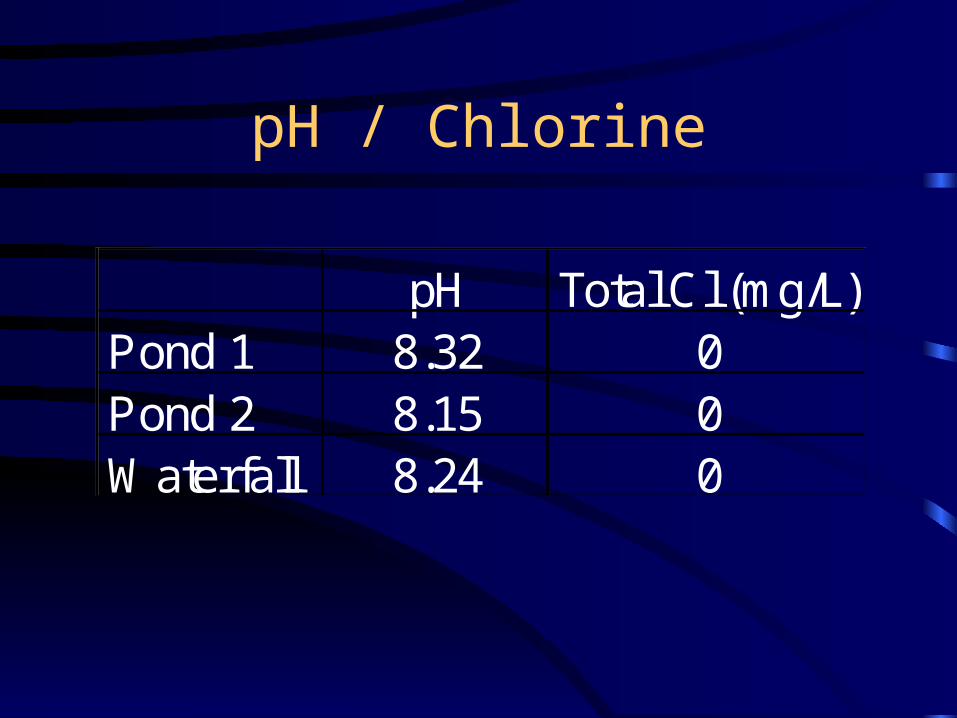
pH / Chlorine
pH Total Cl (mg/L)Pond 1 8.32 0Pond 2 8.15 0Waterfall 8.24 0

FC/FS Ratio
• >4.0 = contamination of human origin
• <0.7 = contamination of animal origin
• Pond 1: FC/FS = 5
• Pond 2 : FC/FS = 15
• Waterfall : FC/FS = 0.8

Discussion
• Probable pathogen removal factors– temperature, natural die-off, sedimentation
• sedimentation most significant
• Studies have shown slower flow rates allow more settling of microorganisms– Pond 1 would be expected to have lowest
numbers
Discussion
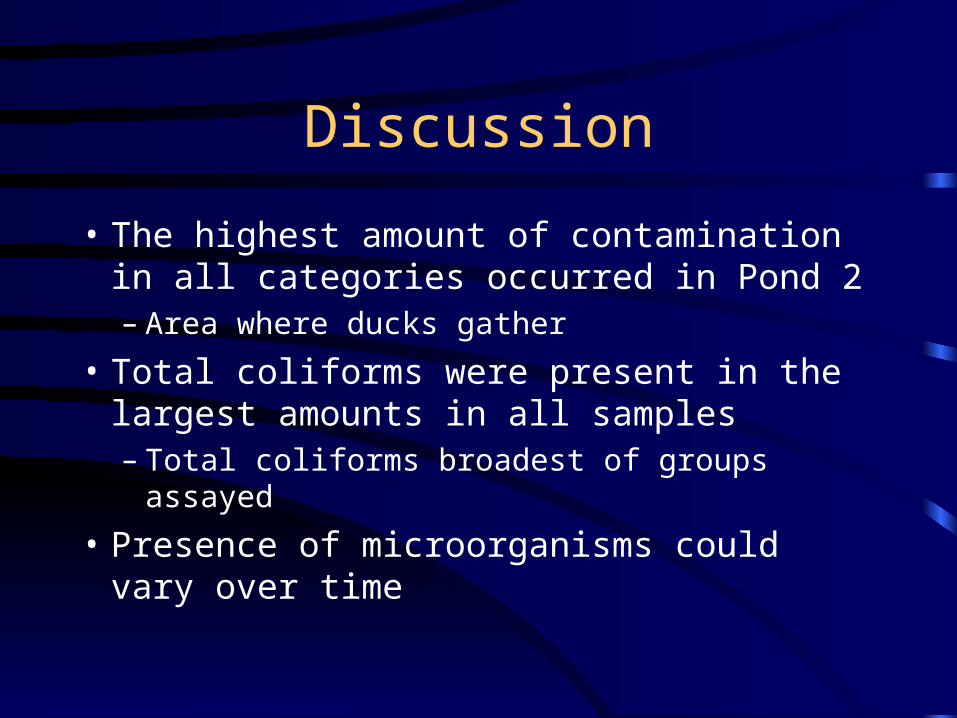
• The highest amount of contamination in all categories occurred in Pond 2– Area where ducks gather
• Total coliforms were present in the largest amounts in all samples– Total coliforms broadest of groups assayed
• Presence of microorganisms could vary over time
Discussion
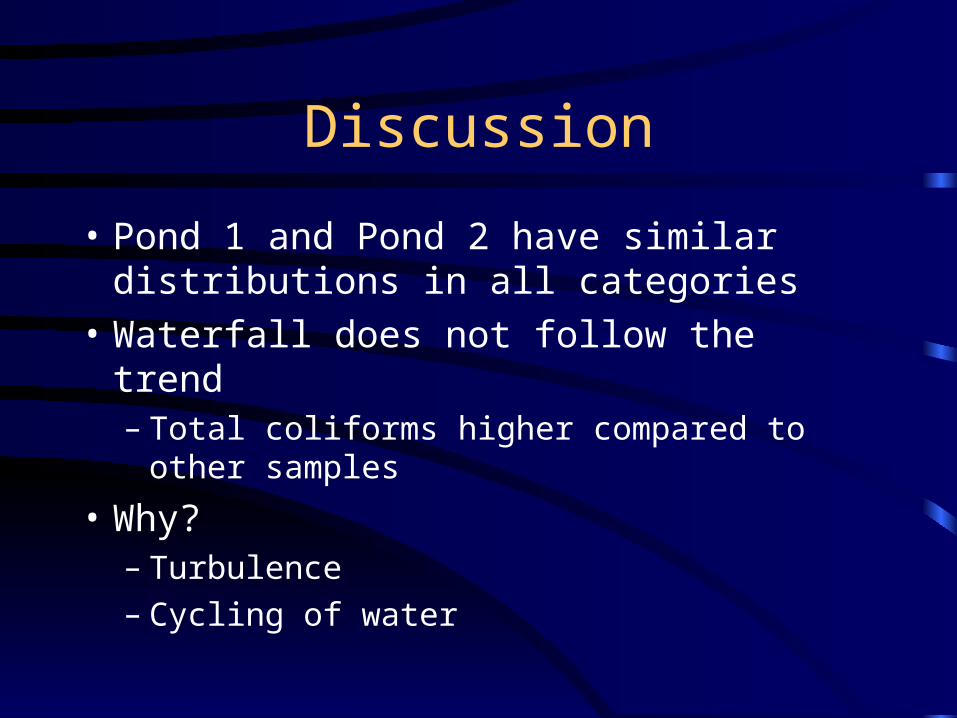
• Pond 1 and Pond 2 have similar distributions in all categories
• Waterfall does not follow the trend– Total coliforms higher compared to other
samples
• Why?– Turbulence– Cycling of water

Discussion
• FC/FS Ratio suggests:– Pond 1 and Pond 2 contamination is of human
origin
– Waterfall contamination is predominantly of animal origin
Discussion
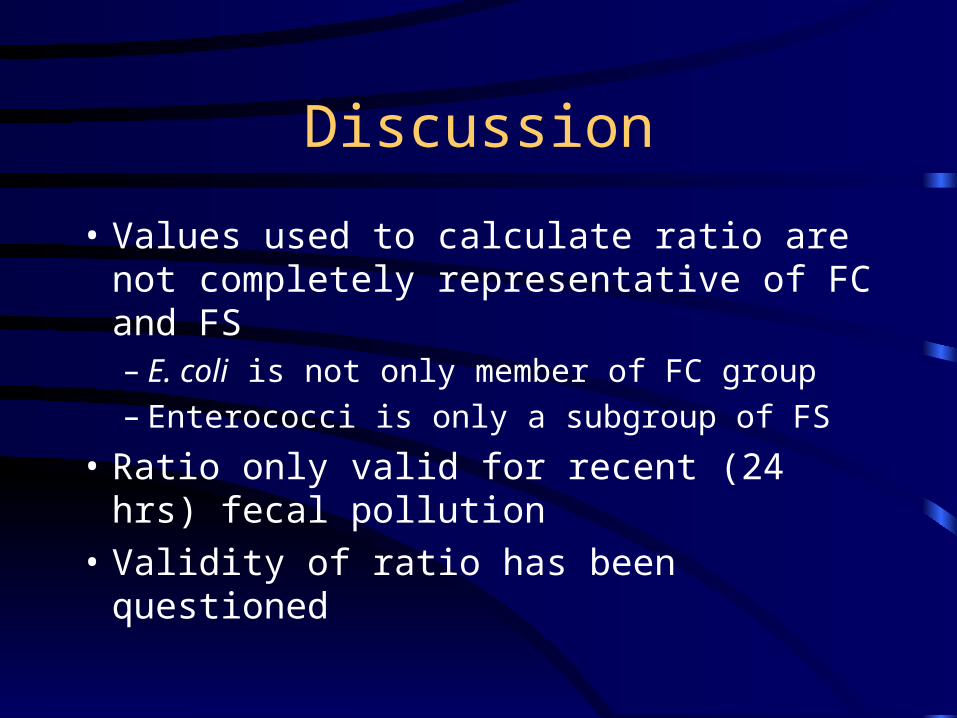
• Values used to calculate ratio are not completely representative of FC and FS– E. coli is not only member of FC group– Enterococci is only a subgroup of FS
• Ratio only valid for recent (24 hrs) fecal pollution
• Validity of ratio has been questioned