Embed Size (px)
Citation preview
Preschool Development Grants and
Inclusion: Data, Progress and Challenges
2017 Inclusion Institute
Jim Lesko and Shelley deFosset, AEM
AEM Corporation – 3/15/17 1
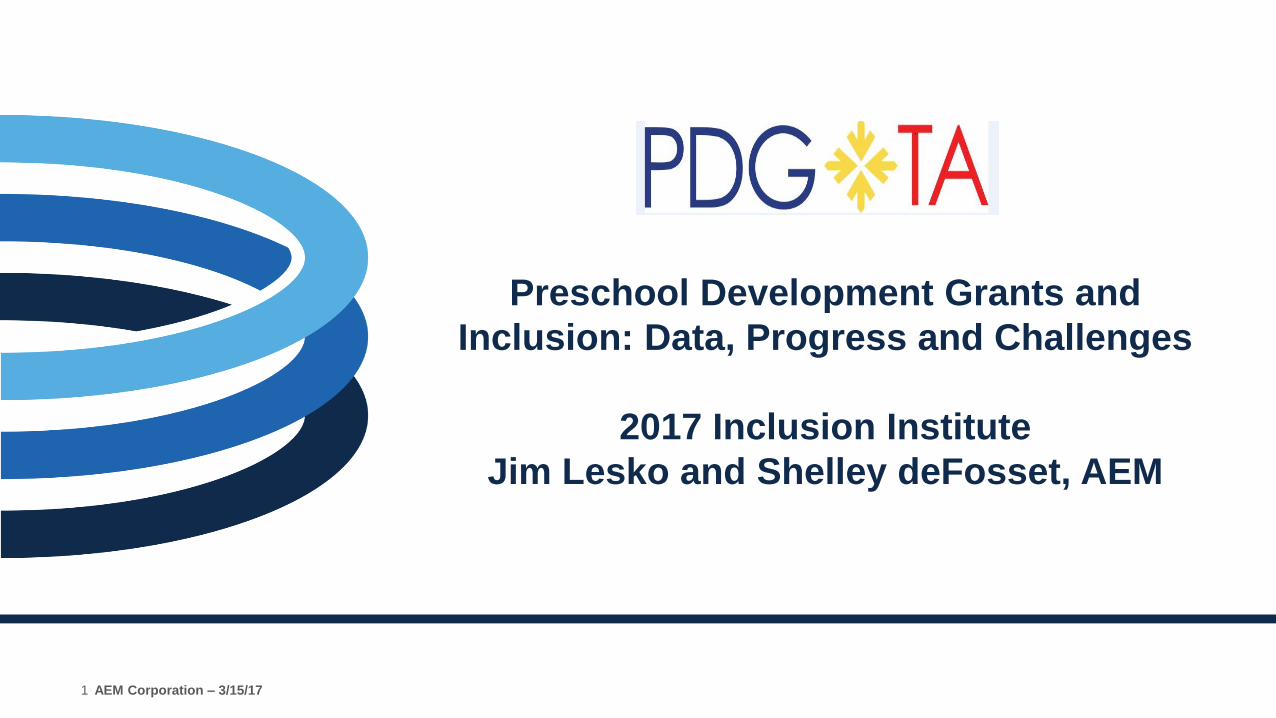
The Facts Inclusion benefits all children
Children can be effectively
educated in inclusive programs
using specialized instruction
Families of all children
generally have positive views
of inclusion
Inclusion is not more expensive
Children do not need to be “ready” for inclusion
Further Facts
Research is clear: it is effective
IDEA is clear: it is preferred
The profession is clear: it is time!
DEC/NAEYC position statement
DEC Recommended Practices
Joint ED and HHS policy statement
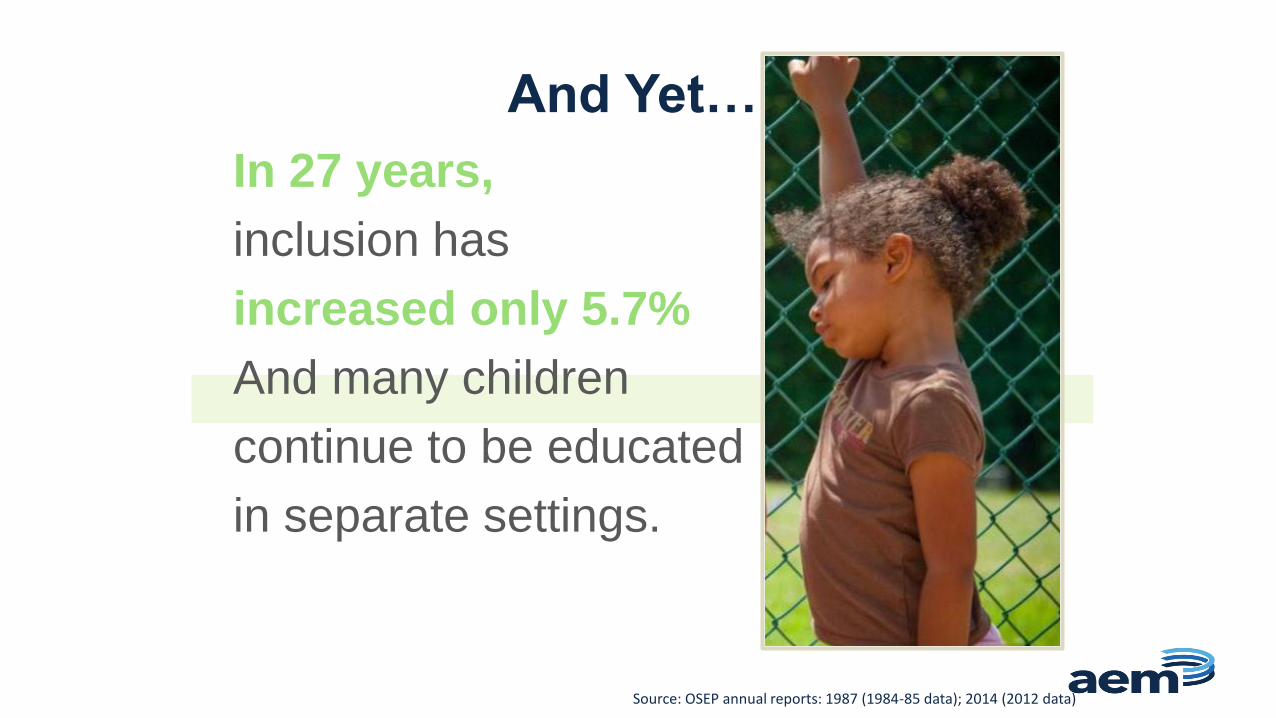
And Yet…
In 27 years,
inclusion has
increased only 5.7%
And many children
continue to be educated
in separate settings.
Source: OSEP annual reports: 1987 (1984-85 data); 2014 (2012 data)
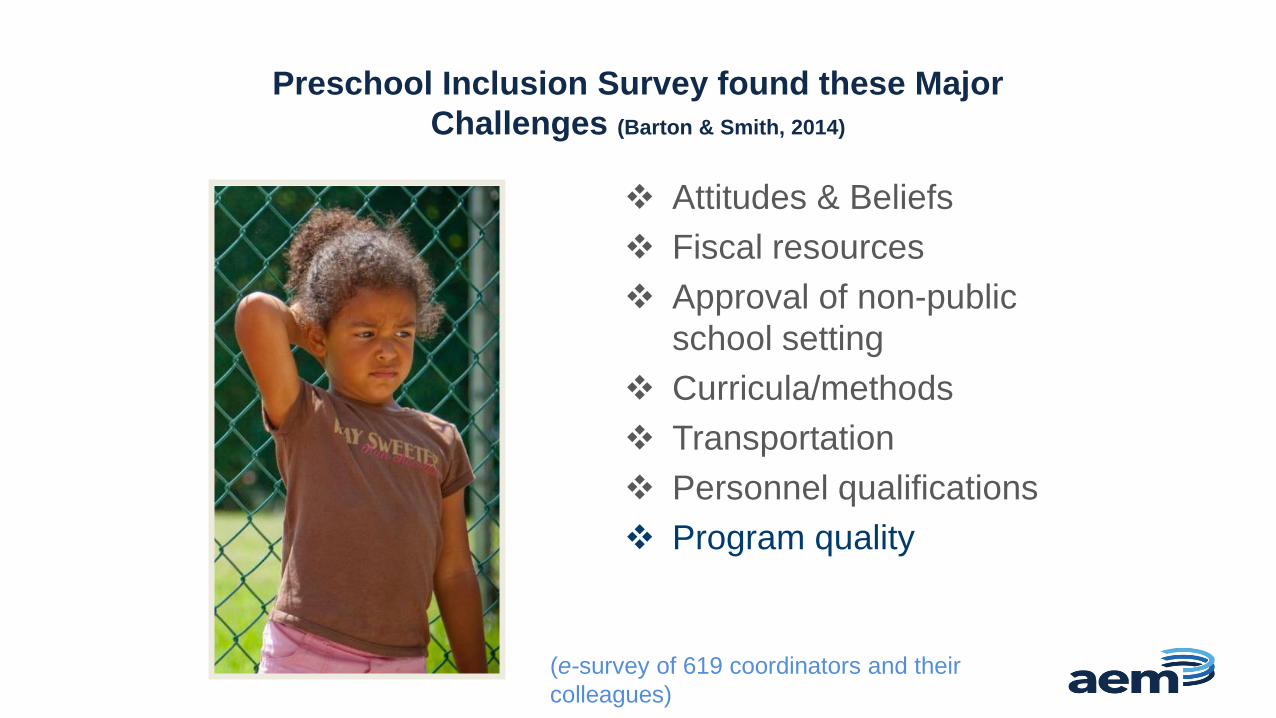
Attitudes & Beliefs
Fiscal resources
Approval of non-public
school setting
Curricula/methods
Transportation
Personnel qualifications
Program quality
Preschool Inclusion Survey found these Major
Challenges (Barton & Smith, 2014)
(e-survey of 619 coordinators and their
colleagues)
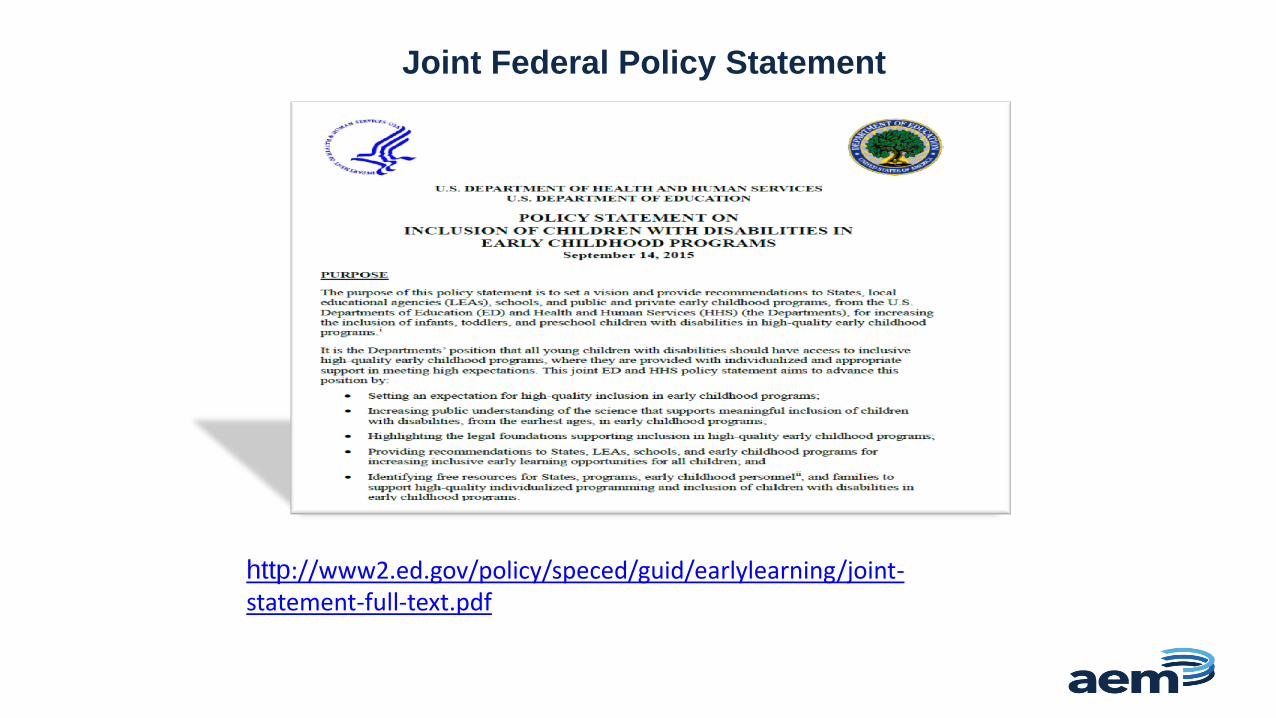
Joint Federal Policy Statement
http://www2.ed.gov/policy/speced/guid/earlylearning/joint-statement-full-text.pdf
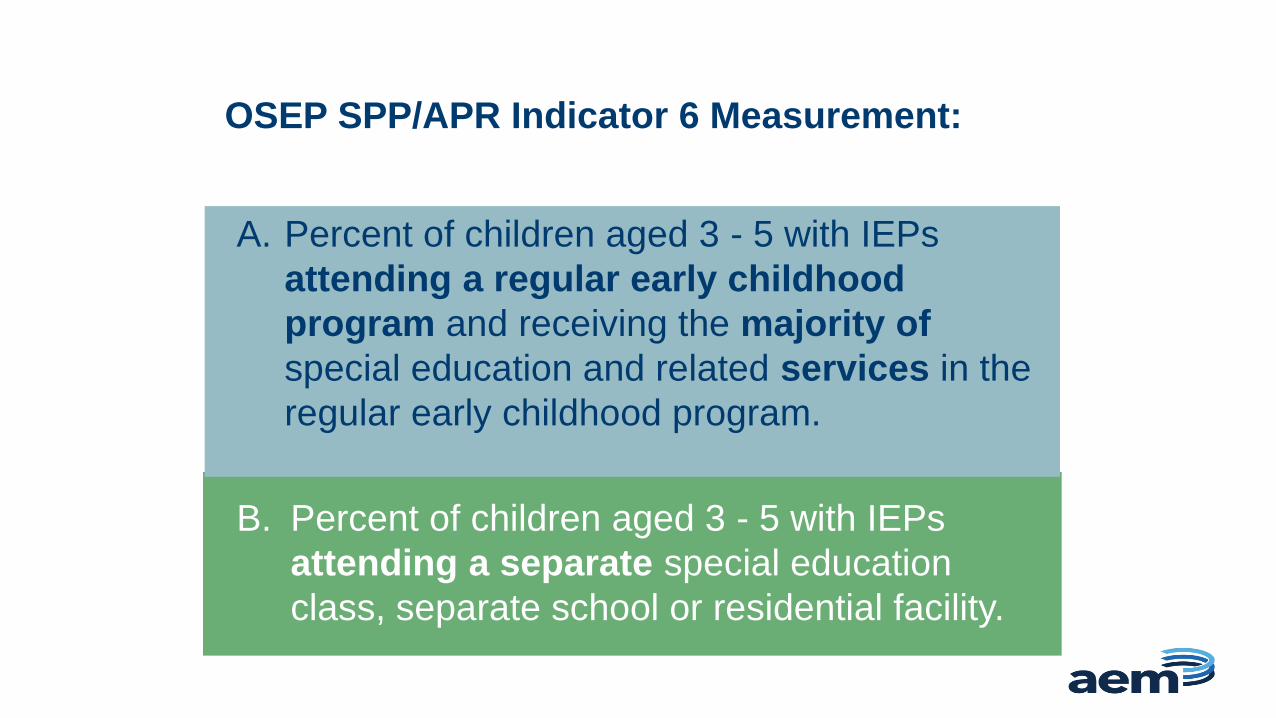
A. Percent of children aged 3 - 5 with IEPs
attending a regular early childhood
program and receiving the majority of
special education and related services in the
regular early childhood program.
B. Percent of children aged 3 - 5 with IEPs
attending a separate special education
class, separate school or residential facility.
OSEP SPP/APR Indicator 6 Measurement:
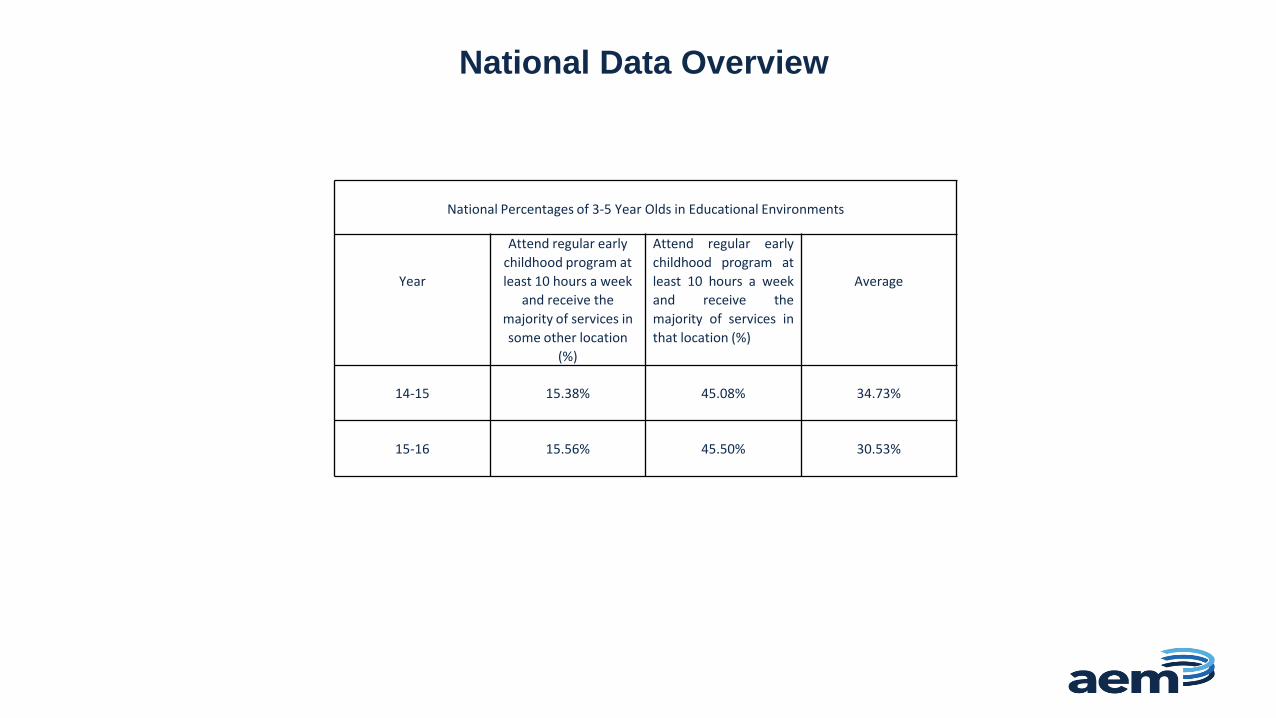
National Data Overview
National Percentages of 3-5 Year Olds in Educational Environments
Year
Attend regular early
childhood program at
least 10 hours a week
and receive the
majority of services in
some other location
(%)
Attend regular early
childhood program at
least 10 hours a week
and receive the
majority of services in
that location (%)
Average
14-15
15.38%
45.08%
34.73%
15-16
15.56%
45.50%
30.53%
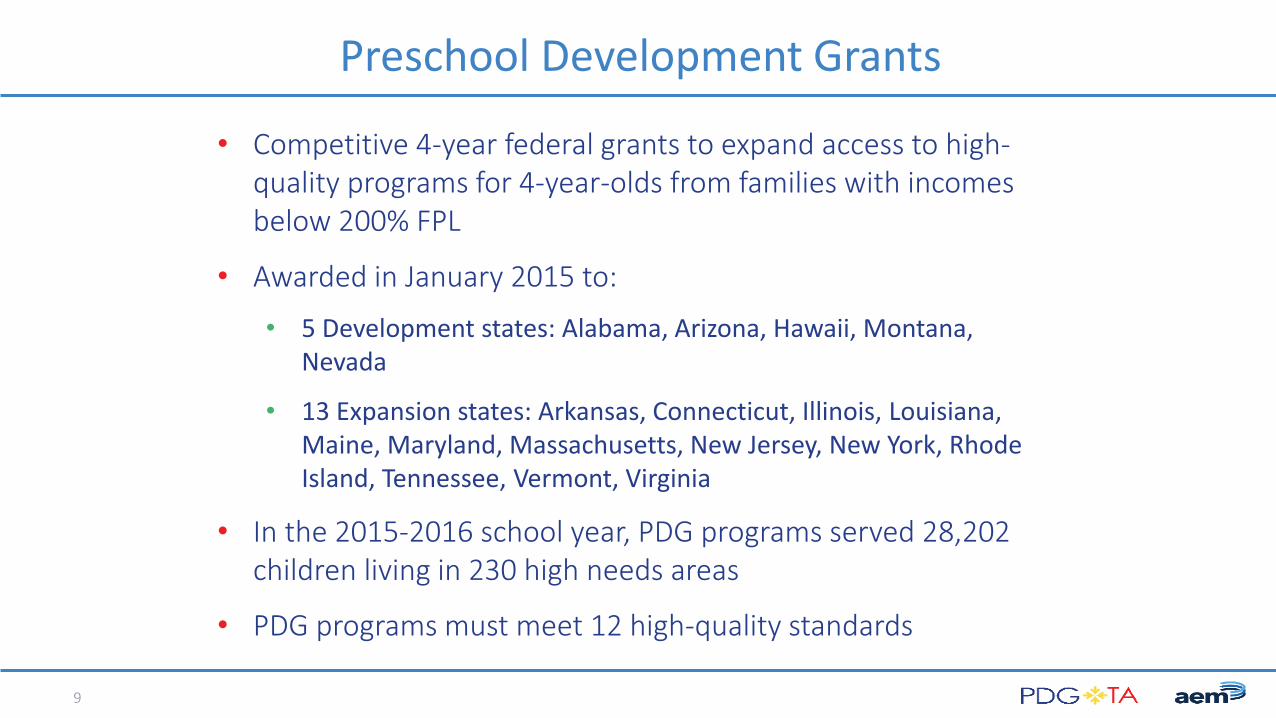
Preschool Development Grants
• Competitive 4-year federal grants to expand access to high-quality programs for 4-year-olds from families with incomes below 200% FPL
• Awarded in January 2015 to:
• 5 Development states: Alabama, Arizona, Hawaii, Montana, Nevada
• 13 Expansion states: Arkansas, Connecticut, Illinois, Louisiana, Maine, Maryland, Massachusetts, New Jersey, New York, Rhode Island, Tennessee, Vermont, Virginia
• In the 2015-2016 school year, PDG programs served 28,202 children living in 230 high needs areas
• PDG programs must meet 12 high-quality standards
9
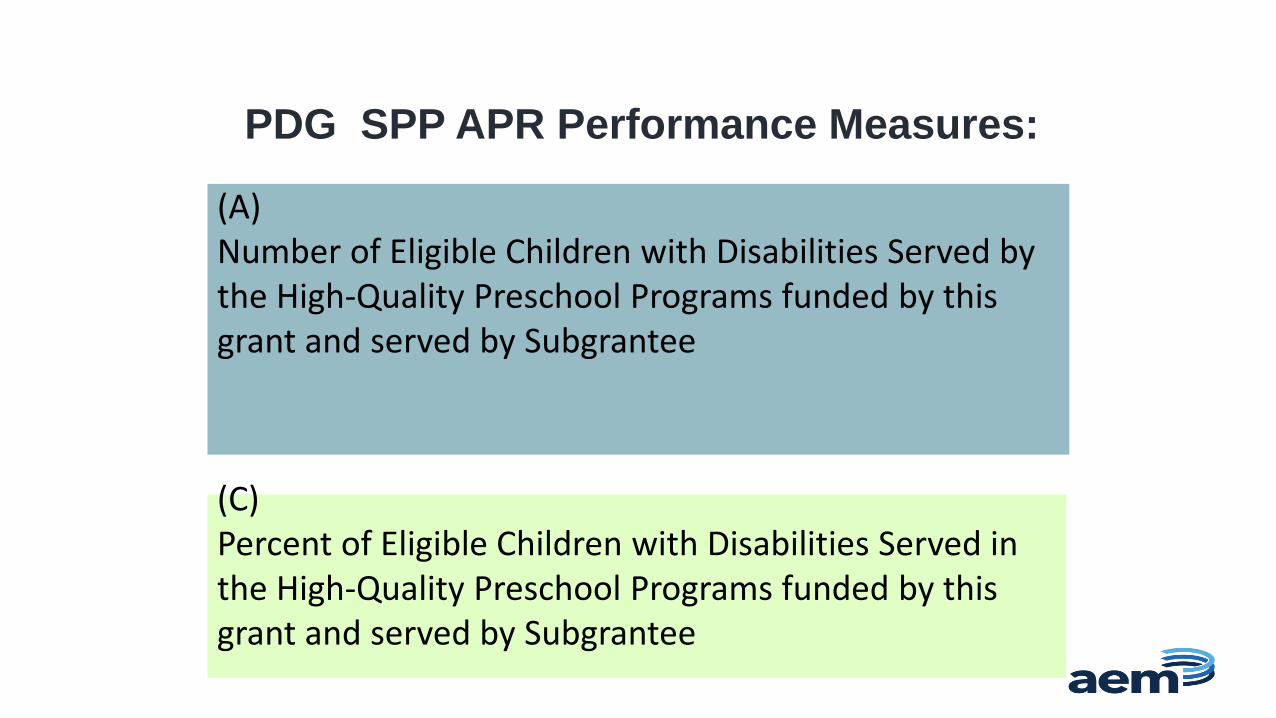
(A) Number of Eligible Children with Disabilities Served by the High-Quality Preschool Programs funded by this grant and served by Subgrantee
(C) Percent of Eligible Children with Disabilities Served in the High-Quality Preschool Programs funded by this grant and served by Subgrantee .
PDG SPP APR Performance Measures:
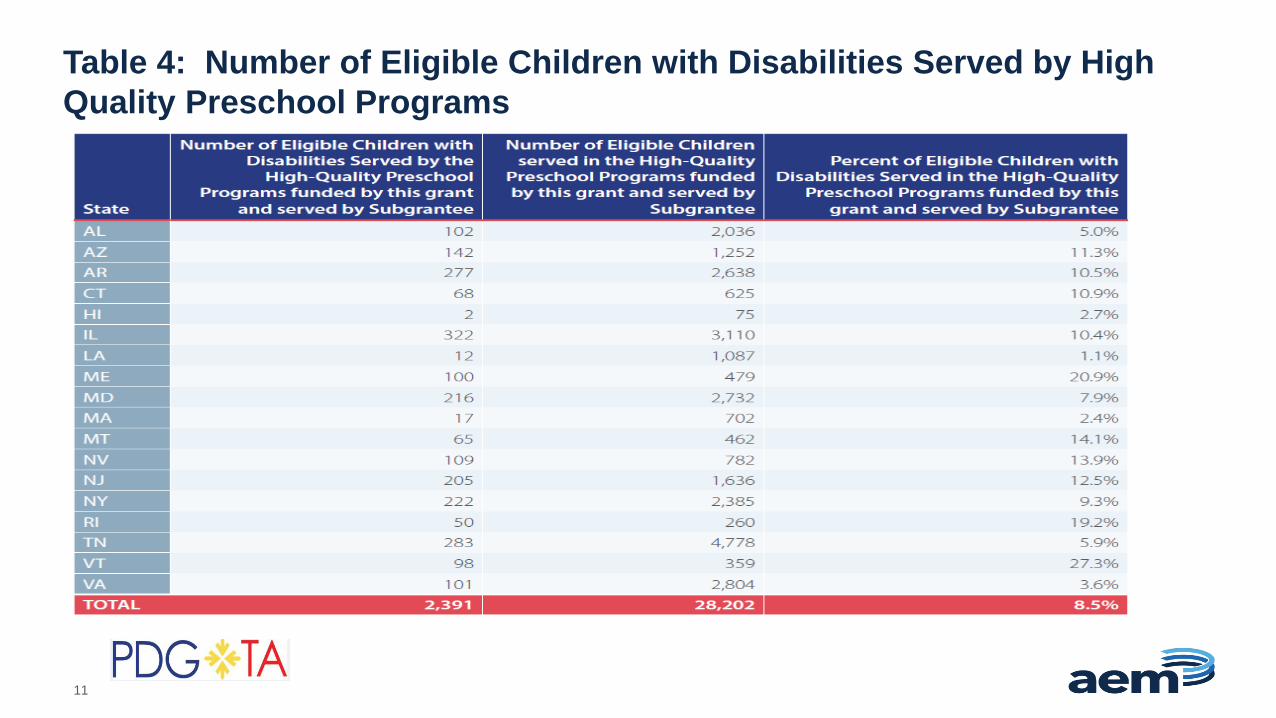
Table 4: Number of Eligible Children with Disabilities Served by High
Quality Preschool Programs
11
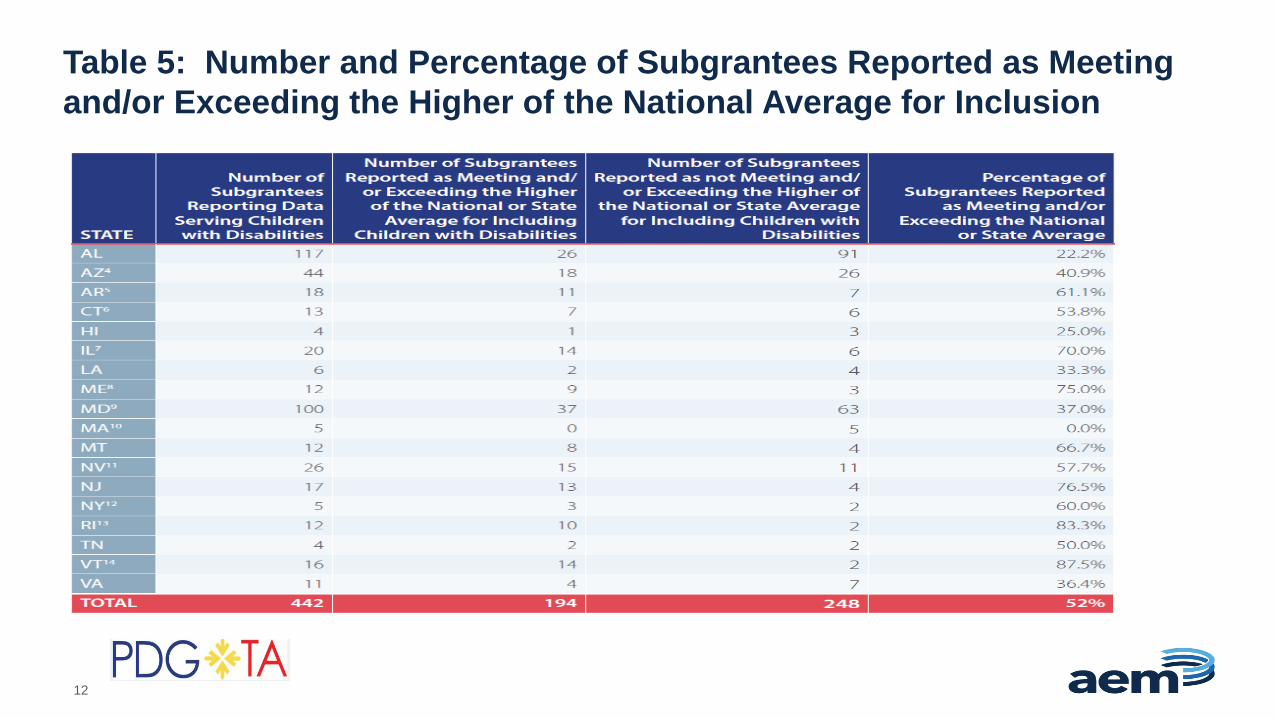
Table 5: Number and Percentage of Subgrantees Reported as Meeting
and/or Exceeding the Higher of the National Average for Inclusion
12
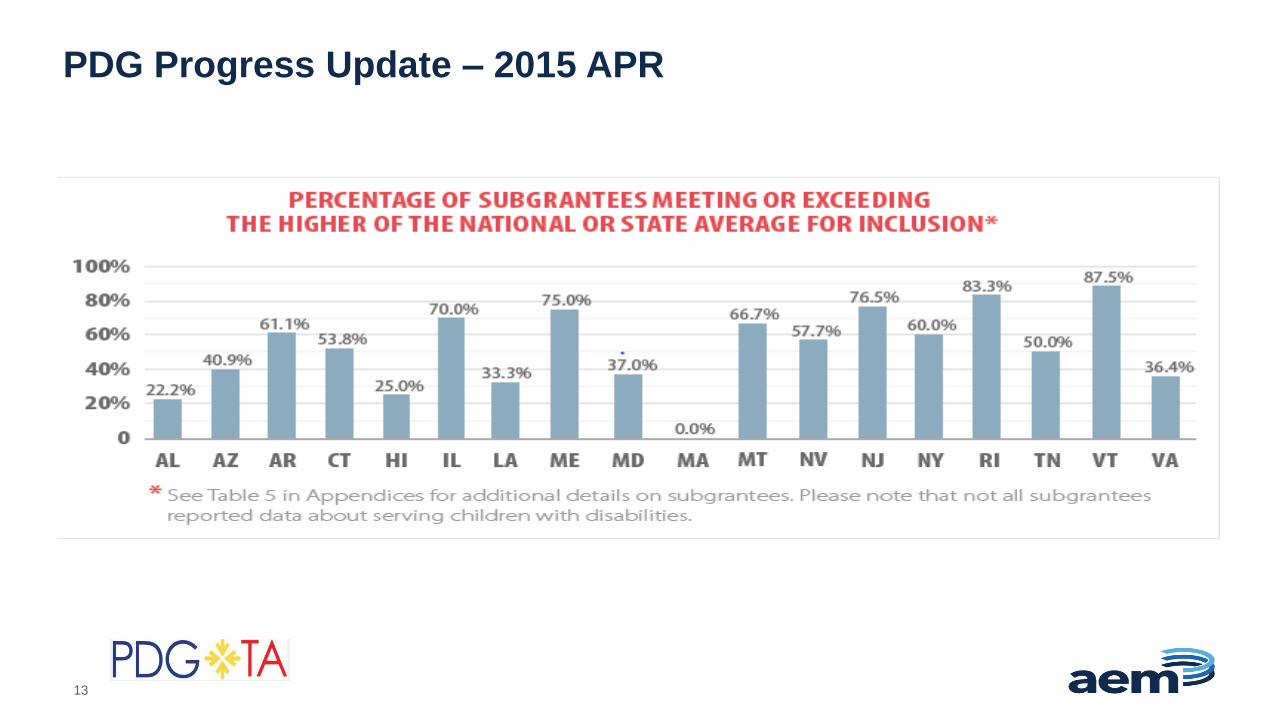
PDG Progress Update – 2015 APR
13
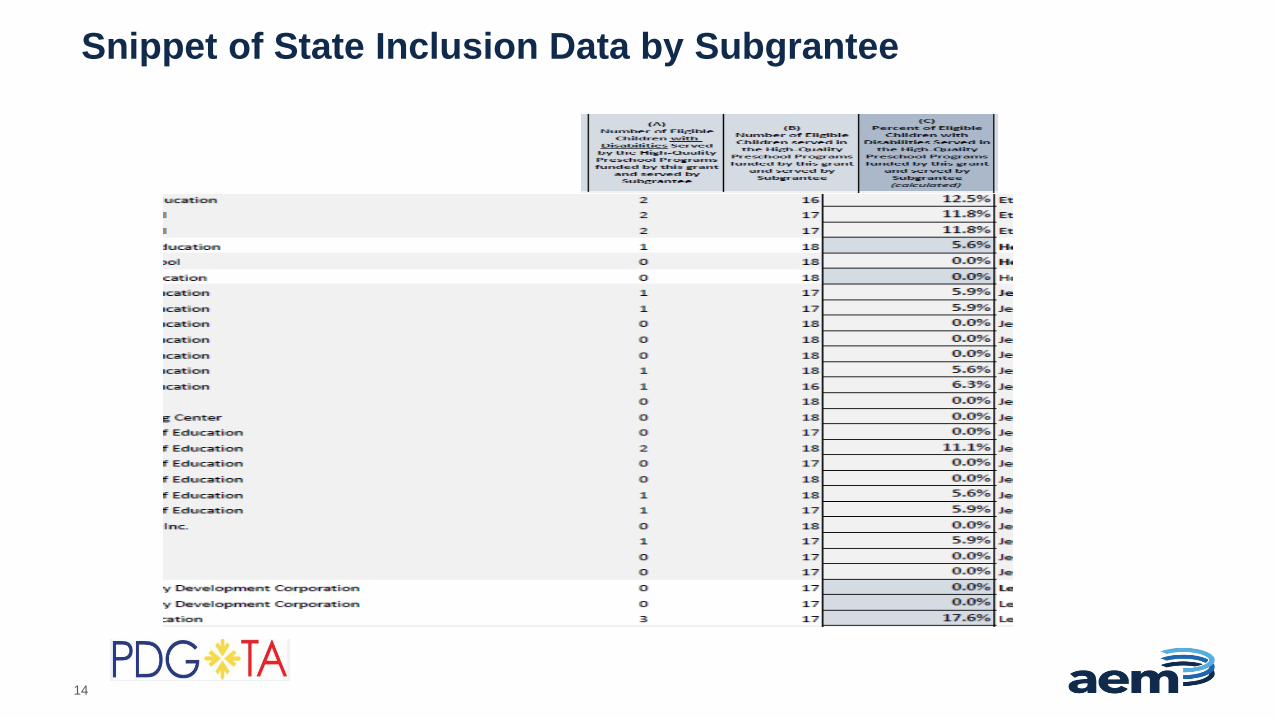
Snippet of State Inclusion Data by Subgrantee
14
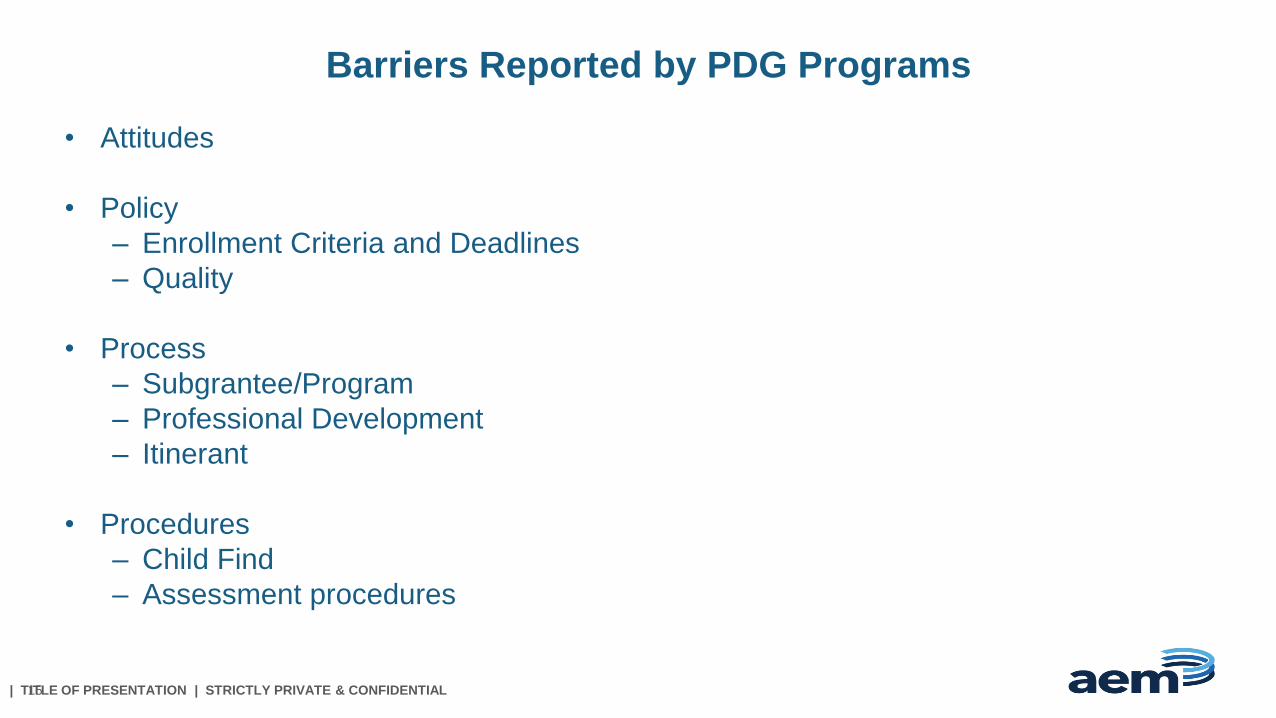
Barriers Reported by PDG Programs
• Attitudes
• Policy
– Enrollment Criteria and Deadlines
– Quality
• Process
– Subgrantee/Program
– Professional Development
– Itinerant
• Procedures
– Child Find
– Assessment procedures
| TITLE OF PRESENTATION | STRICTLY PRIVATE & CONFIDENTIAL 15
PDG/CoP for 619 Coordinators and PDG Staff
Analysis of APRs
Technical Assistance to PDG Programs
| TITLE OF PRESENTATION | STRICTLY PRIVATE & CONFIDENTIAL 16
Information was Gathered from States by :
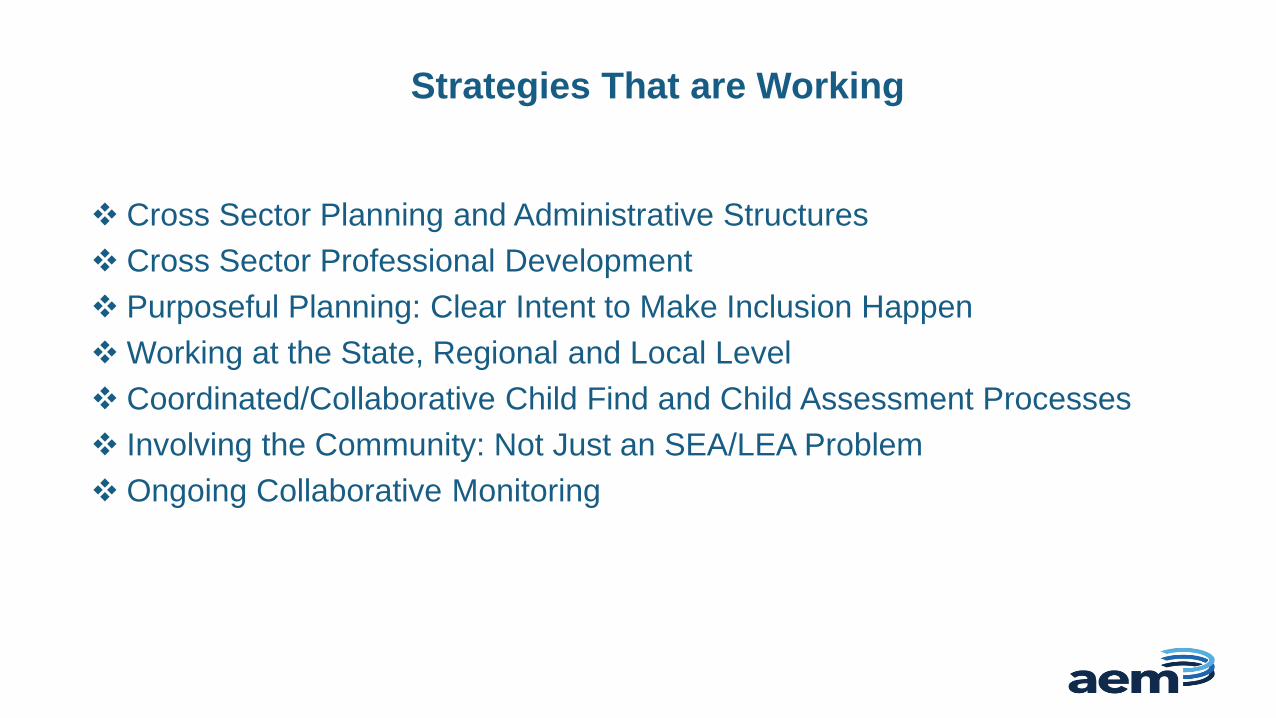
Strategies That are Working
Cross Sector Planning and Administrative Structures
Cross Sector Professional Development
Purposeful Planning: Clear Intent to Make Inclusion Happen
Working at the State, Regional and Local Level
Coordinated/Collaborative Child Find and Child Assessment Processes
Involving the Community: Not Just an SEA/LEA Problem
Ongoing Collaborative Monitoring
BREAKOUT DISCUSSIONS
More Resources and Information
• PDG TA Web Site:
https://pdg.grads360.org/#program
• ECTA WEB SITE:
http://ectacenter.org/topics/inclusion/default.asp
20
Jim Lesko, PDG TA,
Shelley deFosset, PDG TA
Evaluation Link
http://inclusioninstitute.fpg.unc.edu/2017-
institute-evaluations