Embed Size (px)
Citation preview

mastercard foundation
Secondary Education in Africa:
PREPARING YOUTH
FOR THE FUTURE
OF WORK

This paper was commissioned by MasterCard Foundation. The opinions, findings, and conclusions stated herein are those of the authors and do not necessarily reflect those of the Foundation.
i
THE EFFICIENCY OF SECONDARY
EDUCATION IN SUB-SAHARAN AFRICA
EESSA PROJECT
THE CASE OF
MALAWI
Research Report
October 2018

ii
Acknowledgement
This report has benefited from the hard work, insights and time of many individuals. We would like to
recognize the work of the field research team in Malawi led by Dr Joseph Chimombo. Without their
dedication to the research the rich data gathered from the secondary schools would not have been
possible. Special thanks to Mr Andrii Morozevych of Paralab Ltd. who developed the GPS APP for
administering the questionnaire and worked tirelessly with the Sussex team to ensure its successful
application.
We would also like to thank the MasterCard Foundation for providing funds for this study. Thank you
for the tremendous work you do on the front line to build a better future for disadvantaged students in
Africa. Finally, a special thank you to Samuel Yalew Adela of the Mastercard Foundation for his
incredible support and patience throughout the whole research process and for his feedback on the
report.
Research Team
Sussex Team
Kwame Akyeampong - Team Leader and Principal Investigator
Marcos Delprato - Quantitative Investigator
George Mindano - Qualitative Investigator
Keith Lewin - Research Advisor
Malawi
Joseph Chimombo – Country Lead Researcher

iii
List of Contents
1. Introduction .................................................................................................................................... 1
1.1. Background to the Research ................................................................................................. 1
1.2. Background to the contract .................................................................................................. 2
1.3. Structure of the report .......................................................................................................... 3
2. Secondary Education in Malawi ................................................................................................... 4
2.1. A Review of National Policies ............................................................................................... 4
2.1.1. The First Education Plan (1973) ................................................................................... 4
2.1.2. The Second Education Plan (EDPII 1985-95) .............................................................. 4
2.1.3. The Free Primary Education Policy (FPE) 1994 .......................................................... 4
2.1.4. Policy and Investment Framework (PIF) (1995) .......................................................... 5
2.1.5. The introduction of CDSS (1999) .................................................................................. 5
2.1.6. The National Education Sector Plan (NESP) (2008-17) .............................................. 5
2.1.7. The National Education Policy (2013 and 2016) .......................................................... 6
2.1.8. Summary ......................................................................................................................... 6
2.2. Typology of Secondary Schools in Malawi .......................................................................... 6
3. Design of the research ..................................................................................................................10
3.1. Research questions...............................................................................................................10
3.2. Design process ......................................................................................................................10
3.3. Sampling ...............................................................................................................................11
4. Defining School Efficiency and Framework ..............................................................................12
5. School Efficiency in Malawi ........................................................................................................14
5.1. Summary Statistics ..............................................................................................................14
5.1.1. Schools’ background characteristics ...........................................................................14
5.1.2. School Practices ............................................................................................................15
5.1.3. School Finances ............................................................................................................15
5.1.4. Access, participation and grade transition...................................................................18
5.1.5. Teachers – qualification, utilisation, turnover and professional development ..........20
5.1.6. Examination Preparation and Achievement ...............................................................24
5.1.7. Computer to student and teacher ratio.........................................................................25
5.1.8. Autonomy and recruitment ...........................................................................................25
5.1.9. Achievement ..................................................................................................................26
5.1.10. Cost ................................................................................................................................27
5.2. Efficiency and Costs ............................................................................................................27

iv
5.2.1. Pass rates, costs and equity................................................................................................27
5.3. Data Envelopment Analysis (DEA) ....................................................................................28
5.3.1. Efficiency for different set of outputs ..........................................................................28
5.3.2. Cost and equity ..............................................................................................................31
5.3.3. Characteristics of the most and less efficient schools .................................................33
5.3.4. Efficiency and teacher characteristics .........................................................................34
6. Conclusions and Policy Recommendations................................................................................35
7. Bibliography .................................................................................................................................38
8. Appendix 1. Efficiency conceptualisation and framework.......................................................39
8.1. Data Envelopment Analysis (DEA) ....................................................................................39
8.1. Cost efficiency ......................................................................................................................41
8.2. Technical efficiency and cost efficiency .............................................................................42
9. Appendix 2. Questionnaire ..........................................................................................................43

v
List of Tables
Table 1.1. Participation in Primary and Secondary in LICs and LMICs in SSA ........................ 1
Table 2.1. Typology of secondary schools in Malawi ................................................................. 7
Table 2.2. Defining Characteristics of Secondary Schools in Malawi ........................................ 8
Table 5.1. Distribution of school sampled by type (Malawi) ....................................................14
Table 5.2. Distribution of schools by school type and location (Malawi) .................................14
Table 5.3. Distance from schools (Malawi) ...............................................................................14
Table 5.4. Mean school enrolment by type and location (Malawi) ...........................................15
Table 5.5. Source of funding by school type (Malawi) .............................................................16
Table 5.6. Proportion of socioeconomically disadvantaged students by school type (Malawi)16
Table 5.7. Case study schools’ school fees, enrollment and other sources of income (Malawi)
...................................................................................................................................................17
Table 5.8. Average number of teachers across school types (Malawi) .....................................20
Table 5.9. Teacher utilisation in case study schools ..................................................................22
Table 5.10. Teacher professional development (PD) support by school type – policies
(Malawi) ....................................................................................................................................23
Table 5.11. Teacher participation in professional development, last year (Malawi) ................23
Table 5.12. Headteachers professional development – participation last year (Malawi) ..........24
Table 5.13. Average number of PCs and PC student ratio (Malawi) ........................................25
Table 5.14. Autonomy on teaching timetable and selection (Malawi) ......................................25
Table 5.15. Pass rates and distinction rates (grade 12) (Malawi) ..............................................26
Table 5.16. Costs (Malawi) .......................................................................................................27
Table 5.17. Efficiency for different outputs ..............................................................................29
Table 5.18. Rank correlation coefficient of efficiency for different outputs (Malawi) .............29
Table 5.19. Efficiency by school type (Malawi) .......................................................................30
Table 5.20 Characteristics of the most and less efficient schools (Malawi) .............................33
Table 5.21. Difference on teachers’ characteristics for efficient and low efficient schools
(Malawi) ....................................................................................................................................34
Table 5.22. Correlation coefficient between teacher experience and his/her salary for efficient
and low efficient schools (Malawi) ...........................................................................................34
Table 8.1. Data Envelopment Analysis (DEA) specification ....................................................40

vi
List of Figures
Figure 3.1. Data collection and analysis ....................................................................................11
Figure 3.2. Malawi school sample distribution (percentage by location) ..................................11
Figure 4.1. Technical and cost efficiency and equity ................................................................13
Figure 5.1. Remedial classes, ability grouping and passing rates (Malawi)..............................15
Figure 5.2. Average dropout rate by school type and location (Grades 9-12) (Malawi) ...........19
Figure 5.3. Average dropout rate by grade by school type (Malawi) ........................................19
Figure 5.4. Selection across secondary school grades (Malawi) ...............................................20
Figure 5.5. Student teacher ratio (STR) (Malawi) .....................................................................21
Figure 5.6. Teacher turnover for the current year (Malawi) ......................................................22
Figure 5.7. Years of headteacher experience (Malawi) .............................................................24
Figure 5.8. Time used for exam preparation and achievement (Malawi) ..................................24
Figure 5.9. Passing rates for exam at grade 12 (Malawi) ..........................................................26
Figure 5.11. Unit cost and pass rates by school socioeconomic status (Malawi) ......................28
Figure 5.12. Efficiency score by location (Malawi) ..................................................................30
Figure 5.13. Efficiency scores by degree of school’s disadvantage (Malawi) ..........................31
Figure 5.14. Technical efficiency and cost efficiency (Malawi) ...............................................31
Figure 5.15. Technical efficiency and cost efficiency for pass rates with distinction by school
type (Malawi) .............................................................................................................................32
Figure 5.16. Efficiency by day or boarding school (Malawi)....................................................32
Figure 8.1. A graphical representation of efficiency - DEA ......................................................39
Figure 8.2 Cost efficiency ..........................................................................................................41
Figure 8.3. Technical and cost efficiency ..................................................................................42

vii
Acronyms
CDSS Conventional or Community Day Secondary Schools
CE Cost Efficiency
CSS Conventional Secondary School
DEA Data Envelopment Analysis
DMU Decision Making Unit
GER Gross Enrolment Rate
Govt Government
HT Headteacher
IIEP International Institute for Educational Planning
IQR Interquartile range
ISE Innovation in Secondary Education
LIC Low Income Countries
LMICs Low Middle-Income Countries
MF MasterCard Foundation
MWK Malawian Kwacha
NER Net Enrolment Rate
Non-USE Non-Universal Secondary Education
OECD Organisation for Economic Co-operation and Development
PD Professional development
PTA Parents and Teachers Association
SD Standard Deviation
SSA Sub-Sahara Africa
STR Student Teacher Ratio
TE Technical Efficiency
UIS UNESCO Institute for Statistics
UPE Universal Primary Education
USD US dollar
VRS Variable Returns to Scale

viii
Executive summary
Introduction
There is limited research on secondary education in sub-Saharan Africa that explores the key factors
which can promote efficient and effective secondary schools. What there is includes IIEP studies by
Lewin and Caillods (2001), and the outputs from the World Bank’s Secondary Education in Africa
programme that includes analysis of costs and efficiency (Lewin 2008). Knowledge gaps remain with
the risk that African governments embarking on large scale reforms in secondary education may invest
in ways that fail to identify the components of the system and processes that drive efficient and effective
delivery of secondary education, and therefore which areas to prioritize investment to achieve universal
access. This study of secondary school efficiency and effectiveness in Malawi responds to this gap and
provides evidence to inform discussions about key reforms in secondary education to improve quality
and equitable access, especially for disadvantaged groups.
Study Methods and Sample
Using both survey and case study data, the study analysed school efficiency in different types and sizes
of secondary schools. The main output measure was final examination grades. For an estimation of
inputs, teacher numbers, student-teacher ratio, class sizes, teacher quality (qualified/unqualified), and
other infrastructure and material resources in schools was used. The samples sizes for the analysis was
based on 88 secondary schools.
School Efficiency – Applied definitions in the study
In this study we have defined and applied school efficiency in three ways.
First, efficient schools produce good learning outcomes, measured in terms of examination results with
key inputs. This definition makes it easy to quantify efficiency because examination results are a
measurable entity. In our case, we were interested in understanding the relationship between inputs
(e.g., student teacher ratio, number of computers per students and per teacher and school infrastructure)
and outputs (examination pass rates), hence mimicking a production function. This is referred to in the
literature as technical efficiency and describes the transformation of a mix of inputs into desirable
learning outcomes.
Second, efficient schools manage their human and financial resources well. This definition focuses on
the internal management of schools. We drew on case studies of selected schools for insights into the
challenges schools face in accessing and managing their resources efficiently. Schools make choices
(or choices are made for them by de facto) on what purchases or inputs to prioritize, who to recruit or
sometimes simply accept teachers assigned to them from national or district authorities, irrespective of
their competence. When there is a funding gap, schools may appeal to parents to fill this gap, others
may decide to restructure, e.g., combine classes or deploy resources away from activities that can impact on the quality of teaching and learning. All of these decisions have direct consequences on school
efficiency and outcomes.
Third, efficient schools can be defined as schools which produce good results (e.g. examination results)
for all students at costs that are affordable and sustainable. We were interested in whether secondary
schools in Malawi can achieve the same learning outcomes for all students at lower costs or, whether
some types of secondary schools are able to achieve higher learning outcomes at relatively lower costs.
Key Findings and Policy Recommendations
• It is striking that students who attend Conventional Secondary Schools (CSS) mostly in urban
areas live much closer to their schools which are often boarding schools, whereas students who
attend Community Day Secondary Schools (CDSS) live much further away and walk longer
distances to school. Boarding schools cost more and for the poor will be inaccessible. Future

ix
growth in access to secondary education in Malawi will have to come from expansion of access to
community day secondary schools, but these need more investment to improve their quality.
• Judging from the data, CDSS tend to be smaller schools. Urban schools enrol twice as many
students as schools in rural areas. Peri urban schools are of medium size. This presents challenges
for expansion of secondary education at affordable costs. For CSS in towns and cities, a policy
option would be to increase the ratio of day to boarding students since CSS students live much
closer to their schools compared to CDSS.
• The practice of offering remedial classes for underperforming students in private and CSS improves
their pass rates but not in the case of CDSS. The bigger impact of remedial classes is also correlated
with repetitions. CDSS provide greater access to poor households than CSS and need an injection
of resources to improve the quality of teaching and learning. Teaching in CDSS has to be made
attractive to attract the best teachers to improve learning outcomes.
• All schools rely on additional income - representing on average about 81% of total funding. Private
schools receive almost all their income from fees (about 95%), and although are considered low-
fee paying schools their costs would exclude students from the poorest background. But, they
provide relatively better quality than CDSS which cost much less to attend. If the quality of CDSS
improves at affordable costs they could compete with low-fee private schools for students and
provide choice for poor households. The reliance on school charges and PTA contributions can
create inequitable access to quality secondary education in Malawi. With over 80 percent of
students from disadvantaged backgrounds, relying on fees and income from households, CDSS in
particular are unlikely to have enough recurrent funds to run efficiently.
• The number of PCs connected to the internet, PCs for school management and PCs per student
across all school types is very low. Improving IT infrastructure and use in schools should be part
of a medium to long-term strategy to improve the quality of secondary education in Malawi. This
is because of its potential to enrich the quality of the learning experience. Although this study did
not investigate school curriculum issues directly, the eight case studies indicated schools were
concerned with accessing adequate textbooks and learning materials and improving basic
infrastructure. A 21st century secondary education has to include access to PCs and the internet.
This has to, at least, be part of a long-term vision. Inequitable access to computers can become
another tool for perpetuating inequitable access to quality secondary education. Access to ICT in
secondary schools interconnects with accessibility and connectivity to electricity. This may be the
biggest challenge to improving ICT in rural secondary schools in addition to other relevant elements
such as, finance, infrastructure, personnel and their training, software, and textbooks.
• The indications from the analysis of costs suggests that secondary schools in Malawi are not
sufficiently resourced to increase learning outcomes for most students. Pass rates are generally high
and easier to achieve for most schools. But for schools to improve their quality for all, i.e. increase pass rate with distinctions, then a better use of the combination of current inputs or increased inputs
will be required. We found that about 22 percent of schools (19 out of the 88) are further away
from the efficiency frontier when we base the learning output measure purely on pass rates, but on
pass rates with distinction, about 72 percent of schools fail to reach this efficiency frontier. Thus,
if we determine high quality of secondary education by the ability of schools to reach high pass
rates with distinction than currently is the case, then most secondary schools in Malawi would not
meet this mark.
• Schools with a low to moderate degree of wealth disadvantage are more efficient than those whose
proportion of disadvantage students is high. Technical efficiency levels in poorer schools are about
half the levels in more advantaged schools. This means students in rural schools are receiving
relatively poor quality secondary education. This adds to the importance of increasing investment
in secondary education in rural areas to improve equity in quality.

x
• Insights into the factors which make schools efficient in the Malawi context can be used by policy
makers to develop standards for improving quality. From our analysis the following are key,
ensuring (a) a higher proportion of qualified teachers compared to non-qualified teachers; (b) class
sizes are reduced and school management is improved; (c) all secondary school teachers,
irrespective of their location have good access to professional development; (d) schools and
stakeholders have good information on how well students are performing compared to other
schools; (e) expansion of access to secondary education goes with increased resources. Rapid
increases in student enrolment can have a negative knock on effect on efficiency if not accompanied
by increasing resources. (f) schools maintain a low wage to expenditure ratio. Moderate increases
in enrolment and accompanied by increased expenditure can ensure the quality of secondary
education is maintained.
• There needs to be a robust inspection and advisory system in place to ensure that all secondary
schools in Malawi meet minimum standards of practice considered appropriate, but also that they
have the capacity to maximise learning outcomes for all. Improving the quality and availability of
data from secondary schools will be useful in monitoring capacity and quality. It will also ensure
that new investment in secondary education is based on verifiable performance indicators.
• Parent Teacher Associations are contributing significantly to the cost of running secondary schools
in Malawi. Evidence from the case studies suggest that this can be a source of inequitable quality
in secondary education. Richer communities provide more and therefore add to the quality of
secondary schools serving in those communities. The policy of free secondary education has to
address the role of PTAs and ensure that schools in rural areas are not disadvantaged as a result of
PTA contributions filling in financing gaps in the implementation of the policy.
• Internal management of schools is crucial to running an efficient school. Ideally, an efficient school
is where the interaction between different stakeholders is cordial and mutually reinforcing so that
the teachers are happy to teach, parents are willing to send their children to school, and children
enjoy the learning process. What is clear from the case studies is the lack of transparent reportage
on efficiency through an effective governance system.
• The Malawi 2016 National Education Policy notes that governance and management of secondary
education is problematic because of understaffing, unavailability of laboratories, inadequate
funding, limited classroom capacity, lack of relevant and responsive curriculum and poor
management of resources (GoM 2016: 6). One of the policy objective is to improve the operations
and efficiency of the education system through good governance and management to deliver
education services efficiently and effectively. The policy strategy to achieve this is through
decentralized management of secondary schools; improved conditions of service for secondary
school teachers; improved regulatory framework on stakeholder participation in the delivery of
secondary education; increased funding levels to secondary education; strengthening capacity of secondary education governance and management at all levels; and finally, improvements in
accountability and transparency in running secondary schools in Malawi. These policies target the system, when as seen in this study, schools function face different financial and logistical
challenges.
• There are indirect political economy issues arising from the findings of the research. Creating a
secondary school system that works to improve quality for all will be achieved if only the ecosystem
factors that influence how schools are run receive policy attention. School governing boards must
have real power to manage schools and hold headteachers and teachers accountable. Training for
headteachers in the management of secondary schools also needs investment and policy attention
so headteachers are better able to offer quality leadership that can produce efficient and effective
secondary schools in Malawi. The incentive for secondary schools to operate more efficiently and
be held accountable for the resources they consume is lacking

xi
• What are the implications of the findings for providing ‘free’ secondary education in Malawi. First,
the country needs to ensure there is improved access for the poor at the primary level to make free
secondary education equitable. Second, if secondary education is made free for all irrespective of
whether a student attends a CDSS or CSS, this will make secondary education highly inequitable.
To approach more equitable access, the government should consider making all day attendance free
whilst at the same time increase resources to CDSS to raise quality. Households that wish to access
boarding secondary education are more likely to be able to afford it and therefore should not benefit
from ‘free’ secondary education. As our analysis shows, boarding CSS cost much more but also
have the capacity to generate additional income that CDSS cannot match. A combination of free
day schools and improved investment in community secondary schools will constitute a pro-poor
policy which is also more sustainable. In effect, a free secondary education policy should seek to
close the quality gap between CSS and CDSS. CSS in towns and cities may have more capacity to
increase enrolment than CDSS, and a mapping exercise could determine which can do so, and the
excess capacity used to increase enrolment of day students.
1
1. Introduction
1.1. Background to the Research
Secondary Education has recently received much attention by Sub-Saharan African (SSA) governments
in response to increased demand necessitated by the success of universal primary education in the last
15 years. The push to get many children into school was given a boost at the World Education Forum
in Dakar in 2000, and by 2015, although many countries were yet to achieve universal primary
education (UPE), enough progress had been made to exert pressure on access to secondary education
(UNESCO 2014).
Although access to secondary education in SSA has increased, it is still much lower than in the
developed world. Recent analysis of secondary school gross enrolment (GER) data show that the rates
in 1960 were only around 52-53% for the OECD countries and the Eastern European and Central Asian
countries but had reached 100% by 2010. In SSA, GER increased from a very low rate of only 3% in
1960, and reached 44% in 2010, which is close to the OECD average in 1960 (Glewee & Muralidharan
2015). Although participation in lower secondary has more than doubled, few complete and progress to
upper secondary. Low entry and completion rates at this level suggests that much more is needed to
make secondary schools more efficient and effective to improve access, completion and learning
outcomes.
The most recent analysis of data from SSA using data supplied to UIS (Lewin 2018 et al forthcoming)
shows that Low Income Countries (LICs) and Low Middle-Income Countries (LMICs) in SSA now
have similar average Gross Enrolment Rates (GERs) at primary level. These now average 102% and
103% respectively. However primary completion rates do differ and average 50% in LICs and 75% in
LMICs indicating that as many as half of children are not completing primary school on-schedule
successfully in LICs and for that reason alone will not enter secondary schools. At the same time 30%
of students in the primary school systems are overage in LICs and 21% in LMICs. Low completion
rates are correlated with over age enrolment and progression (Lewin and Akyeampong 2009). The
problem of over-age children failing to complete primary, or arriving at the transition to secondary two
or more years overage puts a cap on the possible expansion of secondary schooling.
GERs for the whole of secondary school in SSA average nearly 40% in LICs and 70% in LMICs. The
NER for Lower Secondary is 60% in LICs and about 80% in LMICs. The implication is that less than
half of children complete lower secondary and fewer do so on schedule with appropriate levels of
learning achievement. The largest gaps in school enrolment between rich and poor children are also at
secondary level in LICs. These gaps are much larger than those correlated with gender. LICs have far
fewer students at tertiary level with only 7% GER in LICs compared to 20% in LMICs. This creates a
constraint on the training of graduate level teachers for secondary schools.
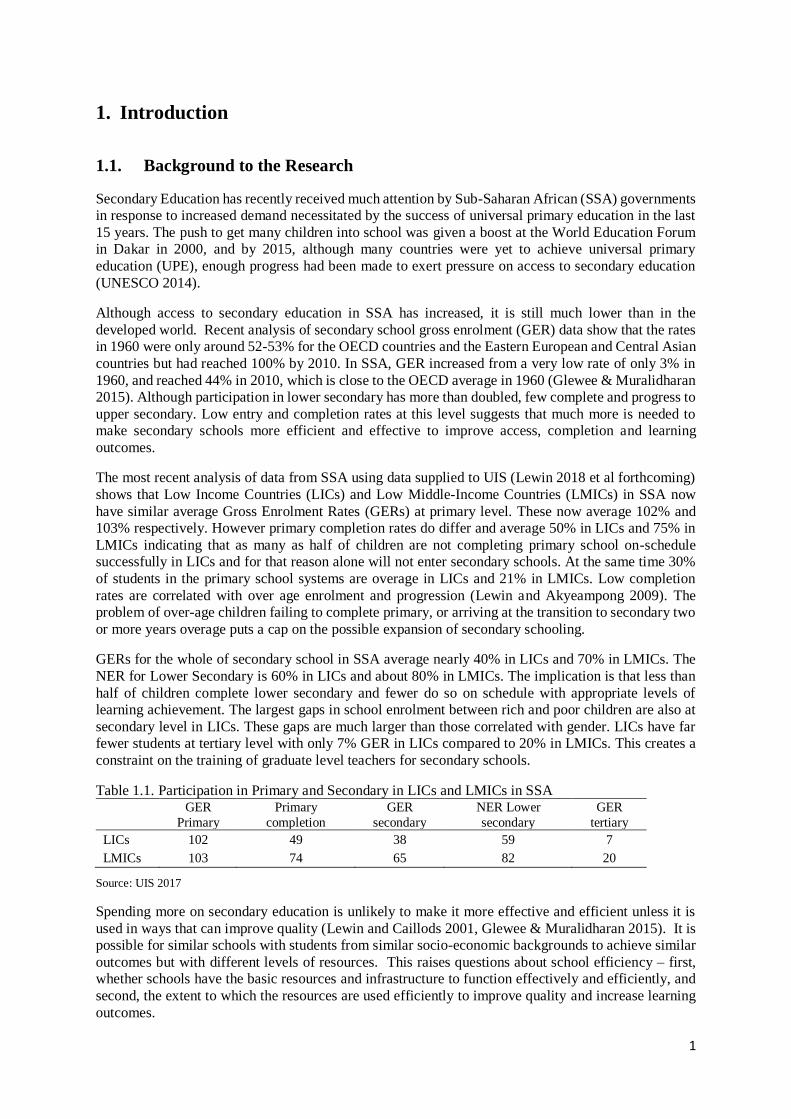
Table 1.1. Participation in Primary and Secondary in LICs and LMICs in SSA
GER
Primary
Primary
completion
GER
secondary
NER Lower
secondary
GER
tertiary
LICs 102 49 38 59 7
LMICs 103 74 65 82 20
Source: UIS 2017
Spending more on secondary education is unlikely to make it more effective and efficient unless it is
used in ways that can improve quality (Lewin and Caillods 2001, Glewee & Muralidharan 2015). It is
possible for similar schools with students from similar socio-economic backgrounds to achieve similar
outcomes but with different levels of resources. This raises questions about school efficiency – first, whether schools have the basic resources and infrastructure to function effectively and efficiently, and
second, the extent to which the resources are used efficiently to improve quality and increase learning
outcomes.

2
Putting in place robust school management systems can help to reduce the risk of financial
mismanagement, ensure that resources are utilised appropriately to improve learning outcomes. Also,
the ability of schools to make resource, teacher management and curriculum decisions that suit their
context and circumstances is important, as is their ability to attract and retain qualified teachers. How
schools optimise teacher workloads, utilise non-teaching staff, provide or support access to professional
development activities for teachers are important vectors for achieving quality secondary education.
There is a limited amount of research on secondary education in sub-Saharan African context on the
key factors that promote efficient and effective secondary schools. What there is includes IIEP studies
by Lewin and Caillods (2001), and the outputs from the World Bank’s Secondary Education in Africa
programme that includes analysis of costs and efficiency (Lewin 2008). Knowledge gaps remain with
the risk that African governments embarking on large scale reforms in secondary education may invest
in ways that fail to identify the components of the system and processes that drive efficient and effective
delivery of secondary education. As Grauwe & Varghese (2000) point out:
“reforms have very often targeted the provision of inputs in the system, rather than the processes of
teaching and decision-making schools, which are crucial in explaining differences in quality. Secondly,
many reforms in the past tried to focus on isolated components of the system, for instance, the teacher
or the textbook. However, improving the efficiency of individual components does not automatically
lead to improving an organization. Processes are contextual, and their improvement depends upon the
capacity of each school to become an effective and efficient organization. Thirdly, reforms (often are)
not adapted to the very varied needs of the individual schools, characterized as they were by a general,
system-wide strategy. Schools do not all function in the same way and reform strategies need to
recognize this”.
As Lewin (2015) notes “Conventional public-school systems provide few incentives to schools to use
teachers efficiently and timetable teaching to maximise the time on task of students. Absenteeism is
often not sanctioned appropriately, and terms and conditions of service may encourage casual leave and
unjustified sick leave and reduce teaching time. Over large lower grade classes and under size higher
grades in the same school are unlikely to be pedagogically efficient; they are certainly not equitable.
Managing schools is fundamentally about managing learning as much as managing teachers”. This
highlights the importance of formative assessment linked to intervention, reducing rather than
magnifying differences in achievement between groups of students, and monitoring and providing
incentives that improve teacher performance and productivity.
Thus, it is important to develop a holistic understanding of the inputs, processes and factors which can
work together to improve the quality of secondary education in African schools. Without a holistic
approach to improving efficiency of secondary education, reforms in the sector will not produce
equitable learning experiences that can lead to improved learning for all secondary school students.
1.2. Background to the contract
Innovation in Secondary Education (ISE) is among one of MasterCard Foundation’s (MF) initiative
within its Education and Learning Program. The ISE initiative seeks to encourage innovation to promote
equitable access and quality of secondary education, with a focus on the poor and disadvantaged. The
MF has committed a total of $35.5 million for twelve ISE projects in Cote d’Ivoire, Kenya, Malawi,
Rwanda, Senegal, Tanzania and Uganda. Of this amount, $22 million has been committed through The
Partnership to Strengthen Innovation in Secondary Education (PSIPSE). PSIPSE is a funder
collaborative that works to increase secondary education access and improve learning outcomes for
disadvantaged young people in developing countries. To achieve this goal gaps in the research on
secondary education in sub-Sahara Africa (SSA) needs to be addressed, particularly research that will
expand knowledge and understanding of secondary schools’ practices and processes in terms of
governance, staff recruitment and deployment, financial management, human resource distribution and
utilization with a view to identifying and generating greater efficiencies through improved processes.

3
The TOR for this research outlined the following objectives for the investigation into the efficiency and
effectiveness of secondary education in SSA:
1. Review and document evidence, background literature and policies on school efficiency in the
secondary education context,
2. Develop a theoretical framework to structure evidence and approaches to improving school level
efficiency
3. Assess how secondary schools are governed, managed, resourced, monitored and how resources
are allocated and utilized against a benchmark or a framework,
4. Identify opportunities to increase the efficiency of secondary schools through implementation of
local solutions and actionable interventions, and
5. Recommend contextually relevant and innovative school efficiency measures to empower schools
to sustainably finance, effectively govern, and improve the quality of secondary education.
Objectives 1 and 2 are addressed in the inception report and used to frame the research design and
analysis in this report.
1.3. Structure of the report
The report has six sections. In the Section 2, we include a description of the Malawian secondary school
system and in Section 3 we outline the design of the research (i.e. research questions and sampling
framework). Section 4 includes a discussion on definitions of efficiency and how they have been applied
in this study. Section 5 contains the empirical results and in Section 6 we offer some concluding
remarks. Section 7 contains some policy implications. In the technical Appendix 1 we present the
definitions and conceptualisation of efficiency applied in this study and explain the technique employed
to measure efficiency, that is, Data Envelopment Analysis (DEA) in more detail. In Appendix 2 we
include Malawi’s questionnaire which was used to collect data for the analysis in this country report.
In the empirical analysis (Section 5), the presentation of results is carried out in three steps. Firstly, we
employ raw measures / summary statistics to understand differences in resources, organisation, training,
policies etc. between school types and by school location which may be linked to efficiency. Secondly,
we present some preliminary analysis on cost and equity and their relationship to efficiency. Thirdly,
we carry out an efficiency analysis (DEA) to examine the profile of efficiency of secondary schools in
Malawi, based on achievement data (exit examination results) and flows (completion rates) as well as
by relating the ranking of efficiency to overall schools’ and teachers’ characteristics. This allows us to
identify the profile of efficient secondary schools.

4
2. Secondary Education in Malawi
2.1. A Review of National Policies
This section gives a brief history of national policy on secondary schooling in Malawi. It reviews policy
documents that have shaped the development of secondary education since democratisation in 1994.
The beginning of education planning in Malawi dates to its independence in 1964, when the
Government of Malawi contacted the American Council of Education to conduct a survey on, among
others, Malawi’s education needs for social and economic progress, and thereafter, submit plans for
attaining key targets in education. The survey, which assessed all levels of formal education, influenced
the development of Malawi from 1964 until 1972 and subsequent planning exercises up to 1994
(Government of Malawi, 2008).
2.1.1. The First Education Plan (1973)
The first education plan in Malawi was a product of the Johnson (1964) report which, among other
things, recommended an expansion of secondary education. Policy in newly independent Malawi linked
education, particularly at post-primary level, to the demands of the labour market rather than population
growth (Chimombo et al, 2014). The First Education Plan was therefore very cautious in advocating a
rapid increase in post primary education because of its concern that this would lead to a fall in standards
(Government of Malawi 1973:53). It is a concern that has continued to influence current policies on
secondary education in Malawi (Chimombo et al, 2014). After a decision was made to liberalise the
secondary education sector in 1994 to allow more private participation, complaints continued about the
impact of this liberalization policy on the quality of secondary education. Initially, expansion was
largely absorbed through growth in the then Malawi College of Distance Education (MCDE). MCDE
is a department under the Ministry of Education responsible for provision of education and training
through open and distance learning methods. This First Education plan was not considered a success
because of perceived flaws in how it was to be implemented, such as a lack of an evaluation plan,
specific implementation budget and poor management (Mwale 1998: xv).
2.1.2. The Second Education Plan (EDPII 1985-95)
The second education plan (EDPII) incorporated all levels of formal education as well as various
parastatal organizations associated with the Ministry of Education, Science and Technology at that time.
It also aimed to achieve a proper balance in the levels of physical and human resources allocated to all
levels of the education system. Although it incorporated all levels of formal education as well as various
parastatal organizations associated with the Ministry of Education, Science and Technology
(Government of Malawi, 2008), Chimombo et al (2014) argue that this plan began to shift the emphasis
away from postsecondary education in favour of primary education. It sought to improve access, quality
and efficiency, particularly at the primary level. EDPII set the target of achieving primary NER of 85%
by 1995, through a gradual phasing out of school fees. By 1993/94, the GER was estimated at 70%. At
the secondary level, the aim of the EDPII was to keep secondary school education opportunities geared
to serving economic development rather than expand rapidly in response to demand (Republic of
Malawi, 1985:5). The second education plan faced the same problem as the first plan – the lack of
comprehensive financial resources to implement the plan. Additionally, a shortage of teachers and
learning materials, high dropout and repetition rates meant achieving an effective and efficient
education system became difficult under the plan (Mwale and Chimombo, 1994).
2.1.3. The Free Primary Education Policy (FPE) 1994
The government of Malawi introduced a school fee waiver scheme during the second half of the EDPII period. However, the new democratic regime that came into power in 1994 decided to make primary
education free by abolishing tuition fees, school fund/extra fees and textbook contribution. In some

5
cases, especially in urban areas, this also meant the abolition of other fees such as telephone and water
fees. A uniform no longer became a requirement for attending school (Ministry of Education, MOE,
1996). As noted by Mwale and Chimombo (1994), the policy also contemplated the introduction of
community secondary schools to expand secondary education. Although primary schools in Malawi
had been categorized into (a) assisted (those under the responsibility of local education authorities at
the district level) and, (b) unassisted schools (those established by local communities), under the PE
policy the central government assumed the responsibility of financing these schools (Ministry of
Education, MOE, 1995).
2.1.4. Policy and Investment Framework (PIF) (1995)
Unlike the first two education plans which lacked clear budget allocation as an integral part of
implementation plans, the sector-wide Policy and Investment Framework (PIF) for education in 1995
emphasised the financial arrangements for expanded access to education. The PIF included a specific
aim of supporting the provision of non-government secondary schools to complement public provision.
The PIF envisaged that 10% of primary and 25% of secondary students would be educated by non-
government providers by 2012. However, Lewin and Sayed (2005:73) in an assessment identified gaps
in the PIF, largely in terms of frameworks to develop, support, regulate, monitor and evaluate non-
government providers. A review of the initial PIF revealed that it was not based on thorough and
comprehensive data and analyses (Kirby et al. 1998). A second PIF was developed for the period 2000-
2012. A key objective was that selection into secondary education would be based on the principle of
local catchment area, in pursuance of the goal of creating a national day secondary school system. The
government was to withdraw funding of boarding secondary education, and instead parents were to bear
the full costs. It also indicated that parents would be encouraged to invest in the education of their
children by providing approximately 50% of the cost, with government progressively giving schools
greater autonomy and accountability in the utilization of their school finances as a way of increasing
school effectiveness and higher academic achievement.
2.1.5. The introduction of CDSS (1999)
In January 1999, the Ministry of Education directed that District Education Centres (DECs) were to be
converted into Community Day Secondary Schools (CDSSs). As the forthcoming analysis and other
studies (Chimombo et al, 2014; Gwede 2004) demonstrate, CDSSs are perceived to be of lower status
compared to other secondary schools partly because they lack qualified teachers, libraries and
laboratories and have poor infrastructure. Besides, many CDSSs lack teaching and learning materials
to promote effective teaching (Mac Jessie-Mbewe, 2004). Although the aim of turning DECs into
community secondary schools was to improve access to quality secondary education, the poor and
uneven implementation of the policy meant that CDSSs did not match the quality of conventional
secondary schools (Chinseu-Moyo, 2007).
2.1.6. The National Education Sector Plan (NESP) (2008-17)
In 2008, Malawi developed a National Education Sector Plan (NESP) for a ten-year period (2008-2017)
and which drew on the first and second education development plans, the PIF and the Long-term
Development Perspective for Malawi (Vision 2020). The goals and objectives focused on achieving
equitable access to education, improved quality and relevant education, and improved governance and
management.
The NESP projected rapid increases in enrolment (50% increase from 2007 to 2012, and 130% increase
from 2007 to 2017) in secondary schooling. This was to be achieved through a 30% increase in
enrolment in Government-supported schools in 2012 to an increase of 90% in 2017, an increase in
enrolment in Open Schools from nearly 7,000 in 2007 to 19,000 in 2012 and 34,000 in 2017 and
increases in private enrolment of 90% by 2012 and 230% by 2017 (NESP 2008:17). These were very

6
ambitious goals and raises questions about financing and sustainability of expansion of secondary
education in Malawi.
2.1.7. The National Education Policy (2013 and 2016)
The NEP outlines the education sector’s priorities and defines the country’s education policies. One of
its objectives was to improve the operations and efficiency of the education system through good
governance and management to deliver education services efficiently and effectively.The policy
acknowledged that the CDSSs had the largest proportion of students attending secondary school and
yet are poorly resourced in terms of qualified teachers, teaching and learning materials, and basic
infrastructure. It notes that governance and management of secondary education faces challenges
because of understaffing, unavailability of laboratories, inadequate funding, limited classroom capacity,
lack of relevant and responsive curriculum and poor management of resources.
2.1.8. Summary
In summary, education policy and planning in Malawi has put more emphasis on expansion of primary
education with minor reforms to the secondary education sub-sector. The introduction of community
day secondary schools (CDSS) was to make secondary education more accessible. The intention to
withdraw government funding of boarding secondary education and instead plough resources into day
secondary schools could be an attempt to make secondary education in Malawi more equitable. But,
policy to expand access to secondary education has not focused sufficient attention on the issue of costs
to the poorest households. So what are the costs and what is the affordablity judgement
The decision to give secondary schools greater autonomy in how they utilise their finances would give
schools control over their finances to improve efficiency and increase effectiveness. It will also depend
on the training secondary school heads get in the efficient management of their resources to improve
quality and efficiency.
The introduction of CDSSs is clearly an attempt to decentralize provision of secondary education, but
there is little indication from policy documents of how resources should be decentralized to provide
efficient and effective delivery of secondary education. Also, the invitation to the private sector to
become partners in providing secondary education does not include clear guidelines on how this would
ensure the costs to households are not beyond the amounts poor households can afford, especially where
they serve disadvantaged areas.
Key to achieving a more equitable and efficient secondary school system is the availability and effective
utilization of qualified teachers and infrastructure and the management of costs to households .
Although, recent education policy in Malawi has articulated a vision of expansion underpinned by
ambitious growth targets (e.g. a 130% increase in secondary school enrolment from 2007 to 2017) what
happened by 2017, a comprehensive analysis of the capacity of secondary schools in the public and
private sectors to manage equitable expansion based on analysis of school efficiency is lacking.
2.2. Typology of Secondary Schools in Malawi
The legal framework of education in Malawi was for a long time based on its 1962 Education Act, until
a new Education Act was enacted in 2013. Malawi’s constitution defines the nation’s educational
objectives and regulates responsibilities for education among three key players—the state, religious
groups and the private sector. Religious groups control about 60% of primary schools and many
secondary schools. About 25% of secondary schools are Conventional Secondary Schools (CSS), 49%
are Community Day Secondary Schools (CDSS). These schools are all under government control.
About 25% of secondary schools are privately owned with less than 1% registered as Open Day
Secondary Schools (ODSS).

7
Government and private schools fall into 4 types: Conventional Secondary Schools (CSS), Community
Day Secondary Schools (CDSS), Open Day Secondary Schools (ODSS) and Private Secondary Schools
secondary. CDSS are the least expensive charging the lowest school fees and are the least selective of
the government secondary schools. They also enroll most secondary school students in Malawi. Many
CDSS operate with very high student teacher ratios, have few qualified teachers and lack instructional
resources as reflected by the profile of the case studies (see table 3 appendix 1). Many CDSS teachers
are former primary school teachers and therefore lack the official qualification to teach at the secondary
school level. Conventional Secondary Schools (CSS) are the old core government secondary schools.
They are more selective and expensive than the CDSS. Among the CSS are a smaller group of schools
known as “national secondary schools”. They provide the highest quality of secondary education, and
often are well-established boarding schools. Most, started as mission or religious schools. Another
group of CSSs serve students within a district and select students mostly from local nearby
communities. These schools operate as day secondary schools. There are also the ‘Open Day Secondary
School’ (ODSS) which operate in parallel with the CDSS or CSSs. Using SCSS or CSS existing
structures, ODSS mostly recruit teachers from CSSs to teach part-time and are paid by hour. ODSS
can be described as ‘shadow’ secondary schools and often are not transparent in disclosing the number of students they enroll (Chimombo et. al., 2014).
Private secondary schools, owned by private entrepreneurs can be categorised by the level of fees they
charge. The low-fee paying schools are described as ‘dwelling house schools’ established in or adjacent
to proprietors’ homes. They tend to be small, have unstable enrolments, have most of their teachers on
informal contracts and have very limited resources (Chimombo et al 2014). Their numbers have
reduced drastically following a crackdown in 2009. A study of private secondary schools found that
although private schools play an important role by supplementing government efforts to provide
secondary education, they are very unevenly distributed geographically, with the majority serving the
educational needs of the richest households in Malawi (Chimombo et al 2014). The lowest fee private
secondary schools remain unaffordable for the poorest households and have their enrolments declining.
The governance of private schools varies greatly, with most of these schools accountable only to their
owners. Teaching staff are often poorly qualified, staff turnover is high, and many are on informal
employment contracts. Learning materials and furniture in most of these low fee private schools do not
meet minimum standards (Chimombo et al 2014).
Table 2.1 below shows the different types and ownership of secondary schools in Malawi.
Table 1.1. Typology of secondary schools in Malawi
The 2018 NESP-ESIP Review report produced a typology of categorization of secondary schools in
Malawi (Table 2.2 below). It reveals the sharp differences in the types of secondary schools in Malawi
and the implications for improving quality across the different provisions.
School
Type
CSS CDSS Grant
Aided
International
private
Established
Private
Mission
Private
Dwelling
House
Funding State ✓ ✓ ✓
Non-
state
✓ ✓ ✓ ✓ ✓ ✓ ✓
Ownership State ✓ ✓
Non-state
✓ ✓ ✓ ✓ ✓
Regulation State ✓ ✓ ✓ ✓ ✓ ✓
Non-
state
✓ ✓ ✓ ✓

8
Table 2.2. Defining Characteristics of Secondary Schools in Malawi
Type Defining characteristics
National • Fully government owned, funded and run schools;
• Top scoring students selected there. Enroll best students from across the
nation;
• Known for producing best grades at MSCE;
• All students are boarders;
• Best equipped with teaching and learning materials, laboratories and
libraries;
• Well-trained and experienced teachers;
• 4 such schools; 0.2% of all secondary schools;
• GPI = .7;
Have PTAs.
Grant-aided • Owned by religious organizations;
• Government selects 60% of the students and remaining 40% by the
proprietor;
• Majority of teachers paid by government;
• Proprietor decides on and retains fees;
• Tax free;
• All have boarding facilities;
• Well- equipped with teaching and learning materials, laboratories and
libraries;
• Well trained and experienced teachers;
• 2.3% of all secondary school students;
• 21 such schools; 1.3% of all secondary schools;
Have PTAs.
District boarding • Carries the name of the District;
• Enrolls students from within the district;
• Fully funded by government;
• Fairly good teaching and learning materials;
• Boarding facilities;
• Enroll 100:50, boys-girls;
• 45 such schools; 2.7% of all secondary schools;
• 1.3% of all secondary school students;
Have PTAs.
City Day • Located in cities;
• Enroll students from within the city catchment area;
• Fully funded by government;
• Fairly good teaching and learning materials;
• Enroll 50:50, boys-girls;
• 1% of all secondary school students;
• 13 such schools; 0.8% of all secondary schools;
Have PTAs.
District Day • Enroll students from within the district catchment area;
• Fully funded by government;
• Fairly good teaching and learning materials;
• Enroll 50:50, boys-girls;
• 48 such schools; 2.9% of all secondary schools;
Have PTAs.
Community Day • There are approved and non-approved schools.
• Approved:
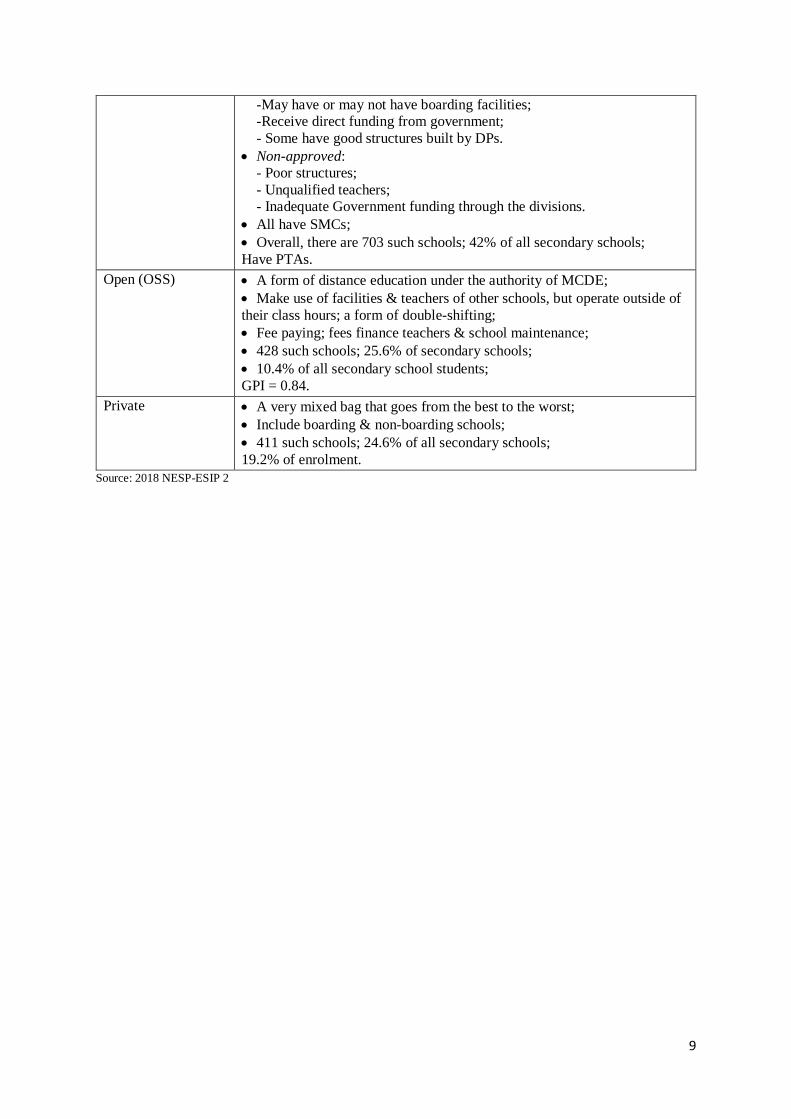
9
-May have or may not have boarding facilities;
-Receive direct funding from government;
- Some have good structures built by DPs.
• Non-approved:
- Poor structures;
- Unqualified teachers;
- Inadequate Government funding through the divisions.
• All have SMCs;
• Overall, there are 703 such schools; 42% of all secondary schools;
Have PTAs.
Open (OSS) • A form of distance education under the authority of MCDE;
• Make use of facilities & teachers of other schools, but operate outside of
their class hours; a form of double-shifting;
• Fee paying; fees finance teachers & school maintenance;
• 428 such schools; 25.6% of secondary schools;
• 10.4% of all secondary school students;
GPI = 0.84.
Private • A very mixed bag that goes from the best to the worst;
• Include boarding & non-boarding schools;
• 411 such schools; 24.6% of all secondary schools;
19.2% of enrolment.
Source: 2018 NESP-ESIP 2

10
3. Design of the research
3.1. Research questions
The research was designed to answer the following questions:
1. What are the key determinants of efficiency of secondary schools in Malawi?
2. How does school level efficiency vary across different types of secondary schools?
3. Which group of school factors (e.g., school management, professional development, education
approaches, etc.), are associated with efficiency?
4. How does cost per student vary by school type?
5. How does the quality of teachers, student-teacher ratios, basic infrastructure and technology impact
on learning outcomes?
6. How does teaching staff to student ratio; teaching staff to non-teaching staff and utilisation of
resources and teaching space compare across schools?
7. How does management and governance of secondary schools’ impact on their efficiency and
effectiveness?
Based on insights from the research we address three further questions on the implications of the
findings
• What are the opportunities to increase the efficiency of secondary schools in Malawi?
• What actionable local solutions can be generated and implemented to improve the efficiency of
schools in Malawi?
• What are the incentives that would motivate stakeholders to value efficiency in each country?
3.2. Design process
The research was carried out in two stages. First, we carried out a survey of different types of secondary
schools to develop an understanding of the key factors that determine school efficiency and quality.
From the analysis of the large-scale survey, we purposively selected eight (8) secondary schools for in-
depth qualitative analysis. The survey produced data for estimating school efficiency for different types
or sizes of secondary schools. Our main output measure was final examination grades from which we
obtained a school’s pass rates and pass rates with distinction. For an estimation of inputs, we used the
following data: teacher numbers, student-teacher ratio, class sizes, teacher quality
(qualified/unqualified), and other infrastructure and material resources in schools (see Appendix 1). The
questionnaire had 52 questions (and several sub options). It was not possible to include the capabilities
of students on entry as an input measure. This is a limitation as some secondary school have selective
entry policies that would subsequently affect examination performance.
We decided to use a specially designed Application (APP) pre-loaded on tablets for country research
teams to use to administer the survey questionnaire. Data was loaded on to a server which the Sussex
team accessed for analysis (Figure 3.1). We had two types of data sent for analysis through the server:
(i) one capturing information on the array of school background characteristics linked to efficiency
(with the school as the unit of observation), (ii) a unique dataset for each school on teacher qualification,
experience, and salary (here the unit of observations is the teacher within the given school).1
1 This second dataset (which was merged to the main school dataset) is captured by question 20. For details, see Appendix 2
which includes an exemplary questionnaire.
11
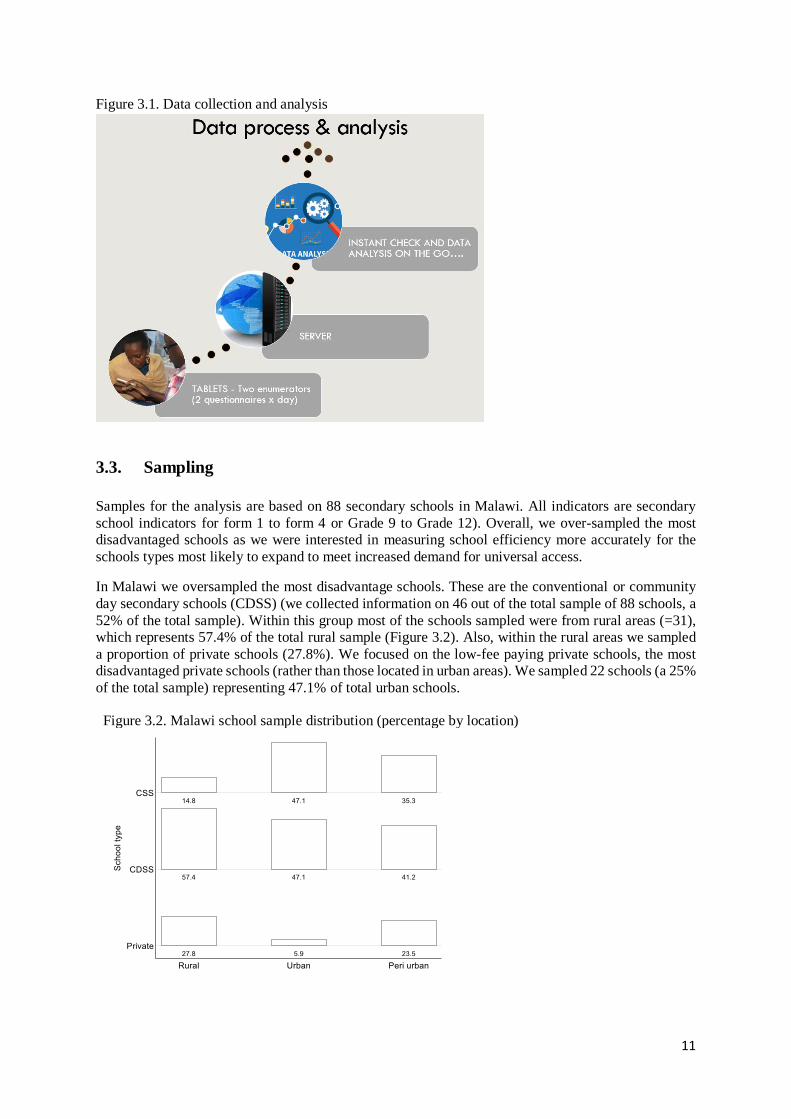
Figure 3.1. Data collection and analysis
3.3. Sampling
Samples for the analysis are based on 88 secondary schools in Malawi. All indicators are secondary
school indicators for form 1 to form 4 or Grade 9 to Grade 12). Overall, we over-sampled the most
disadvantaged schools as we were interested in measuring school efficiency more accurately for the
schools types most likely to expand to meet increased demand for universal access.
In Malawi we oversampled the most disadvantage schools. These are the conventional or community
day secondary schools (CDSS) (we collected information on 46 out of the total sample of 88 schools, a
52% of the total sample). Within this group most of the schools sampled were from rural areas (=31),
which represents 57.4% of the total rural sample (Figure 3.2). Also, within the rural areas we sampled
a proportion of private schools (27.8%). We focused on the low-fee paying private schools, the most
disadvantaged private schools (rather than those located in urban areas). We sampled 22 schools (a 25%
of the total sample) representing 47.1% of total urban schools.
Figure 3.2. Malawi school sample distribution (percentage by location)

12
4. Defining School Efficiency and Framework
Determining how efficient education can be provided has been a challenge for both researchers and
policy makers. Schools can be seen as organisations which produce a mix of outputs from various
inputs. We would expect that efficient use of resources would lead to outputs at the lowest level of
resources. In addition we would expect that effective use of resources will ensure a mix of outcomes
desired by parents and society.
In this study we have defined and applied school efficiency in three ways.
1. First, efficient schools produce good learning outcomes, measured in terms of examination results
with key inputs. This definition makes it easy to quantify efficiency because examination results
are a measurable entity. In our case, we were interested in understanding the relationship between
inputs (e.g., student teacher ratio, number of computers per students and per teacher and school
infrastructure) and outputs (examination pass rates), hence mimicking a production function. This
is referred to in the literature as technical efficiency and describes the transformation of a mix of
inputs into desirable learning outcomes.
2. Second, efficient schools manage their human and financial resources well. This definition focuses
on the internal management of schools. We drew on case studies of selected schools for insights
into the challenges schools face in accessing and managing their resources efficiently. Schools
make choices (or choices are made for them by de facto) on what purchases or inputs to prioritize,
who to recruit or sometimes simply accept teachers assigned to them from national or district
authorities, irrespective of their competence. When there is a funding gap, schools may have to
appeal to parents to fill this gap, others may decide, in the face of limited finances, to restructure,
e.g., combine classes or deploy resources away from activities that can impact on the quality of
teaching and learning. All of these decisions have direct consequences on school efficiency and
outcomes.
3. Third, efficient schools can be defined as schools which produce good results (e.g. examination
results) for all students at costs that are affordable and sustainable. We were interested in whether
secondary schools in Uganda can achieve the same learning outcomes for all students at lower costs
or, whether some types of secondary schools are able to achieve higher learning outcomes at
relatively lower costs.
These definitions suggest a focus on outcomes, internal management, costs and equity in an analysis of
school efficiency.
Closely related to the concept of technical and cost efficiency is the idea of student flows through the
grades. Lower flows, for example, caused by repetition or selection policy could be an indication of
inefficiency in progressing all students through to successful completion. This is also an equity issue −
do schools select students from backgrounds that maximises their chances of achieving good examination results and successful completion? In more selective schools, technical efficiency would
be higher if higher student learning outcomes are driven by the higher socio-economic background of
students. Thus, we were interested in whether more efficient schools are also more likely to operate
selection policy where only the most able progress to the end of the secondary cycle to take the final
exams, and the least able either dropout or repeat their grade.
A summary of the different aspects of efficiency is shown in Figure 4.1. The intersection between
technical efficiency (TE) and cost efficiency (CE) shows schools that are able to maximise outputs for
a given set of inputs, and at affordable costs. Schools which lie outside both TE and CE circles are
highly inefficient. Schools can be technically efficient but achieve this at high costs, or they may be CE but not TE.

13
Figure 4.1. Technical and cost efficiency and equity
From the survey data we used a benchmark of technical efficiency based on an aggregation of inputs
across all the schools in each country to construct an ideal model of schools of different sizes which we
then compared with actual schools. The benchmark of technical efficiency is an index showing efficient
schools that are able to maximise educational outputs. Where different schools lie in relation to this
benchmark is then used to assess their level of technical efficiency. Examination passes and passes with
distinction are used as proxy measures of learning outcomes. Finally, we applied Data Envelopment
Analysis (DEA), a statiscal technique to distinguish between efficient and inefficient schools. For
details of the technique, see Appendix 1.
Inefficient
schools
Technical
efficiency
(TE)
Cost
efficiency
(CE)
TE + CE
Equity
Efficient schools

14
5. School Efficiency in Malawi
5.1. Summary Statistics
The sections below contain Malawi’s empirical findings. Across these sections, the emphasis is on key
differences by school type and location, and by estimated efficiency and characteristics of the top-
efficient and low-efficient Malawian’s schools.2
5.1.1. Schools’ background characteristics
Tables 5.1 and 5.2 has information on the Malawi sample. Out of the 88 schools sampled, 46 (52%) are
CDSS schools (Table 5.1), and 54 schools are from rural areas (which represents a 61% of the total
sample -Table 5.2). Combining school type and location, most of the schools sampled are rural CDSS
(35%) and rural private schools (17%).
Table 5.1. Distribution of school sampled by type (Malawi)
school type Number of schools Percentage
CSS 22 25
CDSS 46 52.27
Private 20 22.73
Table 5.2. Distribution of schools by school type and location (Malawi)
School type Rural Urban Peri urban
CSS 8 8 6
CDSS 31 8 7
Private 15 1 4
Total 54 17 17
Notes: (1) Rural schools are from rural areas; urban schools are from town and cities; peri-urban schools are from small town
are peri-urban areas.
Table 5.3 shows that students from CSS schools live near their schools although most of these schools
are boarding schools, whereas about 60% of students from Community Day Secondary Schools (CDSS)
live more than 3 kms from schools. Nearly a third of private school students also live more than 3 kms
away from their schools (32.9%). CDSS serve a more dispersed demand from rural areas, and perhaps
explains why a sizeable proportion walk more than 3 km to reach their school.
Table 5.3. Distance from schools (Malawi)
Average distance from residence to school Proportion of students walking
more than 3 km
0-1 km 1-3 km more than 3 km
CSS 83.5 7.5 9.0 4.7
CDSS 17.2 22.8 58.5 44.1
Private 58.2 9.0 32.9 27.1
Total 43.1 15.8 40.2 29.7
CSS enrol more students than other schools (Table 5.4), CDSS tend to be smaller schools. Urban schools
enrol twice as many students as schools in rural areas. Peri urban schools are of medium size.
2 Recall that the summary statistics’ sub-sections follow the structure of the five parts of the questionnaire (see Appendix 2).

15
Table 5.4. Mean school enrolment by type and location (Malawi)
Mean Standard deviation
School type CSS 568 364
CDSS 350 208
Private 404 229
School location Rural 328 164
Urban 672 388
Peri urban 444 257
5.1.2. School Practices
Offering remedial classes for underperforming students in private and CSS schools raises pass rates by
15% and 9%, respectively, but not in the case of CDSS (Figure 5.1, first plot). The bigger impact of
remedial classes is also correlated with repetitions – a widespread phenomenon in the last grade of
private schools. There appears to be a relationship between grouping students according to their
performance and the distinctions a school achieves, but only for CSS and CDSS schools. Ability
grouping in private schools appears to be related to lower pass rates with distinction, which suggests
that it does not make a difference to performance. (Figure 5.1, second plot). Pass rates with distinctions
increase hugely by 55% in CSS and double from 10% to 21% in CDSS.
Figure 5.1. Remedial classes, ability grouping and passing rates (Malawi)
5.1.3. School Finances
All schools rely on additional income (representing on average about 81% of total funding).
Government school teachers receive salaries from central funds. Private schools receive almost all their
income from fees (about 95%). In CDSS and CSS fees income are nearly 77% and 79% respectively
(Table 5.5). This has implications on financial planning since about 20% of total income for these two
types of government schools are from an unstable source (school charges and PTA contributions). Since
over 80% of students from disadvantaged backgrounds (Table 5.6), relying on fees and income from
resource-constrained households is likely to put constraints on the ability of schools to run efficiently.

16
Table 5.5. Source of funding by school type (Malawi)
School funding
school type school fees other charges PTA contributions
CSS 78.8 14.9 6.3
CDSS 76.5 10.0 12.9
Private 94.7 2.2 3.0
Total 81.1 9.5 9.0
Notes: (1) A t-tests for the portion of non-fess funding comparing CSS and CDSS against private schools is statistically
significant (p-value =0.004). For CSS and CDSS means for this non-fee funding are equal (p-value = 0.794).
Table 5.6. Proportion of socioeconomically disadvantaged students by school type (Malawi)
degree of
disadvantage CSS CDSS Private Total
low n 4 6 5 15
% 18.18 13.04 25 17.05
medium n 12 18 11 41
% 54.55 39.13 55 46.59
high n 6 22 4 32
% 27.27 47.83 20 36.36
Notes: (1) The degree of disadvantage is measured by the proportion of students who comes from socioeconomic
disadvantaged homes. (2) The degree of disadvantaged is low if between 1-33% comes from socioeconomic disadvantaged
homes, medium if the proportion is between 34%-66% and high if it is above 66%.
We explored the impact of school finances through case studies of eight (8) secondary schools. The
data revealed variations across the case study schools. Overall and unsurprisingly, CSSs are relatively
well resourced in terms of human resource, finance and infrastructure. This was more evident at Oyera
CSS where, unlike other schools, which pay a proportion of school fees into a special government
account, Oyera uses all its fee income to pay bills, provide monetary incentives to teachers and purchase
additional learning materials. At the start of the 2017/18 academic year, the school had spent about
$9000 to purchase textbooks to meet the requirements of a new curriculum. According to the head
teacher, some community day secondary schools borrow materials from their school.
Table 5.7 shows that the two CSSs, Oyera and Buluzi, generate more income than other schools through
hiring their facilities and premises during school holiday breaks. This was not the case in nearly all the
other CDSSs where hiring of premises fetched a small income. Based on estimates provided by the case
study schools, school fees at Oyera CSS comes to about $390 per student per year. The school makes
an extra $20,000- $27,000 a year by hiring its premises to the national examinations board to organise
national examinations. This has become a regular source of extra income.
Buluzi CSS also generates additional income to pay its teachers teaching allowance and to buy
textbooks. Students pay about $200 a year as fees and the school is able to generate an additional $6900
each term from hiring its premises to a privat company. With a student population of 700, its fee income
is about $140,000 a year. In contrast, students in rural Zaone CSS pay about $23 a year as school fees
earning the school about $5,267 from an enrolment of 229 students. Its other source of income is from
hiring out classrooms for events organised by local communities and which earns the school $750 a
year. These cases indicates the level of financial inequity across different types of schools and shows
that schools in rural areas may be particularly disadvantaged.
Community Day Secondary Schools (CDSS) have some of the lowest resources. Ndaona CDSS is
secondary school with a student population of 210 charging about $23 school fees per student per year.
The school earns on average $7 for every classroom it rents out for local community activities.

17
Table 5.7. Case study schools’ school fees, enrollment and other sources of income (Malawi) Oyera
CSS
Buluzi
CSS
Zaone
CSS
Nsonga
CDSS
Moni
CDSS
Ndaona
CDSS
Makhi
Private
Njinga
Private
Fees/Term K95,000
$130
K50,000
$70
K5,000
$7
K7,500
$10
K6,000
$8
K5,750
$8
K125,000
$172
K35,000
$50-Day
K135,000
$175
Boarder
Day/Board Boarding Boarding Day Day Boarding Day Boarding Both
Fees/Year $390 $210 $21 $30 $24 $21 $516 Day - $150
Boarding -
$525
Enrollment 529 700 239 304 318 210 619 570
Internally
generated
funds
-PTA
contributes
K10,000
($14)/term
PTA
Contributes
K5000
($7)/term
K15m-
K20m/year
from hiring
school
premises
K4.5m/year
from hiring
school
premises
-School hall
hired at
K30,000 for
weddings
and other
community
activities
Classroom
s hired by
the
communit
y
Classroom
s hired out
to
churches,
clinics for
under 5 etc.
Premises
not hired
Classroom
s hired by
communit
ies at
K5,000
per event
Premises
not hired
Premises not
hired
Income
distribution
Fees: 85%
Other:10%
Donations:
5%
Fees: 71%
Other:25%
Donations:
4%
Fees:
85%
Other:10
%
Donation
s: 5%
Fees: 75%
Other:10%
Donations:
15%
Fees:
69%
Other:10
%
Donation
s: 21%
Fees:
90%
Other:10
%
Fees:
100%
Fees: 100%
Out of the low fees income these schools make some of it is transferred into a general purpose
government account at the district or into a school development fund. For example, students at Zaone
CDSS – a day school, pay $21 school fees per year, from which 69 cents is transferred into a general
purpose government account, and $5.5 into a school development fund. Students pay an extra 34 cents
into a textbook revolving fund each year. Similarly, students at Nsonga, Moni and Ndaona contribute
about 34 cents towards a textbook revolving fund, and 69 cents per student is transferred into a
government account; another 69 cents per student towards a general purpose fund, and about $5 is paid
into a school development fund. This is highly regressive financing of secondary education, but also
shows that household are making a significant contribution to secondary education, even in schools
which charge low fees. As table 5.7 shows only Oyera and Buluzi (both CSSs) are able to generate
additional income from PTA contributions. Private schools rely solely on fees income which are much
higher than fees charged in government CSS and CDSS schools. The three case study CDSSs
complained that the fee income was insufficient for running their schools, leaving very little to invest
in teaching and learning. As one school bursar explained:
From the little fees we receive, we must also buy small school items like brooms, sports attire, sanitation equipment. We pay hired labor like security guard, assistant librarian. We don’t
have enough funds, we have problem procuring teaching materials. Even the teachers are
failing to have flip charts, seal tape for teaching.

18
Generally, CDSS are cash-strapped. From the $70 students pay each year at Buluzi CSS, about 34 cents
of this amount is paid into a government account. The bulk is used to feed students (about $54 per
student – amounting to 75%. About $14.50 is spent on maintenance, cleaning and purchasing learning
materials. Households also contribute about $7 per year for the construction of a girls’ hostel. Even with
all the extra expenditure, Buluzi has more to spend than the other CDSSs.
There are also differences in the funds allocated to schools from government. Teacher salaries are paid
by government for both CSS and CDSS. As noted, much of the funding is used to feed students and
boarding schools get much more than day schools. CSSs located in urban areas are allocated more
resources than CDSSs and rural-based CSS. For example, Oyera (boarding school) receives a monthly
capitation grant of $746. At the beginning of 2017/18 academic year, it had spent about $9000 to
procure textbooks for the recently introduced curriculum. Buluzi CSS receives a yearly grant of $41,469
out of which $1,383 is used to buy textbooks. On the other hand, Ndaona CDSS receives a monthly
capitation grant of $170 earning it $2,040. Moni CDSS receives $172 earning it an income of $2,064
which according to the headteacher rarely arrives on time.
In effect, CDSSs have to operate on a much tighter budget than CSS. In situations where fee income
and government subvention does not arrive on time, this puts additional constraints on the ability of
schools to provide quality secondary education. Some schools may divert resources meant for
instructional intputs into feeding or paying teacher bonuses. Although, Makhi, a low-medium cost
private school, had more control over its finances, the deputy head teacher explained that once school
fees are collected, it is deposited into an investment bank to accrue interest, some of which is then used
to offer scholarships to needy students. The school is also able to pay its teachers on time. Njinga,
another low-medium cost private school with similar student population and fee structure struggles to
attract and retain qualified teachers and has poor infrastructure.
Parents and Teacher’ Associations (PTA) proved vital in all schools, regardless of whether the school
had a board of governors or not. All schools apart from Oyera CSS and Makhi private school did not
have a board of governors. For those schools without governing boards, PTAs played an important role
by working closely with the schools’ management team. Often, the PTA committee provided checks
and balances in how funds were spent, monitor teachers and students’ performances and help with
school development work. Parents were often asked to contribute money each term towards
development projects or into a fund to pay bonuses to teachers as an incentive. At urban-based schools,
the PTAs made more financial contribution than schools in rural areas. This was more evident at Oyera
CSS where each member of the PTA contributes about $14 per term. As of January 2018, the PTA had
made contribution of about $10,000 some of which had been used to construct a library, provide a
computer laboratory, and provide 100 chairs and 12 tables. The PTA had also bought lamps for students
and were planning to install solar panels by mid-2018. Similarly, at Buluzi CSS the PTA had made
contributions towards building a girls’ hostel to improve access.
CDSSs, such as Nsonga also had similar practices; although the PTA’s monetary contribution is small,
about $3 per parent per term. At Moni CDSS, the PTA had made a decision to levy parents about $8
per term to support development projects, teacher welfare and awards for top performing students. The
PTA was also engaged in in other income generating activities such as farming and small-scale business
to support school activities.
The case study evidence on PTA contributions to school finances is another indication of how
inadequate funds for secondary schools can put pressure on PTAs to fill in the gaps and which makes
the schools even more inequitable in terms of resources and their capacity to provide quality secondary
education.
5.1.4. Access, participation and grade transition Average dropout rates across secondary grades 9 to 12 are displayed in Figure 5.2 by school type and
location. The highest dropout is in CDSS (9.6%). Dropout is relatively low in CSS (2.9%) (Figure 5.2

19
first panel). Students who attend rural schools seem more likely to drop out (more than three times as
high as those attending urban schools). CSS have the highest enrolment and lowest dropout rate. Urban
schools have the lowest dropout rate and highest enrolment (Figure 5.2, second panel). Across grades,
dropout rates increase for both CSS and CDSS, are stable in private schools but noticeably drop in grade
12 (Figure 5.3). Repitition and dropout may be a factor as students progress towards the final
examinations. The low dropout rate in private schools could be due to cumulative repetition in the last
grade to increase chances of passing the final exams.
Figure 5.2. Average dropout rate by school type and location (Grades 9-12) (Malawi)
Notes: (1) Dropout rates are the average dropout across the secondary school cycle over the total enrolment (across grades 9
to grade 12).
Figure 5.3. Average dropout rate by grade by school type (Malawi)
Notes: (1) Dropout rates per grade are obtained as the ratio of dropout for the specific grade divided by the total enrolment
for the specific grade
We explored selection and repetition by comparing consecutive grade enrolment. Figure 5.4 displays
the degree of selection and repetition, obtained by dividing the enrolment between consecutive grades
(grade x+1 / grade x). Lower ratios indicate stronger selection and a ratio above one either suggests an
influx of students from other schools or higher repetition (in grade x+1). Figure 5.4 shows that selection
across grades is rather low and moderate at the beginning of secondary education – e.g. enrolment at
grade 10 for CSS is 12% lower than at grade 9. In CDSS it reaches its peak a grade later (ratio of
enrolment between grade 11 and grade 10 is 0.79). In private schools, however, all ratio across grades
is greater than one, thus indicating that grade repetition is a common practice. In the last grade, just

20
before the secondary school leaving exam, the ratio of enrolments in grade 12 and grade 11 is 1.70 for
private schools which is highly indicative of private schools repeating students to improve their
learning, before taking the final examinations. Repitition has cost implications for parents and since
most private schools are serving disadvantaged households this would be an additional cost burden.
Figure 5.4. Selection across secondary school grades (Malawi)
5.1.5. Teachers – qualification, utilisation, turnover and professional development
Qualification and utilisation
The professional status of teachers is important for understanding the quality of teachers. In addition,
how teachers are utilised is an important efficiency issue that impacts learning outcomes. Large class
size affects the quality of learning so the choices schools make in how many students a teacher teachers
becomes an important efficiency issue, especially if better organisation of teaching can reduce class
teacher ratio.
Generally, secondary schools are staffed by qualified teachers. Community day secondary schools and
private schools have the least number of qualified teachers (Table 5.8). Private schools employ more
support staff than teachers - highest ratio of support staff to teachers (57%). Community day secondary
schools have the lowest number of support staff and CSS fall between community day secondary
schools and private schools. CSS have the largest number of qualified teachers – nearly twice as many
as community day and private schools. Student teacher ratios are similar across school type (between
31 and 38). Urban schools have significantly more students per teacher (=45.9) - an STR which is 63%
higher than in rural schools (=28.2) (Figure 5.5). Peri-urban schools also have low STR compared to urban schools. Higher STR can adversely impact technical efficiency due to the impact on effective
teaching and learning.
Table 5.8. Average number of teachers across school types (Malawi)
School type
qualified
teachers
unqualified
teachers
professional
support staff
other
support
staff
%
professional
support
staff for
teachers
Ratio
unqualified
versus
qualified
teachers
School
size
CSS 20.9 0.6 4.8 12.3 22% 0.030 568
CDSS 11.3 0.2 1.3 1.9 11% 0.017 350
Private 11.3 0.2 6.5 13.2 57% 0.020 404

21
All eight case study schools complained about teacher shortage and workload and the effect this was
having on instructional quality. It was used to justify the need to pay bonuses to teachers in order to
keep them motivated. We explored the claim of heavy workload in the eight case study schools. Table
5.9 presents the resuls.
First, secondary school enrolments are low. This increases the output to input cost ratios in secondary
schools in Malawi. Second, as noted in the survey results, most schools employ qualified teachers.
Ndaona CDSS is an exception employing 41% unqualified teachers. At Zaone CSS (in a rural area) five
out of the nine teachers are qualified. The other four teachers are only qualified to teach at primary
school level. Not all the teachers at Njinga private work full time - four teachers also teach part-time
in nearby schools and has the highest student teacher ratio among the eight schools. Notably all schools
have large class size with teaching periods ranging between 24 and 38.
The ratio of teachers to classes suggest that teacher workload may not be as high as schools claim. In
most cases, as table 5.9 shows, at least one teacher is not teaching when another is. This is worse in
community day secondary schools. For example at Nsonga CDSS, for every teacher who is teaching at
a specific time four are not engaged in classroom teaching.. At Moni CDSS, when one teacher is
teaching three are not. It raises questions about efficient utilisation of teachers and whether more can
be done to reduce this gap - maximising workload by reducing the number of teachers and increasing
teaching periods for some teachers. Student teacher ratios are generally low in the case study schools,
except Njinga private school. But, class sizes are relatively large and coud be the reason why teacher
utilisation is low.
However, because secondary school teaching is subject-specific, it is possible that some teachers may
be doing more teaching than others, for example science and mathematics teachers. Part of the problem
is also the ability to recruit science and maths teachers in rural schools. At Moni CDSS the headteacher
explained the challenge: “As a head teacher at this school, I also teach Math, Biology, Chemistry,
Agriculture, and Physics in Forms 1,2, and 3. I teach 26 lessons per week in addition to my leadership duties. We now have to teach physics and chemistry separately” In this particular case, combining
teaching and management duties has consequences on the headteachers ability to provide adequate
support all teachers in the school.
Space constraints could also be a factor in why average class size is high for most schools. At Moni
CDSS, the head teacher gave this as the main reason for the large class size – not having enough
classrooms to reduce the size of the classes
Figure 5.5. Student teacher ratio (STR) (Malawi)

22
Table 5.9. Teacher utilisation in case study schools
Notes (1) Number of students divided by the class size. (2) Number of teaching groups multiplied by the number of teaching
periods per week (3) Number of lessons to be taught divided by the number of teachers (4) Number of teachers divided by
teaching group.
Teacher Turnover
We calculated teacher turnover for the current year - the number of appointed teachers plus teachers
who had left as a proportion of the total current teaching force, by school type and location (Figure 5.6).
Turnover can have either positive or negative effects. New arrivals take time to adjust and teachers who
leave take their experience to other schools, which may be good for those schools, but bad for schools
losing them especially if they are not replaced immediately. In situations where schools have more
more teachers than they actually need this would lead to inefficiencies in teacher utilisation
Turnover is generally very low – around 1.5%. Secondary School teachers in Malawi hardly move to
other schools or leave the profession. Private schools and schools located in peri-urban areas have a
turnover of about 3%. Low teacher turnover is important for technical efficiency as students then benefit
from long-serving teachers with more teaching experience.
Figure 5.6. Teacher turnover for the current year (Malawi)
Oyera
CSS
Buluzi
CSS
Zaone
CSS
Nsonga
CDSS
Moni
CDSS
Ndaona
CDSS
Makhi
Private
Njinga
Private
Enrolment 529 700 239 304 318 210 619 570
# Teachers 36 33 9 19 15 12 23 11
# of Qualified Teachers 32 32 5 16 15 5 21 8
# of Male Teachers 20 14 8 15 8 12 16 10
# of Female Teachers 16 19 1 1 7 0 7 1
# of Part-time teachers 0 0 0 0 0 0 0 4
Student Teacher Ratio 16 21 27 16 21 18 27 52
Av. Class Size 45 43 58 76 80 55 65 94
Av. teaching periods /week 24 24 38 26 28 32 32 30
# of Teaching Groups1 18 16 4 4 4 4 9 6
# of lessons to be taught2 432 384 152 104 112 132 288 180
# of lessons available per
teacher3
12 12 17 5 7 11 12 16
Ratio of Teachers to
Classes 4
2 2 2 5 4 3 2 2

23
Professional development
Private schools are more likely to have a budget for organising professional development activities than
other schools. (Table 5.10). However, in terms of time for teachers to actually go on professional
development courses CSS do a little better. Overall, staff development activities are low across school
type. Less than half the number of schools provide information on professional development activities
at the district level.
Table 5.10. Teacher professional development (PD) support by school type – policies (Malawi)
school type
separate
budget
provides time to
go on prof dev
courses
organises staff
development
activities
circulates
information on prof
dev courses in the
district
CSS 32% 45% 5% 36%
CDSS 50% 41% 4% 48%
Private 65% 35% 15% 50%
Total 49% 41% 7% 45%
Subject-specific professional development activities is also quite low – schools indicated that only one
in three schools have teachers who have had subject-specific professional development–(Table 5.11).
Private school teachers are slightly more likely to have attended professional development courses or
workshops, but are marginally less likely to have undertaken observational visits and prepared lesson
plans (Table 5.11) – both of which are important ingredients for improving the quality of teaching in
schools. It appears that schools place more emphasis on instructional collaboration, mentoring and peer
observation, although of the three types of schools, CDSS do less of this (57%).
Table 5.11. Teacher participation in professional development, last year (Malawi)
school type
courses or
workshops on
subject and to
discuss
ideas/problems
collaboration on
instruction and
mentoring, peer
observation
observational
visits, networks
CSS 32% 68% 73%
CDSS 35% 57% 83%
Private 40% 70% 75%
Total 35% 63% 78%
Head teacher experience
Experienced headteachers can use their vast knowledge and expertise to enhance school efficiency.
Figure 5.7 shows that headteachers in private schools were the least experience and also had less
experience in their current schools as a proportion of their total experience. Head teachers in urban
schools had the least professional development in the last year compared to heads in rural areas This
may reflect increasing incidence of in-service training targeting schools in disadvantaged regions
mainly provided by local or international NGOs. Overall, about 57 percent of headteachers in the
sample schools had participated in any kind of professional development (Table 5.12).

24
Figure 5.7. Years of headteacher experience (Malawi)
Table 5.12. Headteachers professional development – participation last year (Malawi)
School location Percentage
Rural 63%
Urban 41%
Peri urban 53%
Total 57%
5.1.6. Examination Preparation and Achievement
How much time schools spend on examination preparation is a good indication of the effort that goes
into preparing students to pass the final examinations. But, also spending more time on exam
preparation means less time for classroom instruction and learning. Most schools spend about a fifth
of teaching time preparing students for examinations. However, this is not correlated, at the aggregated
level with high passing rates (i.e. distinctions) (Figure 5.8). CSS spend the most time preparing students
for examinations and achieve the highest percentage of pass rates with distinction. CSS are also more
likely to attract the best students and are better resourced as discussed earlier. Both private and
community day secondary schools spend a similar proportion of time on examination preparation, but
the former do better in achieving a higher proportion of students passing with distinction. Thus, CDSS
spend about the same time as private schools preparing students for examinations, but for CDSS the
quality output is low.
Spending more time on exam preparation may also be reflective of the quality of students who enrol in
the different schools. In any discussion of school efficiency, it is important to relate this to instructional
management issues such as time on teaching and time preparing students for exams
Notes: (1) Pass rates with distinction are calculated as an average for the years 2015 and 2016 for the exam at the end of
secondary (grade 12).
Figure 5.8. Time used for exam preparation and achievement (Malawi)

25
5.1.7. Computer to student and teacher ratio
Technology use in secondary schools offers insight into how well secondary schools in Malawi are
positioned to provide learning experiences that tap into wider knowledge and resources for learning. In
the study, we used access to computers as a proxy measure to this potential. Table 5.13 shows very low
availability of computers to students across schools (between 3.6 to 9.6 PCs across school types and 6.2
for all schools), as well as low access to web-connected PC for students (in general less than one). Low
stock of PCs is also observed for teachers and management staff (for teachers 0.5-1.6 and for staff 0.5-
2.4). When controlling for school size, PC student ratios vary between 0.009-0.019, that is, between 1
and 2 PC for 100 students. Within this environment of low IT infrastructure, students from CDSS are
the most disadvantaged, followed by students in private schools. CSS have the highest PC student ratio,
but even in these schools the rate is very low (0.019).
Table 5.13. Average number of PCs and PC student ratio (Malawi)
school type
Average
number of
PCs for
students per
school
Average number
of PCs connected
for student per
school
Average number
of PCs for
teachers per
school
Average number of
PCs for
management staff
per school
PC
student
ratio
CSS 9.6 0.7 1.0 1.7 0.019
CDSS 3.6 0.2 0.5 0.5 0.009
Private 8.4 3.3 1.6 2.4 0.017
Total 6.2 1.0 0.9 1.2 0.013
5.1.8. Autonomy and recruitment School autonomy is widely regarded as an important condition for the improvement of school practices.
Schools with greater autonomy can adapt more quickly to changing educational circumstances and
make decisions that can enhance the student learning experience. Private schools have more autonomy
in terms of determining the time they allocate to subjects on the timetable but also in terms of
determining how many teachers they need. As government schools, CSS and CDSS have far less
autonomy in deciding how much time should be allocated for each subject. This would often be
prescribed from the centre. They also have less freedom to decide how many teachers they need. Case
study CDSS and CSS schools pointed out that they often had to wait for approval for teachers who have
left to be replaced. This is partly because teachers were paid by the central government and therefore
they could not make independent decisions on who they wanted to recruit and how many.
Not surprisingly, therefore, about 95% of private schools sampled make their own recruitment
decisions, whereas for CSS and CDSS only about 20-32 percent feel they are in the position to recruit
teachers they need (Table 5.14).
Table 5.14. Autonomy on teaching timetable and selection (Malawi)
school type
Determine the
time allocated
to subjects on
the school
timetable
Decide how many
teachers the school
needs
CSS 27% 32%
CDSS 22% 20%
Private 75% 95%
Total 35% 40%

26
5.1.9. Achievement An important output measure for the analysis of efficiency is achievement. We use national examination
data provided by the schools for insight into quality of learning outcomes. Pass rates are generally high
which might suggest that it does not take much to pass or schools do a good job in teaching students
effectively.
Table 5.15 shows that from 2013 to 2016, CSS achieved the highest pass rates. Pass rates are much
lower in community day secondary schools (CDSS) - 20% lower than in CSS. A similar pattern can be
seen in the case of distinctions. However, the gap across school types is much wider. For instance,
whereas pass rates are 15 percent higher in CSS, in private schools distinctions triple – about 46%.3
Table 5.15. Pass rates and distinction rates (grade 12) (Malawi)
Pass rate Distinction
school type 2013 2014 2015 2016 2013 2014 2015 2016
CSS 86.7% 83.3% 80.3% 89.2% 26.2% 27.5% 35.4% 37.8%
CDSS 52.3% 54.8% 58.1% 60.2% 14.3% 12.9% 12.5% 11.9%
Private 76.8% 81.4% 70.1% 79.2% 26.3% 28.1% 17.0% 27.1%
N 82 82 86 87 83 82 80 84
Notes: (1) Pass rates are for the exam at grade 12 (i.e., the end of the secondary school cycle). (2) Rates are calculated as the
total number of students who passed (or obtained distinctions) over the total number of students who sat the exam.
Figure 5.9 shows the exam grades in more detail, disaggregated by fail, pass, credit and distinctions.
CSS achieve the highest number of distinction grades (17%) and CDSS the least (4%). About a fifth
of CDSS students fail (22%). Private school students obtain a similar rate of `good passes’ (credit) as
CSS schools. CDSS achieve the most low passes (grades 7 and 8). Overall, CSS achieve the best
learning outcomes, followed by private schools and community day secondary schools. This is also
consistent with the differences in resources between the different types of secondary schools. CSS are
better resourced, provide education for students from advantaged backgrounds and spend more time
preparing students for national examinations. Community day secondary schools consistently
underperform compared to CSS and private secondary schools
Figure 5.9. Passing rates for exam at grade 12 (Malawi)
3 Selection is low, at most 6% between those who were enrolled in the last grade and those who took the exam.

27
5.1.10. Cost
The largest unit cost per student occurs in CSS (=$213), followed by private schools (=$143) and CDSS
(=$11) (see Table 5.16). Thus, CDSS provide the cheapest secondary education and also the poorest
as earlier discussed. The unit cost per student in a CSS is about twenty times that for a student in a
CDSS. However, CDSS spend three times as much on salaries as they do on other expenditure, partly
because they are day schools with less infrastructure as the majority boarding CSS - about 86% of CSS
in the study are boarding schools. CSS and private school, spend more on infrastructure (the ratio is
0.51 and 0.46 respectively). On average, CSS spend twice as much on infrastructure and wages as
private schools. These findings suggest that policy to increase access to secondary education in Malawi
has to look more towards CDSS as the cost of expanding access to CSS may be unsustainable. But this
has to be accompanied with effort to significantly improve the quality of CDSS.
Table 5.16. Costs (Malawi)
school type cost expenditure
cost salary
total cost
unit cost per student
ratio salary to expenditure
CSS 97028 49628 148014 213 0.51
CDSS 5630 18819 24450 11 3.34
Private 56365 26191 94353 143 0.46
Notes: (1) All costs are yearly and transformed into US dollars from survey data local currency reports (exchange rate: 1 MWK
= 0.00137877 USD). (2) Expenditure costs includes the following items: food, water, electricity and vehicles expenditure). (3)
Salary cost includes wages for headteacher, deputy teachers, management, graduate teacher, qualified and unqualified teachers,
and professional and other support staff. (4) Total cost is the sum of expenditure and salary costs. (5) Unit total cost per student
is the ratio of a school total costs divided by the total enrolment.
5.2. Efficiency and Costs
5.2.1. Pass rates, costs and equity
This section presents findings on costs and efficiency and the relationship between costs and the socio-
economic background of students in the different types of secondary schools. Figure 5.10 shows the
relationship between the total unit cost per student against pass and distinction rates (average rate for
2015 and 2016) for each school.
Generally, what it shows are wide variations in cost-efficiency. Schools with pass rates above 80%,
can have unit costs varying by about $500 (see, for instance, see points C and D). Some schools achieve
different distinction grades but at the same cost. For example, both school A and B spend the same
amount per student in a year ($300), but school A achieves a pass rate with distinction about 40 percent
higher than school B. The relative cost efficiency of school A is shown in segment AB.
Figure 5.10 shows that a good number of schools achieve high pass rates at relatively medium costs –
a pass ranges from grades 3 to 8. One school achieves a high pass rate at a relatively high cost ($900).
Ideally, schools should be able to achieve high pass rates at sustainable costs. Achieving distinctions at
lower costs is much more of a challenge. Secondary schools in Malawi may not be sufficiently resourced
to increase learning outcomes for most students.

28
Figure 5.10. Unit cost and pass rates (Malawi)
We divided the sample between poorer and richer schools4 and plotted the total unit cost and pass rate
with distinction in Figure 5.11. It shows that most of the poorer schools cluster around a total unit cost
of less than $100 and achieve a pass rate with distinction below 20%. Increasing resources to poor
schools, for example doubling the unit cost per student, may increase learning outcomes. Figure 5.11
shows a poor school which achieves 80 percent pass rate with distinction at a unit cost of about $250.
It is difficult to draw any firm conclusions based on the small sample of rich schools used for this
analysis.
Figure 5.11. Unit cost and pass rates by school socioeconomic status (Malawi)
5.3. Data Envelopment Analysis (DEA)
5.3.1. Efficiency for different set of outputs
Overall efficiency
4 This is proxied by question 5 (see Appendix 2) that asks about the proportion of disadvantage students in the schools (see
also Table 5.4).

29
For the DEA analysis, the nearer a score is to one, the more efficient the school is (see Appendix 1).
Thus, schools reaching the efficient frontier have scores close to or equal to 1. Scores further away from
the efficient frontier can be considered as less efficient. DEA efficiency refers to technical efficiency
– it describes the relationship between inputs and outputs for each school with respect to an efficiency
frontier. Table 5.17 shows schools in Malawi are further from the efficient frontier when completion
rates with distinctions5 is used as the output – the mean score is 0.28. The degree of variability is similar
for pass rates and pass rates with distinctions.
The difference on mean efficiency by outputs suggests that for secondary schools in Malawi to increase
pass rates with distinctions, they would need better use of a combination of inputs than they currently
do to reach pass rates with distinction. Also, 22% of schools (19 out 88) are further away from the
efficiency frontier when we base the output measure on pass rates. For pass rates with distinction most
schools (72%) do not reach the efficiency (63 schools out of 88). In effect, if a pass rates are used as a
measure of how well secondary schools are doing in terms of efficiency, the majority will be considered
efficient. However, if we determine high quality by the ability of schools to reach high pass rates with
distinction, most schools would not meet this mark.
Table 5.17. Efficiency for different outputs
Achievement
Statistics Pass rate
Pass rate
with
distinctions
Mean 0.78 0.28 Interquartile range 0.35 0.31 Standard deviation 0.21 0.29
Notes: (1) Pass rates refers to the exam at grade 12 for years 2015 and 2016. (2) Flows includes as outputs cohort completion
rates (2013-2017) and promotion rates. (3) For further details on the DEA specification and inputs included, see Appendix 1.
There is also no trade-off between school efficiency on pass rates and pass rates with distinction in
Malawi (correlation is positive and statistically significant) (Table 5.18, first cell). In fact, the
correlation is moderate at 0.46. There is no relationship between pass rates with distinction and flows
(the rank correlation coefficient is not statistically different from zero at 5%), but there is an association
between pass rates and flows (correlation coefficient p-value is less than 5%). In effect, it is easier for
schools to get more students to pass than to get more of them to pass with distinction. If schools in
Malawi should produce high pass rates with distinctions, efficiency in the use of resources would need
to improve significantly. As earlier noted, a pass grade has a wide range so currently schools are able
to get most students through to the final grade and pass with the available inputs. It is much harder for
them to get most students to reach the final grade and achieve high pass rates with distinction with
current inputs.
Table 5.18. Rank correlation coefficient of efficiency for different outputs (Malawi)
pass rate
pass rate with
distinction flows
pass rate 0.457 0.251
p-value 0.000 0.028
pass rate with distinction 0.122
p-value 0.308
flows
5 How many students go through the grades to achieve distinction
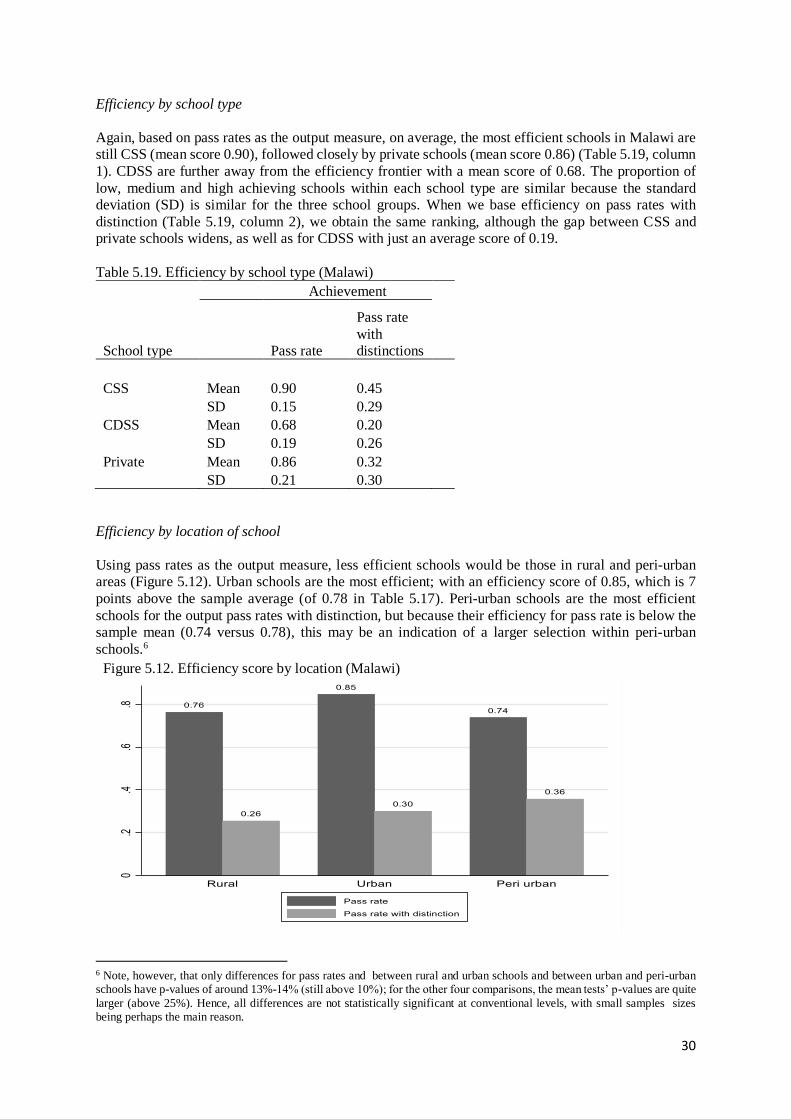
30
Efficiency by school type
Again, based on pass rates as the output measure, on average, the most efficient schools in Malawi are
still CSS (mean score 0.90), followed closely by private schools (mean score 0.86) (Table 5.19, column
1). CDSS are further away from the efficiency frontier with a mean score of 0.68. The proportion of
low, medium and high achieving schools within each school type are similar because the standard
deviation (SD) is similar for the three school groups. When we base efficiency on pass rates with
distinction (Table 5.19, column 2), we obtain the same ranking, although the gap between CSS and
private schools widens, as well as for CDSS with just an average score of 0.19.
Table 5.19. Efficiency by school type (Malawi)
Achievement
School type Pass rate
Pass rate
with
distinctions
CSS Mean 0.90 0.45
SD 0.15 0.29 CDSS Mean 0.68 0.20
SD 0.19 0.26 Private Mean 0.86 0.32 SD 0.21 0.30
Efficiency by location of school
Using pass rates as the output measure, less efficient schools would be those in rural and peri-urban
areas (Figure 5.12). Urban schools are the most efficient; with an efficiency score of 0.85, which is 7
points above the sample average (of 0.78 in Table 5.17). Peri-urban schools are the most efficient
schools for the output pass rates with distinction, but because their efficiency for pass rate is below the
sample mean (0.74 versus 0.78), this may be an indication of a larger selection within peri-urban
schools.6
Figure 5.12. Efficiency score by location (Malawi)
6 Note, however, that only differences for pass rates and between rural and urban schools and between urban and peri-urban
schools have p-values of around 13%-14% (still above 10%); for the other four comparisons, the mean tests’ p-values are quite
larger (above 25%). Hence, all differences are not statistically significant at conventional levels, with small samples sizes
being perhaps the main reason.

31
5.3.2. Cost and equity
How much of technical efficiency can be explained by students’ socioeconomic background? For
example, are more underprivileged schools less efficient? Does technical efficiency vary more or less
across poorer schools or across richer schools? Figure 5.13 shows that schools with a low to moderate
degree of wealth disadvantage are more efficient than those whose proportion of disadvantage students
is high. Although in the majority of schools technical efficiency is further away from the efficient
frontier, technical efficiency levels in poorer schools are about half the levels in more advantaged
schools.
Figure 5.13. Efficiency scores by degree of school’s disadvantage (Malawi)
Figure 5.14 is a plot of technical efficiency scores against total unit cost. First, for output measure
pass rates with distinctions, most schools are clustered at the bottom left section of the plot, with unit
costs below $100 for efficiency scores below 40% - low spending appears to be associated with low
technical efficiency. Higher unit costs are generally associated with higher efficiency – output
measure based on pass rate with distinction. With pass as the output measure, many schools are able
to achieve a relatively high degree of efficiency at lower costs (consistent with earlier results).
Figure 5.14. Technical efficiency and cost efficiency (Malawi)
When we explored together technical efficiency (TE) and cost efficiency (CE) by school type, the
region where schools achieve TE and CE simultaneously are located in the top left corner (Figure

32
5.15).7 Most CDSS schools have low TE and low unit cost (bottom left quadrant). There are however
a few CDSS which, despite their underprivileged context, seem capable of reaching both types of
efficiency.
For many CSS, as unit costs increases technical efficiency increases as well. The pattern is less
discernable in the case of private schools. However, it would appear that for many private schools
generally technical efficiency does not improve with increasing unit costs.
Figure 5.15. Technical efficiency and cost efficiency for pass rates with distinction by school type
(Malawi)
Costs in boarding schools is much higher than day schools mainly because of feeding and high
infrastructure costs. Figure 5.16 shows efficiency between boarding and day schools. The results are
revealing. For pass rate as output measure of efficiency, many day schools achieve an efficiency score
of 40% and above for about $100 unit cost.
Figure 5.16. Efficiency by day or boarding school (Malawi)
A – Pass Rates B – Pass Rate with Distinction
7 The quadrants are defined by the median values of total unit cost and the efficiency score.

33
Boarding schools clearly are not as cost efficient; in general, they spend more to achieve higher pass
rates than day schools (diagram A). When we use pass rate with distinction as the output measure
(diagram B), many day schools struggle to achieve this output with unit cost of about $100 unit. For
boarding schools there is a bigger spread. It appears that the more expensive boarding schools achieve
higher pass rates with distinction, but not surprising perhaps since they recruit more advantaged students
and have more resources. A few, spend more than day schools and achieve similar level output as day
schools. But if day schools are to reach higher levels of quality (pass rates with distinction), clearly
they would need more investment.
A policy to invest in boarding CSS (building more CSS or increasing spaces) to accommodate more
students from this analysis is not a good decision. It will cost a lot more, will not be sustainable and
equitable. Since some CDSS appear to achieve high quality at unit cost of about $100, it will be worth
exploring further how they achieve this success.
5.3.3. Characteristics of the most and less efficient schools
Table 5.20 shows the characteristics of the group of schools with high technical efficiency (with scores
approaching or equal to 1) and those which are less efficient (bottom 25% of efficiency score
distribution for pass rates).
Table 5.20 Characteristics of the most and less efficient schools (Malawi)
The following conclusions can be drawn from this analysis:
• Efficient schools have a higher proportion of qualified teachers compared to non-qualified teachers.
Efficient Low efficiency Difference
School enrolment - total 408.9 361.9 46.99
Ratio of qual vs nonqual teachers 8.9 4.5 4.39
Ratio of teachers total to professional support staff 5.4 8.9 -3.45
School students classroom ratio 54.7 48.9 5.86
Student teacher ratio based on qualified teachers 27.2 31.5 -4.33
Headteacher - female 0.3 0.0 0.28
Headteacher - age 51.1 49.7 1.46
Headteacher - education level 1.7 1.7 -0.03
Headteacher - years of work experience as principal in total 10.1 9.8 0.26
School administration training 0.9 1.0 -0.01
Financial management training 0.7 0.8 -0.08
Participated in professsional development activities 0.4 0.5 -0.06
Teacher - Hiring of new teacher is responsabnility of school 0.61 0.80 -0.19
Teacher turnover, this year 0.12 0.11 0.01
Teacher excess 0.68 0.68 0.01
Teacher - Professional development supported 0.83 0.70 0.13
Teacher - Professional development supported and participated 0.67 0.70 -0.03
Management - Teacher regularly produce lesson plans for inspection 0.22 0.40 -0.18
Mean class size (for main subjects) 62.95 88.21 -25.26
Ratio for proportion of school days spent on examinations versus teaching 0.21 0.15 0.06
Proportion of students walking more than 3 km 0.18 0.45 -0.27
Proportion of students cycling more than 3 km 0.09 0.15 -0.06
School receives info on how well it is doing - total 2.50 2.10 0.40
The school participated in: Program to support school management 0.50 0.15 0.35
The school participated in: Program to improve teacher performance 0.28 0.20 0.08
The school participated in: Program to improve student performance 0.17 0.20 -0.03
Autonomy - Preparation of the school budget 2.61 2.50 0.11
Autonomy - Allocation of resources inside the school 2.50 2.50 0.00
Index - IT 0.13 0.09 0.04
Index - Infrastructure 0.15 -0.33 0.49
Enrolment rate growth between 2013 and 2017 0.65 29.61 -28.96
Enrolment rate growth between 2015 and 2017 0.38 135.53 -135.15
Unit wage cost of qualified teacher - per month (in usd) 0.24 0.11 0.13
Unit wage cost - per month (in usd) 7.94 4.74 3.19
Unit expenditure cost - per month (in usd) 7.97 1.60 6.37
Unit total cost - per month (in usd) 19.18 6.35 12.83
Ratio of wage to expenditure cost 7.51 34.53 -27.02
Efficiency based on pass rates

34
• Efficient schools have a lower mean class size than less efficient schools, and generally participated
in programs to support school management
• Efficient schools are more likely to provide support for teachers’ professional development and have
considerably lower average class size (for key subjects) than less efficient schools.
• Efficient schools receive more feedback on how well they are doing from different stakeholders, have
more autonomy and are more likely to have participated in programs on school management to
improve teacher’s performance.
• The more efficient schools have not increased enrolment significantly over the last 2 to 4 years. Oer
this period their unit costs have increased. This would suggest that rapid increases in student
enrolment can have a negative knock on effect on efficiency especially if this is not accompanied by
increasing resources.
• Efficient schools have a lower wage to expenditure and a higher unit expenditure per month. It would
appear that with moderate increase in enrolments and increased expenditure they have been able to
achieve high output relative to less efficient schools.
5.3.4. Efficiency and teacher characteristics
Experience on the job, age and salary matters in the production of efficient schools. (Table 5.21). In
efficient schools, teachers’ salaries are more closely linked to teacher experience than in less efficient
schools (Table 5.22). This is true whether the output is based on pass rates or pass rates with distinction.
This close association is shown by the differential correlation coefficients. The correlation coefficient
of teachers’ salary with teachers’ experience is 0.352 for efficient schools and just 0.113 for less
efficient schools; likewise, it is 0.490 and 0.285 for efficient and less efficient schools (for efficiency
based on pass rates with distinctions).
Table 5.21. Difference on teachers’ characteristics for efficient and low efficient schools (Malawi)
Pass rate Pass rate with distinction
Efficient
Low
efficiency Diff t-test Efficient
Low
efficiency Diff t-test
Teacher - female 0.74 0.74 0.00 n 0.77 0.74 0.03 n
Teacher age 43.34 42.53 0.82 y 40.33 44.12 -3.79 y
Teacher
experience 15.98 17.27 -1.29 y 14.46 17.83 -3.37 y
Teacher
experience in
current school 5.21 4.83 0.38 y 4.54 4.81 -0.27 n
Teacher salary 169926 152812 17114 y 159768 152812 6956 n
Table 5.22. Correlation coefficient between teacher experience and his/her salary for efficient and low
efficient schools (Malawi)
Efficient Low efficiency
Pass rate 0.352 0.113
Pass rate with distinction 0.490 0.285

35
6. Conclusions and Policy Recommendations
It is striking that students who attend CSS mostly in urban areas live much closer to their schools
which are often boarding schools, whereas students who attend Community Day Secondary Schools
(CDSS) live much further away and walk longer distances to school. Boarding schools cost more and
for the poor will be inaccessible. Future growth in access to secondary education in Malawi will have
to come from expanding access to community day secondary schools, but these schools need more
investment to improve their quality. Judging from the data, CDSS tend to be smaller schools. Urban schools enrol twice as many students
as schools in rural areas. Peri urban schools are of medium size. This presents challenges for expanding
access to secondary education at affordable costs. For CSS in towns and cities, a policy option would
be to increase the ratio of day to boarding students since CSS students live much closer to their schools
compared to CDSS.
The practice of offering remedial classes for underperforming students in private and CSS schools
improves their pass rates but not in the case of CDSS. The bigger impact of remedial classes is also
correlated with repetitions. CDSS provide greater access to poor households than CSS and need an
injection of resources to improve the quality of teaching and learning. Teaching in CDSS has to be
made attractive to attract the best teachers to improve learning outcomes.
All schools rely on additional income (representing on average about 81% of total funding). Private
schools receive almost all their income from fees (about 95%), and although are considered low-fee
paying schools their costs would exclude the poorest who seek a secondary education. But, they provide
relatively better quality than CDSS which cost much less than low-fee private schools. If the quality of
CDSS improves at affordable costs they could compete with low-fee private schools and provide choice
for poor households. The reliance on school charges and PTA contributions can create inequitable
access to quality secondary education in Malawi. It has implications for improving school efficiency.
With over 80 percent of students from disadvantaged backgrounds, relying on fees and income from
households, CDSS in particular are unlikely to have enough recurrent funds to run efficiently.
The number of PCs connected to the internet, PCs for school management and PCs per student across
all school types is very low. Improving IT infrastructure and use in schools should be part of a medium
to long-term policy priority. This has the potential to enrich the quality of the learning experience in
secondary schools. Although this study did not investigate school curriculum issues, the eight case
studies indicated little diversification in curriculum delivery. Schools concern was mostly with
accessing adequate textbooks and learning materials and improving basic infrastructure. A 21st century
secondary education has to look towards increasing access to PCs and the internet. This has to, at least,
be part of a long-term vision of improving access to quality secondary education in Malawi. Inequitable
access to computers can become another tool for perpetuating inequitable access to quality secondary
education. Access to ICT in secondary schools interconnects with accessibility and connectivity to
electricity. This may be the biggest challenge to improving ICT in rural secondary schools in addition
to other relevant elements such as, finance, infrastructure, personnel and their training, software, and
textbooks.
The indications for the analysis of costs suggests that secondary schools in Malawi may not be
sufficiently resourced to increase learning outcomes for most students. Pass rates are generally high and
easier to achieve for most schools. But for secondary schools in Malawi to improve their quality for
all, if pass rate with distinctions is used as a measure of quality, then a better use of a combination of
inputs or increased inputs may be needed. We found that about 22 percent of schools (19 out of the 88)
are further away from the efficiency frontier when we base the output measure on pass rates, but using
pass rates with distinction as our output measure, about 72 percent of schools fail to reach this efficiency
frontier. Thus, if we determine high quality by the ability of schools to reach high pass rates with
distinction, most secondary schools in Malawi would not meet this mark.
36
Schools with a low to moderate degree of wealth disadvantage are more efficient than those whose
proportion of disadvantage students is high. Although in the majority of schools technical efficiency is
further away from the efficient frontier, technical efficiency levels in poorer schools are about half the
levels in more advantaged schools. This means students in rural schools are receiving relatively poor
quality secondary education. It adds to the importance of increasing investment in secondary education
in rural areas to improve equity in quality.
Insights into the factors which make schools efficient in the Malawi context can be used by policy
makers to develop standards for improving quality. They include ensuring that: (a) a higher proportion
of qualified teachers compared to non-qualified teachers; (b) class sizes are lower and school
management is improved; (c) all secondary school teachers, irrespective of their location have good
access to professional development; (d) schools and stakeholders have good information on how well
their students are performing compared to other schools; (e) expansion of access to secondary education
goes with increased resources. Rapid increases in student enrolment can have a negative knock on effect
on efficiency if not accompanied by increasing resources. (f) schools maintain a low wage to
expenditure ratio. Moderate increases in enrolment and accompanied by increased expenditure can ensure the quality of secondary education is maintained.
There needs to be a robust inspection and advisory system in place to ensure that all secondary schools
in Malawi meet minimum standards of practice considered appropriate, but also that they operating to
maximise learning outcomes for all. Improving the quality and availability of data from secondary
schools will be useful in monitoring capacity and quality. It will also ensure that new investment in
secondary education is based on reliable and valid data on verifiable performance indicators.
Parent Teacher Associations are contributing significantly to the cost of running secondary schools in
Malawi. Evidence from the case studies suggest that this can be a source of inequitable quality to
secondary education. Richer communities provide more and therefore add to the quality of secondary
schools serving in those communities. The policy of free secondary education has to address the role
of PTAs and ensure that schools in rural areas are not disadvantaged as a result of PTA contributions
filling in financing gaps of the policy.
Internal management of schools is crucial to running an efficient school. Ideally, an efficient school is
where the interaction between different stakeholders is cordial and mutually reinforcing so that the
teachers are happy to teach, parents are willing to send their children to school, and children enjoy the
learning process. What is clear from the case studies is the lack of transparent reportage on efficiency
through an effective governance system.
The Malawi 2016 National Education Policy notes that governance and management of secondary
education is problematic because of understaffing, unavailability of laboratories, inadequate funding,
limited classroom capacity, lack of relevant and responsive curriculum and poor management of
resources (GoM 2016: 6). One of the policy objective is to improve the operations and efficiency of the
education system through good governance and management to deliver education services efficiently
and effectively. The policy strategy to achieve this is through decentralized management of secondary
schools; improved conditions of service for secondary school teachers; improved regulatory framework
on stakeholder participation in the delivery of secondary education; increased funding levels to
secondary education; strengthening capacity of secondary education governance and management at all
levels; and finally, improvements in accountability and transparency in running secondary schools in
Malawi. These policies target the system, when as seen in this study, schools function face different
financial and logistical challenges.
There are indirect political economy issues arising from the findings of the research. Creating a
secondary school system that works to improve quality for all will be achieved if only the ecosystem
factors that influence how schools are run receive policy attention. School governing boards must have
real power to manage schools and hold headteachers and teachers accountable. Training for
headteachers in the management of secondary schools also needs investment and policy attention so

37
they are better able to offer quality leadership that can produce efficient and effective secondary schools
in Malawi. The incentive for secondary schools to operate more efficiently and be held accountable for
the resources they consume is lacking. Free secondary education in Malawi has to be accompanied
with significantly improved management of the increased resources that will be required to achieve
equitable access for young people in Malawi.
What are the implications of the findings for providing ‘free’ secondary education in Malawi. First, the
country needs to ensure there is improved access to the poor at the primary level to make free secondary
education equitable. Second, by making secondary education free for all irrespective of whether a
student attends a CDSS or CSS will make secondary education highly inequitable. To approach more
equitable access, the government should consider making all day attendance free whilst at the same
time increase resources to CDSS to raise quality. Households that wish to access boarding secondary
education are more likely to be able to afford it and therefore should not benefit from ‘free’ secondary.
As our analysis shows, boarding CSS cost much more but also have the capacity to generate additional
income that CDSS cannot match. A combination of free day schools and improved investment in
community secondary schools will constitute a pro-poor policy which is also more sustainable. In effect,
a free secondary education policy should seek to close the quality gap between CSS and CDSS. CSS in
towns and cities may have more capacity to increase enrolment than CDSS, and a mapping exercise
could determine which can do so, and the excess capacity used to enrol day students.

38
7. Bibliography
Charnes, A., Cooper, W., Rhodes, E. (1978) Measuring the efficiency of decision making units. Eur. J.
Oper. Res. 2, 429–444.
Chimombo, J., Meke, E., Zeitlyn, B. and Lewin, K., (2014). Increasing access to secondary school
education in Malawi: does private schooling deliver on its promises?
Farrell, M. (1957) The measurement of productive efficiency. J. R. Stat. Soc. Ser. A 120 (Part 3), 253–
290.
Glewwe, P. and Muralidharan, K., (2015). Improving School Education Outcomes in Developing
Countries: Evidence. Knowledge Gaps, and Policy Implications.
Grauwe, A.D. and Varghese, N.V., (2000). Improving school Efficiency; Issues and priorities, seminar
report. Grauwe, A. De and Varghese, (2000) NV (eds.) School Autonomy and Efficiency: Some Critical
Issues and Lessons in Improving School Efficiency.
Lewin K M et al (2018) Feasibility Study for the Establishment of the African Education Fund: Final
Report. African Development Bank and Association for the Development if Education in Africa.
Abidjan, Cote d’Ivoire and Japan Trist Fund.
Lewin K M and Akyeampong K (2009) Education in Sub Saharan Africa: Researching Access,
Transitions and Equity in Lewin K M and Akyeampong K Access to Education in Sub Saharan Africa:
CREATE Special Issue Comparative Education Vol 45:2 143-151 ISSN 0305-0068
Lewin K M (2008). Strategies for Sustainable Financing of Secondary Schooling in Sub Saharan
Africa. Secondary Education in Africa (SEIA): Africa Human Development Series; World Bank,
Washington DC pp170 + CD Rom including Case Studies ISBN 13:978-0-8213-7115-2
Lewin K M, Caillods F (2001) Financing Secondary Education in Developing Countries; Strategies for
Sustainable Growth. International Institute for Educational Planning, Paris. 370pp ISBN 92-803-1139-
9
Lewin, K. M. and Sayed, Y. (2005) Non-Government Secondary Schooling in Sub-Saharan Africa.
Exploring the Evidence in South Africa and Malawi, DFID: London.

39
8. Appendix 1. Efficiency conceptualisation and framework
8.1. Data Envelopment Analysis (DEA)
The DEA consists of building an envelope of the most efficient combinations of inputs and outputs by
solving a linear optimization program (Farrell, 1957; Charnes et al., 1978). The efficient combination
of inputs and outputs of a given decision making unit (often a firm but in our context a school) define
a production frontier, which defines a standard performance and the evaluation of each unit is with
respect to that standard. That is, the DEA calculates the boundary of the best productive practice
possible and estimates an efficiency parameter that is a result of the distance of the unit with respect to
the frontier. There are other assumptions within DEA like convexity of production function, type of
return to scale etc.
There are two types of efficiency one could measure within DEA: with respect to outputs or with respect
to inputs. In the latter, it implies the reduction one could achieve in inputs without modifying the level
of output (on the frontier) and in the former case to obtain the maximum level of output given a fixed
level of inputs. We follow the second approach –that is, an output orientated maximisation.
Graphically, let assume there are two schools: school j with a combination of inputs (say teacher
numbers, PCs, and infrastructure) and outputs (say of learning scores) given the frontier of production
J (Figure 8.1). There is a second school k, with a frontier K. Each frontier represents the maximum
output for a given set of input where each dot represents a student (which a specific learning
score/output). Now, combining these two frontiers with DEA gives a new envelope efficient frontier
for the two schools E. The distance J1E1 is the inefficiency of school j with respect to efficient frontier;
the distance K1E2 is the inefficiency of school k with respect to the efficient frontier. The relative
efficiency is the ratio J0J1/J0E1 for school j, and for school k is K0K1/K0E2. If the ratio is one, schools
are using a combination of inputs and outputs on the absolute efficient frontier, hence they are efficient
reaching the maximum output for their set of inputs. This ratio can be defined as λ. The further the
relative efficiency or λ is from one, the less efficient a school is. Here, we assume that λ is measuring
technical efficiency: how inputs are transformed into outputs.
Figure 8.1. A graphical representation of efficiency - DEA
input
output
school j
school k
K
J
K1
E2
K0
inefficiency
school k
inefficiency
school j
J0
J1
E1
E0
E

40
DEA assumes the existence of a production possibilities frontier (the envelop) that defines which linear
combination of observed input-output bundles are feasible. The relative efficiency of unit j can be
defined as weighted outputs (r) to the weighted inputs (i): 𝑒𝑗 = ∑ �̅�𝑟𝑦𝑟𝑗/𝑟 ∑ �̅�𝑖𝑥𝑖𝑗𝑖 , where �̅�𝑟 and �̅�𝑖
are the prices of outputs (y) and multipliers of inputs (x). Because multipliers are unknown, linear
programming problem generates the multipliers as a by-product of the statistical estimation process.
The “output-oriented envelopment” program that aims to maximize the output production of each
decision-making unit (DMU) (e.g., a school) subject to a given input level can be formulated as follows.
Let’s consider the problem for DMU 1,
𝑚𝑎𝑥𝛿1 (and 𝛿1 ≥ 1) (8.1)
∑ 𝜆𝑗𝑦𝑟𝑗𝑗 ≥ 𝛿1𝑦𝑟1 𝑟 = 1, … , 𝑠 (8.2)
∑ 𝜆𝑗𝑥𝑖𝑗𝑗 ≤ 𝑥𝑖1 𝑖 = 1, … , 𝑚 (8.3)
∑ 𝜆𝑗 = 1𝑗 (8.4)
𝜆𝑗 ≥ 0 ∀ 𝑖, 𝑗, 𝑟 and 𝛿0 unconstrained (8.5)
The solution is given by (8.1) which represents the output-efficient score. It indicates the proportion by
which the s outputs need to increase for DMU1 to be located on the production possibility frontier. In
other words, it measures “technical efficiency” as the distance to the production frontier. If 𝛿1 > 1, the
DMU1 would be located inside the frontier, i.e. it is inefficient, and if 𝛿1 = 1, DMU1 is efficient as it
is located on the frontier. Equation (8.2) is the output constraint, indicating that the weighted sum of
outputs from all DMUs in the sample must be greater than or equal to the potential output for DMU1,
given the input constraint (Equation 8.3). There indicator 𝜆𝑗 is a constant representing the weights with
which the DMU replicates the behaviour of the others DMUs in regards the use of inputs to produce
outputs. This sum must be less or equal than the input available for DMU1. Each 𝜆𝑗 is applied to
compute the location of an inefficient DMU if it were to become efficient. The maximization problem
is solved as many times as DMUs in the sample.
Our empirical approach uses two outputs (and three formulations: pass rates, distinctions and flows)
and four inputs (Table 8.1). Note that both inputs and outputs must be positive. We estimate the model
using a radial measure of technical efficiency and variable returns to scale (VRS).
Table 8.1. Data Envelopment Analysis (DEA) specification
Outputs Inputs
Pass rates y11 pass rates for year 2015 x1 student teacher ratio
y12 pass rates for year 2016 x2 student PC ratio
y21 pass rates with distinction for year 2015 x3 teacher PC ratio
y22 pass rates with distinction for year 2016 x4 school infrastructure
Flows y31 cohort completion rates (2013 - 2017)
y32 promotion rate (100 - dropout - repetition)
Notes: (1) Pass rates refer to the exam at grade 11. (2) School infrastructure is calculated as the student’s ratio for the following
infrastructure items: number of laboratories, number vehicles, number of students per dormitory and number of in use toilets.

41
As explained above, through DEA we estimate technical efficiency, that is, we are able to find which
schools falls into the set of efficient schools. This is the first part of the argument: finding schools
located in the set TE of Figure 4.1 (see Section 4). We discuss the other set of efficiency, cost efficiency,
and the overlap of the two types of efficiency below.
8.1. Cost efficiency
Achieving learning outcomes implies some unit cost for a school composed by the teaching workforce
payments and the expenditure related to infrastructure of the school. This total cost can be transformed
into a unit cost by dividing by the total enrolment of the school. If a school achieves a given value of
learning outcomes (say, a pass rates) at a higher cost than a comparable school, then it can be said that
this schools is cost inefficient. Alternatively, if the school achieves the same level of learning outcome
at a lower cost, then it can be said the school is cost efficient.
It should be noted that, here, we are not dealing with the issue of technical efficiency (which is provided by the DEA) as we only focus on cost and learning outcomes. Here we are focusing on the efficiency
of DMU (schools) in the set describe by CE in Figure 4.1; this set can or cannot overlap with the group
of technical efficient DMU (schools).
Another definition, beyond comparison at the same level of cost or the same level of learning outcomes
across schools to establish whether a school is either cost efficient or not, is how the degree of cost
efficiency varies across schools that spend more or less. That is, what is cost efficiency gradient
(increase of learning over unit increase on costs) across the distribution of costs. This is important from
the point of view of finding at which level of (unit cost) further increase do not contribute to larger cost
efficiency because of decreasing returns to school expansion activities.
Figure 8.2 Cost efficiency
Figure 8.2 presents these different cost efficiency scenarios. We plotted 15 schools, 5 for 3 different
school types (each type denoted by circles, squares and triangles). The y-axis represents pass rates and
the x-axis unit total cost. School A is more cost efficient than school B as it reaches the same level of
pass rate P1 but a lower unit cost (the difference of C1 minus C0). The cost efficiency here is CE1 (and
Pass rates
Unit cost
0
1
school type 3
school type 2
school type 1
C0 C1
P0
P1
CE0 CE1
C*
cost gradient
A B
C

42
in relative terms CE1/ C1). Likewise, school A is more cost efficient than school C because it obtains
at the same cost C0 a larger pass rates (the difference between P1 and P0). The cost efficiency here is
CE0 (and relatively as a ratio CE0/P1). Additionally, looking at school of type 1 (hollow circles) we
can see that increasing unit cost leads to larger pass rates. But the increase on pass rates for unit increase
of costs (the gradient) diminishes from the level of unit cost C*. Hence, it is not cost efficient for schools
with a profile of cost as those from school type 1 to incur in unit cost above this threshold. The figure
also shows that school type 2 are the less efficient (e.g. same pass rate but larger cost than school type
3, bottom right of figure).
8.2. Technical efficiency and cost efficiency
Here we present how one could empirically find those schools which are technically efficient and cost
efficient at the same time. These schools are shown by the intersection of the TE set and the CE (Figure
4.1) and shows cases where affordable efficiency increases can be located. These are cases like school
A (Figure 8.2) with estimate technical efficiency on the frontier of maximum possibilities given the set
of outputs (𝛿 = 1).
Figure 8.3. Technical and cost efficiency
Figure 8.3 includes a scatter plot of the estimate efficiency score for each school alongside the unit cost
for each school. Recall that 𝛿=1 are technically efficient schools, in the frontier, and when 𝛿 tends to
zero schools are less efficient. Ideally all schools would like to move toward the region TE+CE where
technical and cost efficient are achieved, because the score of efficiency is high (above 𝛿 high) and the
unit cost is low (below C0). Note that the same comparison by either fixing a level of efficiency score
and comparing costs across schools or fixing the unit cost and compare efficiency score permits to
identify cases where either one or both type of efficiency can be raised in parallel.
.
Efficiency
score
𝛿 = 1 Efficient schools (production frontier)
𝛿 = 0 Inefficient
schools
0.50
C0 C1 (mean cost) C2
𝛿 high
𝛿 low
TE + CE
Cost efficiency
Tech
nic
al
eff
icie
ncy

43
9. Appendix 2. Questionnaire

1

2

3

4

5

6

7
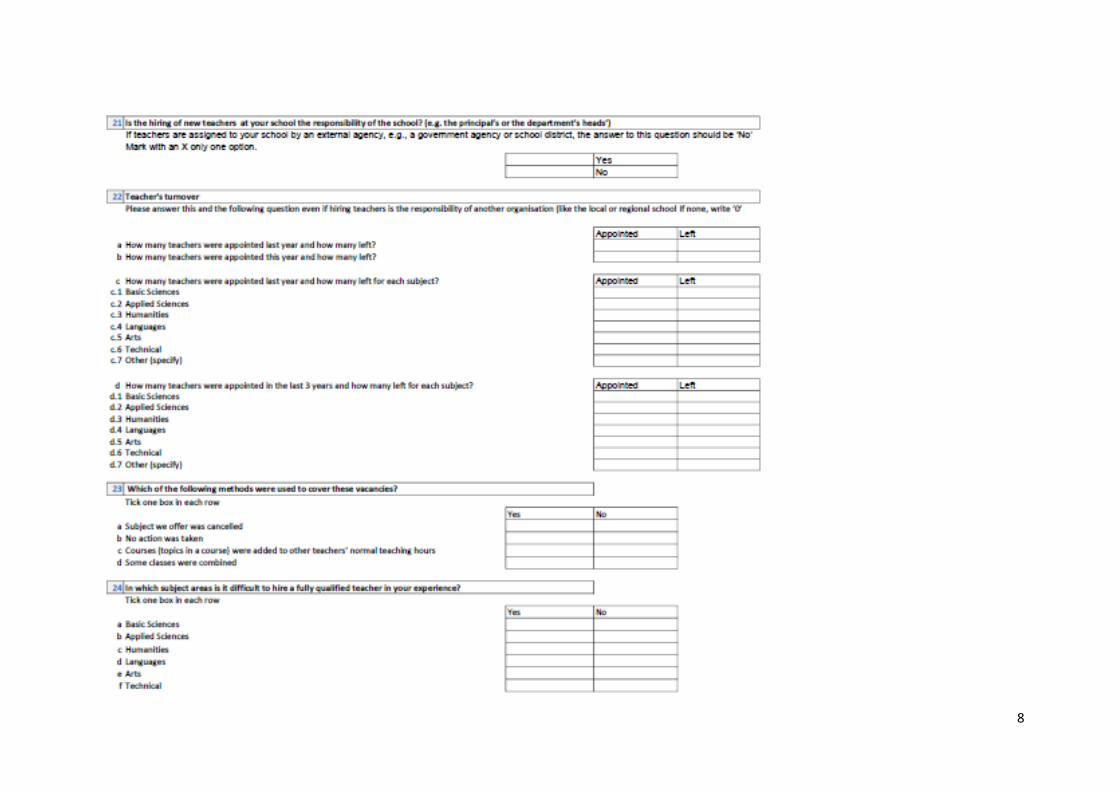
8

9

10
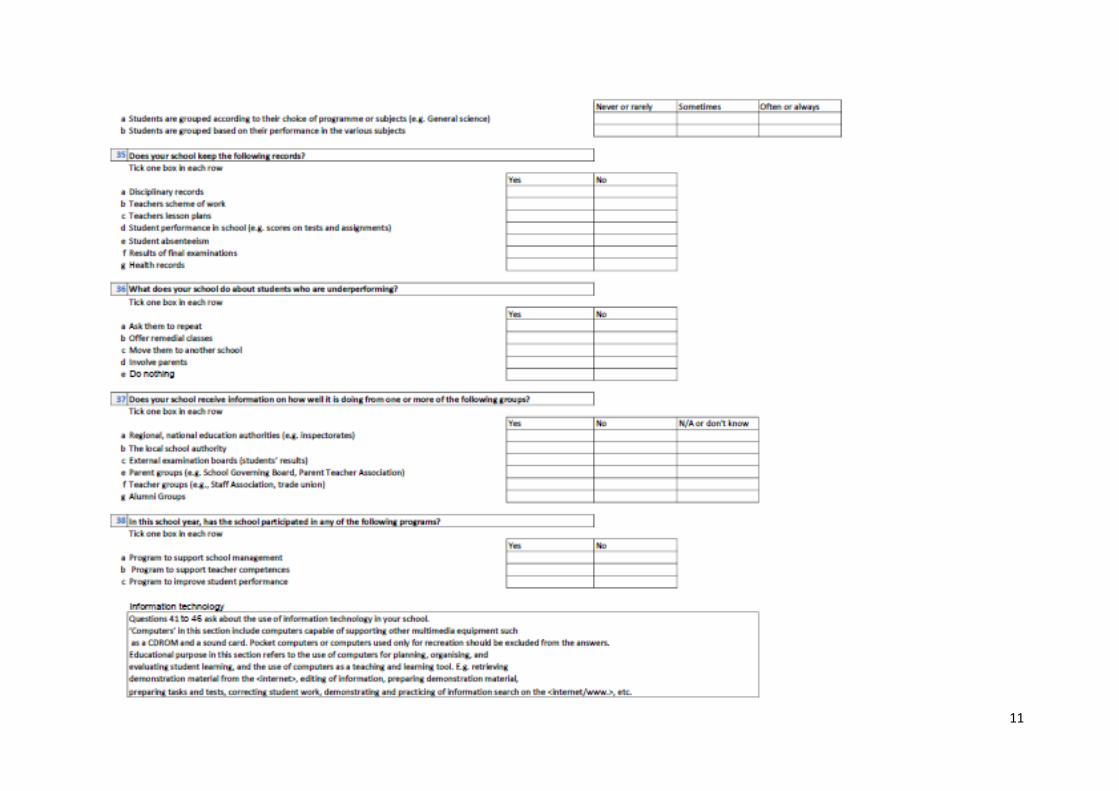
11

12

13

14

15

16

17