Embed Size (px)
Citation preview
Preparing Power Distribution for “Smart” CitiesSharing our learnings…
1
Torrent Power Limited | 28 Jan 2016 | New Delhi
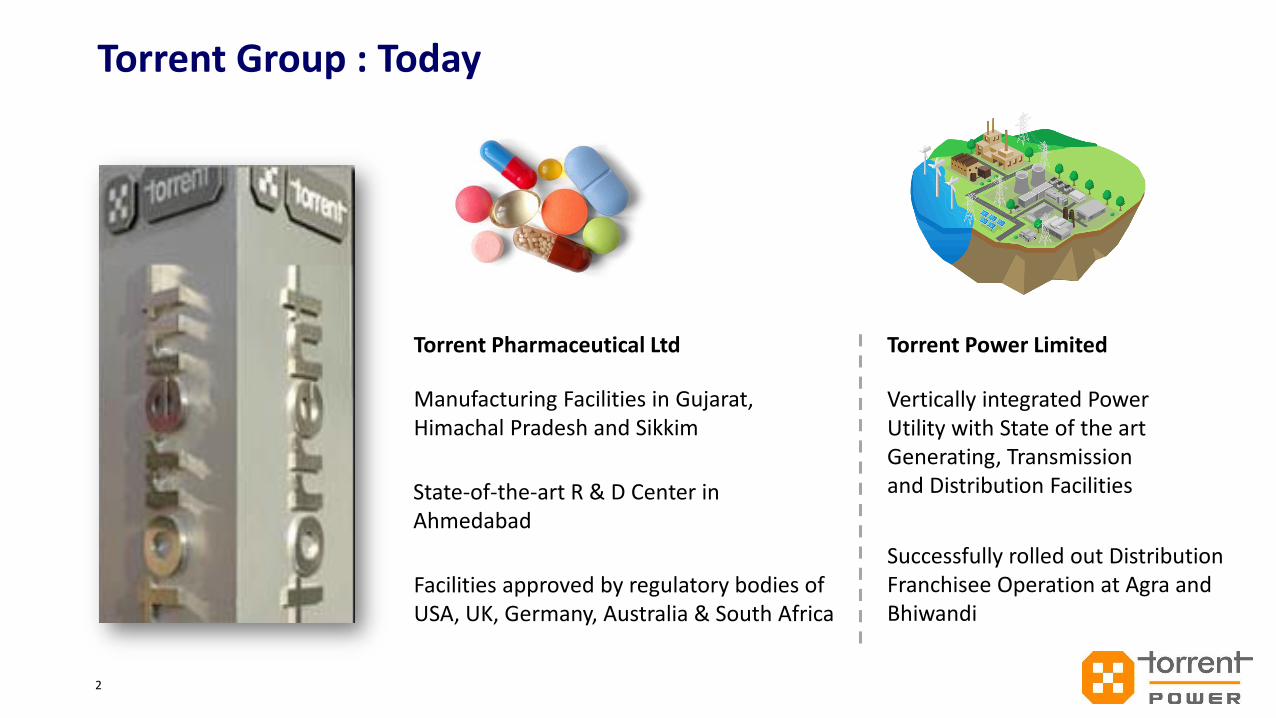
Torrent Group : Today
2
Torrent Pharmaceutical Ltd Torrent Power Limited
Manufacturing Facilities in Gujarat, Himachal Pradesh and Sikkim
State-of-the-art R & D Center in Ahmedabad
Facilities approved by regulatory bodies of USA, UK, Germany, Australia & South Africa
Vertically integrated Power Utility with State of the art Generating, Transmission and Distribution Facilities
Successfully rolled out Distribution Franchisee Operation at Agra and Bhiwandi
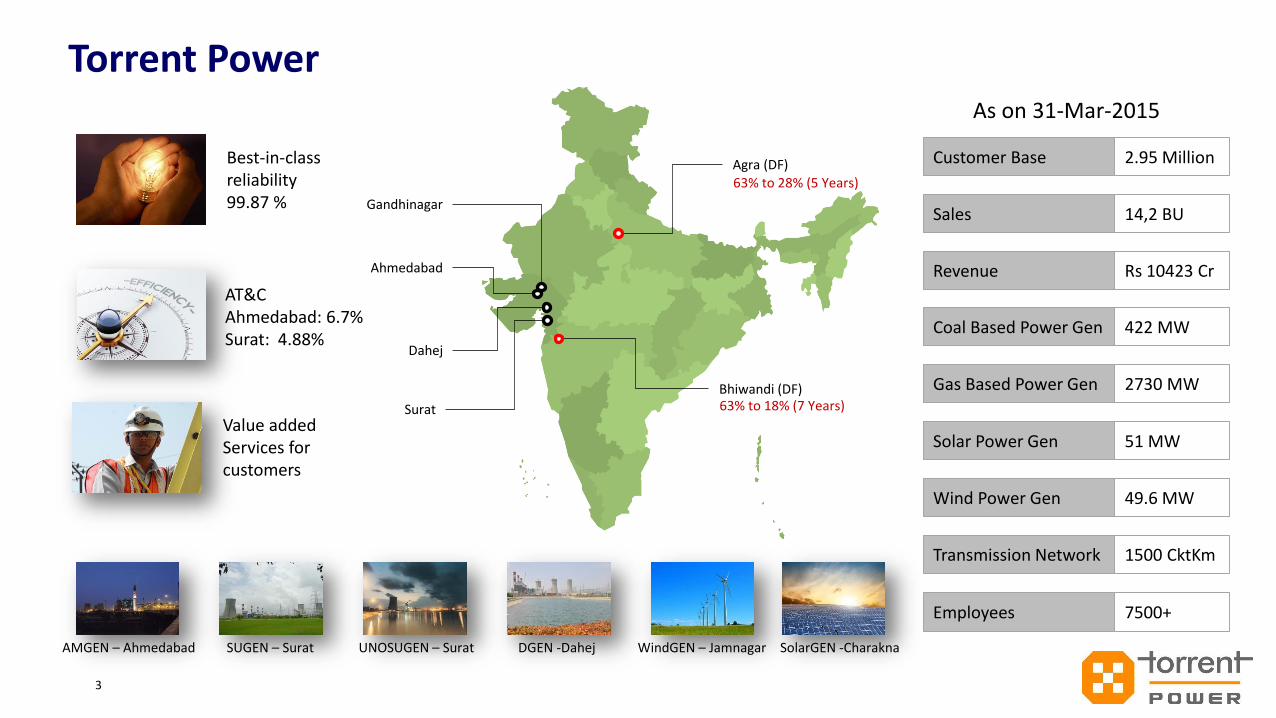
Torrent Power
3
Gandhinagar
Surat
Dahej
Ahmedabad
Agra (DF)
Bhiwandi (DF)
2.95 MillionCustomer Base
14,2 BUSales
Rs 10423 CrRevenue
422 MWCoal Based Power Gen
2730 MWGas Based Power Gen
51 MWSolar Power Gen
49.6 MWWind Power Gen
1500 CktKmTransmission Network
As on 31-Mar-2015
AMGEN – Ahmedabad WindGEN – JamnagarSUGEN – Surat SolarGEN -CharaknaUNOSUGEN – Surat DGEN -Dahej
Best-in-class reliability 99.87 %
AT&C Ahmedabad: 6.7%Surat: 4.88%
Value added Services for customers
63% to 28% (5 Years)
63% to 18% (7 Years)
7500+Employees
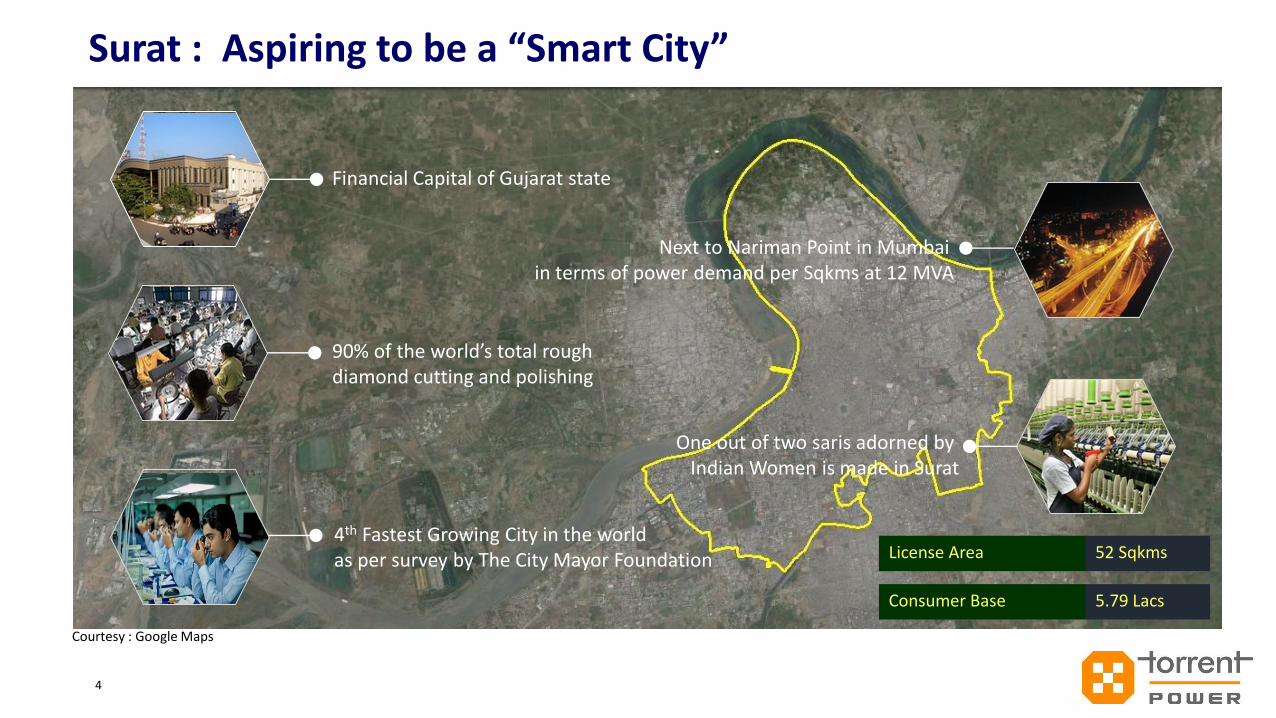
Surat : Aspiring to be a “Smart City”
4
Courtesy : Google Maps
Financial Capital of Gujarat state
90% of the world’s total rough diamond cutting and polishing
Next to Nariman Point in Mumbai in terms of power demand per Sqkms at 12 MVA
One out of two saris adorned by Indian Women is made in Surat
4th Fastest Growing City in the worldas per survey by The City Mayor Foundation License Area 52 Sqkms
Consumer Base 5.79 Lacs
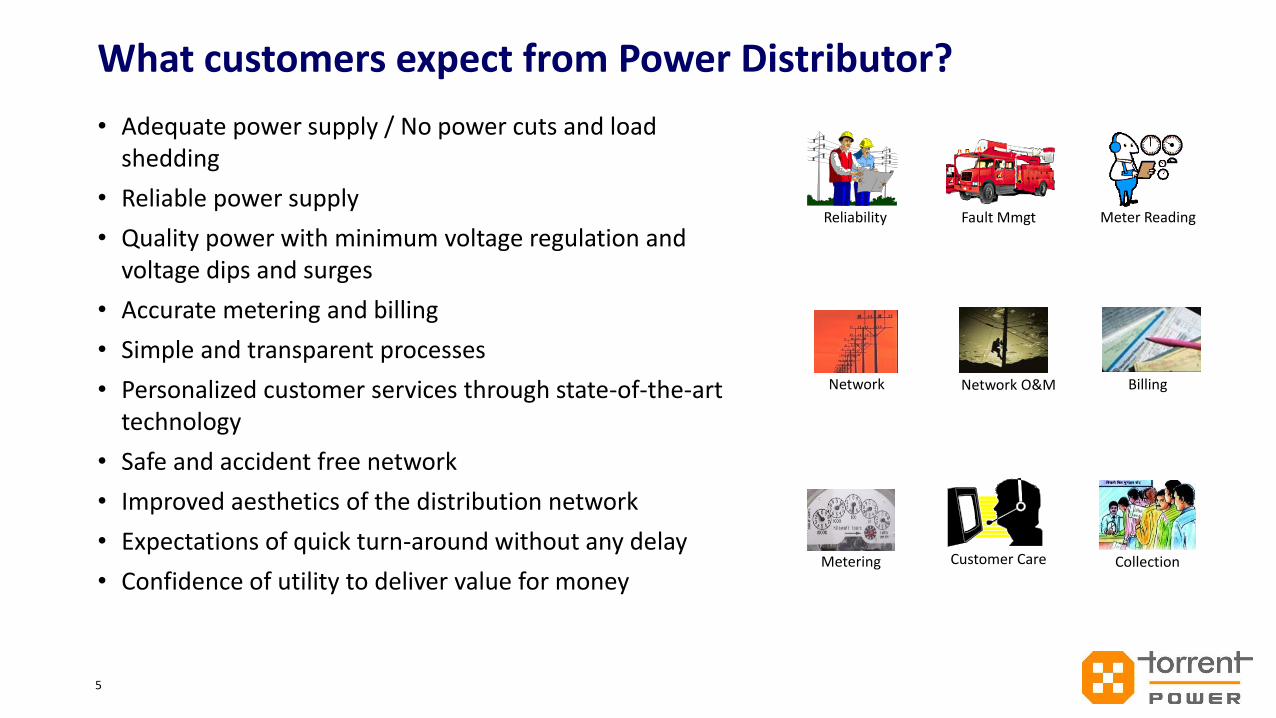
What customers expect from Power Distributor?
• Adequate power supply / No power cuts and load shedding
• Reliable power supply
• Quality power with minimum voltage regulation and voltage dips and surges
• Accurate metering and billing
• Simple and transparent processes
• Personalized customer services through state-of-the-art technology
• Safe and accident free network
• Improved aesthetics of the distribution network
• Expectations of quick turn-around without any delay
• Confidence of utility to deliver value for money
5
Reliability
Network
Metering
Fault Mmgt
Customer Care
Network O&M
Meter Reading
Billing
Collection
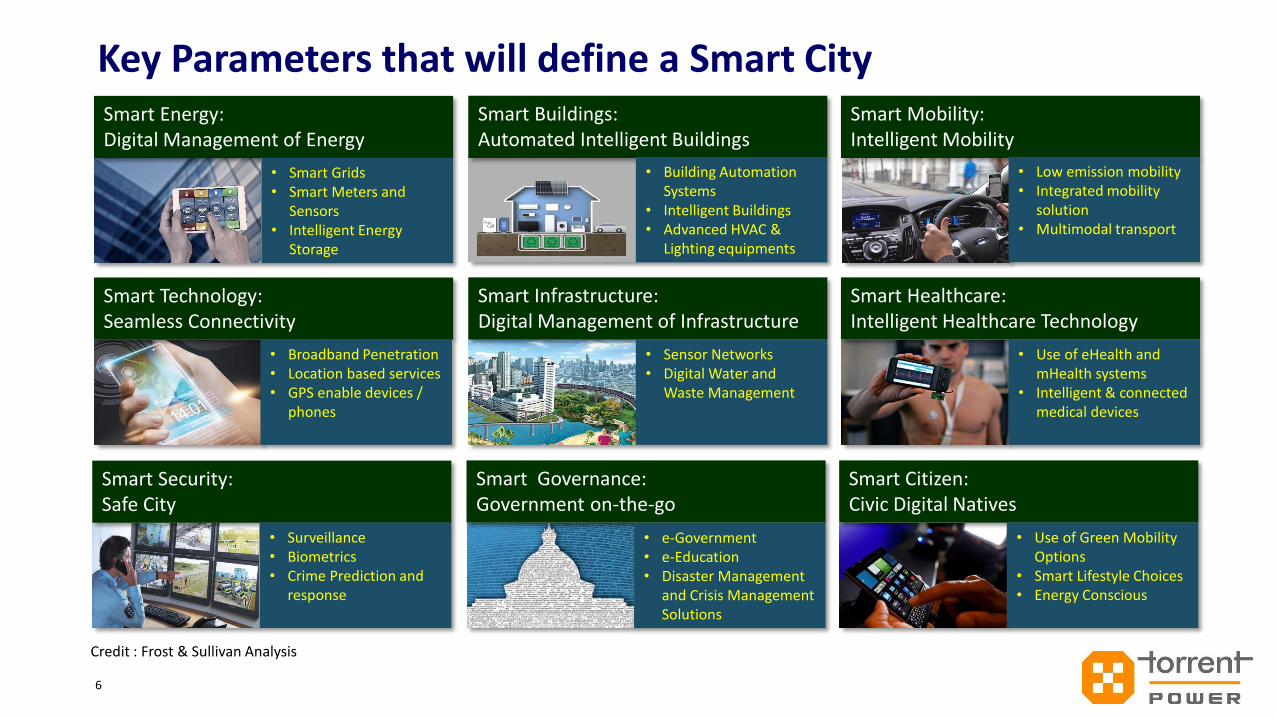
Key Parameters that will define a Smart City
6
Smart Technology: Seamless Connectivity
• Broadband Penetration• Location based services• GPS enable devices /
phones
Smart Infrastructure: Digital Management of Infrastructure
• Sensor Networks• Digital Water and
Waste Management
Smart Healthcare: Intelligent Healthcare Technology
• Use of eHealth and mHealth systems
• Intelligent & connected medical devices
Smart Security: Safe City
• Surveillance• Biometrics• Crime Prediction and
response
Smart Citizen: Civic Digital Natives
• Use of Green Mobility Options
• Smart Lifestyle Choices• Energy Conscious
Smart Governance: Government on-the-go
• e-Government• e-Education• Disaster Management
and Crisis Management Solutions
Smart Energy: Digital Management of Energy
• Smart Grids• Smart Meters and
Sensors• Intelligent Energy
Storage
Smart Buildings: Automated Intelligent Buildings
• Building Automation Systems
• Intelligent Buildings• Advanced HVAC &
Lighting equipments
Smart Mobility: Intelligent Mobility
• Low emission mobility• Integrated mobility
solution• Multimodal transport
Credit : Frost & Sullivan Analysis
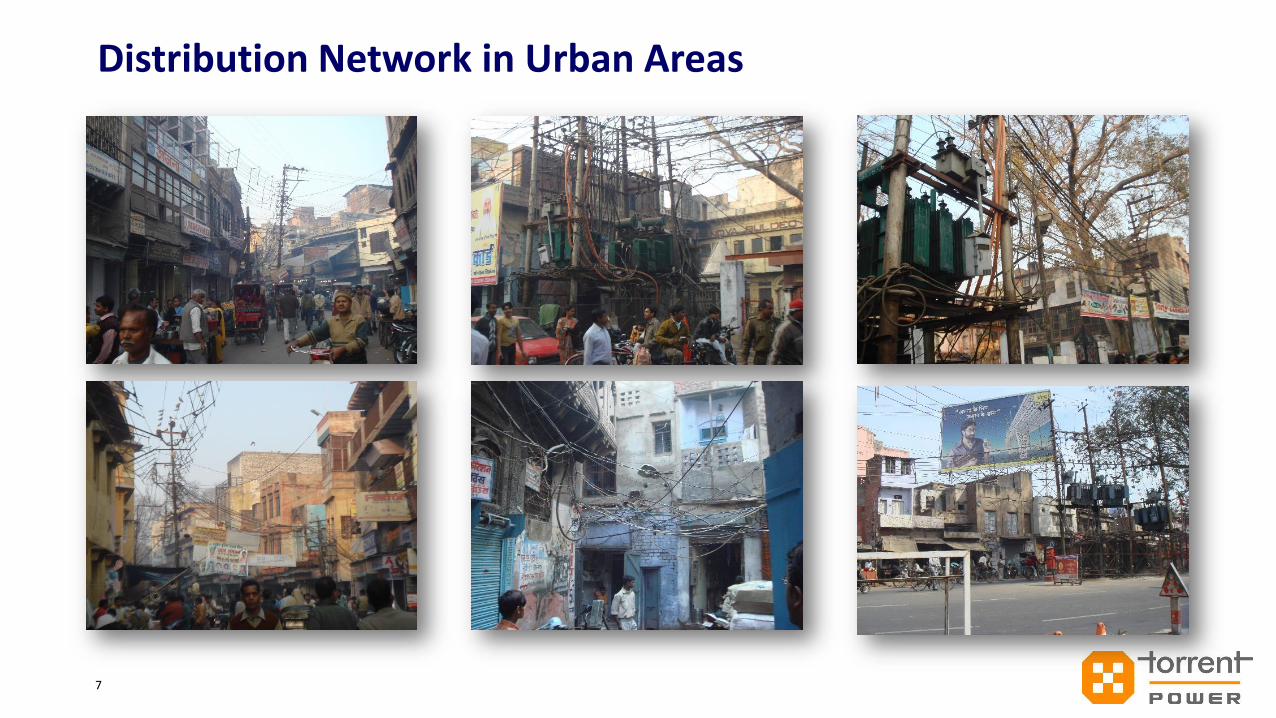
Distribution Network in Urban Areas
7
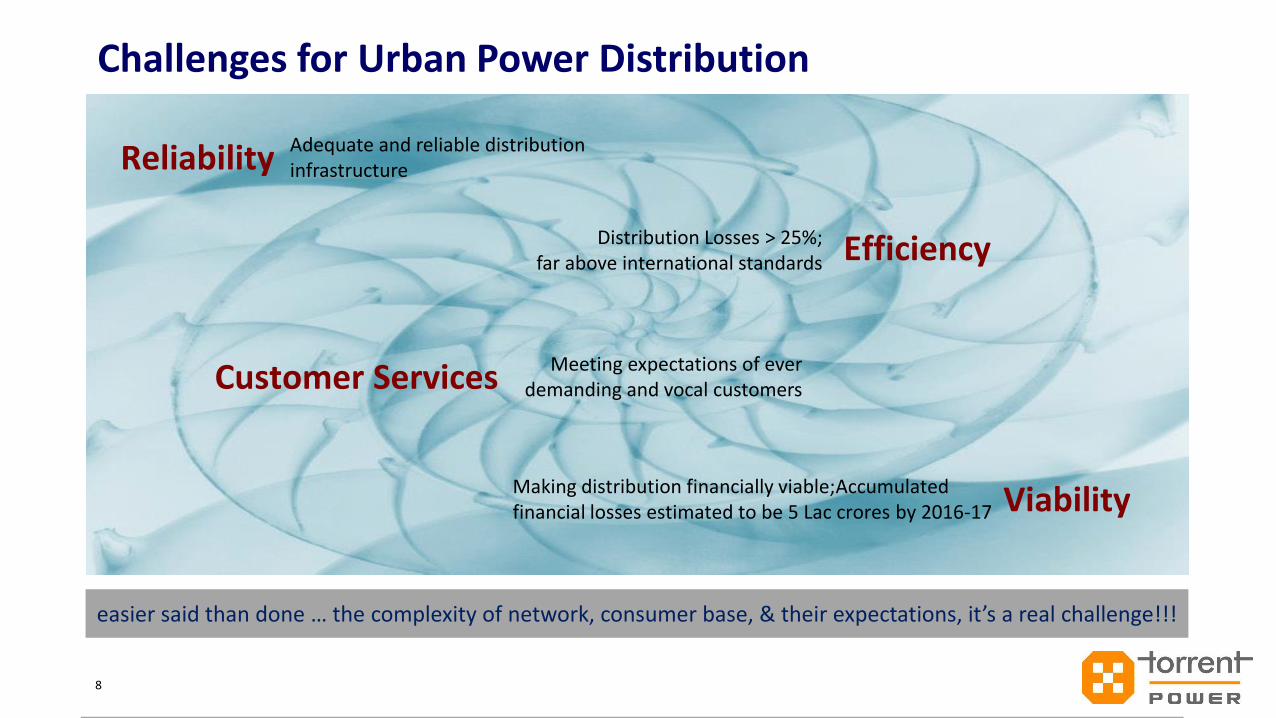
Challenges for Urban Power Distribution
8
Viability
Efficiency
Making distribution financially viable;Accumulated financial losses estimated to be 5 Lac crores by 2016-17
Distribution Losses > 25%; far above international standards
Adequate and reliable distribution infrastructure
Meeting expectations of ever demanding and vocal customers
Reliability
Customer Services
easier said than done … the complexity of network, consumer base, & their expectations, it’s a real challenge!!!
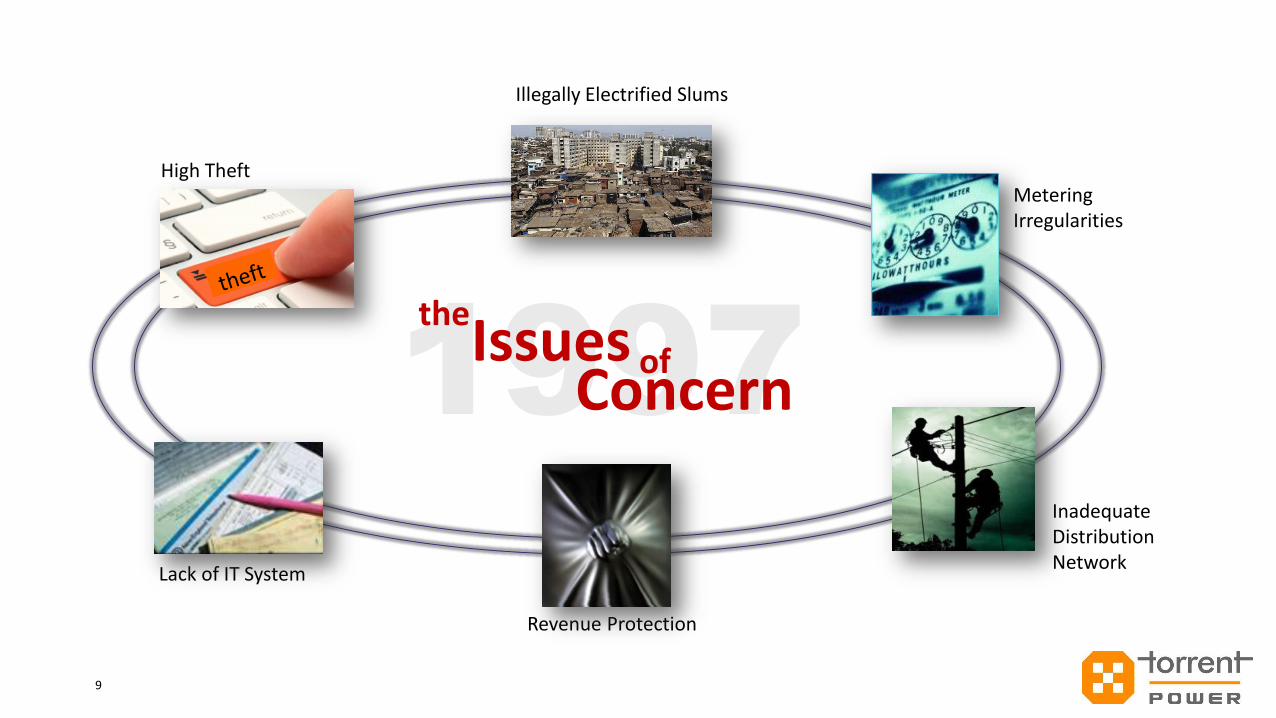
9
Lack of IT System
Revenue Protection
Metering Irregularities
Inadequate Distribution Network
High Theft
Illegally Electrified Slums
1997Issues
the
ofConcern
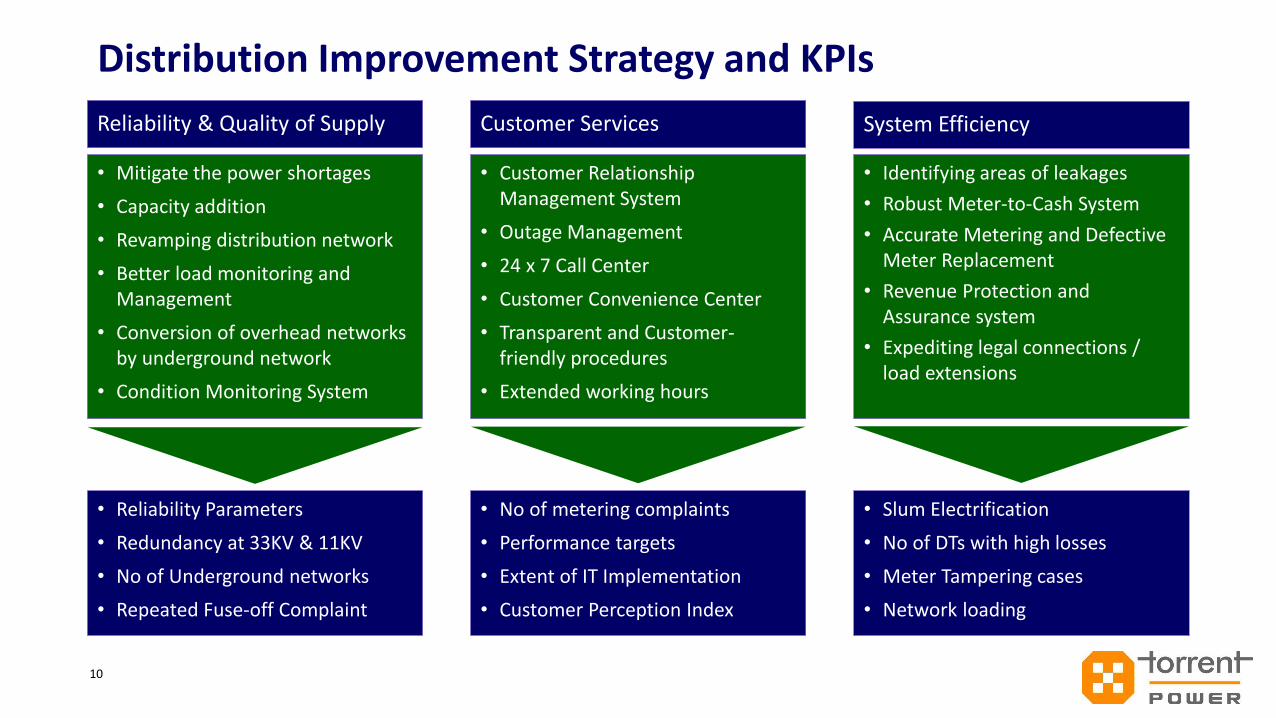
Distribution Improvement Strategy and KPIs
10
System Efficiency
• Identifying areas of leakages
• Robust Meter-to-Cash System
• Accurate Metering and Defective Meter Replacement
• Revenue Protection and Assurance system
• Expediting legal connections / load extensions
Reliability & Quality of Supply
• Mitigate the power shortages
• Capacity addition
• Revamping distribution network
• Better load monitoring and Management
• Conversion of overhead networks by underground network
• Condition Monitoring System
Customer Services
• Customer Relationship Management System
• Outage Management
• 24 x 7 Call Center
• Customer Convenience Center
• Transparent and Customer-friendly procedures
• Extended working hours
• Slum Electrification
• No of DTs with high losses
• Meter Tampering cases
• Network loading
• Reliability Parameters
• Redundancy at 33KV & 11KV
• No of Underground networks
• Repeated Fuse-off Complaint
• No of metering complaints
• Performance targets
• Extent of IT Implementation
• Customer Perception Index
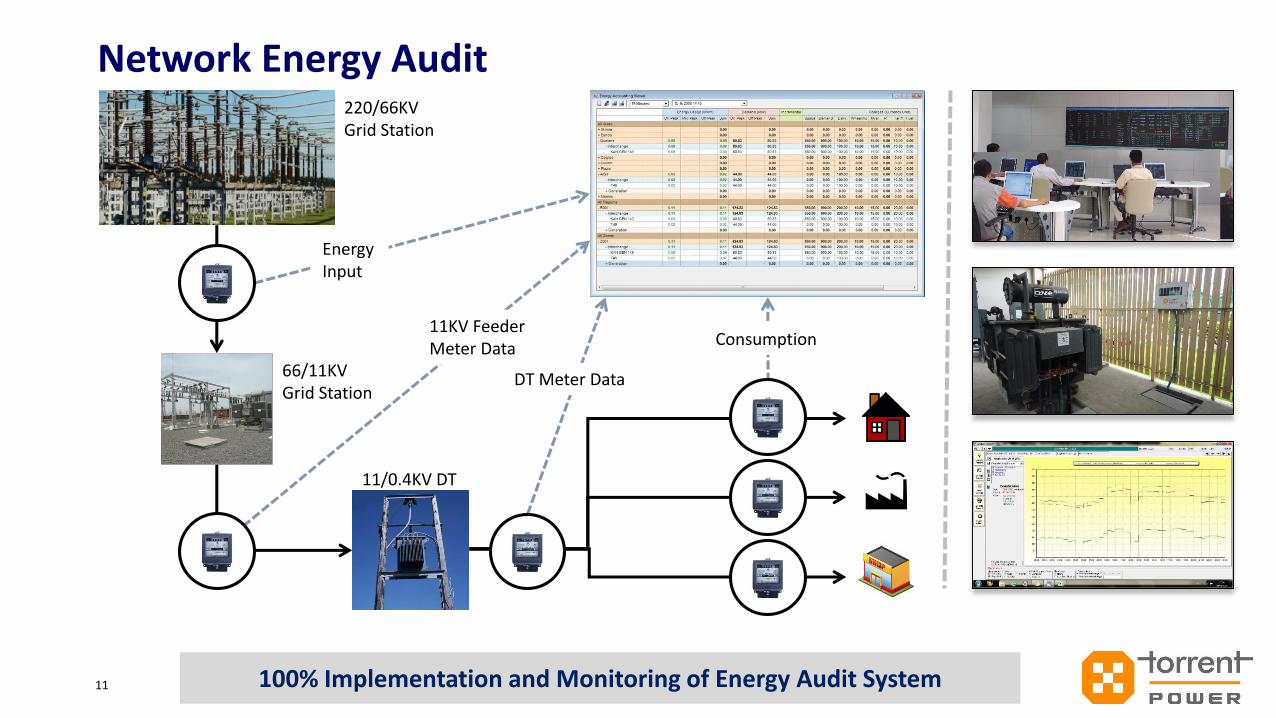
Network Energy Audit
11
220/66KVGrid Station
66/11KVGrid Station
11/0.4KV DT
Energy Input
11KV Feeder Meter Data
DT Meter Data
Consumption
100% Implementation and Monitoring of Energy Audit System
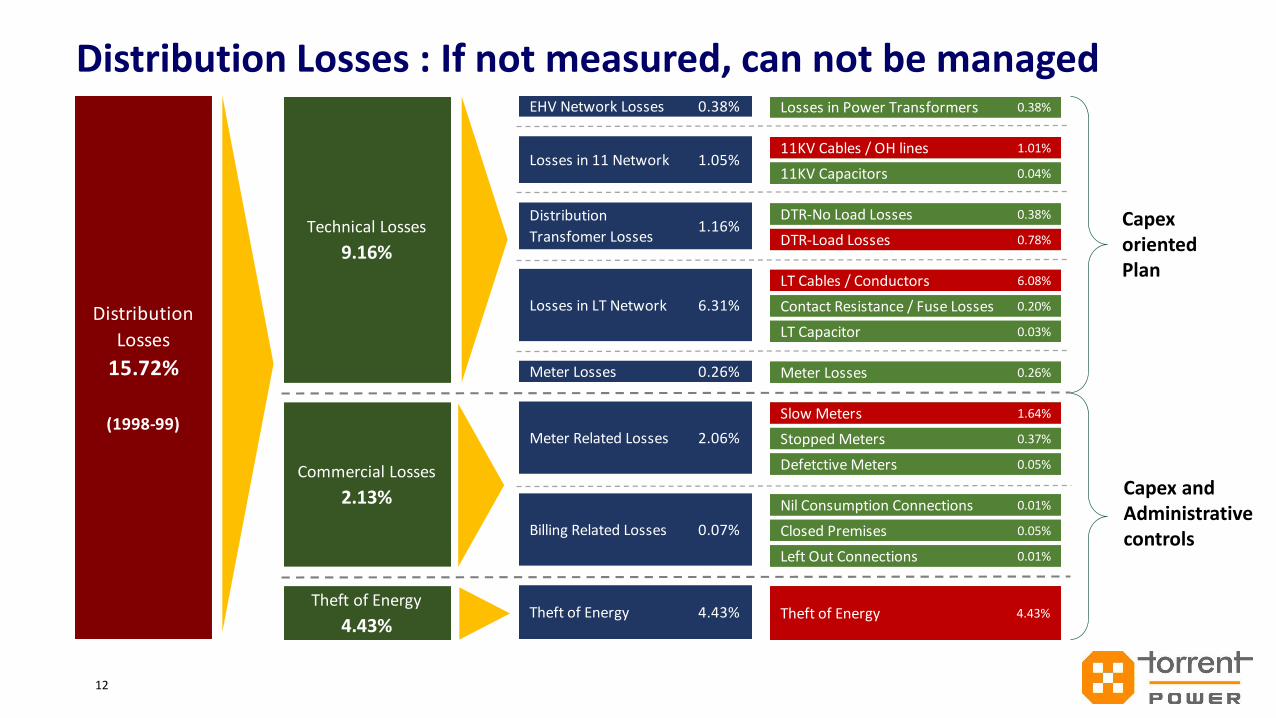
Distribution Losses : If not measured, can not be managed
12
Capex oriented Plan
Capex and Administrative controls
Theft of Energy
4.43%
Technical Losses
9.16%
Commercial Losses
2.13%
EHV Network Losses 0.38%
Meter Losses 0.26%
4.43%Theft of Energy
Meter Related Losses
Billing Related Losses
Losses in LT Network
Distribution
Transfomer Losses
Losses in 11 Network 1.05%
1.16%
6.31%
2.06%
0.07%
Losses in Power Transformers 0.38%
11KV Cables / OH lines 1.01%
11KV Capacitors 0.04%
DTR-No Load Losses 0.38%
DTR-Load Losses 0.78%
LT Cables / Conductors 6.08%
Contact Resistance / Fuse Losses 0.20%
LT Capacitor 0.03%
Meter Losses 0.26%
Slow Meters 1.64%
Stopped Meters 0.37%
Defetctive Meters 0.05%
Nil Consumption Connections 0.01%
Closed Premises 0.05%
Left Out Connections 0.01%
4.43%Theft of Energy
Distribution
Losses
15.72%
(1998-99)
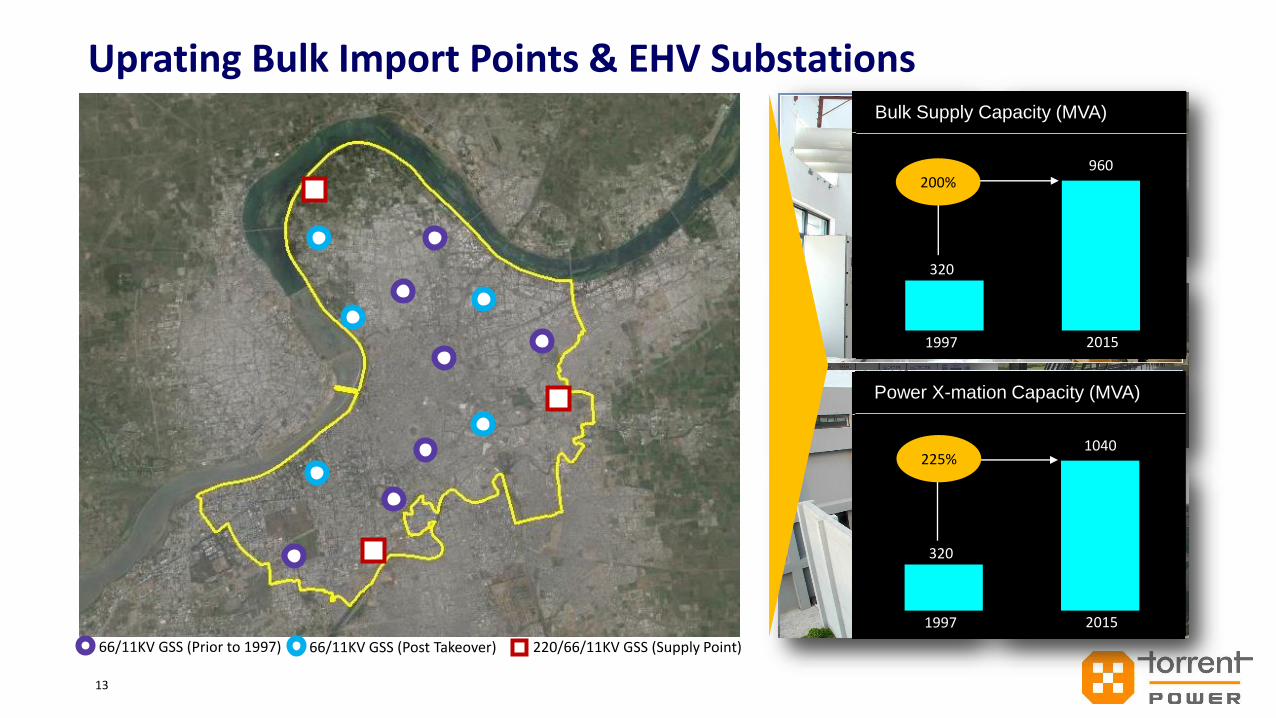
Uprating Bulk Import Points & EHV Substations
13
66/11KV GSS (Prior to 1997) 66/11KV GSS (Post Takeover) 220/66/11KV GSS (Supply Point)
Maximum Demand (MW)
1997 2015
274
629129%
No of Consumers (Lacs)
1997 2015
3.28
5.7977%
Bulk Supply Capacity (MVA)
1997 2015
320
960200%
Power X-mation Capacity (MVA)
1997 2015
320
1040225%
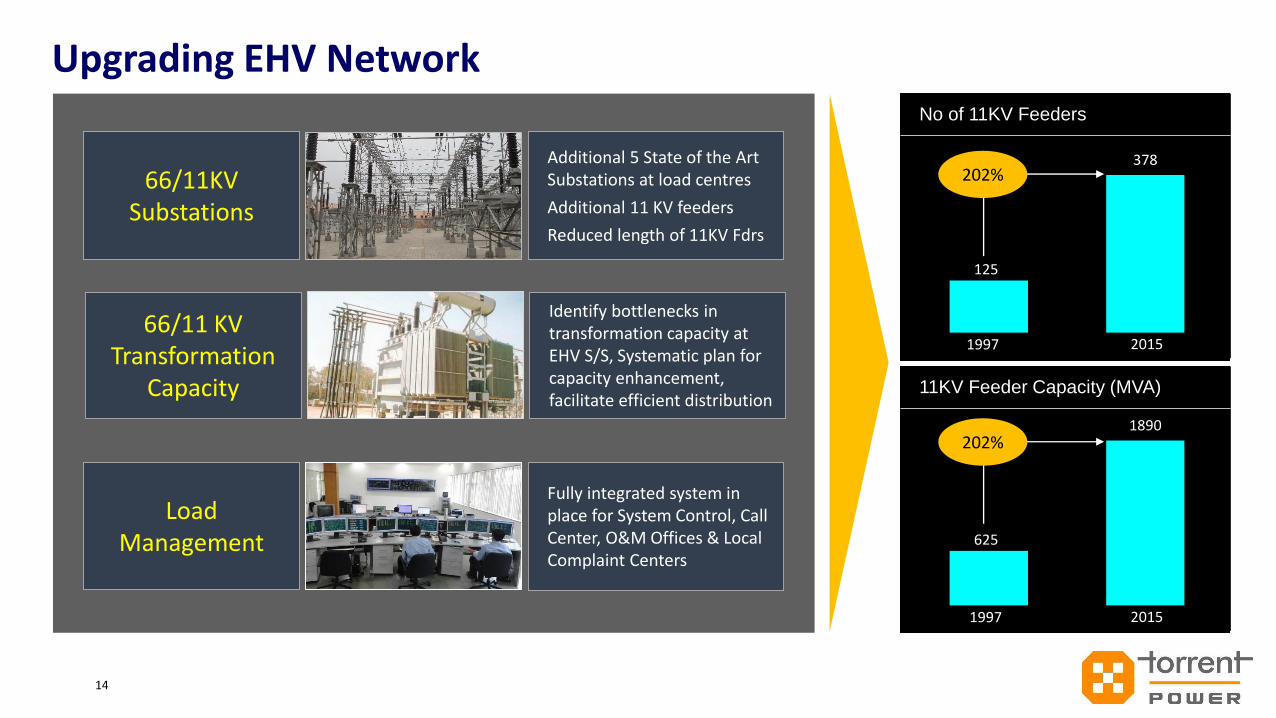
Upgrading EHV Network
14
Additional 5 State of the Art Substations at load centres
Additional 11 KV feeders
Reduced length of 11KV Fdrs
66/11KV Substations
Fully integrated system in place for System Control, Call Center, O&M Offices & Local Complaint Centers
Load Management
Identify bottlenecks in transformation capacity at EHV S/S, Systematic plan for capacity enhancement,facilitate efficient distribution
66/11 KV Transformation
Capacity
No of 11KV Feeders
1997 2015
125
378202%
11KV Feeder Capacity (MVA)
1997 2015
625
1890202%
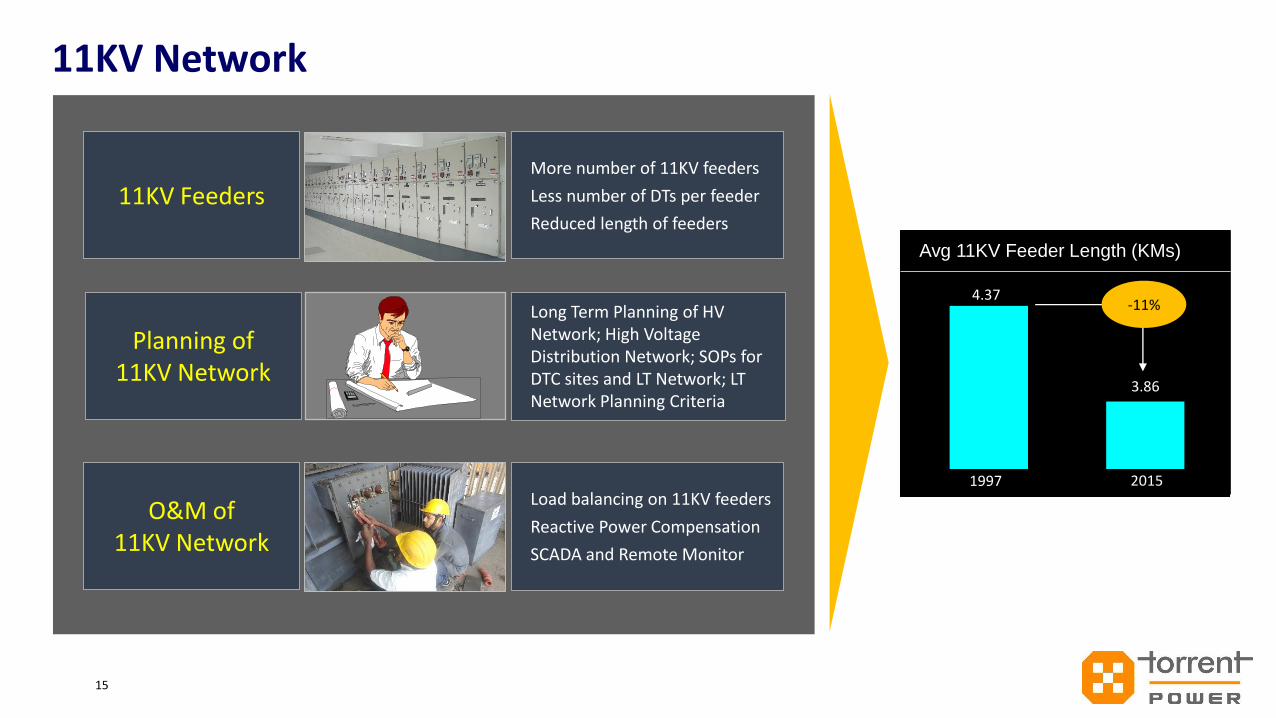
11KV Network
15
More number of 11KV feeders
Less number of DTs per feeder
Reduced length of feeders
11KV Feeders
Load balancing on 11KV feeders
Reactive Power Compensation
SCADA and Remote Monitor
O&M of 11KV Network
Long Term Planning of HV Network; High Voltage Distribution Network; SOPs for DTC sites and LT Network; LT Network Planning Criteria
Planning of 11KV Network
Avg 11KV Feeder Length (KMs)
1997 2015
4.37
3.86
-11%
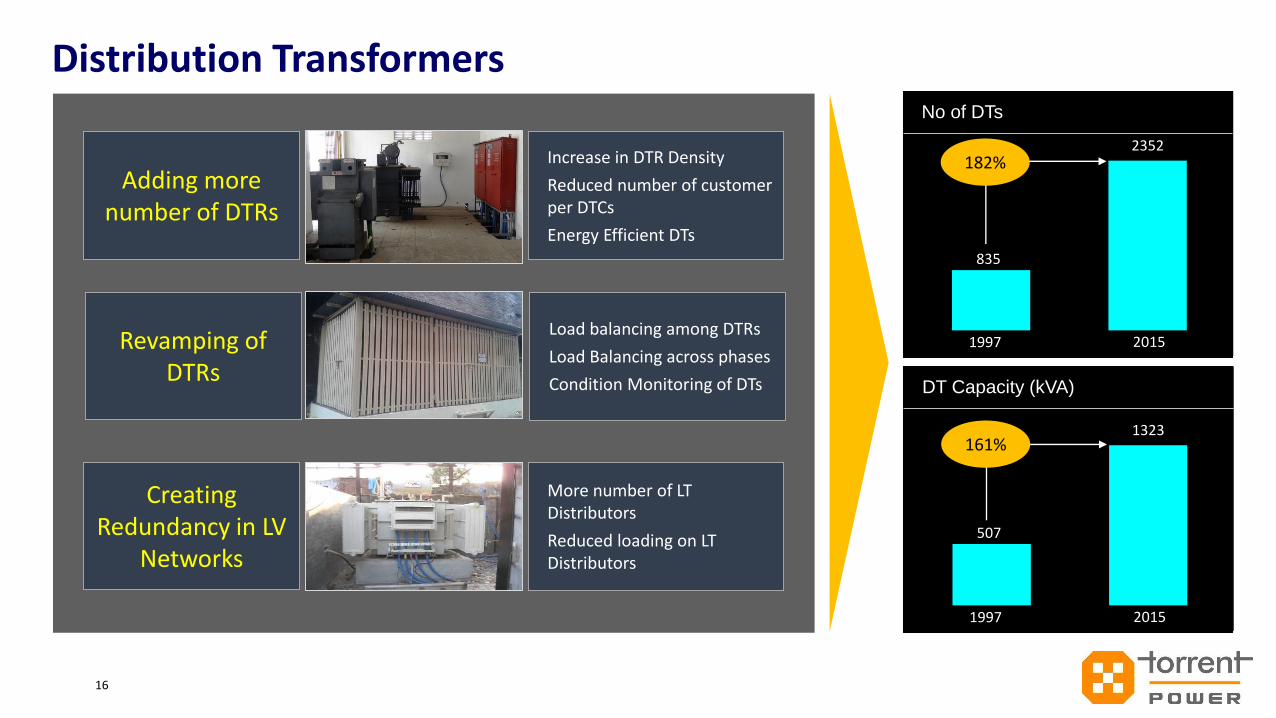
Distribution Transformers
16
Increase in DTR Density
Reduced number of customer per DTCs
Energy Efficient DTs
Adding more number of DTRs
More number of LT Distributors
Reduced loading on LT Distributors
Creating Redundancy in LV
Networks
Load balancing among DTRs
Load Balancing across phases
Condition Monitoring of DTs
Revamping of DTRs
No of DTs
1997 2015
835
2352182%
DT Capacity (kVA)
1997 2015
507
1323161%
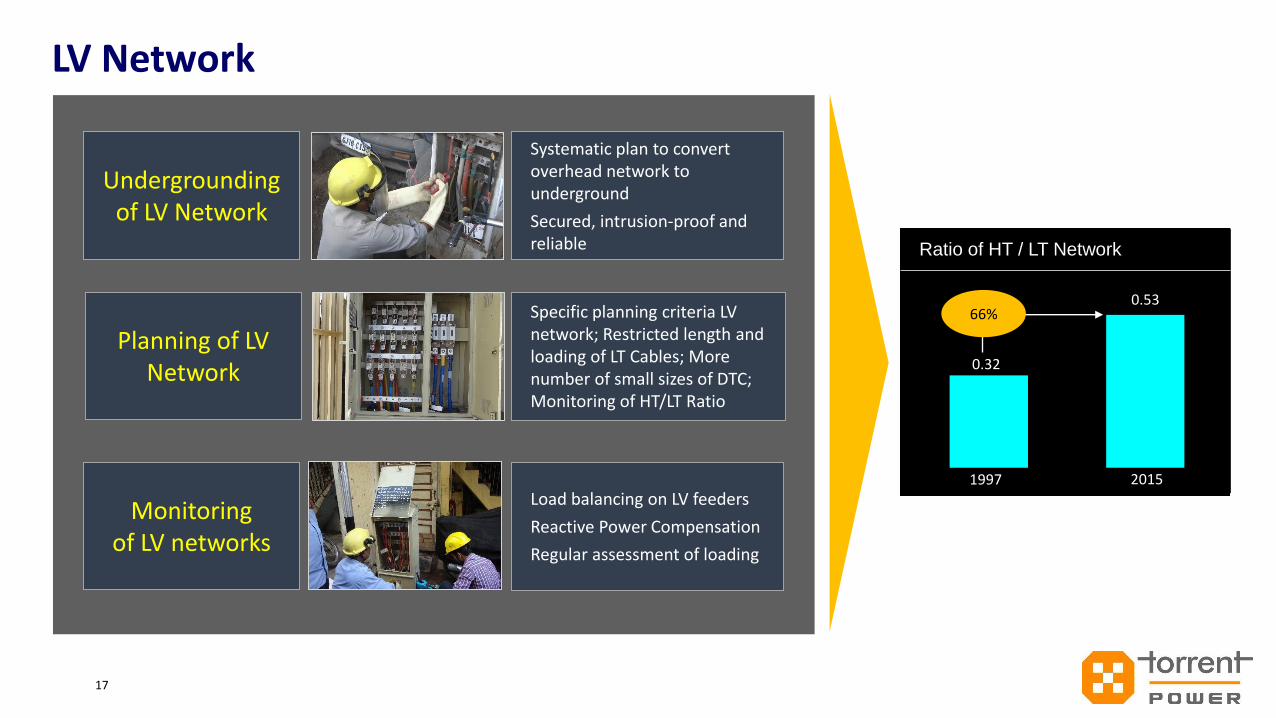
LV Network
17
Systematic plan to convert overhead network to underground
Secured, intrusion-proof and reliable
Undergrounding of LV Network
Load balancing on LV feeders
Reactive Power Compensation
Regular assessment of loading
Monitoring of LV networks
Specific planning criteria LV network; Restricted length and loading of LT Cables; More number of small sizes of DTC; Monitoring of HT/LT Ratio
Planning of LV Network
2008 2010
Ratio of HT / LT Network
1997 2015
0.32
0.5366%
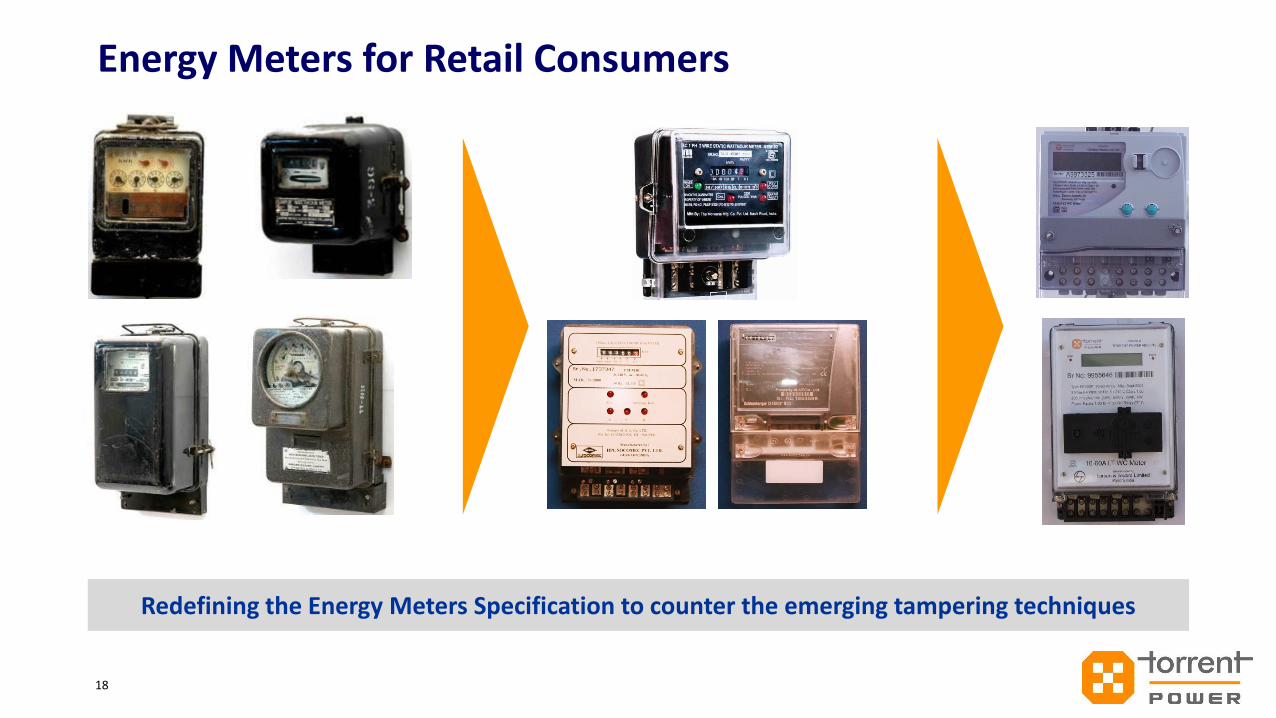
Energy Meters for Retail Consumers
18
Redefining the Energy Meters Specification to counter the emerging tampering techniques
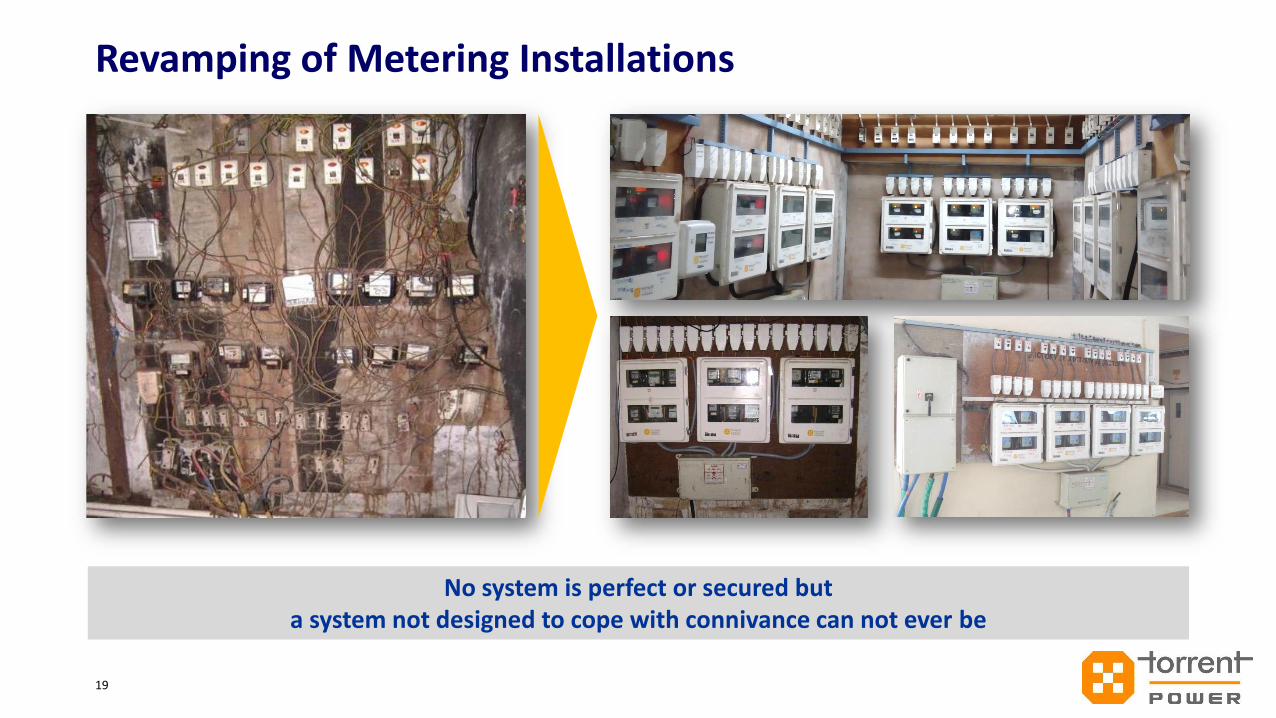
Revamping of Metering Installations
19
No system is perfect or secured but a system not designed to cope with connivance can not ever be
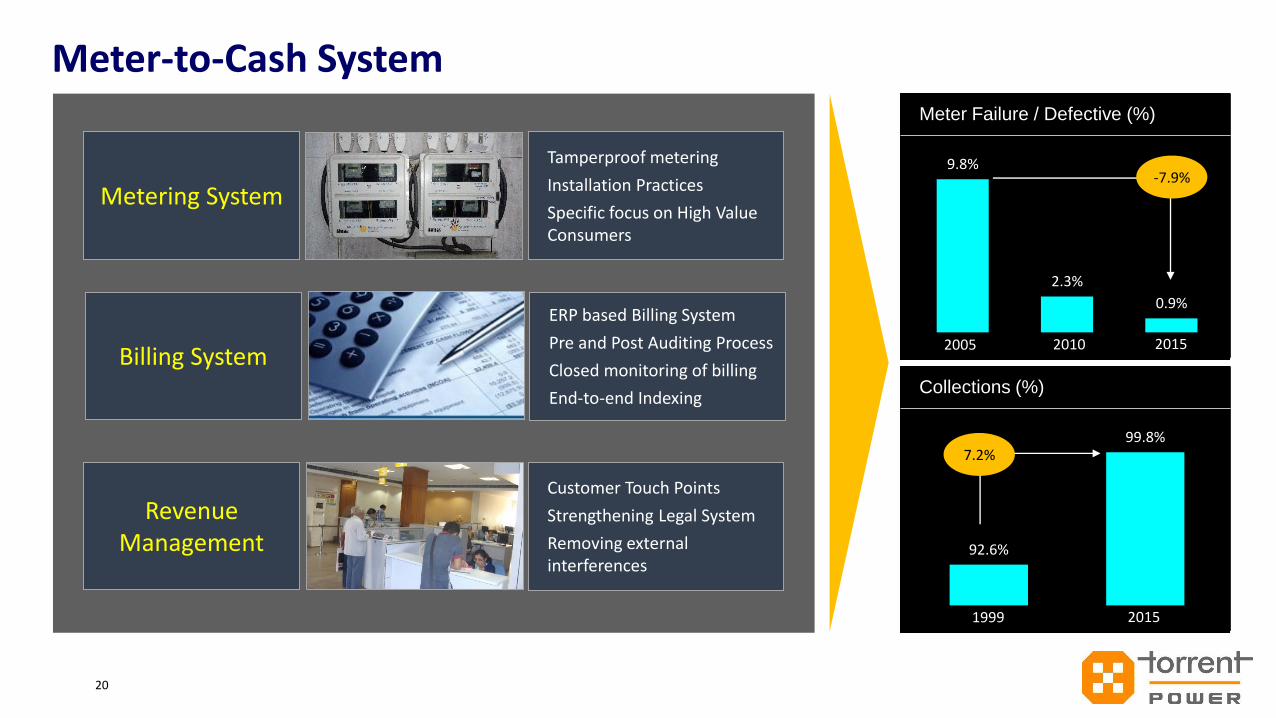
Meter-to-Cash System
20
Tamperproof metering
Installation Practices
Specific focus on High Value Consumers
Metering System
Customer Touch Points
Strengthening Legal System
Removing external interferences
Revenue Management
ERP based Billing System
Pre and Post Auditing Process
Closed monitoring of billing
End-to-end Indexing
Billing System
Meter Failure / Defective (%)
2015
9.8%
2.3%
0.9%
-7.9%
20102005
Collections (%)
2015
92.6%
99.8%7.2%
1999
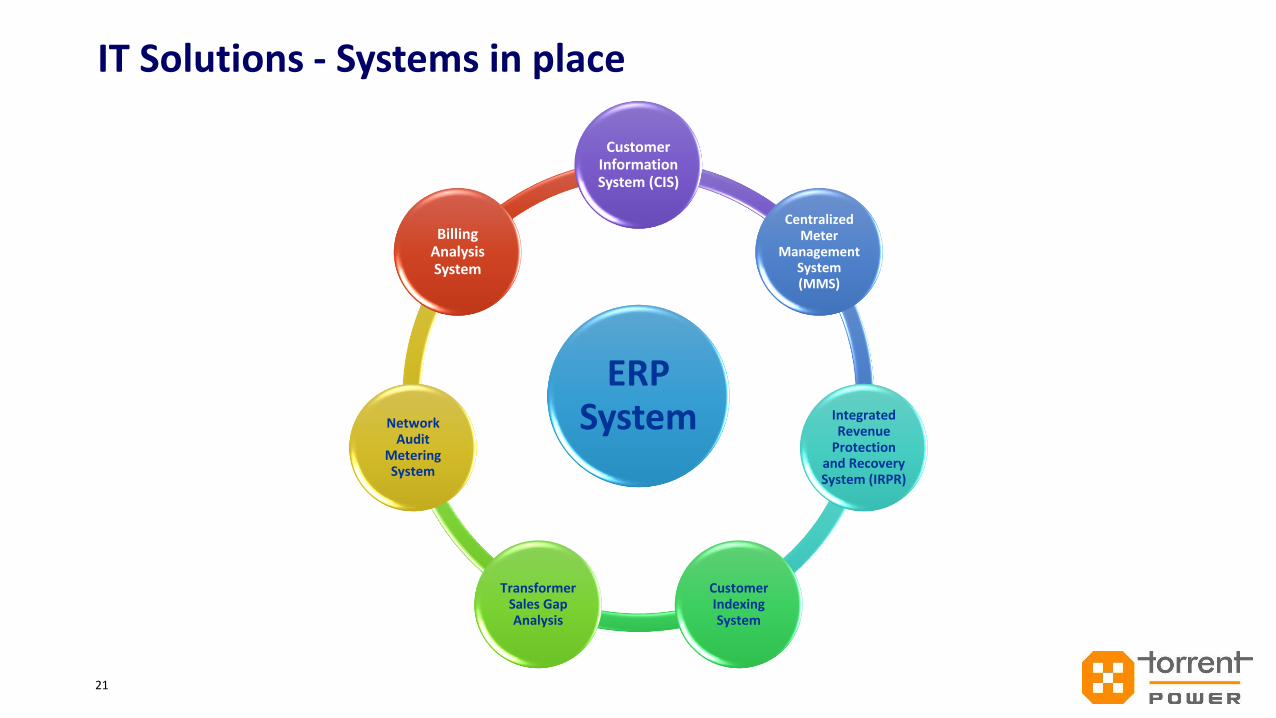
IT Solutions - Systems in place
21
ERP System
Customer Information System (CIS)
Centralized Meter
Management System (MMS)
Integrated Revenue
Protection and Recovery System (IRPR)
Customer Indexing System
Transformer Sales Gap Analysis
Network Audit
Metering System
Billing Analysis System
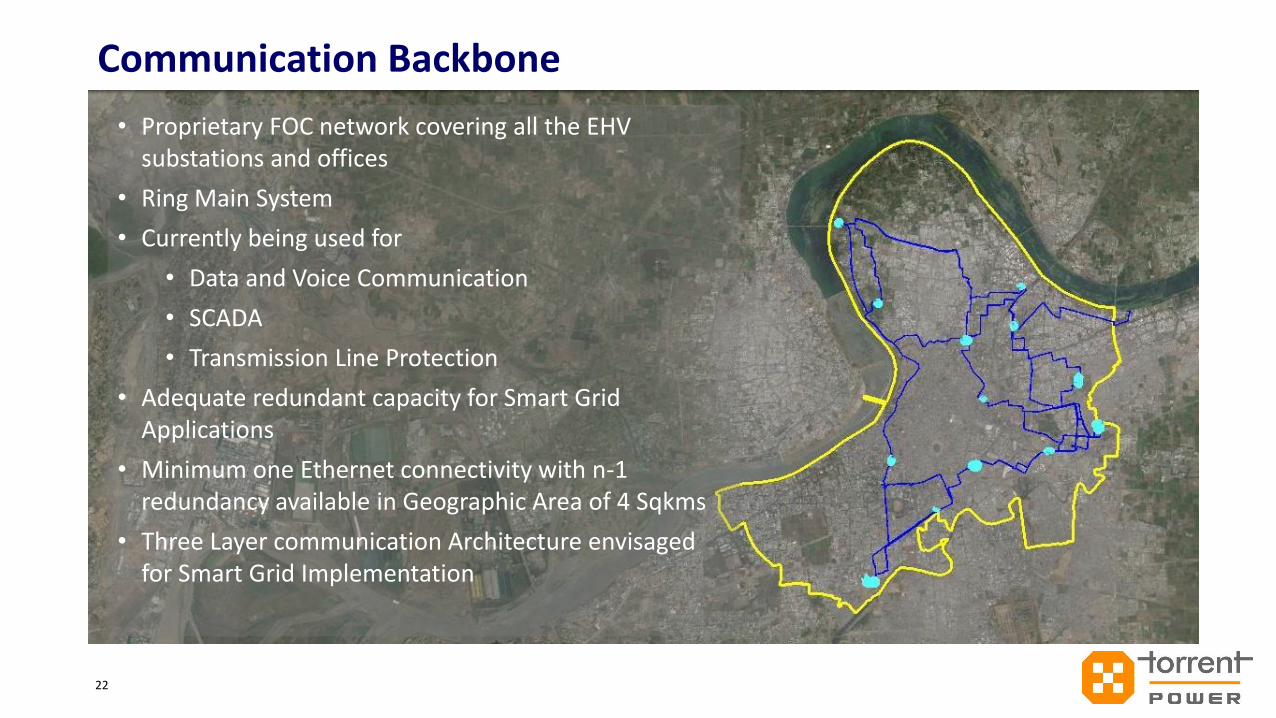
Communication Backbone
22
• Proprietary FOC network covering all the EHV substations and offices
• Ring Main System
• Currently being used for
• Data and Voice Communication
• SCADA
• Transmission Line Protection
• Adequate redundant capacity for Smart Grid Applications
• Minimum one Ethernet connectivity with n-1 redundancy available in Geographic Area of 4 Sqkms
• Three Layer communication Architecture envisaged for Smart Grid Implementation
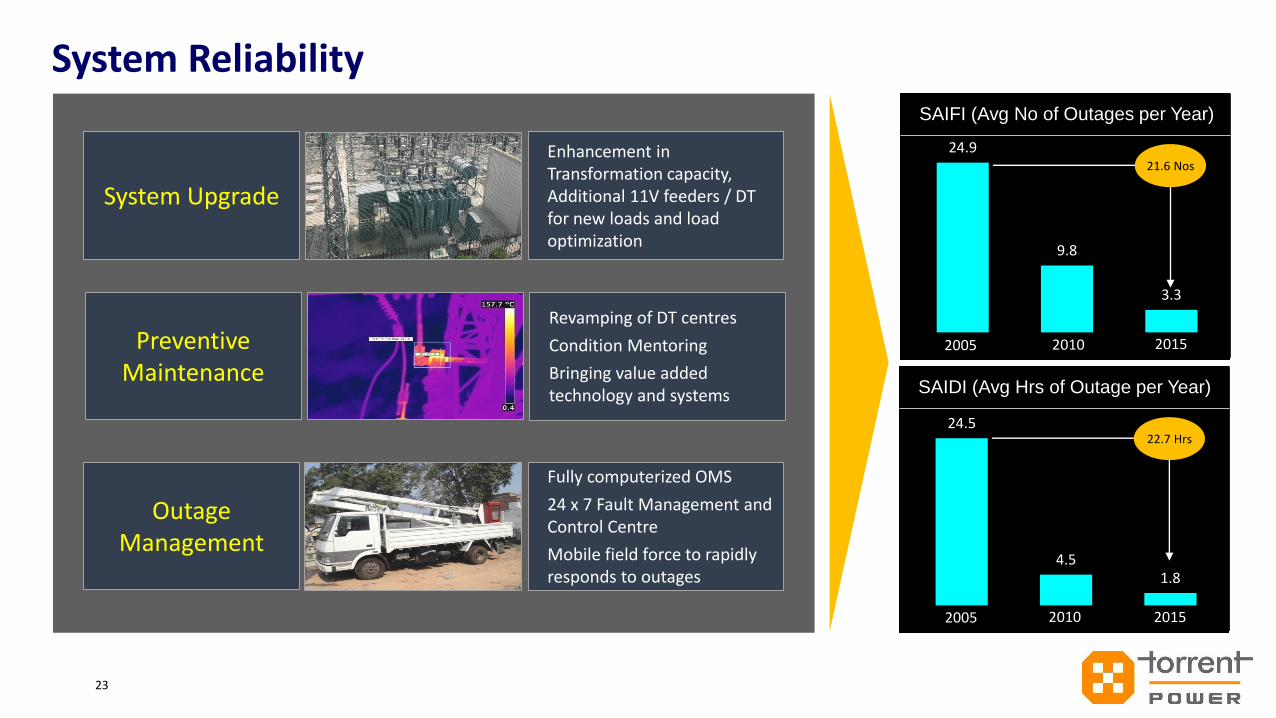
System Reliability
23
Enhancement in Transformation capacity, Additional 11V feeders / DT for new loads and load optimization
System Upgrade
Fully computerized OMS
24 x 7 Fault Management and Control Centre
Mobile field force to rapidly responds to outages
Outage Management
Revamping of DT centres
Condition Mentoring
Bringing value added technology and systems
Preventive Maintenance
SAIFI (Avg No of Outages per Year)
2015
24.9
9.8
3.3
21.6 Nos
SAIDI (Avg Hrs of Outage per Year)
2015
24.5
4.51.8
22.7 Hrs
2005 2010
2005 2010
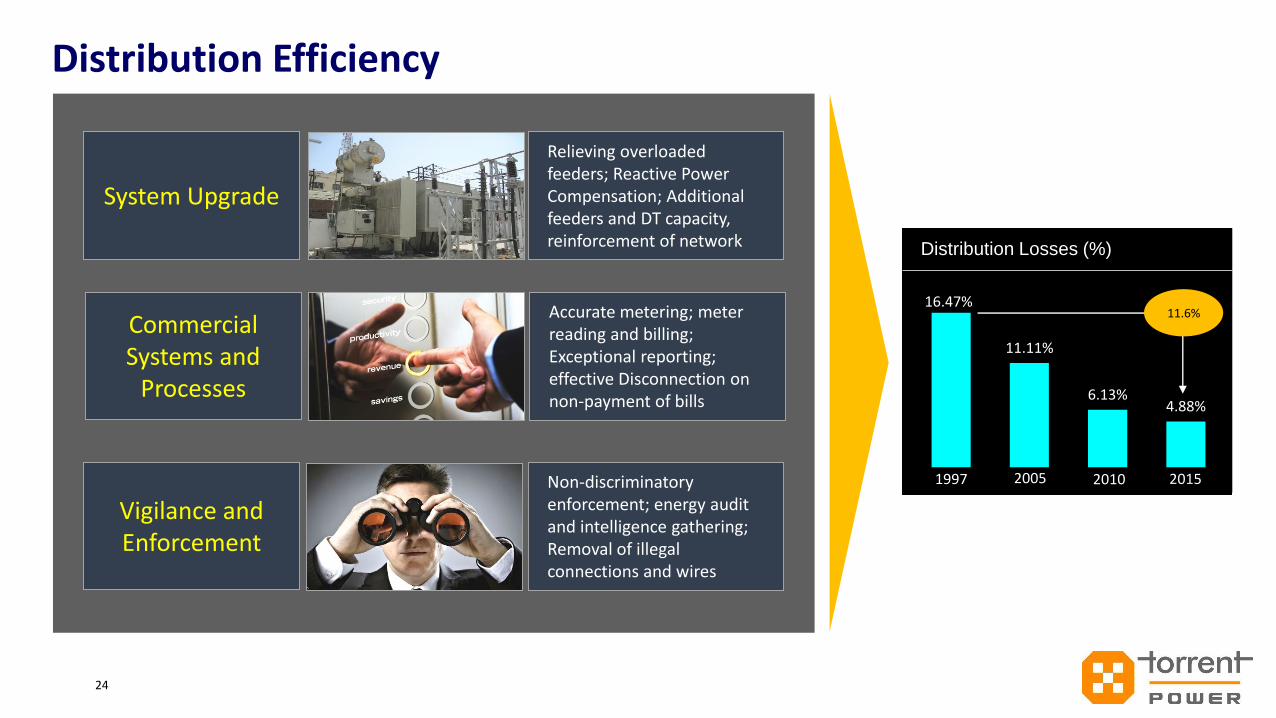
Distribution Efficiency
24
Relieving overloaded feeders; Reactive Power Compensation; Additional feeders and DT capacity, reinforcement of network
System Upgrade
Non-discriminatory enforcement; energy audit and intelligence gathering; Removal of illegal connections and wires
Vigilance and Enforcement
Accurate metering; meter reading and billing; Exceptional reporting; effective Disconnection on non-payment of bills
Commercial Systems and
Processes
2008 2010
Distribution Losses (%)
1997 2015
16.47%
11.11%
6.13%4.88%
11.6%
2005 2010
Preparing for Smart Cities
25
Thank You
• Capacity Building – A key to Smart Distribution and Smart Cities
• Deployment of appropriate Distribution Management Strategy
• Network Development Policies and Guidelines
• Sustainable Business Models : Evaluation of options including PPP or Privatization of Power Distribution
• A Time-bound implementation and monitoring system