Embed Size (px)
Citation preview

Preparing for Responding to Ratings Agencies
FIN 250

Presenter
• Katie Kleinfelder, Director
• RBC Capital Markets, LLC
• (513) 826-0547
CP
IM B
oo
t C
amp
20
17
//
FIN
25
0
2

Disclaimer RBC Capital Markets, LLC (“RBC CM”) is providing the information contained in this document for discussion purposes only and not in connection with RBC CM serving as Underwriter, Investment Banker, municipal advisor, financial advisor or fiduciary to a financial transaction participant or any other person or entity. RBC CM will not have any duties or liability to any person or entity in connection with the information being provided herein. The information provided is not intended to be and should not be construed as “advice” within the meaning of Section 15B of the Securities Exchange Act of 1934. The financial transaction participants should consult with its own legal, accounting, tax, financial and other advisors, as applicable, to the extent it deems appropriate.
This presentation was prepared exclusively for the benefit of and internal use by the recipient. This presentation is confidential and proprietary to RBC Capital Markets, LLC (“RBC CM”) and may not be disclosed, reproduced, distributed or used for any other purpose by the recipient without RBCCM’s express written consent.
By acceptance of these materials, and notwithstanding any other express or implied agreement, arrangement, or understanding to the contrary, RBC CM, its affiliates and the recipient agree that the recipient (and its employees, representatives, and other agents) may disclose to any and all persons, without limitation of any kind from the commencement of discussions, the tax treatment, structure or strategy of the transaction and any fact that may be relevant to understanding such treatment, structure or strategy, and all materials of any kind (including opinions or other tax analyses) that are provided to the recipient relating to such tax treatment, structure, or strategy.
The information and any analyses contained in this presentation are taken from, or based upon, information obtained from the recipient or from publicly available sources, the completeness and accuracy of which has not been independently verified, and cannot be assured by RBC CM. The information and any analyses in these materials reflect prevailing conditions and RBC CM’s views as of this date, all of which are subject to change.
To the extent projections and financial analyses are set forth herein, they may be based on estimated financial performance prepared by or in consultation with the recipient and are intended only to suggest reasonable ranges of results. The printed presentation is incomplete without reference to the oral presentation or other written materials that supplement it.
IRS Circular 230 Disclosure: RBC CM and its affiliates do not provide tax advice and nothing contained herein should be construed as tax advice. Any discussion of U.S. tax matters contained herein (including any attachments) (i) was not intended or written to be used, and cannot be used, by you for the purpose of avoiding tax penalties; and (ii) was written in connection with the promotion or marketing of the matters addressed herein. Accordingly, you should seek advice based upon your particular circumstances from an independent tax advisor.
CP
IM B
oo
t C
amp
20
17
//
FIN
25
0
3

Table of Contents
1. Credit Ratings – An Introduction
2. The Credit Rating Presentation: Participants and Timeline
3. Credit Ratings: The Credit Rating Criteria
CP
IM B
oo
t C
amp
20
17
//
FIN
25
0
4

CREDIT RATINGS – AN INTRODUCTION
Section 1
CP
IM B
oo
t C
amp
20
17
//
FIN
25
0
5

Credit Ratings
• Typically, it makes sense for an issuer to obtain one credit rating from one of the three major rating agencies that rate Ohio local governments:
1. Moody’s Investors Service • Moody’s has a historic presence in Ohio and currently rates the most Ohio local governments.
2. Standard & Poor’s Ratings Services • S&P may be a choice for issuers that might contemplate the use of bond insurance in today’s
market since S&P rates the major bond insurers “AA”, while the other agencies give lower ratings.
3. Fitch Ratings • Fitch is the least well-known of the three major agencies, but has been gaining market share.
Kroll Bond Rating Agency, Inc. (KBRA) is an emerging agency that mostly rates airports and other revenue transactions.
• Under certain circumstances, an issuer may consider obtaining more than one credit rating. • While credit ratings are an expensive and time consuming part of the bond issuance process,
if an issuer has a bond issuance above $50 million, two credit ratings may be beneficial for the marketing and distribution of the bonds. For a large bond issue, two credit ratings may be a factor in pricing the bonds and may attract more potential investors to the bond issue.
• If the issuer does not have an underlying credit rating, and a relatively low rating is expected, the issuer may choose to sell the bonds without an underlying credit rating if they qualify for the Ohio School District Credit Enhancement Program or choose to insure the bonds.
CP
IM B
oo
t C
amp
20
17
//
FIN
25
0
6

Long-Term Municipal Credit Rating Levels
CP
IM B
oo
t C
amp
20
17
//
FIN
25
0
7
Rating Agency: Moody's Standard & Poor's Fitch
Aaa AAA AAA
Aa1 AA+ AA+
Aa2 AA AA
Aa3 AA- AA-
A1 A+ A+
A2 A A
A3 A- A-
Baa1 BBB+ BBB+
Baa2 BBB BBB
Investment Grade Baa3 BBB- BBB-
Speculative Grade Ba1 BB+ BB+
Ba2 BB BB
Ba3 BB- BB-
B1 B+ B+
B2 B B
B3 B- B-
Caa1 CCC+ CCC+
Caa2 CCC CCC
Caa3 CCC- CCC-
Ca1 CC+ CC+
Ca2 CC CC
Ca3 CC- CC-
C1 C+ C+
C2 C C
C3 C- C-
Default D D D

Moody’s Ohio Local Government Credit Rating Distribution
CP
IM B
oo
t C
amp
20
17
//
FIN
25
0
8 Moody’s currently rates 557 local governments in the state of Ohio, with the majority of local government
issuers (26%) receiving an A1 rating
Source: Moody’s Investors Service, March 2017
24
54
136
93
143
67
19
11
4 3 0 1 0 1 100
20
40
60
80
100
120
140
160
Aaa Aa1 Aa2 Aa3 A1 A2 A3 Baa1 Baa2 Baa3 Ba1 Ba2 Ba3 B1 B2 B3
Rate
d L
ocal G
ove
rnm
ent
Issuers
School Districts Cities Counties Other Districts

Credit Rating Process
• Official Statement Preparation and Review
• Prepare a presentation of material for a General Obligation credit rating containing: • Issuer’s tax base and regional economy • Financial metrics of the General Fund and Operating Funds • Debt burden and repayment • Overall administrative financial management and institutional framework
• The credit rating presentation could be a useful tool for the issuer to illustrate positive traits
that cannot be properly conveyed in the Preliminary Official Statement or found in the issuer’s audited financial statements. Qualitative factors, such as management expertise, the budgeting process, quality of the schools, economic development in the region, and community engagement are just some of the factors that can be fully fleshed out in a presentation.
• Government officials, bond counsel, financial advisor (if utilized) and underwriter typically meet to review credit rating presentation materials before presenting to the credit rating agencies • This allows everyone to know their specific role and review talking points • Edits are made after the first credit rating prep meeting and a follow up meeting or call can be
scheduled for a final review before the actual presentation to the credit rating agency
CP
IM B
oo
t C
amp
20
17
//
FIN
25
0
9

How Credit Ratings Impact Borrowing Costs
CP
IM B
oo
t C
amp
20
17
//
FIN
25
0
10
1.00
1.50
2.00
2.50
3.00
3.50
4.00
4.50
1 2 3 4 5 6 7 8 9 10 11 12 13 14 15 16 17 18 19 20 21 22 23 24 25 26 27 28 29 30
Tax
Exem
pt
Inte
rest
Rat
es
Tax Exempt Credit Spreads in March 2017
GO BAA GO A GO AA GO AAA
• On average borrowing rates for a “AA” rated borrower are 38 basis points (0.38%) lower than those for a “A” rated borrower
• For a typical issuer borrowing $25 million over 37 years the total interest cost paid by the “AA” rated borrower will be $2,510,000 lower than that of the “A” rated borrower
• This illustrates the importance of achieving the highest possible credit rating
Source: Thomson Reuters – Municipal Market Data

Credit Enhancement
• The issuer’s credit rating may be enhanced through a state intercept program or bond insurance
• The State of Ohio has a program to enhance Ohio school district bond issues called the Ohio State Credit Enhancement Program (OSCEP) • This program is rated Aa2/AA and is free of charge • District may opt to use the State Credit Enhancement Program • State Credit Enhancement may allow the district to get a lower interest rate • State foundation payments are pledged through a trustee agreement • Prepare application packet for the issuer to participate in the Ohio State Credit Enhancement
Program • Participation in this program can save substantial amounts over the life of the bond issue
• Most districts rated below Aa2/AA qualify to participate in this program but if it is determined that your district does not qualify the use of bond insurance may be considered
• An issuer may carefully consider the potentially costs and benefits of bond insurance. • There are two dominant bond insurers currently rated “AA” by S&P: Assured Guaranty (AGM)
and Build America Mutual (BAM) • It may be prudent to request bids from both insurance providers • Once bids are received, the estimated benefit in the bond sale can be compared with the cost
of the bond insurance premium
• The State of Ohio also offers a relatively new Ohio Market Access Program (OMAP) wrap, which provides an SP-1+ (the highest short-term credit rating) to local government issuers for note sales
CP
IM B
oo
t C
amp
20
17
//
FIN
25
0
11

THE CREDIT RATING PRESENTATION: PARTICIPANTS AND TIMELINE
Section 2
CP
IM B
oo
t C
amp
20
17
//
FIN
25
0
12

Credit Rating Presentation Participants
• The typical credit rating presentation participants include the issuer’s financing professionals, local government officials and credit rating analysts
• Financing Professionals:
• Underwriter – Responsible for the bond sale and commitment of capital to ensure a successful financing
• Financial Advisor (if utilized) – The issuer’s fiduciary municipal advisor
• Bond Counsel – The issuer’s legal representation. Responsible for preparation of the Preliminary and Final Official Statement, all legal documentation and the delivery of a tax exempt opinion (if bonds are tax exempt)
• Local Government Officials:
• Treasurer, Finance Manager, Auditor – Typically responsible for presenting economic and demographic information, finances and election history
• Superintendent, City Manager, Commissioner – Typically responsible for an overview, enrollment history and forecasts, academic results
• Other Individuals: Typically the officials above represent the issuer in credit rating meetings but occasionally other officials such as a Business Manager, a Council member, or a Board member are present.
CP
IM B
oo
t C
amp
20
17
//
FIN
25
0
13

Credit Rating Presentation: In Person or Over the Phone?
• Many times we are asked, should we travel to meet face to face with rating analysts?
• There is no one definitive answer to this question
• Factors to consider before deciding whether to travel to meet face to face with rating
analysts:
• Does the issuer currently have an outstanding credit rating?
• When was this rating last reviewed?
• Have there been any major (positive or negative) changes to the issuer’s finances
(cash balances, state aid, levy passages or failures), tax base or demographics
since the last review?
• Is the proposed borrowing to finance school facility improvements or to refinance
existing debt?
• Are local government officials new to the issuer or veterans?
• The majority of credit rating presentations done today are conducted via
teleconference
• Ultimately the financing team will have to follow their “gut” to determine if the face
to face meeting is worth the time and cost associated with traveling
CP
IM B
oo
t C
amp
20
17
//
FIN
25
0
14

Sample Timeline for Credit Rating Preparation Process
CP
IM B
oo
t C
amp
20
17
//
FIN
25
0
15
2nd Draft of POS Distributed
3 Weeks Before Presentation(s) Incorporating substantially all issuer edits
Draft Rating Presentation Distributed
2 Weeks Before Presentation(s) Incorporating all publicly available and POS information distributed by Underwriter or FA to financing team
All Presentation Edits Due
1 Week Before Presentation(s) All edits due to Underwriter or FA to compile final presentation(s)
Rating Preparation Meeting
2 Weeks Before Presentation(s) Financing team meeting to review draft rating presentation make edits and delegate “to do” items
Final Review Meeting
3 Days Before Presentation(s) Review of final presentation, further discussion of topics of rating agency focus/concern.
Final Documents Shared with Rating Agency
24 hours Before Presentation(s) Final rating presentation, substantially final draft of POS and most recent audited financials distributed to rating analyst(s)
Credit Rating Presentation Held
Source: RBC Capital Markets

Sample Timeline after Credit Rating Presentation
CP
IM B
oo
t C
amp
20
17
//
FIN
25
0
16
Credit Rating Presentation(s)
The presentation typically takes less than 90 minutes
Respond to Follow Up Questions (If Any)
Within 2 Days of Presentation Typically requested follow up information is debt service schedules, discussed issuer policies & procedures, and any back up documentation for items discussed on call
Rating Report Confidential Draft Released
1 Week After Presentation(s) The rating analyst will release a confidential draft report for the financing team to review (2 hour window) for factual errors and disclosure of non public information
Credit Rating Agency Committee Meeting
Within 5 Days of Presentation Credit rating analyst will convene a committee of his/her peers to review the credit and obtain consensus for a credit rating
Final Rating Report Released and Published
Final rating report is published on the rating agency website and now considered public information. It may be disseminated to investors and other interested stakeholders.
Release of Scorecard Analytics
Before Rating is Released If credit rating is with Moody’s the financing team may request the analyst completed scorecard analysis before the rating is released to give the financing team time to review the scorecard for accuracy.
Source: RBC Capital Markets

Annual or Periodic Rating Surveillance
• Any issuer with an outstanding credit rating is subject to periodic/annual rating
surveillance
• It is our opinion that every interaction with credit rating analysts seriously, even it is a
part of routine rating surveillance
• If contacted by a credit rating analyst at any time, discuss with the best way to
proceed with your financing professionals
• One potential strategy includes preparing a credit rating presentation and preparing
for the surveillance just as if it is for a bond issue
• If the rating surveillance is with Moody’s, request a copy of the analyst completed
scorecard analysis before the confidential rating draft is distributed
CP
IM B
oo
t C
amp
20
17
//
FIN
25
0
17

CREDIT RATINGS: THE CREDIT RATING CRITERIA
Section 3
CP
IM B
oo
t C
amp
20
17
//
FIN
25
0
18

Presentation Materials and Contents
• While not required, preparing a comprehensive credit rating presentation may be helpful in guiding the discussion with credit rating analyst(s)
• An initial draft of these materials will be prepared by your underwriter or financial advisor (if utilized)
• This presentation focuses primarily on the four broad rating factors that the rating agencies focus on when assigning a credit rating:
• Economy/Tax Base
• Finances
• Management
• Debt/Pensions
• Each of these factors will be an area of focus in the credit rating materials
• Over the next few slides we will discuss these factors and sub-factors in more detail
CP
IM B
oo
t C
amp
20
17
//
FIN
25
0
19

Moody’s Rating Methodology
CP
IM B
oo
t C
amp
20
17
//
FIN
25
0
20
Changes in Weightings:
• Economy/Tax Base weighting lowered to reduce the influence of the demographics and tax base size
• Some local governments may be unable to convert the strength of local economies into revenues
• Debt/Pensions weighting increased to include a specific quantitative measure for pensions
• Pension liabilities represent enforceable claims on the resources of local governments Source: Moody’s Investors Service, January 2014
Factor
Economy /
Tax BaseFinances Management
Debt /
Pensions
Current Weighting 30% 30% 20% 20%
Previous Methodology
Weighting40% 30% 20% 10%
Change 10% - - 10%

Key Rating Factors for US Local Governments (GO Bonds)
CP
IM B
oo
t C
amp
20
17
//
FIN
25
0
21
Moody’s analytical framework includes an assessment of 4 broad rating factors and 13 sub-factors:
Source: Moody’s Methodology: General Obligation Bonds Issued by US Local Governments (January 2014)
Economy / Tax Base Finances Management Debt / Pensions
(30%) (30%) (20%) (20%)
a. Tax Base Size (full value)
(10%)
i. The market value of taxable
property accessible to the
entity
b. Full Value Per Capita (10%)
i. Full value divided by
population
c. Wealth (median family
income) (10%)
i. As a percentage of the US
median (source: American
Community Survey)
Below-the-line Adjustments
- Institutional presence (+)
- Regional economic center
(+)
- Economic concentration (-)
- Outsized unemployment or
poverty levels (-)
- Per capita income
- Composition of workforce/
employment opportunities
- Proportion of tax base that
is vacant or exempt from
taxes
- Other considerations
a. Fund Balance (% of
revenues) (10%)
i. Available fund balance
(Operating funds assets –
operating funds liabilities,
adjusted for other
resources or obligations
that are available for
operating purposes) as %
of operating revenues
b. Fund Balance Trend (5-year
change) (5%)
i. Available fund balance in
most recent year – balance
5 years earlier, as % of
operating revenues in most
recent year
c. Cash Balance (% of
revenues) (10%)
i. Operating funds net cash
(cash – cash-flow notes) as
% of operating revenues
d. Cash Balance Trend (5-year
change) (5%)
i. Operating funds net cash
most recent year -
operating funds net cash 5
years earlier, as % of
operating revenues in most
recent year
a. Institutional Framework
(10%)
i. Determined for each
sector/state annually
ii. Same score for all Ohio
local governments
iii. Factors that drive
framework
- Tax caps
- Organized labor
- Difficulty of
increasing revenue
- Predictability of
costs
- State-imposed
limitations on fund
balance or reserves
b. Operating History (10%)
i. Average operating
revenues ÷ Operating
expenditures in each of
the past 5 years
Below-the-line
Adjustments
- State oversight or
support
- Unusually strong/weak
budget management and
planning
a. Debt to Full Value
i. Gross debt – self-
supporting debt, as %
of full value
b. Debt to Revenue
i. As % of operating
revenues
c. Moody’s-adjusted Net
Pension Liability (3-
year average) to Full
Value
d. Moody’s-adjusted Net
Pension Liability (3-
year average) to
Revenue
Below-the-Line
Adjustments
- Unusually weak/strong
security features
- Unusual risk posed by
debt structure (-)
- History of missed debt
service payments (-)

Key Rating Factors for US Local Governments (GO Bonds)
CP
IM B
oo
t C
amp
20
17
//
FIN
25
0
22
Standard & Poor’s analytical framework includes an assessment of 5 broad rating factors:
Institutional Framework Economy Management Financial Measures Debt & Contingent Liabilities
(10%) (30%) (20%) (30%) (10%)
a. Institutional
Framework (10%)
i. Determined for
each sector/state
annually
ii. Same score for all
Ohio local
governments
iii. Factors that drive
framework
- Predictability
- Revenue and
expenditure
balance
-
Transparency
and
accountability
- System
support
a. Total Market Value
Per Capita (15%)
i. Full value divided
by population
b. Projected Per Capita
Effective Buying
Income as a % of U.S.
Projected Per Capital
EBI (15%)
i. EBI: personal
income – federal,
state, and local
taxes and nontax
payments
Below-the-line
Adjustments
- Participation in
larger broad &
diversified economy
- Stabilizing
institutional
influence with
longstanding role
as major employer
- Population
decrease or high
share of dependent
population
- High county
unemployment rate
- Employment
concentration
a. Financial
Management
Assessment (20%)
i. Assesses the
impact of
management
conditions on the
likelihood of
repayment
Below-the-line
Adjustments
- Consistent ability to
maintain balanced
operations
- Government
service levels are
limited
- Infrequent
management
turnover
- Ability to execute
approved structural
reforms for two
consecutive years
- Debt burden
a. Budgetary Flexibility
(10%)
i. Available Fund
Balance as a % of
Expenditures
b. Budgetary
Performance (10%)
i. Total Governmental
Funds Net Result
(%) (5%)
ii. General Fund Net
Result (%) (5%)
c. Liquidity (10%)
i. Total Government
Available Cash as
% of Total
Governmental
Funds Debt Service
(5%)
ii. Total Government
Available Cash as
% of Total
Governmental
Funds Expenditures
(5%)
Below-the-Line
Adjustments
- Following year
projections
- Capacity and
willingness to cut
operational spending
- Ability and willingness
to raise taxes
a. Net Direct Debt as %
of Total
Governmental Funds
Revenue (5%)
i. Measures the total
debt burden on the
government’s
revenue position,
which can not be
manipulated by
amortization
structures
b. Total Governmental
Funds Debt Service
as a % of Total
Governmental Funds
Expenditures (5%)
i. Measures annual
fixed-cost burden
that debt places on
the government
Below-the-Line
Adjustments
- Overall net debt as a %
of market value
- Overall rapid annual
debt amortization
- Significant medium-
term debt plans
Source: Standard & Poor’s Ratings Services U.S. Local Governments General Obligation Ratings: Methodology and Assumptions (September 2013)

First Main Factor: Economy/Tax Base
The tax base is the source of most government revenues
• The size of the tax base (full value) is a crucial component to a General Obligation credit rating
• The average rated issuer in Ohio has a tax base size of approximately $750 million
Full value per capita helps link the size of the tax base with the demographics of the population
• The average full value per capita is approximately $60,000
Wealth statistics compared to national medians, such as Median Family Income, Household Income, Per Capita Income, or Effective Buying Income
• The average Median Family Income of Ohio rated local governments is approximately $60,000 (93% of the national median)
Also crucial is the type of tax base and economy (residential bedroom community or an industrial, retail, or services center). Based on the type of local economy, important factors include:
• Institutional presence with longstanding role as major employer (universities, hospitals, military, large/stable corporate employers)
• Part of a regional economic center with participation in a larger broad and diversified economy
• Economic concentration (large concentrations of property taxpayers, income taxpayers, employers, cyclical economic sectors)
• Unemployment and poverty levels of the county
• Commuting patterns / developable land
• Office or retail vacancy rates
• Residential building permit activity
• Income levels
• Housing
• Population trends
CP
IM B
oo
t C
amp
20
17
//
FIN
25
0
23
Source: Moody’s Investors Service, March 2017

Additional Economic Development in the City
In 2015, the City issued 355 building permit applications valued at almost $48,000,000. This is up 14% YOY and 33% since 2013; activity was valued at $39MM in 2013 and $29MM in 2014, for a 3 year average total of over $116MM of new commercial and residential investment.
Since 2013, approximately 60 new businesses have zoned as new or relocated businesses into the City. Park North and Serta are the largest new developments adding over 1.4MM square feet.
Finding use for former Americana Amusement Park
City officials have been talking with the owner of the property and consultants from the University on some type of re-use.
Possible new uses of the 35-acre site include public recreation and redevelopment of adjacent commercial properties to enhance the gateway function of the area.
Further Development of Parks– A new park master plan that looks at staffing, facilities, trails, and programming was recently submitted to the City’s Parks Committee. There are also opportunities for the City to connect to various local and regional bike trails.
Road projects include the widening of Cincinnati Dayton Road from Ohio 63 south to the city limits to include two travel lanes and one turn lane; a relocation and improvements to portions of North Union Road that include a roundabout that will be driven by development; improvements to Mason and Butler Warren Roads to tie into a proposed future expansion of Cox Road; and the widening of Ohio 63 between American Way and Cincinnati Dayton Road.
CP
IM B
oo
t C
amp
20
17
//
FIN
25
0
24
The City, with its prime location on I-75 between Cincinnati and Dayton, has been experiencing great business growth

New Power Plant - $600 Million Investment by NTE Energy
CP
IM B
oo
t C
amp
20
17
//
FIN
25
0
25
Timeline of Project Milestones: • Site Secured: 2013 • Interconnection Application: 2013 • Major Permit Applications: 1Q 2014 • Major Permits Received: 4Q 2014 • Start Construction: October 2015 • Commercial Operation Date: 2018
NTE Energy is currently constructing the local Energy Center, a nominal 475 MW natural gas electric generating
facility in the City. The project will be one of the most efficient and clean sources of capacity and energy in PJM,
the regional transmission organization. The project will employ Mitsubishi Hitachi Power Systems Americas, Inc.
(MHPSA) advanced turbine technology in a combined cycle configuration, utilizing the exhaust heat of the gas
turbine to produce steam to generate additional energy in a steam turbine generator.
Project Highlights: • Technology: Combined Cycle utilizing MHPSA advanced Combustion Turbine • Fuel: Natural Gas • Net Output: Nominal 475 MW • Location: the City • Investment: Over $600 million • Jobs: 300-400 during Construction
25-30 during Operation
The project is within a City-designated Enterprise Zone Agreement, which provides a 10 year, 75% abatement of real property and is scheduled to begin in 2018 when the power plant comes on line and expires in 2028.

Economic Developments in the City and the Village $20 Million Townhouse Project Set to Rise in the City
Comprised of 42 townhouses costing about $500,000 apiece, the project is the largest residential development in the tony East Side suburb since Forest City Enterprises Inc., now Forest City Realty Trust, launched Sterling Lakes a staggering 11 years ago. The gap in time is due to the long housing bust. But the new-home market is back and so are new developments.
Pinecrest Mixed-Use Project in the Village
$230 Million development will include 40,000 square feet of retail, 87 high-end apartments, and 150,000 square feet of office space. Pinecrest is set to open in Spring 2018.
AC Hotel by Marriott – 145-room hotel above the development. The company prizes the hotel’s modern clean and simple design with a European style. The first AC Hotel in Northeast Ohio. The hotel will occupy four floors above retail space near the center of the 400,000-square-foot project.
Kona Grill, a Scottsdale, Arizona-based restaurant group specializing in Asian food and sushi, will open its first Northeast Ohio eatery. The 7,300-square-foot restaurant will accommodate 300 diners and will include a patio facing the center’s one-acre programmable village green.
Furniture store West Elm – part of the Williams-Sonoma Inc. group of companies - plans to enter the Northeast Ohio market with an 11,000-square-foot store at the development. This will be their second store in Ohio.
Other tenants include Whole Foods grocery store, REI, Pinstripes, 10-screen Silverspot Cinemas, Orangetheory Fitness, Vernacular, City Works Eatery & Pour House, Firebird’s Woodfired Grill, Fusian, Restore Cold Pressed, Flipside, Vineyard Vines, and Bibibop
Total projected TIF revenue to the District is $2,585,555. After the 30 year agreement, the development will be added to the District’s base.
CP
IM B
oo
t C
amp
20
17
//
FIN
25
0
26

Economic Development Marathon Petroleum
Headquartered in nearby Findlay, the company announced an expansion to its campus in February 2014 and construction began just three months later.
Marathon is adding an administrative building, a headquarters for MPLX, and two attractive garages, consolidating parking and freeing up an area to be turned into green space to create more of a campus atmosphere.
The company is also breaking ground on a 100-room hotel that will serve not only Marathon employees and guests, but the Northwest Ohio community.
Toledo – 3rd largest rail hub in the U.S.
It was recently announced that a $12.3 million expansion is planned for the Norfolk Southern Railway in south Toledo. The expansion projected is expected to further boost the region’s capacity for handling intermodal freight and also generate hundreds of jobs in the transportation sector.
Another recent addition to the region is the Northwest Ohio Terminal Facility, a 185-acre world-class freight distribution hub, which serves as the nerve center for CSX Railroad’s nationwide intermodal network. With these two new facilities, shippers will be able to bypass congested points like Chicago thereby transforming the area into an absolutely vital transportation center.
ProMedica Health Systems – The area’s top employer with 15,000 workers
ProMedica plans to relocate and expand its headquarters in downtown Toledo in a waterfront campus that includes a vacant Toledo Edison Steam Plant. The first phase of the relocation will begin in the fall of 2015 and is expected to create 100 new jobs.
Other Significant Developments in Northwest Ohio
FedEx constructed a $22 million distribution center in Wood County in 2013 and is already planning an expansion of that facility
Mercy Health System is constructing a new $21 million Behavioral Health Institute at St. Charles Hospital. The facility is scheduled to open in 2015 and will require an additional 60 employees.
Automotive parts supplier Autoneum Holding added 120 new jobs in 2013.
Home Depot constructed a distribution center in Wood County, which added approximately 150 jobs and $130 million in capital investment.
In December 2013, Whirlpool Corporation announced relocation of the production of its commercial front-load washing machines from Mexico to the region, and its $65 million investment is expected to create 100 new jobs over the next three years.
CP
IM B
oo
t C
amp
20
17
//
FIN
25
0
27

Economic Development
Loveland Station is a mixed use development consisting of 15,000 square feet of commercial space and 92 resident units in the downtown historic area.
In 2016, the private portion of the Loveland Station development reached completion with all phases except for the bicycle storage building.
During the year, all of the commercial space was leased and operational including new residents within the 92 apartments.
The relocation of overhead utility lines and sidewalk renovations were fully completed in 2016.
Loveland Station has spurred additional development in the downtown district both residentially and commercially.
Two (2) residential developments have been approved in the downtown area which will be completed in 2017.
Additionally, a new brewery on Karl Brown Way and a coffee shop on Railroad Avenue have been approved and are preparing for operations.
CP
IM B
oo
t C
amp
20
17
//
FIN
25
0
28
In terms of development, 2016 was a very exciting year for the City of Loveland, with several noteworthy projects. Loveland has been blessed with the best of both worlds. It retains the charm of the old world with boutiques, antique shops, and restaurants in the downtown Loveland Historic District. All the while, modern convenience centers can be found right around the corner, offering a greater selection of goods and support services of Loveland residential and commercial communities.

Recent Significant Economic Development for Major Employers
Macy’s Expansion Cincinnati-based Macy’s Inc. is now currently home to 430 corporate workers into about 158,000 square feet of the building,
which was renovated for the department store chain and online retailer.
In December 2016, an additional 170 employees were announced bringing the expected total to 600 employees and expanding into 167,000 square feet overall.
Additionally, the retail store location with 369 employees in the Tri-County Mall, had a major renovation: facade improvements were completed bringing a fresh appearance to the exterior of the Mall.
After the various expansions, Macy’s will have 969 employees located in the City
Procter & Gamble Co. In September 2016, P&G leased approximately 285,000 square feet of space within a massive Springdale office and industrial
complex called Progress Park. Progress Park, which encompasses a total of 1.1 million square feet, was once owned and operated by Avon Products Inc. P&G is expected to occupy the facility in early 2017. The space is intended to be used to help support other P&G local technical centers who perform research, development, and manufacturing for several of their brands.
The Progress Park facility is located in Springdale along Interstate 275 between the SR 747 and SR 4 interchanges. In 2013, First Highland bought the property for $6.5 million and have repurposed it for a variety of uses.
Avon continues to house its customer service call center and returned goods processing operations in about 350,000 square feet of space of the facility employing approximately 300 associates with plans to add 70 more.
Vora Group Company Eyes 120-Job Expansion In December 2016, the Ohio Tax Credit Authority approved a tax credit, worth $1.15 million, to Ascendum Solutions LLC to
create 120 new jobs by the end of 2019 as well as retain 75 current jobs. This is expected to generate about $6.4 million in new annual payroll which breaks down to an average annual salary of more than $53,000.
Ascendum is a wholly owned subsidiary of the Vora Group, a Cincinnati-based privately held equity group that specializes in building IT companies. Ascendum, currently located in Blue Ash, is an information technology solutions company that works with small to midsize businesses and enterprise level organizations, including many Fortune 1,000 companies.
Ascendum plans to spend nearly $2.5 million in capital investments at its new location in Springdale.
As part of the incentive, the authority requires Ascendum to maintain its operations at the project location for at least 11 years.
CP
IM B
oo
t C
amp
20
17
//
FIN
25
0
29
In terms of development, in 2016 and continuing into 2017, the City of Springdale has been seeing exciting activity, with several noteworthy projects, the first two within the Progress Park location.

Top Employers in the District – Stable Presence of Top Employers
CP
IM B
oo
t C
amp
20
17
//
FIN
25
0
30
While many residents work outside the District, commuting to employment in the greater Cincinnati area, the District
still has a significant and diverse workforce for its size. The following employers (private and public) have the largest
work forces within the District.
Of the District’s Top Employers, Standard Textile is one of the largest textile companies in the world, Emcor Facilities Services
headquarters is located in the District and they will soon be doubling the size of their building, General Tool Company is a significant
supplier for General Electric, and Mallinckrodt Enterprises continues to grow at incredible rates.
Employer Nature of Activity or Business Stable
Presence
Approximate Number
of Employees
Patheon Pharmaceuticals Inc. Pharmaceuticals 100 years 619
Standard Textile Co., Inc. Manufacturing 75 years 353
Emcor Facilities Services, Inc. Facilities Support 65 years 321
General Tool Company Manufacturing 69 years 233
University of Cincinnati Medical Research 166
The District Education 153 years 147
Sealtron, Inc. Manufacturing 125
Mallinckrodt Enterprises, LLC Pharmaceuticals 99 years 100
Aluchem, Inc. Mineral Processor 90
Nitto Denko Avecia Inc. Biotechnology 87

Residential Property – Existing Homes
CP
IM B
oo
t C
amp
20
17
//
FIN
25
0
31

Residential Property – Recent Developments
CP
IM B
oo
t C
amp
20
17
//
FIN
25
0
32

Second Main Factor: Finances
Available Operating Fund Balances (may include General Fund, Bond Retirement Fund, and potentially other funds), as a percentage of fund revenues or expenditures
• Indicates the ability to weather budgetary pressures stemming from economic downturns, includes all reserves available for operating purposes, not simply the General Fund
• The average rated Ohio issuer has a balance of approximately 25%
Cash Balance as a percentage of revenues or expenditures
• Cash Balance is the total of cash and cash equivalents, investments (when grouped with cash in the audit) and any other highly liquid securities. Proceeds of borrowings that are otherwise dedicated and other encumbered cash is subtracted.
• School districts tend to have more predictable (less flexible but more stable) revenue composition (property taxes and state aid) and cost structures than most other types of local governments
• Cash balances provide a measure of liquidity and availability of funds to pay debt service
• The average rated Ohio issuer has a balance of approximately 30%
5-Year $ Changes in Fund Balance and Cash Balance as % of Revenues or Expenditures
• Incorporated to capture trend information (5 years typically encompasses a full market cycle); avoids overweighting point-in-time data
• The focus here is on whether financial reserves and liquidity are increasing in step with budgetary growth
• The average rated Ohio issuer has a Fund Balance Trend of approximately 15% and a Cash Balance Trend of approximately 10%
CP
IM B
oo
t C
amp
20
17
//
FIN
25
0
33
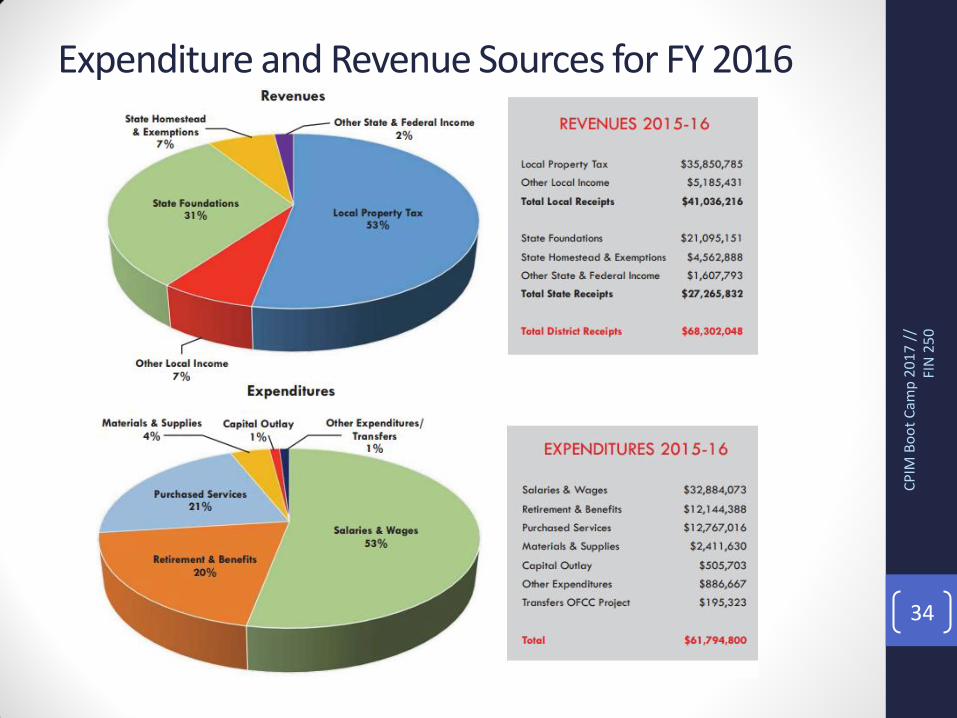
Expenditure and Revenue Sources for FY 2016
CP
IM B
oo
t C
amp
20
17
//
FIN
25
0
34

General Fund Revenues (Non-GAAP Budgetary Basis)
CP
IM B
oo
t C
amp
20
17
//
FIN
25
0
35
2011 2012 2013 2014 2015 2016
Taxes $6,717,867 $6,568,022
Property Taxes $2,405,878 $2,406,985 $2,641,150 $2,654,510
Income Taxes 4,997,338 4,482,647 5,571,586 6,218,375
Charges for Services 286,532 263,362 348,496 313,950 321,550 270,115
Investment Earnings 28,757 23,972 20,887 21,504 9,430 61,300
Intergovernmental 1,160,950 1,794,616 1,229,588 554,341 512,707 498,042
Fines, Licenses & Permits 104,744 85,814 101,891 102,177 92,470 81,090
Other Revenues 12,791 1,189 108,242 113,330 184,343
Total Revenues $8,311,641 $8,736,975 $9,212,320 $7,994,934 $9,148,893 $9,967,774
Budgeted Revenues 8,453,848 8,219,281 7,815,921 7,955,729 8,712,592 9,168,022
% of Budget 98% 106% 118% 100% 105% 108%
Wyoming continues to apply conservative budgeting for revenues to avoid budgeting deficits
Income Taxes are mostly received from resident tax returns.
Property tax rates are 10 mills for the General Fund, with 3.06 mills from inside millage.
Since as early as 2008, State-supported revenues have decreased significantly or been eliminated. As a result, the City ceased budgeting for Tangible Personal Property in 2008 and for Estate Tax in 2013.
The City included a deminimus portion of estate tax prior to elimination, which would fund capital improvements, and was never a part of the operating budget.
The City continues the policy to not rely on uncertain revenue sources for operations.

Election History
CP
IM B
oo
t C
amp
20
17
//
FIN
25
0
36
The issuer has passed ALL of its operating levies over the past 30 years
Levy Elections
Election
Date
Millag
e Purpose New/Renewal Term Result For Against
% For (%
Against)
11/03/15 0.95 Recreation Renewal 5 Approved 3,493 1,334 72.36 % (27.64 %)
11/08/11 5.00 Current Expense New CT Approved 3,592 2,412 59.83 % (40.17 %)
11/02/10 0.95 Recreation Renewal 5 Approved 4,333 2,062 67.76 % (32.24 %)
11/08/05 0.95 Recreation Replacement 5 Approved 3,169 1,532 67.41 % (32.59 %)
11/02/04 5.00 Current Expense New CT Approved 5,017 3,585 58.32 % (41.68 %)
11/04/03 1.00 Permanent
Improvement New CT Approved 2,121 1,103 65.79 % (34.21 %)
11/07/00 0.95 Recreation Replacement 5 Approved 5,135 2,749 65.13 % (34.87 %)
11/07/00 9.50 Current Expense New CT Approved 4,646 3,283 58.60 % (41.40 %)
05/02/95 0.95 Recreation Renewal &
Increase 5 Approved 2,757 1,066 72.12 % (27.88 %)
05/02/95 5.55 Current Expense New CT Approved 2,753 1,093 71.58 % (28.42 %)
05/08/90 0.85 Recreation Renewal &
Increase 5 Approved 3,485 2,056 62.90% (37.10%)
05/08/90 8.50 Current Expense New CT Approved 3,226 2,323 58.14 % (41.86 %)
05/05/87 7.00 Current Expense New CT Approved 1,431 1,045 57.79 % (42.21 %)
05/07/85 0.90 Recreation Renewal &
Increase 5 Approved 915 567 61.74 % (38.26 %)
Bond Issue Elections
Election
Date Millage Bond Issue Amount Purpose Result For Against % For
11/03/98 3.32 $36,500,000 Site Imprvmnts Approved 4,363 2,089 67.62 % (32.38 %)
06/02/92 1.42 $8,500,000 Rmdlng/Frnshng/Eqpng/Cnstrctn
g Defeated 2,248 2,742 45.05 % (54.95 %)
In order to gain input from the community, the issuer conducted a survey, developed focus groups, and held a community
presentation regarding its FutureVision facilities master plan especially involving the future of the Middle School.

Historic Income Tax Collections
CP
IM B
oo
t C
amp
20
17
//
FIN
25
0
37
Income Tax Collections:
Source: City of Springdale 2015 Audited Financial Statement – Statistical Section from the City Income Tax Department
There are three main components to the income tax:
Withholdings remitted by employers (78%)
Net Profits of businesses located in or doing business in the City (17%)
Filings by individual residents of the City (5%)
Overall, income tax collections for 2015 are up 8.07%.
Withholdings remitted by employers increased 7.51%
Filings by individual residents of the City decreased 3.32%
Business (Net Profit) increased 13.97%
The City’s ten largest employers provided work for 4,119 employees and generated $3,790,792 in income tax revenue for 2015.
15,677,237 15,671,700 14,884,825
13,678,901
11,994,298 12,485,560 12,967,117 13,321,894 13,300,706 14,374,662
15,542,072
$0
$2,000,000
$4,000,000
$6,000,000
$8,000,000
$10,000,000
$12,000,000
$14,000,000
$16,000,000
$18,000,000

Historic Year-End Operating Fund Balances (GAAP basis)
CP
IM B
oo
t C
amp
20
17
//
FIN
25
0
38
General Fund
Balance
Capital
Improvement
Fund Balance
Equipment
Replacement
Fund Balance
Total Operating
Fund Balance
Operating Fund
Expenditures
Balance as a %
of Expenditures
2011 2,415,749 620,076 2,187,414 5,223,239 11,106,973 47.03
2012 1,958,436 (90,320) 2,586,931 4,455,047 12,124,958 36.74
2013 3,122,970 20,240 2,565,822 5,709,032 8,624,465 66.20
2014 2,335,430 (68,914) 2,534,834 4,801,350 9,961,523 48.20
2015 2,406,112 326,331 2,279,541 5,011,984 10,632,386 47.14
2016* 2,793,880
The City of Wyoming has sustained healthy reserve levels that allow for financial flexibility in times of stress
and state of Ohio law changes.
The City has sustained consistent positive fund balances for over a decade.
Audited Operating Fund Ending Fund Balance as a % of Operating Fund Expenditures (Modified Accrual Basis of
Accounting)
* The 2016 figures are preliminary. The GAAP conversion won’t be completed until sometime in May. In addition, the 2016 audit started the week of March 13th. As such, these
numbers are unaudited.
Third Main Factor: Management Institutional Framework
• New factor for US Local Governments
• Focuses on issuers’ legal and practical ability to match revenues with expenditures based on their legal apparatus
• The score reflects the State of Ohio constitution and state law
• All local governments in Ohio have the same institutional framework score
Operating History
• Ratio of the average of the past five years of operating revenues divided by the past five years of operating expenditures
• Measures the degree that an issuer has demonstrated the practical ability and willingness to match revenues with expenditures
• The ability to budget and forecast revenues and expenditures is considered very important for an issuer with outstanding debt
• The average rated Ohio issuer has, on average, a balanced budget, with a ratio of 1.0x
Other factors:
• Policy Listings:
• Debt Policy
• Investment Policy
• Post-Issuance Compliance
• Budgets: Projections for the current year and following year
• Five Year Budget (Five year Forecast) and Five Year Capital Budget
• Flexible costs, widespread political support (levy history, community engagement, voter support), capacity to cut expenditures
• Levels of receivables
• Cash accounting vs. GAAP
• Volatility in revenues
CP
IM B
oo
t C
amp
20
17
//
FIN
25
0
39

Key Financial Highlights • Budget Procedure
The City’s annual budget process commences around May of each year with the development of the City’s Tax Budget. The Tax Budget is prepared jointly between the City’s Finance and Administration Departments. It is ultimately approved by City Council for submission to Hamilton County in accordance with the Ohio Revised Code. The focus of this process is to forecast the City’s fund balances for the end of the next fiscal year based on information available at that time.
In September, the process of formalizing the City’s Five-Year Revenue and Expenditure Document (Five-Year Budget) begins. During this process, each department is charged with projecting their year-end expenses as well as identifying and assessing their needs for the next five-year period. Departments are tasked with outlining their future service delivery and determining what level of resources will be needed to properly provide those services. The final document is delivered to the elected officials for their review and feedback.
Once the Five-Year Budget document is completed, the City uses information derived from that process to perform an even more critical analysis of the current year-ending revenues and expenditures. Based upon the resources available to the organization, as well as identifying what services and programs the City wishes to deliver in the upcoming year, the Annual Budget document is developed. Following a review by the elected officials, the Annual Budget document is publicly presented to Council and the general public. From this process, the next year’s appropriations are determined and subsequently adopted by Council during the first meeting of January.
City administration and City Council remain focused on improving the financial stability of Springdale and developing goals to address economic vitality and infrastructure objectives for the future.
Through a strategic assessment process of the City’s infrastructure and major capital items, an annual Five-Year Capital Improvement Program is developed and updated to plan for future Community Capital Investments.
The City has an informal policy of striving to maintain an unreserved fund balance at a minimum which is equivalent to one month of the City’s operating expenses (approx. $1.4 million).
The City uses conservative revenue projections for budgeting purposes and extensively evaluates operating budgets.
The General Fund is the chief operating fund of the City. The unassigned fund balance at 12/31/2015 was $5,448,358 (32.5% of General Fund Revenue). The total fund balance at year-end 2015 was $6,777,208 (40.5% of General Fund Revenue of $16,738,582).
The Government Finance Officers Association (GFOA) awarded a “Certificate of Excellence in Financial Reporting” to the City for its Comprehensive Annual Financial Report (CAFR) for the fiscal year ended December 31, 2015. This was the sixteenth consecutive year the City received this prestigious distinction.
CP
IM B
oo
t C
amp
20
17
//
FIN
25
0
40
A conservative approach to budgeting and purchasing is a hallmark of the City

Fiscal Stewardship Shared Services with Other Local Governments and Organizations
The issuer provides lunch services to four other public school districts and four private schools through shared service agreements. The program has been featured statewide as a model of shared services.
Participation in the Southwest Ohio Organization of School Health (SWOOSH) helps the issuer achieve lower health insurance rates. The issuer’s Treasurer also serves as the Treasurer for the SWOOSH Board of Directors.
The issuer oversees the payroll of another issuer saving 20% of the payroll manager’s salary and benefits.
Other shared services include: office and custodial supplies, natural gas and electric services.
Received the Drug Free Coalition grant annual award of $125,000 for five years from 2016 to 2020. The issuer serves as the fiscal agent for the grant and administration works closely with the issuer and Township representatives, police officers, and community members.
Applied the increase in state funding to technology. The issuer implemented a technology refresh cycle to include devices and infrastructure. The Board approved for the 2016-2017 school year, 1:1 devices for 7th grade students at $90 per year plus $10 per year for tech fees for a three year period. At the end of the three-year period, the device will remain with the student.
Received a perfect audit for the Nutrition Services Department and a clean audit opinion from the State Auditor’s Office for fiscal year 2015.
The issuer accepted a Community Reinvestment Act (CRA) with the Township and the County for an expansion on State Route 28. The businesses at this location asked for a 60% tax abatement for 10 years (50% and 15 years is standard). This will increase the property value after the abatement for the new addition on State Route 28 which will increase issuer revenues.
CP
IM B
oo
t C
amp
20
17
//
FIN
25
0
41
Financial responsibility ensures that the majority of funding is spent on classroom instruction – 68% of the issuer’s
budget is spent on classroom instruction

Key Financial Highlights
CP
IM B
oo
t C
amp
20
17
//
FIN
25
0
42
Stable Tax Base
Fiscal Year 2015 balances increased nearly $1.0 million from prior year. Cash balances have grown from $1,364,624 at
6/30/10 to $3,339,042 by 6/30/15.
The current State of Ohio budget provides for a 7.5% increase each year, plus capacity aid. The issuer is projecting to remain
on the gain cap and projects to be on the cap by $990,000 by 2020.
The issuer has a competitive cost per pupil at $9,400.
The issuer has utilized open enrollment to grow revenue to offset Tangible Personal Property losses and carefully manage
expenditures.
Pension reform has brought a younger, less expensive staff, resulting in salary stability.
The issuer Treasurer’s excellent record keeping has earned it the Auditor of State Award, awarded to local governments with
a “clean” audit report.

Fourth Main Factor: Debt/Pensions The total net and overlapping debt figures are very important, as well as annual debt service payments
Debt to full value – measures the debt burden on citizens and the willingness to pay debt obligations
• The average rated Ohio issuer has a debt burden of 1.5% of its full property tax valuation
• Typically, overall net debt below 3% of market value is considered a credit positive, while net debt exceeding 10% is
considered negative
Debt to operating revenue – measures the ability for a issuer to pay debt obligations
• The average rated Ohio issuer has a debt to revenue ratio of 0.50x (this is equivalent to saying debt is 50% of revenues)
Subtract debt for essential service utilities that is self-supporting from user fees (water & sewer systems)
• Do not deduct debt for non-essential enterprises such as golf courses, even if it is self-supporting
Specific metrics regarding pensions:
• Three-year average is used to smooth the volatility inherent in the metric
• Debt breakpoints are more restrictive than pensions reflecting the fixed nature of debt obligations; pension measures are
estimates, may be volatile across years and can be renegotiated or reduced
• The rating agencies each have their own methodology regarding the calculation of pension obligations
• The average Ohio rated issuer has a pension liability to full value of 9% and a pension liability to revenue of 3.3x (330%)
• On average, these are high figures and typically some of the worst factors for a issuer
Other factors:
• Usually, rapid amortization of debt, with more than 65% coming due within 10 years, is a credit positive
• Future debt plans are considered
CP
IM B
oo
t C
amp
20
17
//
FIN
25
0
43
Source: Moody’s Investors Service and Standard & Poor’s Ratings Services, March 2017

Project In the early 2000’s, the issuer worked with the community to create a vision of what the issuer’s facilities should look like. The
first portion of this vision was completed from 2006 to 2008 with the addition of 6 new elementary schools and the renovation of two others. This portion of the plan was completed on time and on budget.
The second portion of the project is being completed as a partner project with the Ohio School Facilities Corporation. This partnership will bring approximately $51 million in state tax money that will be match with $45 million of local funds that will complete the following:
Renovations at the Academy
Build a new Middle School to house the District’s 6th through 8th graders
Renovate and expand the current High School
Demolish and remove the old Middle Schools
Demolish the old elementary school
CP
IM B
oo
t C
amp
20
17
//
FIN
25
0
44
Old Middle School
Current High School
Current Designs

Current Outstanding Debt – Prior to Refunding
CP
IM B
oo
t C
amp
20
17
//
FIN
25
0
45
General Obligation Bonds
Date of Original
Issue Purpose Interest Rate
Final
Maturity
Original
Amount Issued
Amount
Outstanding
10/16/2006 Various Purpose 4.00-5.00% 12/01/2026 $5,000,000 $3,030,000*
08/26/2009 Various Purpose 2.00-4.50 12/01/2029 6,150,000 4,485,000*
04/17/2012 Various Purpose Ref 2.00-4.00 12/01/2024 3,740,000 2,850,000
2.00-5.00% 12/01/2029 $14,890,000 $10,365,000
* To be partially refinanced with a portion of the proceeds of the Bonds.
Ohio Public Works Commission Loans
Date of Original Issue Purpose Interest Rate Final
Maturity
Amount
Outstanding
01/01/2000 Water Improvements 3.00% 01/01/2020 $19,532
07/01/2001 Water Improvements 3.00 07/01/2021 1,459,551
07/01/2009 Street Improvements 0.00 07/01/2020 177,768
12/01/2012 OPWC Hilltop/Circlewood
Improvements 0.02 07/01/2033 378,291
07/01/2015 OPWC Wilmuth Ave Rehabilitation 0.00 01/01/2046 120,982
07/01/2015 OPWC Worthington Ave
Rehabilitation 0.00 01/01/2046 151,239
07/01/2015 OPWC Springfield Pike 0.00 01/01/2046 266,695
0.00 – 3.00% 01/01/2046 $2,574,058
Collection Year 2017 Full Value = $876,596,057; Debt as a Percent of Full Value = 1.48%
Total Debt Per Capita = $12,939,058 / 8,407 = $1,539.08

Adjustments or Mitigating Factors The prior factors simply provides a grounds for discussion on certain quantifiable metrics used in the rating process,
but the rating process still involves a significant degree of judgment
• It is not a calculator. There are many qualitative factors that cannot be measured and overriding factors that are
very important when making the final rating decision.
• Below are some examples of adjustments that may be made to the rating:
CP
IM B
oo
t C
amp
20
17
//
FIN
25
0
46
Economy/Tax Base • Institutional presence • Regional economic center Management • Unusually strong budgetary
management and planning Debt/Pensions • Unusually strong security features
Economy / Tax Base • Economic concentration • Outsized unemployment or poverty levels Finances • Outsized contingent liability risk • Unusually volatile revenue structure Management • Unusually weak budgetary management
and planning Debt / Pensions • Unusually weak security features • Unusual risk poised by debt/pension
structure • History of missed debt service payments
The analyst takes many factors into considerations, for both upward and downward adjustments • State oversight or support • Credit event/trend not yet reflected in existing data sets