Embed Size (px)
Citation preview
Preparing for Operational Mapping of Harmful Algal Blooms and Related Water
Quality Parameters with HyspIRI
Richard Beck1, Hongxing Liu1, Haibin Su2, Qiusheng Wu1, Bo Yang1, Thomas Bridgeman6
1University of Cincinnati, 2Texas A&M Kingsville, 3University of Toledo
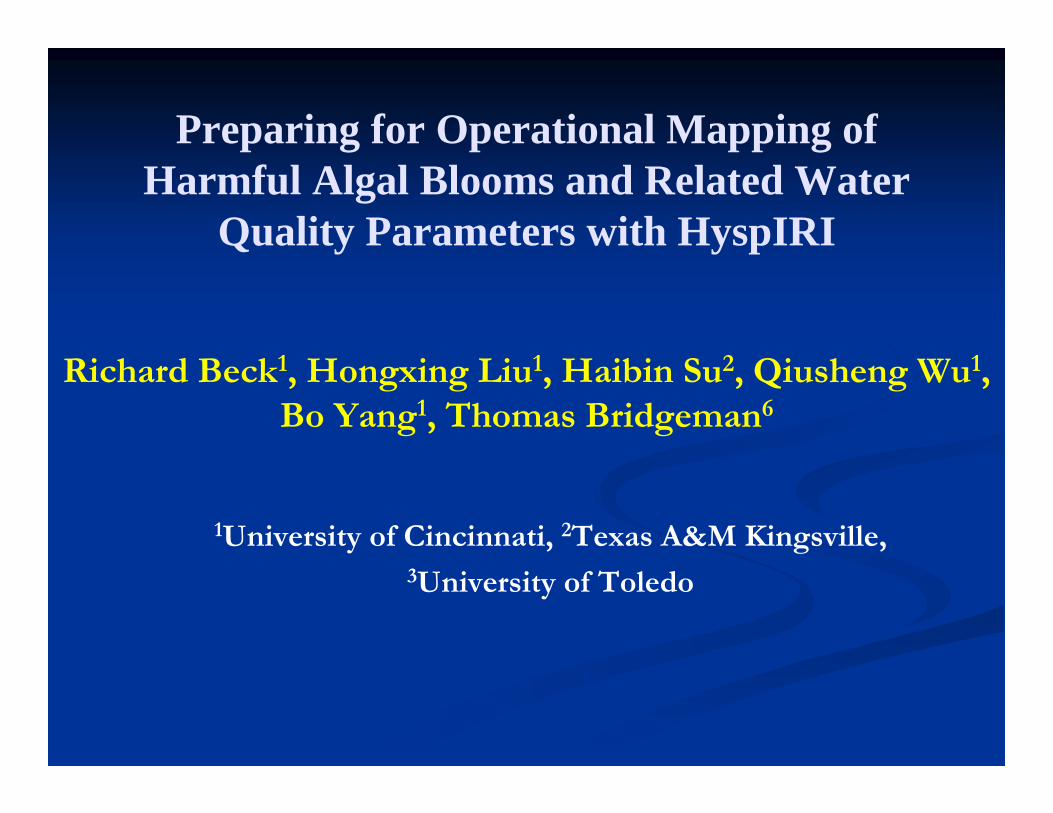
Great Lakes & Great Lakes Basins
Spatial Extent of Great Lakes Basins
Map of the Great Lakes with Lat/Lon and basin outline
the largest system of fresh surface water on earth
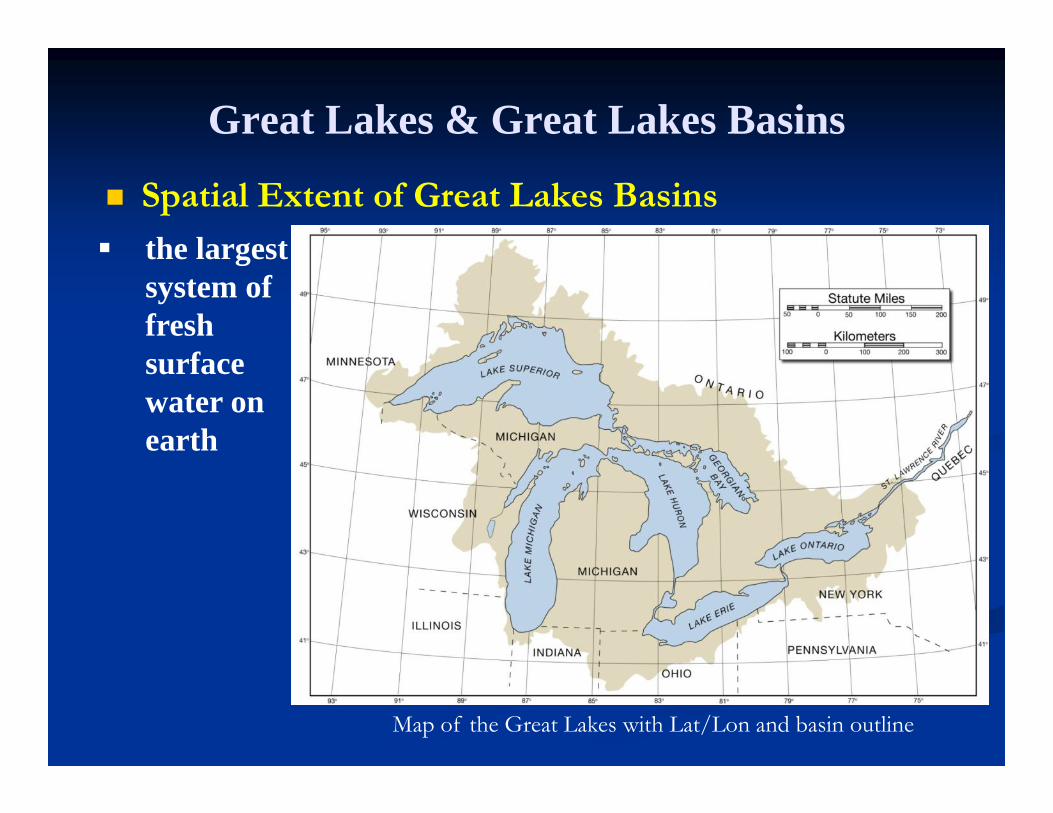
Lake Erie
Geographic Characteristics the shallowest and smallest by volume
Lake Erie shoreline image.
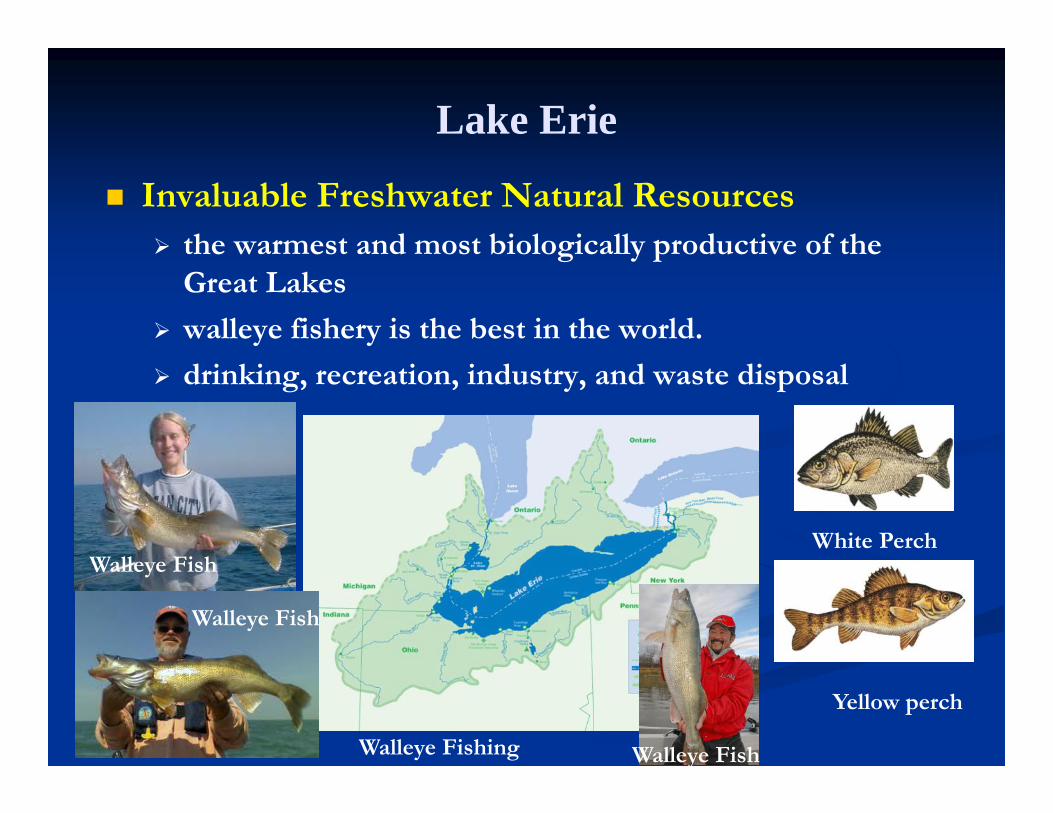
Lake Erie
Invaluable Freshwater Natural Resources the warmest and most biologically productive of the
Great Lakes
walleye fishery is the best in the world.
drinking, recreation, industry, and waste disposal
Yellow perch
White Perch
Walleye Fishing
Walleye Fish
Walleye Fish
Walleye Fish
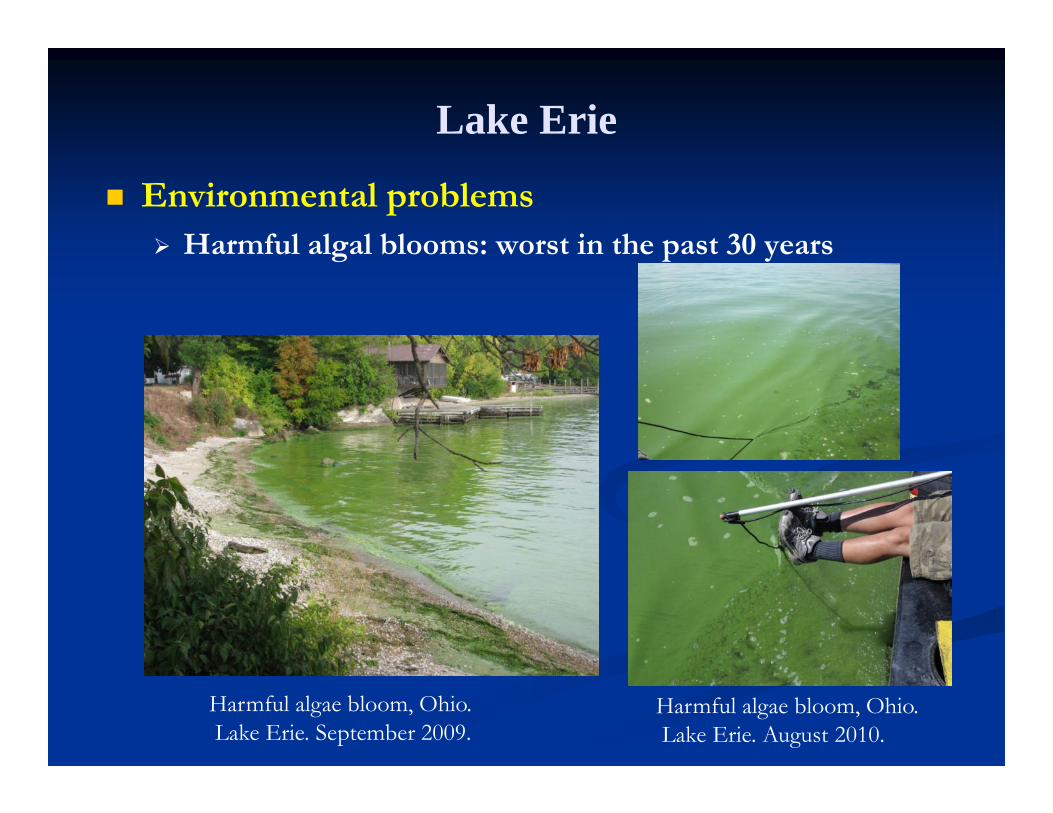
Lake Erie
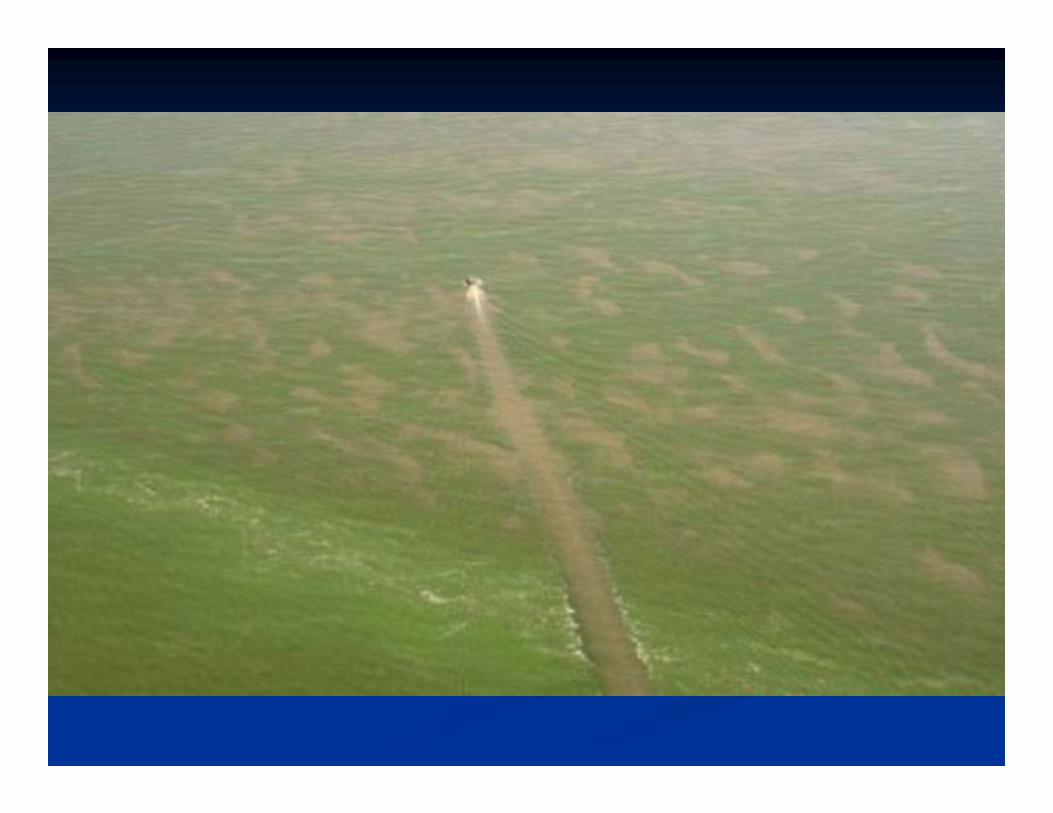
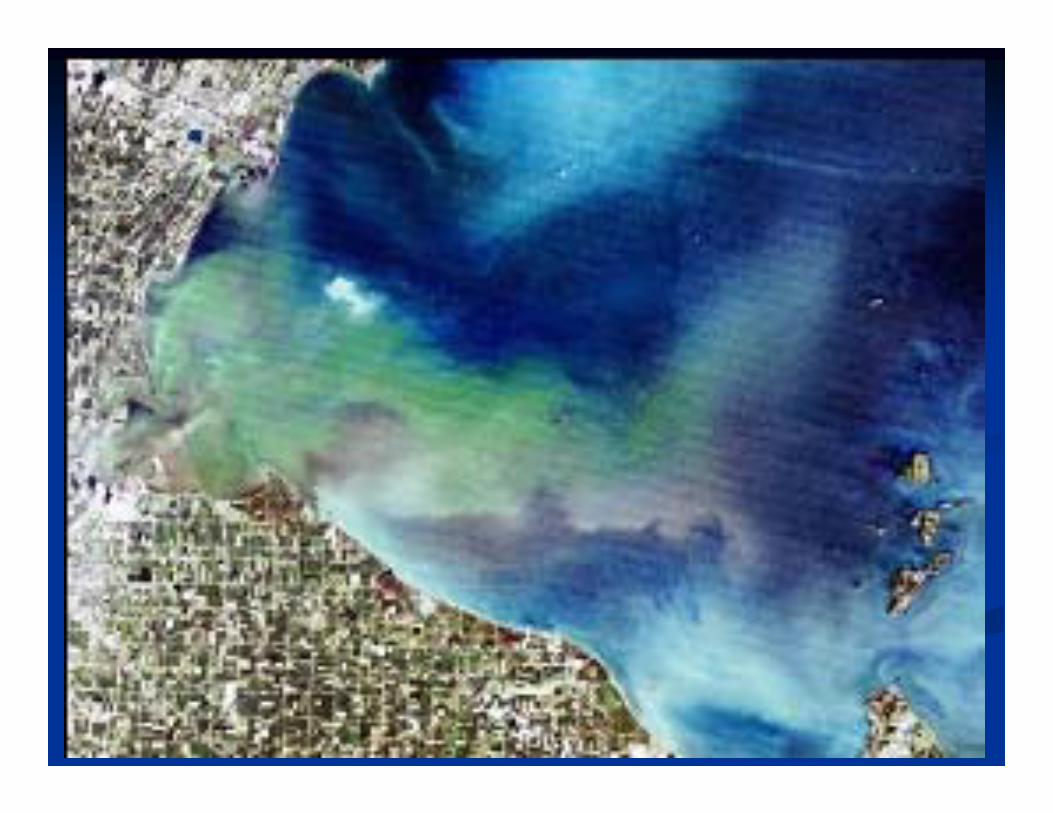
Environmental problems Harmful algal blooms: worst in the past 30 years
Harmful algae bloom, Ohio.Lake Erie. September 2009.
Harmful algae bloom, Ohio.Lake Erie. August 2010.
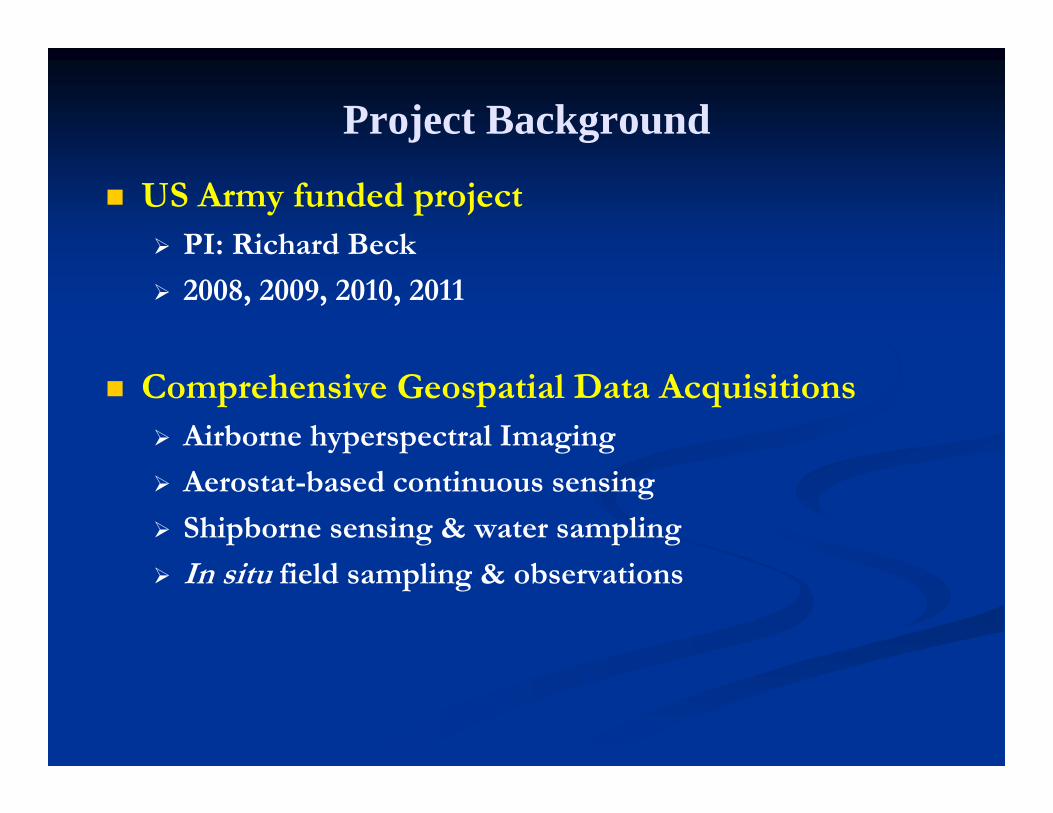
Project Background
US Army funded project PI: Richard Beck
2008, 2009, 2010, 2011
Comprehensive Geospatial Data Acquisitions Airborne hyperspectral Imaging
Aerostat-based continuous sensing
Shipborne sensing & water sampling
In situ field sampling & observations
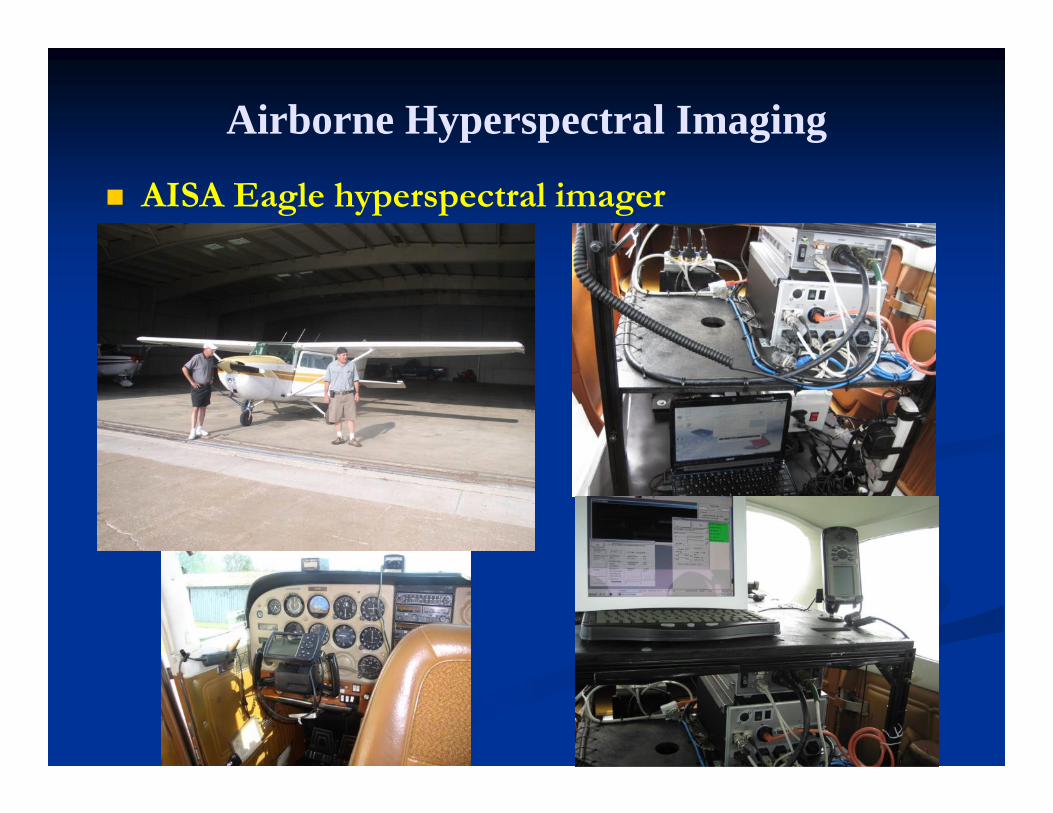
Airborne Hyperspectral Imaging
AISA Eagle hyperspectral imager
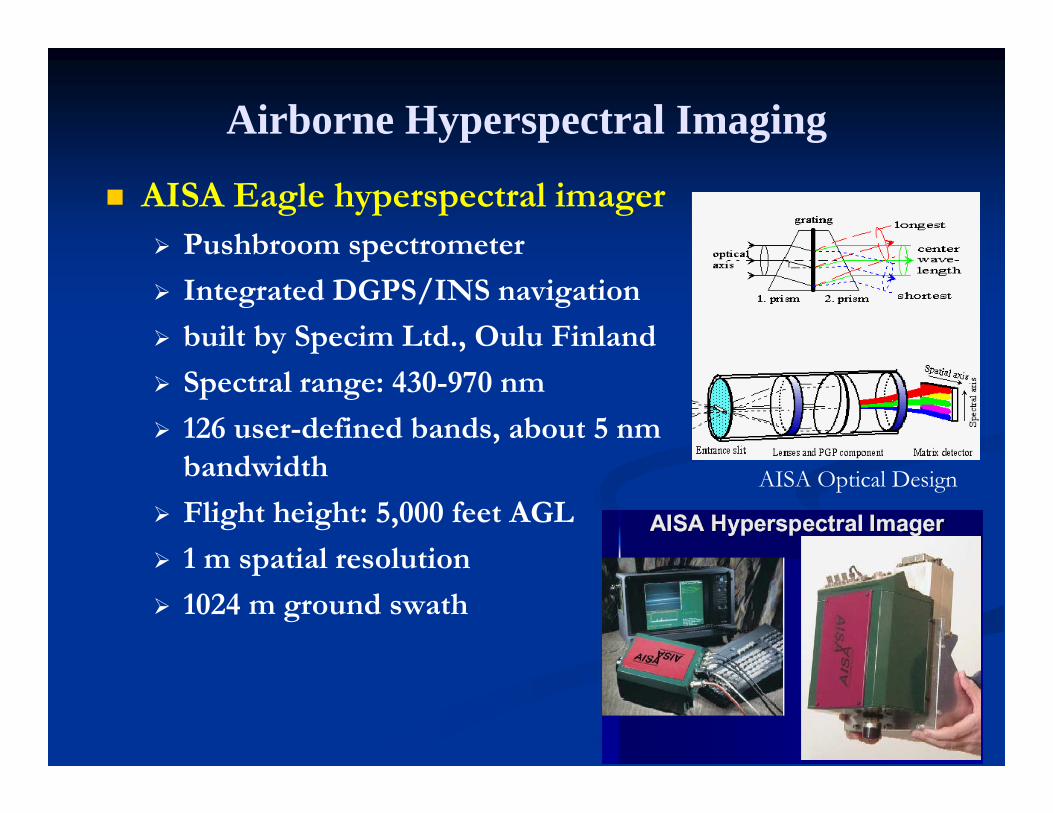
Airborne Hyperspectral Imaging
AISA Eagle hyperspectral imager Pushbroom spectrometer
Integrated DGPS/INS navigation
built by Specim Ltd., Oulu Finland
Spectral range: 430-970 nm
126 user-defined bands, about 5 nm bandwidth
Flight height: 5,000 feet AGL
1 m spatial resolution
1024 m ground swath
AISA Optical Design
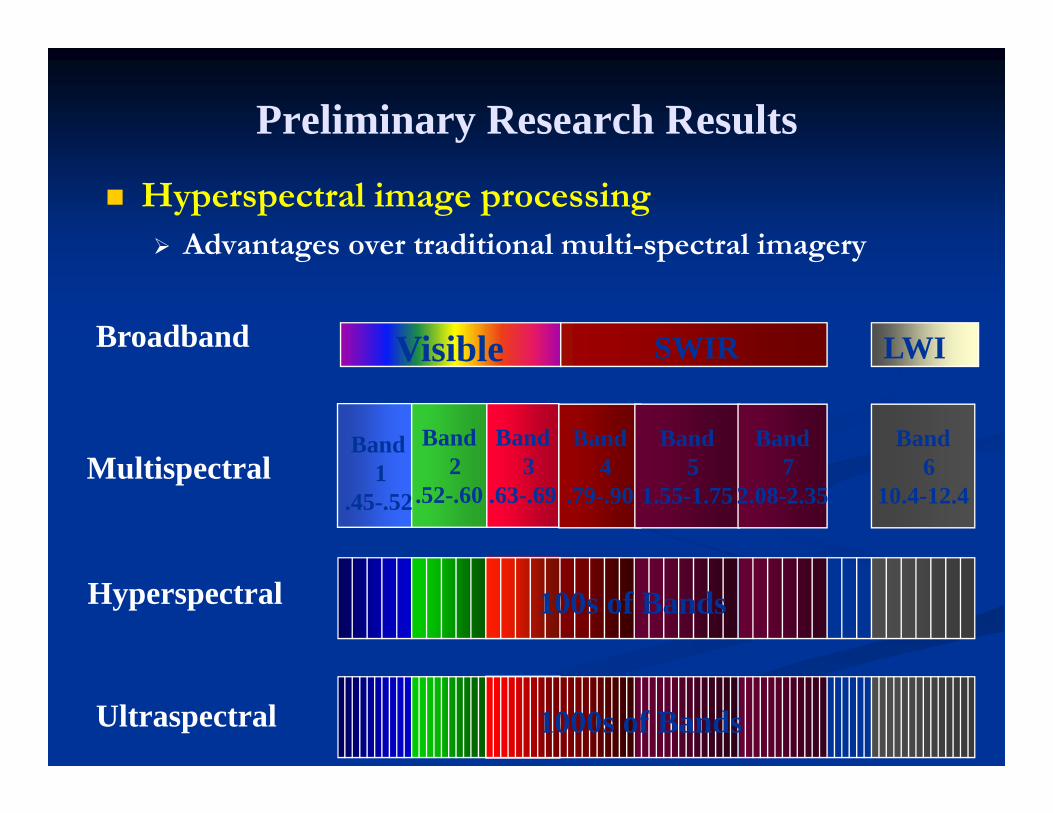
Preliminary Research Results
Hyperspectral image processing Advantages over traditional multi-spectral imagery
100s of Bands
Band2
.52-.60
Band3
.63-.69
Band4
.79-.90
Band5
1.55-1.75
Band7
2.08-2.35
Band1
.45-.52
Band6
10.4-12.4
Visible SWIR LWIR
1000s of BandsUltraspectral
Broadband
Hyperspectral
Multispectral
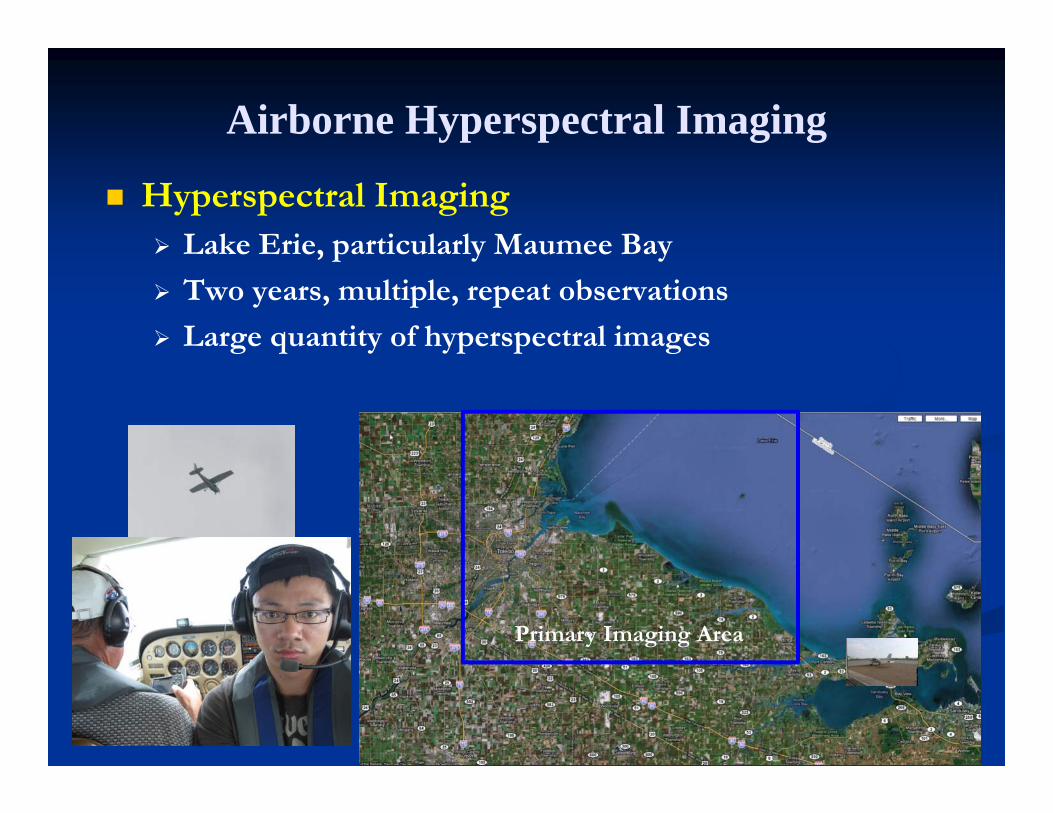
Airborne Hyperspectral Imaging
Hyperspectral Imaging Lake Erie, particularly Maumee Bay
Two years, multiple, repeat observations
Large quantity of hyperspectral images
Primary Imaging Area
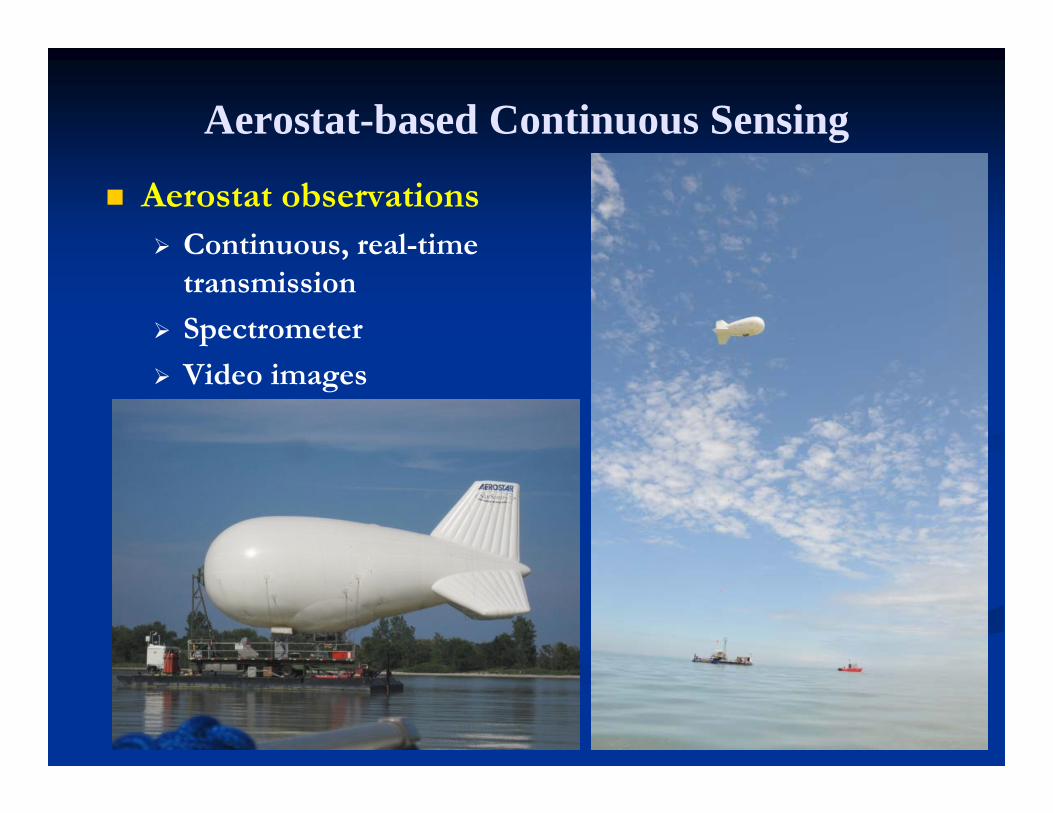
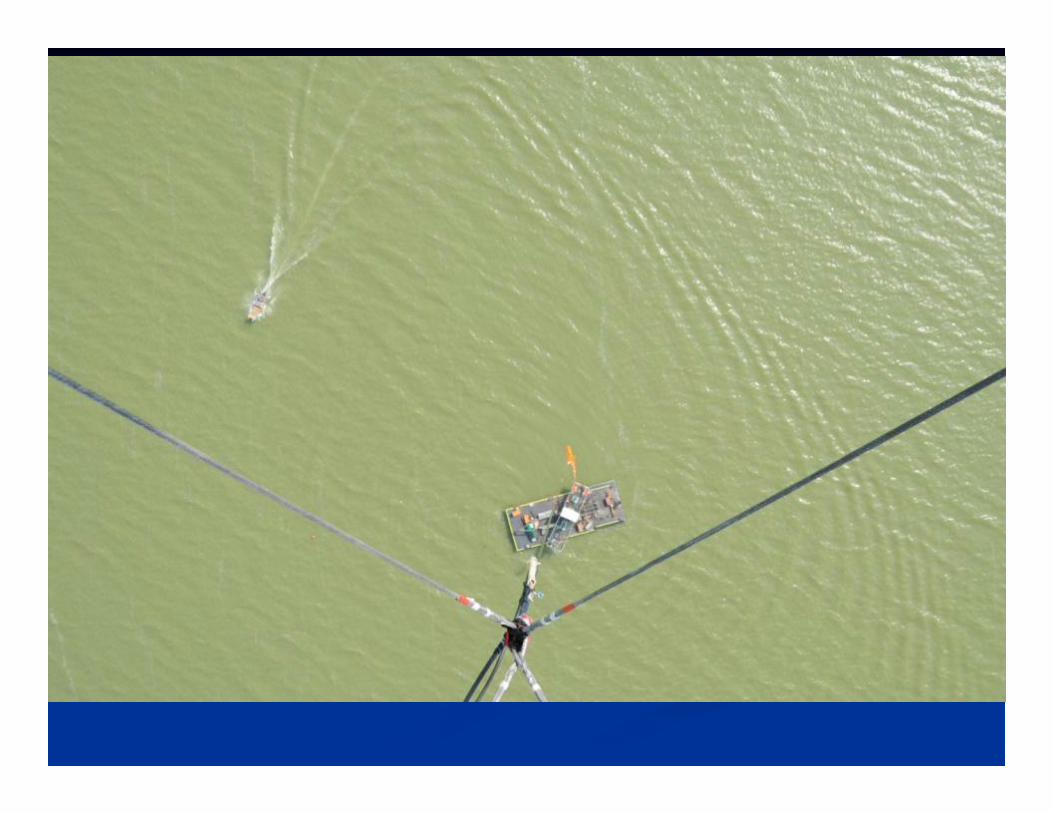
Aerostat-based Continuous Sensing
Aerostat observations Continuous, real-time
transmission
Spectrometer
Video images
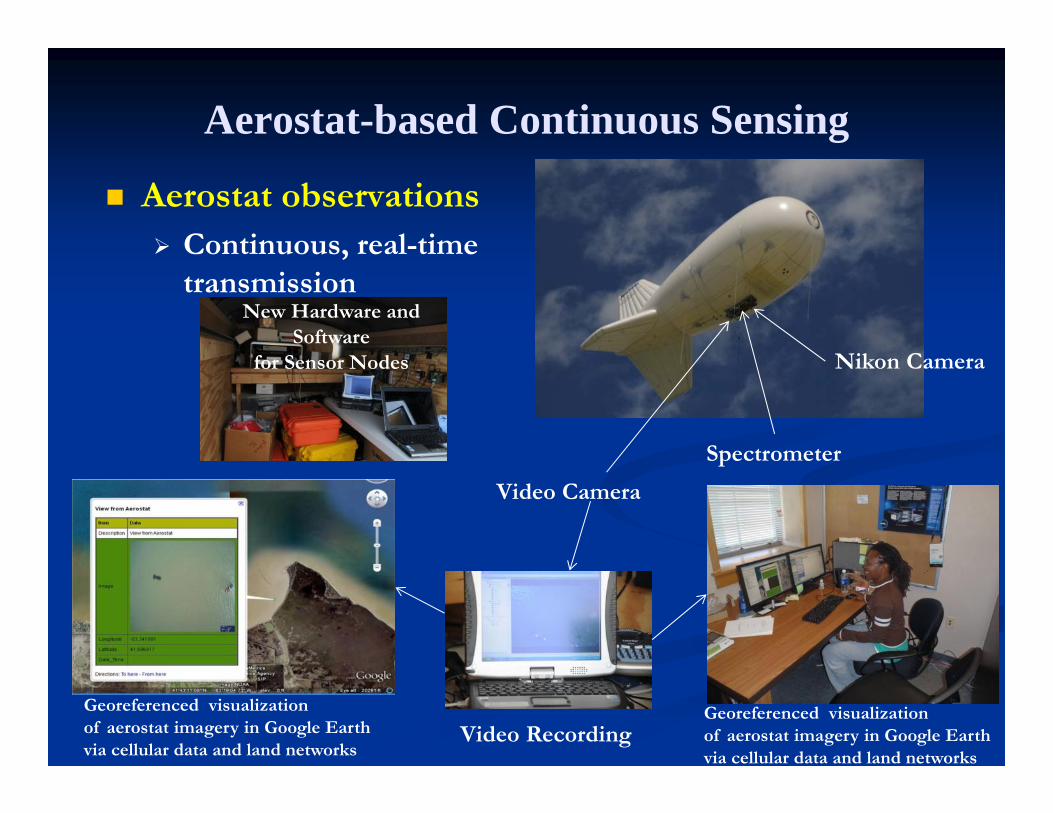
Aerostat-based Continuous Sensing
Aerostat observations Continuous, real-time
transmission
Nikon Camera
Video Camera
Spectrometer
New Hardware and Software
for Sensor Nodes
Video RecordingGeoreferenced visualizationof aerostat imagery in Google Earth via cellular data and land networks
Georeferenced visualizationof aerostat imagery in Google Earth via cellular data and land networks
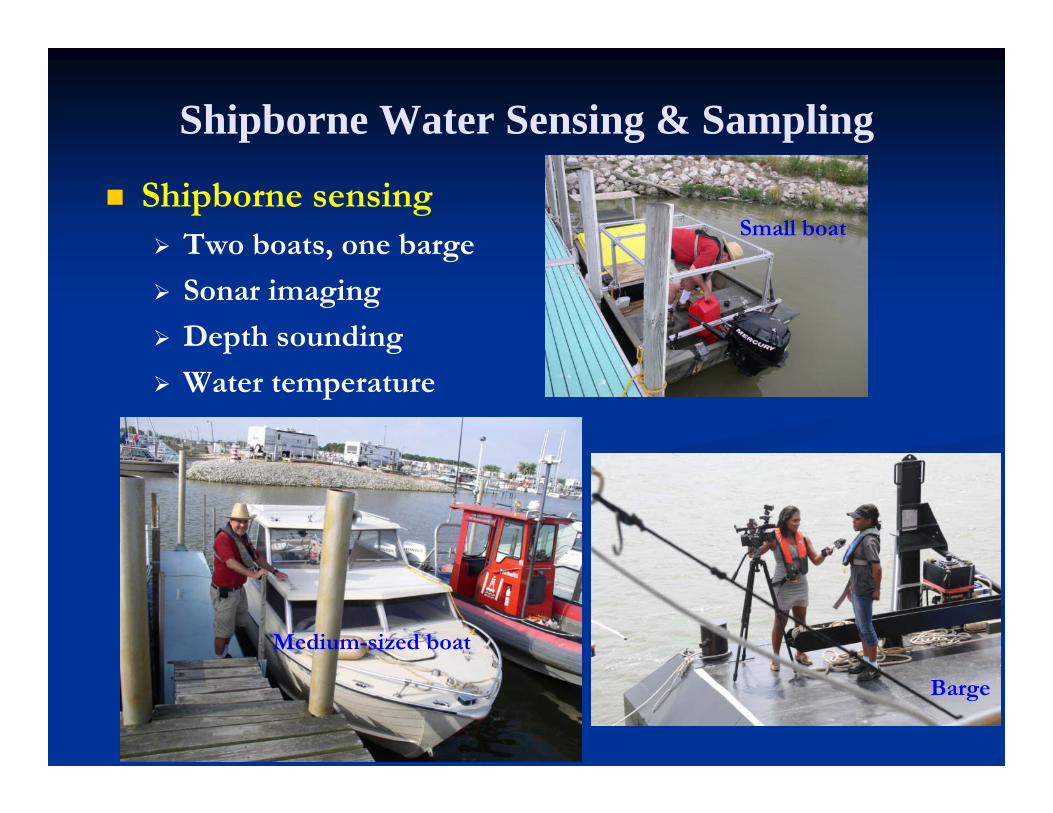
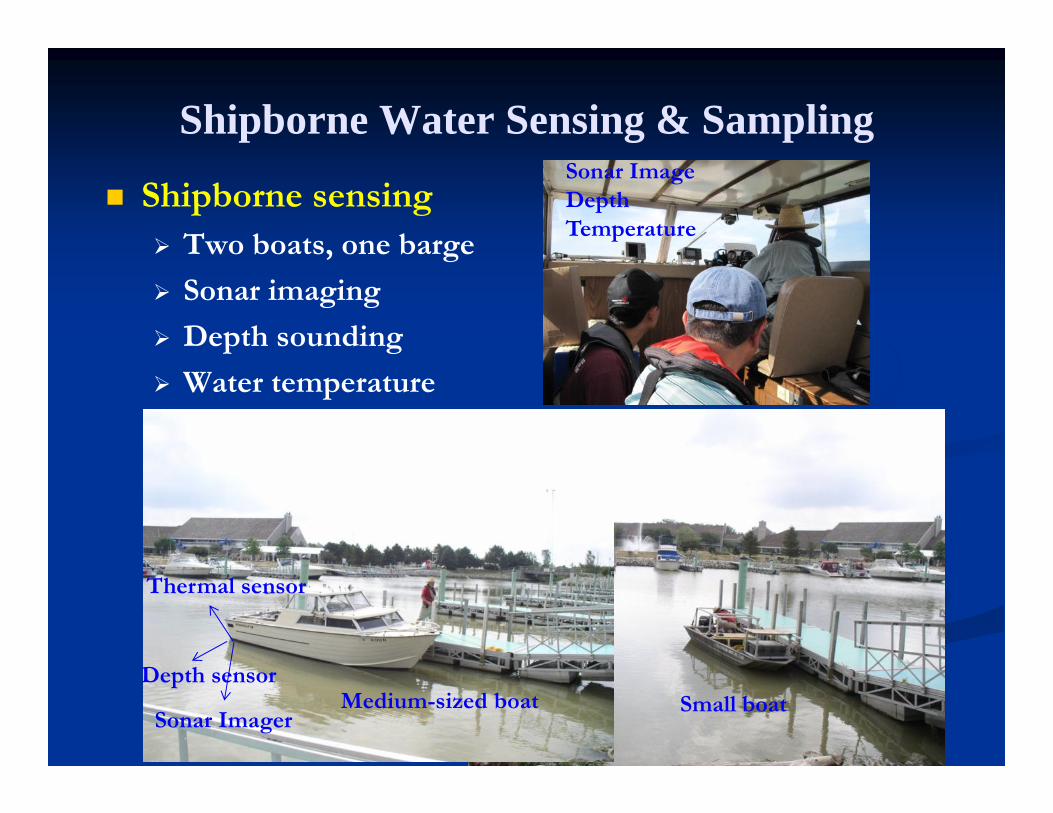
Shipborne Water Sensing & Sampling
Shipborne sensing Two boats, one barge
Sonar imaging
Depth sounding
Water temperature
Medium-sized boat
Small boat
Barge
Shipborne Water Sensing & Sampling
Shipborne sensing Two boats, one barge
Sonar imaging
Depth sounding
Water temperature
Sonar ImagerSmall boatMedium-sized boat
Thermal sensor
Depth sensor
Sonar ImageDepthTemperature
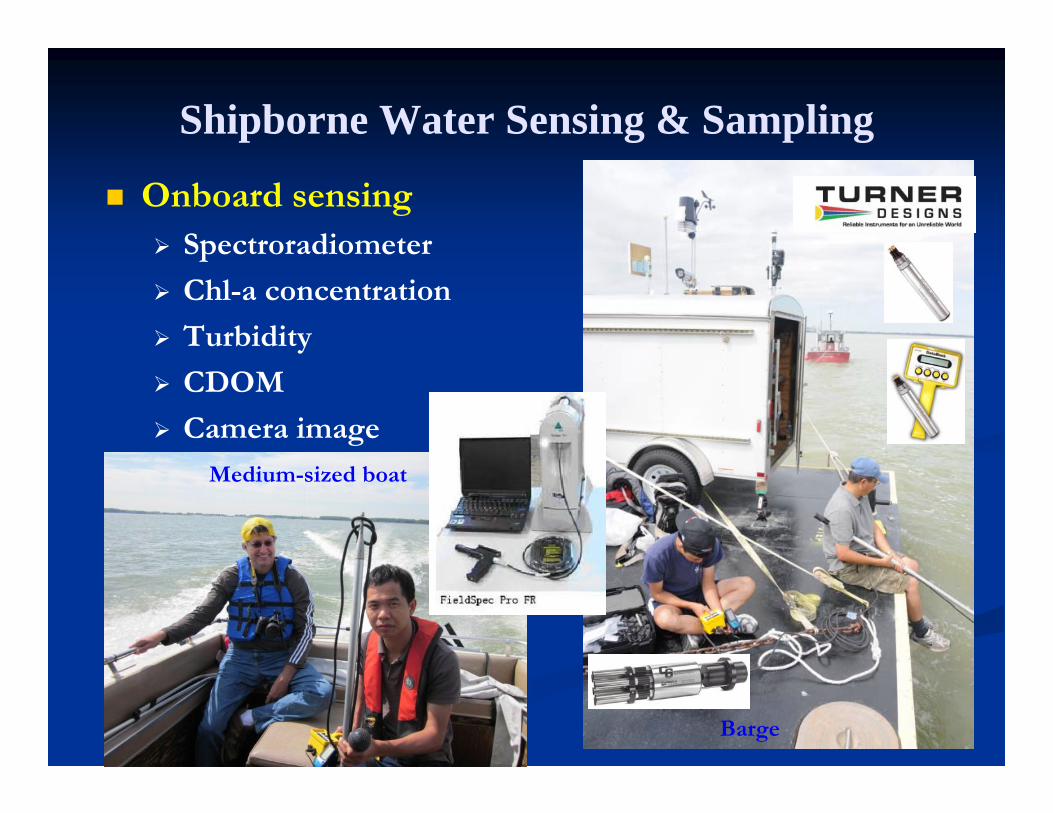
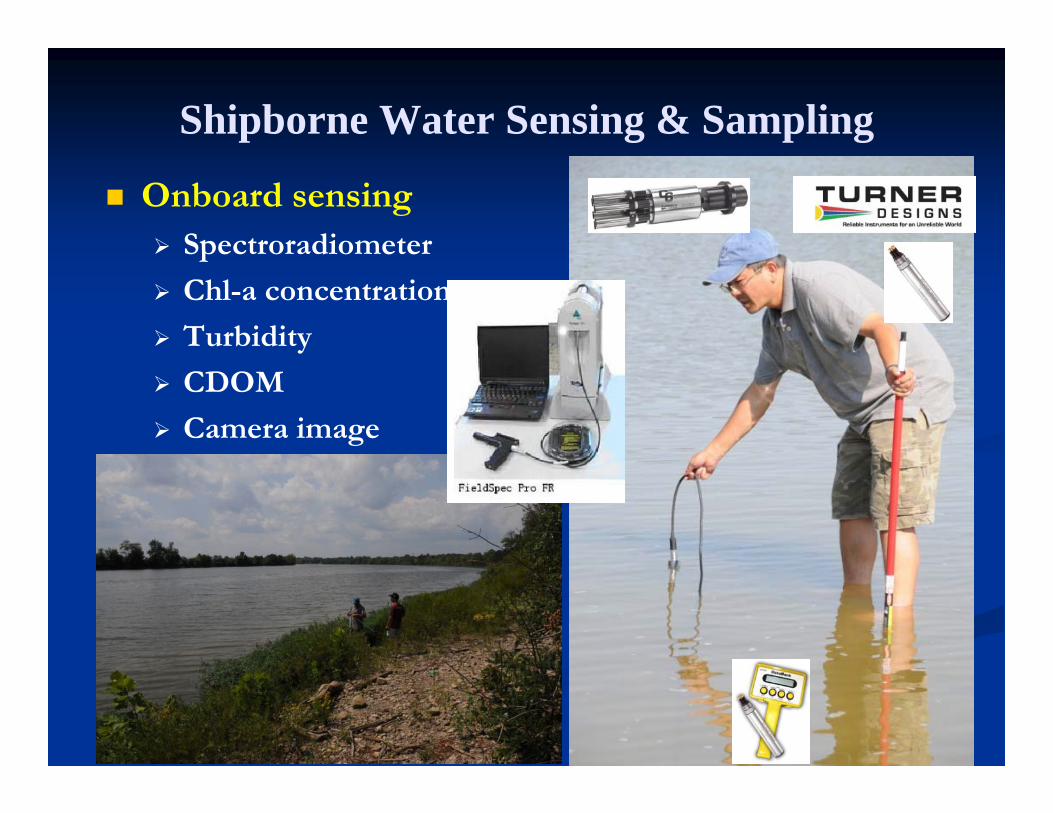
Shipborne Water Sensing & Sampling
Onboard sensing Spectroradiometer
Chl-a concentration
Turbidity
CDOM
Camera image
Medium-sized boat
Barge
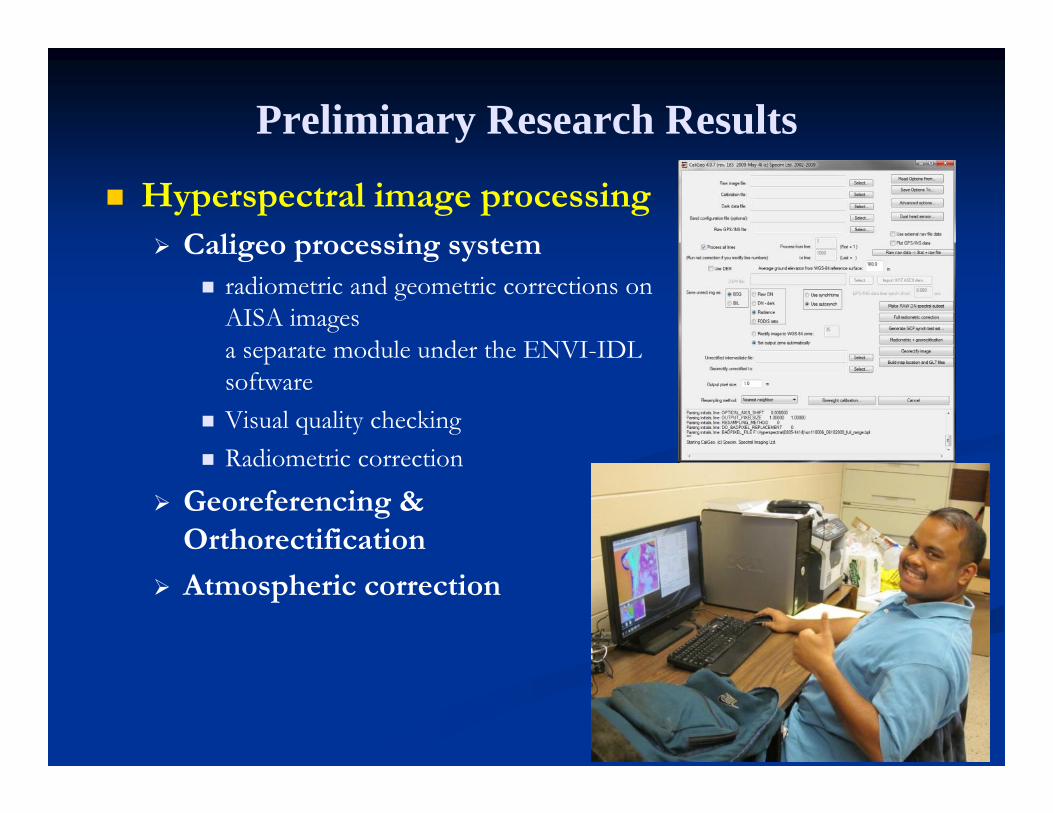
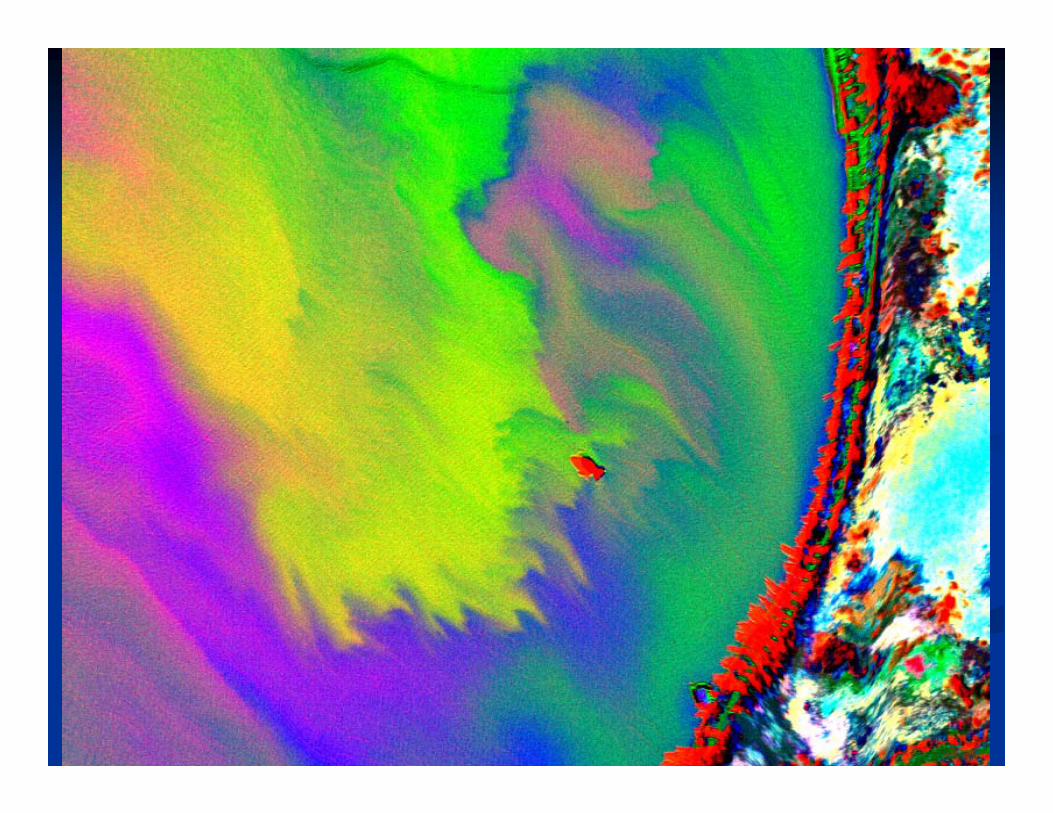
Preliminary Research Results
Hyperspectral image processing Caligeo processing system
radiometric and geometric corrections on AISA imagesa separate module under the ENVI-IDL software
Visual quality checking Radiometric correction
Georeferencing & Orthorectification
Atmospheric correction
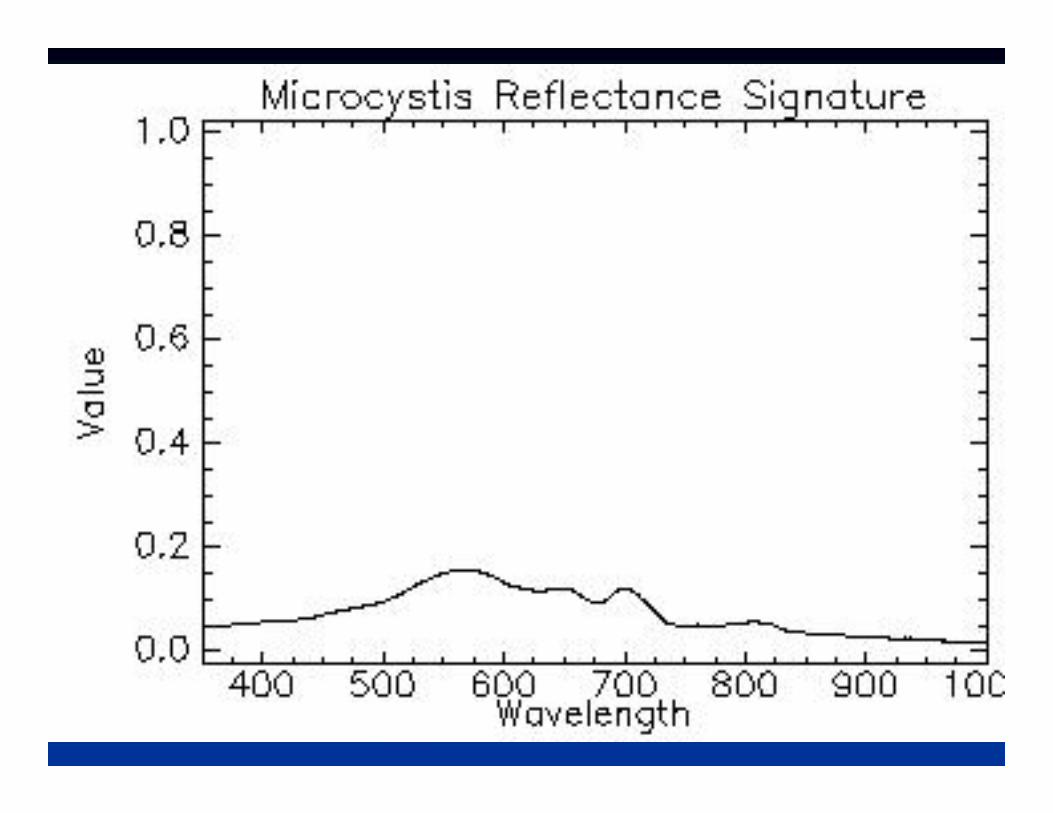
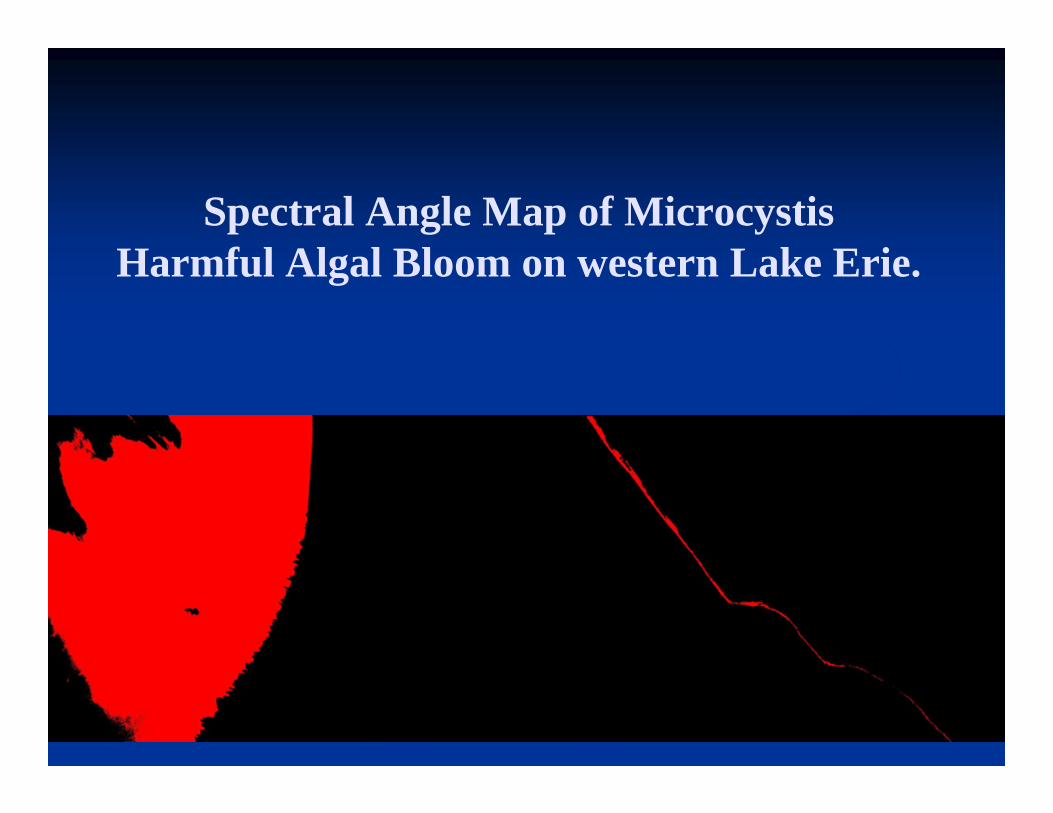
Spectral Angle Map of MicrocystisHarmful Algal Bloom on western Lake Erie.
Shipborne Water Sensing & Sampling
Onboard sensing Spectroradiometer
Chl-a concentration
Turbidity
CDOM
Camera image
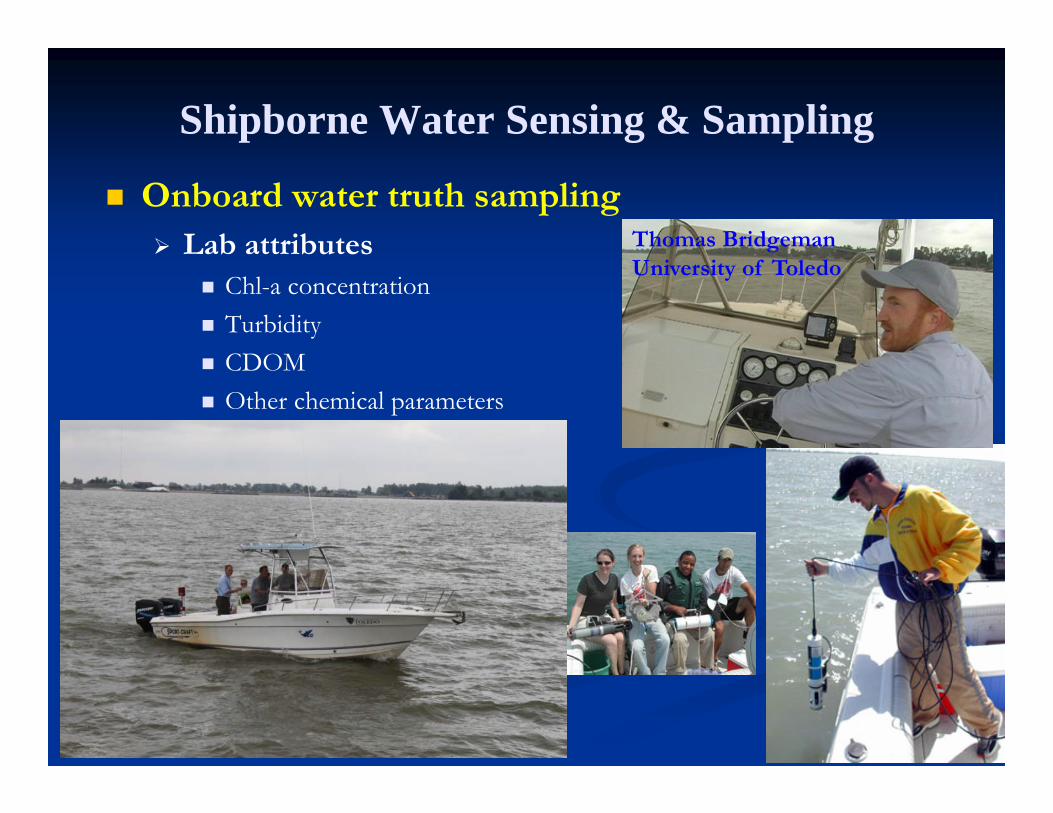
Shipborne Water Sensing & Sampling
Onboard water truth sampling Lab attributes
Chl-a concentration Turbidity CDOM Other chemical parameters
Thomas BridgemanUniversity of Toledo
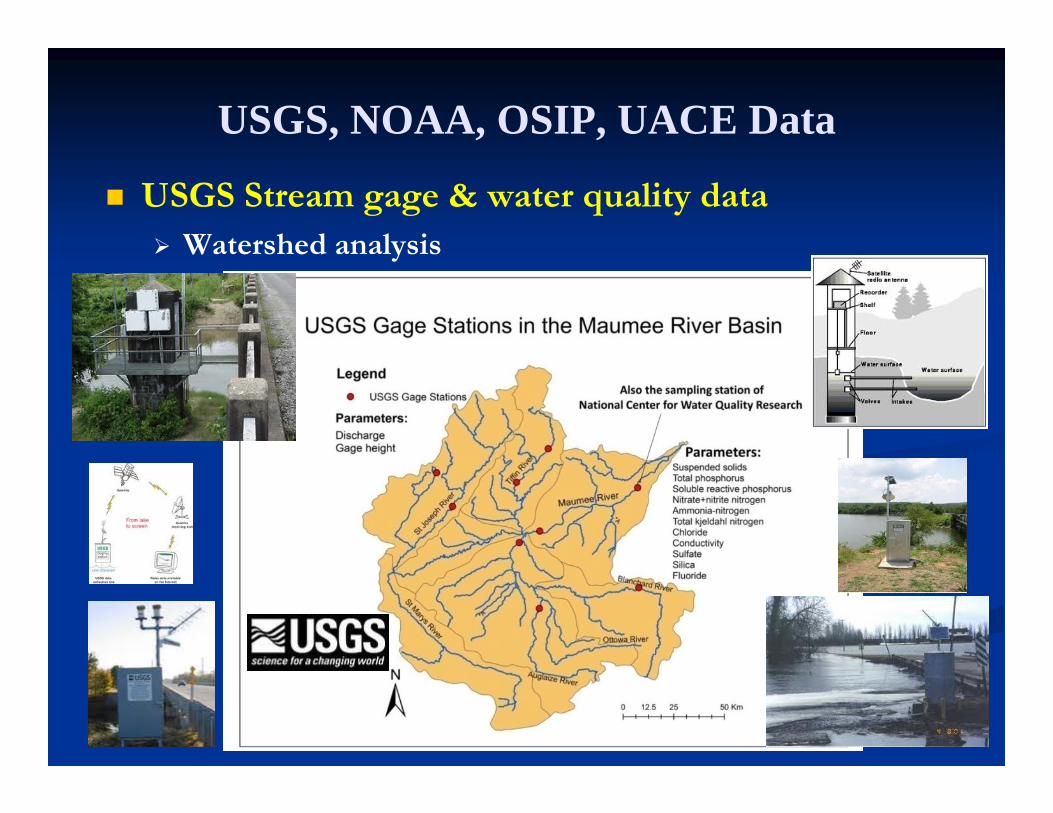
USGS, NOAA, OSIP, UACE Data
USGS Stream gage & water quality data Watershed analysis
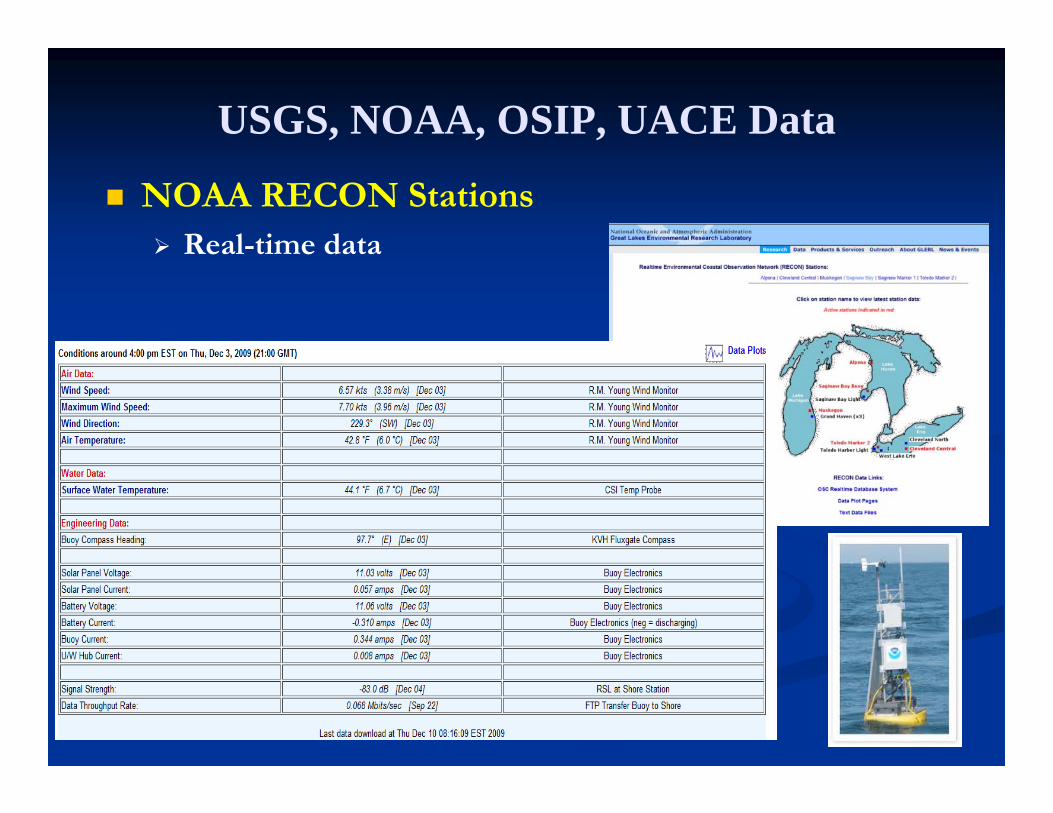
USGS, NOAA, OSIP, UACE Data
NOAA RECON Stations Real-time data
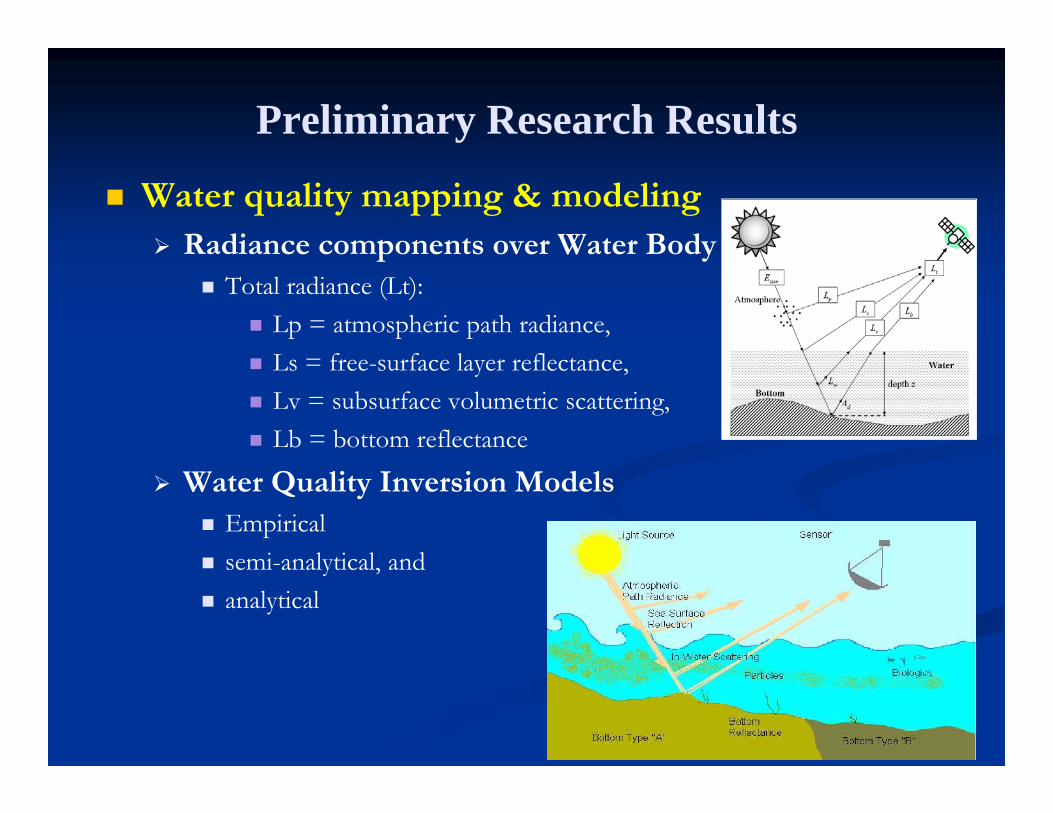
Preliminary Research Results
Water quality mapping & modeling Radiance components over Water Body
Total radiance (Lt): Lp = atmospheric path radiance, Ls = free-surface layer reflectance, Lv = subsurface volumetric scattering, Lb = bottom reflectance
Water Quality Inversion Models Empirical semi-analytical, and analytical
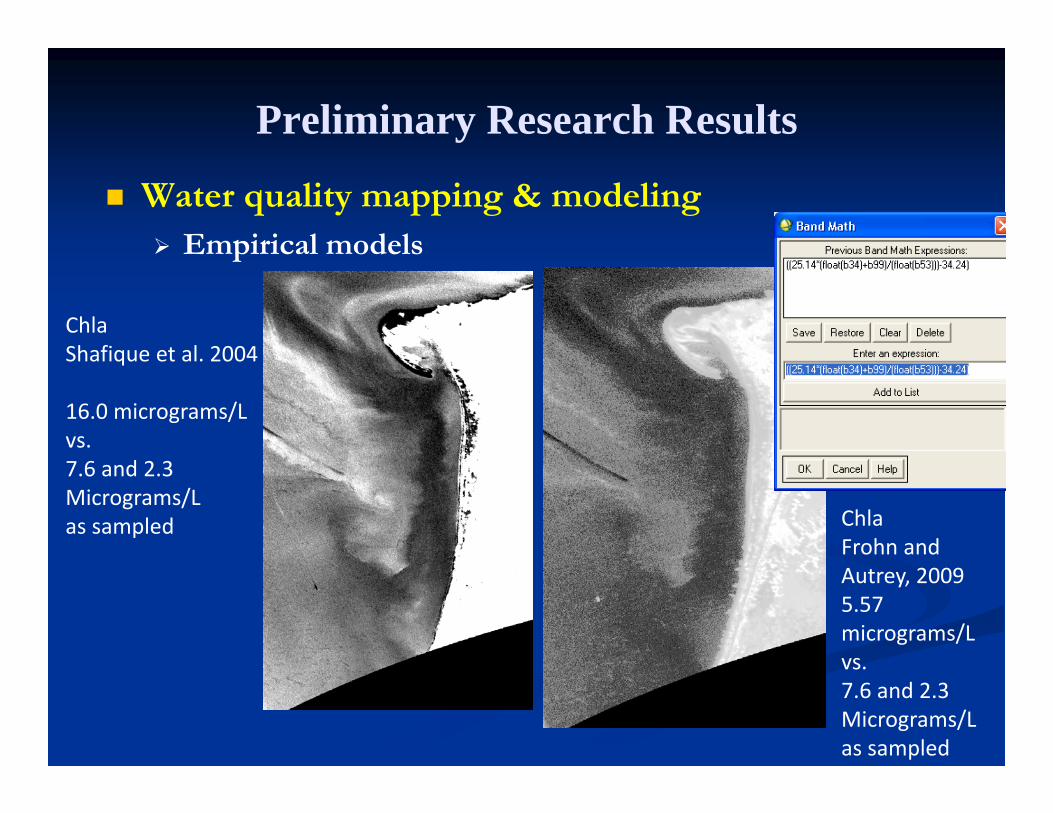
Preliminary Research Results
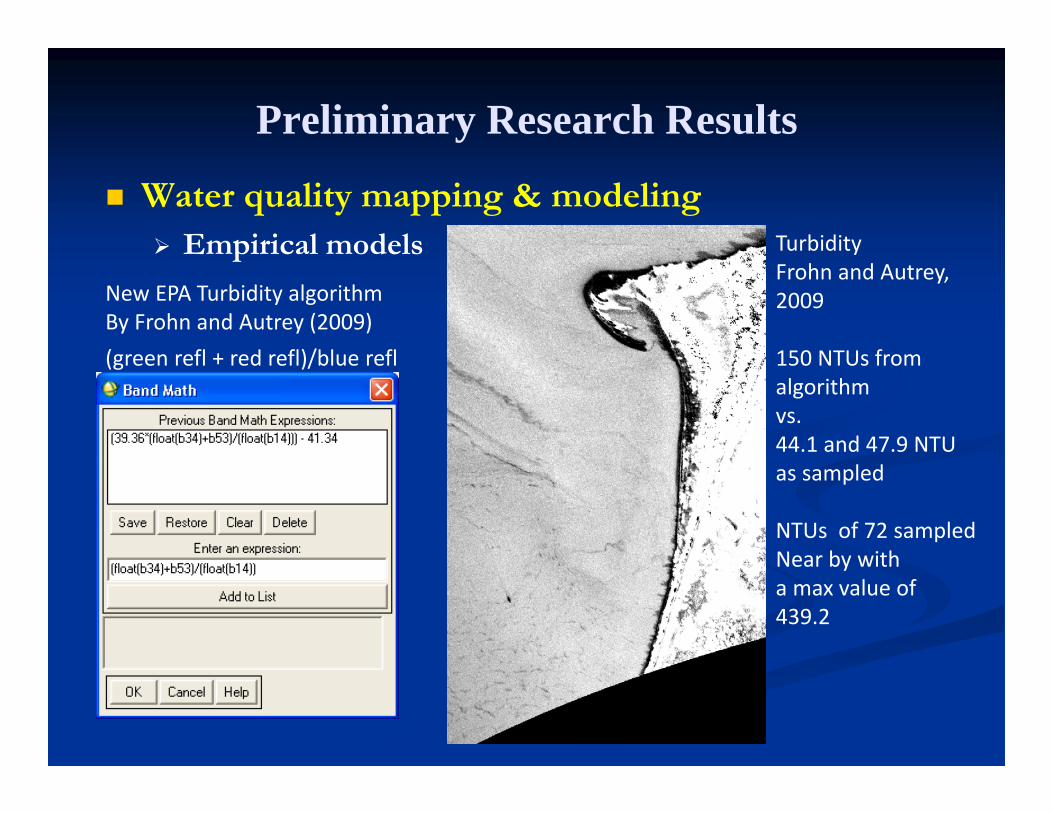
Water quality mapping & modeling Empirical models
ChlaShafique et al. 2004
16.0 micrograms/Lvs.7.6 and 2.3 Micrograms/Las sampled Chla
Frohn andAutrey, 20095.57 micrograms/Lvs.7.6 and 2.3 Micrograms/Las sampled
Preliminary Research Results
Water quality mapping & modeling Empirical models
New EPA Turbidity algorithmBy Frohn and Autrey (2009)(green refl + red refl)/blue refl
TurbidityFrohn and Autrey, 2009
150 NTUs from algorithmvs.44.1 and 47.9 NTUas sampled
NTUs of 72 sampledNear by witha max value of439.2
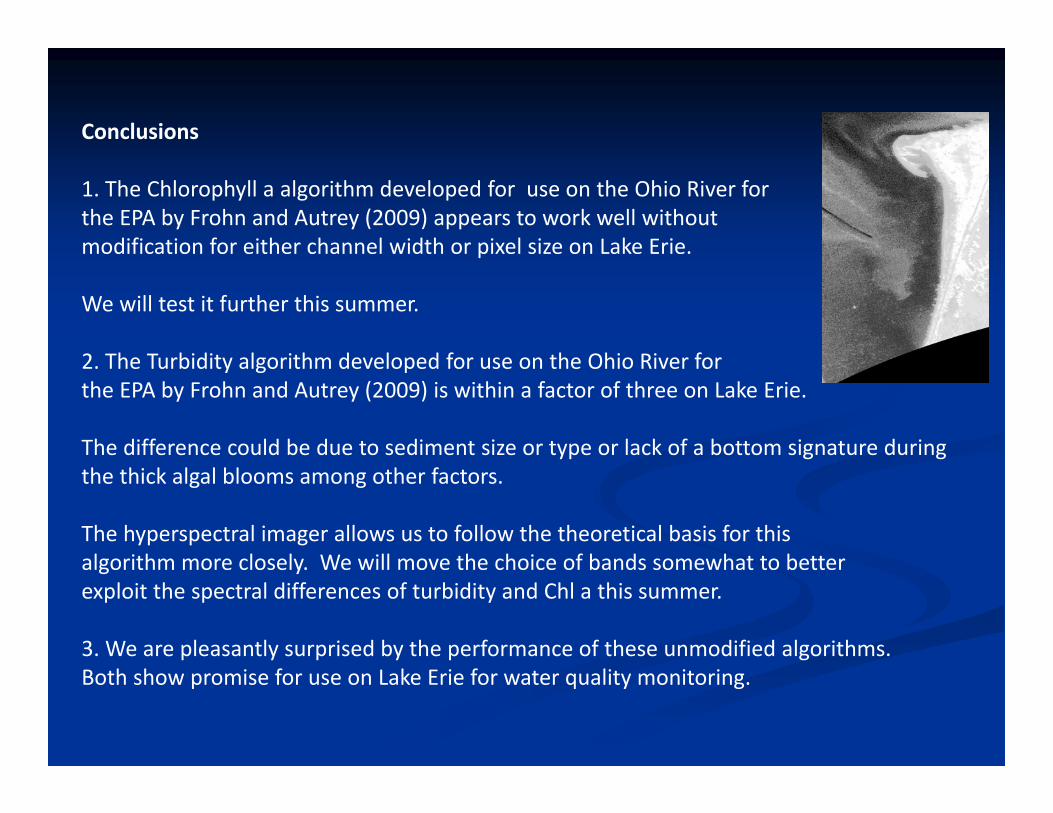
Conclusions
1. The Chlorophyll a algorithm developed for use on the Ohio River for the EPA by Frohn and Autrey (2009) appears to work well without modification for either channel width or pixel size on Lake Erie.
We will test it further this summer.
2. The Turbidity algorithm developed for use on the Ohio River for the EPA by Frohn and Autrey (2009) is within a factor of three on Lake Erie.
The difference could be due to sediment size or type or lack of a bottom signature during the thick algal blooms among other factors.
The hyperspectral imager allows us to follow the theoretical basis for thisalgorithm more closely. We will move the choice of bands somewhat to betterexploit the spectral differences of turbidity and Chl a this summer.
3. We are pleasantly surprised by the performance of these unmodified algorithms.Both show promise for use on Lake Erie for water quality monitoring.
Preliminary Research Results
1. Mapping Microcystis Harmful Algal Blooms with VNIR Hyperspectral imagery is easy.
2. High spatial resolution hyperspectral data was useful for prototyping HAB mapping (you can see the boats) but is too fine for routine, wide area application.
3. Very low spatial resolution (1 km) spatial resolution data is too coarse for near shore applications
4. Routine operational 60 meter HyspIRI data would be ideal for near shore HAB mapping and other water quality studies on the Great Lakes.