Embed Size (px)
Citation preview
BECOME A SLOAN AFFILIATE http://www.sloan.org/programs/affiliates.shtml
Preparing for a services economy:
an evaluation of higher education in India
Rafiq Dossani Stanford University [email protected]
Murali Patibandla
Indian Institute of Management Bannerghatta Road, Bangalore 560076 [email protected]
1
Preparing for a services economy: an evaluation of higher education in India
February 27, 2008
Rafiq DossaniStanford University
&
Murali PatibandlaIndian Institute of Management
Bannerghatta Road, Bangalore [email protected]
*=corresponding author. Dossani thanks the Sloan Foundation for financial support. Healso thanks Frank Mayadas, Maham Mela, Rohan Tandon, Sudip Nandy and VibhuMittal for comments and assistance.
2
Abstract: This report is part of a larger study to examine the role of higher education in
India’s success in providing globally traded services. In this report, we assess the quality
of software engineering education. We find that the institutional structure has the
capacity to produce a quality of engineer suited to the current needs of the marketplace.
This is a remarkable achievement considering the rapid change in both job requirements
and the role of private provision in higher education. While it is too early to assess
whether the currently emergent needs, particularly in research, project management and
entrepreneurship, will be met by the current structure, we argue that the state’s role as
regulator will be critical. While the state has so far demonstrated its capabilities of being
an effective regulator, we argue that new regulatory capabilities will be needed of the
state to address the evolving demands.
Keywords: India, higher education, software engineering, regulation
3
Preparing for a services economy: an evaluation of higher education in India
Introduction
Even a decade ago, the idea that India would, in less than five years, compete in the
global services economy would have seemed farfetched. Although it had by then a
recognized and rising (though small) presence in software exports, the Indian services
sector was, overall, no different from services in countries at similar stages of
development. In such countries, services are largely provided by small, low-technology
enterprises catering to the local economy. India was no different as of the late 1990s.
As of 2007, the services sector is both driving economic growth in India and posing to be
a formidable global competitor. Services comprise 55% of GDP and have lately been
growing at a near 10% rate. Of course, most services remain small, low growth, low-
technology services, many of which will reduce in importance as manufacturing grows in
the newly reformed environment. But several of the high-growth services are
sophisticated services and represent a turnaround from the past. Telecommunications
services, for example, were of poor quality and generated negligible revenue a decade
ago. Today, India’s telecommunications sector is one of the world’s most sophisticated,
with redundant fiber optic networks that reach almost all settlements, including India’s
600,000 villages; a wireless network that adds more customers each month than China;
and, a sector that, overall, contributes over 5% to GDP. Airlines and financial services
are other such examples that service the domestic markets.
4
The services sector in which India has made its mark as a global provider is the IT-
enabled services sector. From a size of less than 1% of GDP in 1997, India’s IT-enabled
services exports comprised 3.6 % of GDP in 2006. The value of these exports rose from
$1.8 billion in 1997 to $32 billion in 2006, an annualized growth rate of over 35%.
(Nasscom, 2007, p.54). With this, India has left other developing and even some
developed countries far behind in their ambitions to become leaders in services exports.
The term “IT-enabled services” might not convey to the reader the range of services that
are exported from India. They potentially include any service that can be delivered
electronically using digital technologies. While, initially, the exports were confined to
software programming and, later, call-centers, over the past few years, the range and
depth of work has changed dramatically. The list now includes scientific research and
development, financial services, market research, data-mining and a host of other
services. Largely, the services are located in the vertical termed “professional, scientific
and technical services”.1
The Indian success with remote services provision disproves a widespread belief that
Asia is better at manufacturing than services. This shibboleth is based on the evidence
that even the advanced economies of Asia, i.e., Japan, Singapore, Taiwan, Hong Kong
and Korea, have failed to create globally competitive service industries. In a range of
1 The US government’s NAICS code 54 defines the sector: “The Professional, Scientific, and Technical Services sectorcomprises establishments that specialize in performing professional, scientific, and technical activities for others. Theseactivities require a high degree of expertise and training. The establishments in this sector specialize according toexpertise and provide these services to clients in a variety of industries and, in some cases, to households. Activitiesperformed include: legal advice and representation; accounting, bookkeeping, and payroll services; architectural,engineering, and specialized design services; computer services; consulting services; research services; advertisingservices; photographic services; translation and interpretation services; veterinary services; and other professional,scientific, and technical services.” http://www.census.gov/epcd/naics02/def/NDEF54.HTM June 11, 2007
5
other key services, such as software, retailing, telecommunications, logistics and
insurance, there are no Asian global brand names. The common understanding behind
this belief is that acquiring advanced services skills is not an easy or short-term task.
Instead, Asia’s economic growth was driven by manufactured goods’ exports. This was
based on the application of large inputs of physical and financial capital. (Krugman,
1994).
Yet, this is not true of India. Further, Indian firms such as TCS in software services and
the Taj group in hotels are beginning to be recognized as brand names. Along with this,
the provision of global services is growing in scale, scope and depth at rates that are
increasing India’s lead over potential competition (Dossani and Kenney, 2007).
This paper examines the contribution of higher education to this success. Before doing
so, we briefly examine some other factors that enabled the success of India’s global
services sector.
The first is the way that the world economy has developed. The previous paradigm of
services spatially tied to core nationally-based manufacturing activities has been replaced
by one based on the provision of globally tradable services. This advantages countries
with advanced services skills. India’s turn towards services, in part because of policies
that restricted manufacturing, preceded other low-cost countries that were still intensely
6
involved in harvesting manufacturing. This gave India a first-mover advantage that it
has continued to capitalize on.
Second, some attribute India’s success in providing technical services to technology
itself. As documented elsewhere (see Dossani and Denny (2007), Dossani and Kenney,
(2007)), the technology for the remote provision of services has changed dramatically in
the past decade. The Internet and lower digital storage costs have combined to reduce the
capital costs associated with remote service provision; while modularization of software
preparation and other services has reduced the operating costs of remote provision.
The impact of the first mover advantage should not be overstated. India was not the first
mover in global service provision from a low cost country. Many Asian countries
entered global service provision much earlier than India, such as Japanese and Korean
banks in the 1980s, with limited success.
Likewise, on the enabling power of technology, many other countries– in east Asia and
southeast Asia, for instance, had similar or better access to the latest technologies earlier
than India. Their infrastructure, capital access and scale of global trade were far superior
to India. Had technological change been the only enabler of services, these would have
captured the business a long time before India was even an entrant.
The explanation for India’s success is, therefore, unlikely to be a simple one. However,
as the foregoing discussion indicates, it is likely to lie in some dimension of human
7
capital rather than physical or financial capital. Unlike manufacturing, where it is
possible to produce high technology products by applying relatively unskilled labor to
sophisticated machinery, skilled services, by contrast, cannot be provided by combining
unskilled labor with physical and financial capital. By definition, the providers of ‘just-
in-time’ skilled services such as IT help desks need to be as skilled as the service
provided.2 Even many ‘storable’ services such as software code require skilled labor.
There are several skills that appear to be relevant. Indians’ most obvious advantage over
other low-cost providers is that a relatively large number of people, perhaps as many as
50 million, speak fluent English. Many of them were underemployed till the 1990s due
to India’s closed economy. Once India opened up its economy in the 1990s, it has been
argued, this became an asset.
However, this “late-mover but English speaking” advantage is unlikely to be the only or
even the main reason for India’s success. There are many countries whose citizens speak
equally fluent English, where wage rates are comparable, which globalized earlier than
India, and have failed to become global service providers. The Philippines, which
opened its economy to global trade two decades before India, is an example.
On the other hand, although it is hard to come by examples in the developing world,
there are examples of firms operating in developed countries where English is not widely
2 I am grateful to Frank Mayadas for this key insight.
8
spoken and yet have succeeded widely in other western markets. SAP of Germany is one
example, but there are several others in services such as IT, retailing and logistics.
A second aspect is higher education, including technical education. The need for such an
education is no longer doubted by development analysts and policymakers (World Bank,
2000, p.12) There have been several reports of late that show that India and China are
producing a large number of students that are skilled in particular vocations, particularly
engineering. Some of these reports also question the quality of the students (Wadhwa, et.
al., 2007).
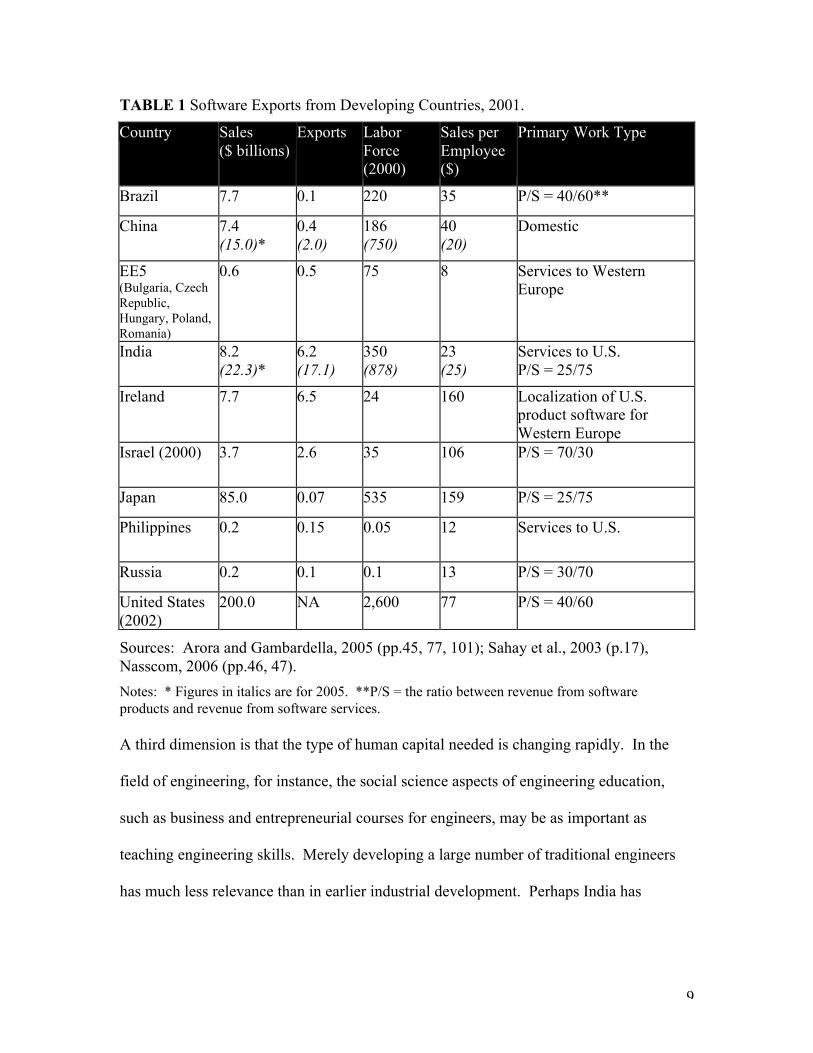
Even if the number is high and the quality is good, it is not obvious that this “scale-and-
depth” factor is sufficient for success. As the following table for the software industry
shows, neither size nor stage of development are sufficient to explain a country’s success.
The table shows that there are countries such as Japan, with a large and high quality
software labor force, which have been unsuccessful at global software provision; there
are countries, such as Brazil and China, with a large software labor force, and a more
uncertain quality of engineer, which have also been unsuccessful. On the other hand,
Ireland and Israel have small labor forces, presumably produce a high quality of engineer
and are successful.
9
TABLE 1 Software Exports from Developing Countries, 2001.
Country Sales($ billions)
Exports LaborForce(2000)
Sales perEmployee($)
Primary Work Type
Brazil 7.7 0.1 220 35 P/S = 40/60**
China 7.4(15.0)*
0.4(2.0)
186(750)
40(20)
Domestic
EE5(Bulgaria, CzechRepublic,Hungary, Poland,Romania)
0.6 0.5 75 8 Services to WesternEurope
India 8.2(22.3)*
6.2(17.1)
350(878)
23(25)
Services to U.S.P/S = 25/75
Ireland 7.7 6.5 24 160 Localization of U.S.product software forWestern Europe
Israel (2000) 3.7 2.6 35 106 P/S = 70/30
Japan 85.0 0.07 535 159 P/S = 25/75
Philippines 0.2 0.15 0.05 12 Services to U.S.
Russia 0.2 0.1 0.1 13 P/S = 30/70
United States(2002)
200.0 NA 2,600 77 P/S = 40/60
Sources: Arora and Gambardella, 2005 (pp.45, 77, 101); Sahay et al., 2003 (p.17),Nasscom, 2006 (pp.46, 47).
Notes: * Figures in italics are for 2005. **P/S = the ratio between revenue from softwareproducts and revenue from software services.
A third dimension is that the type of human capital needed is changing rapidly. In the
field of engineering, for instance, the social science aspects of engineering education,
such as business and entrepreneurial courses for engineers, may be as important as
teaching engineering skills. Merely developing a large number of traditional engineers
has much less relevance than in earlier industrial development. Perhaps India has
10
succeeded in a transformation of the nature of engineering and science education so that
engineers have “scope” in addition to depth.
Our discussion above implies that India’s success is possibly due to some combination of
first mover advantages, English-language skills, scale, depth and scope. Examining all of
these in sufficient depth is outside the scope of this paper. Instead, this report focuses on
one discipline, software engineering, and limits its scope to an assessment of technical
education. The questions we pose are whether some fundamental aspects of the
education system for technical education, such as governance, have enabled India to
succeed as a service provider to date and whether these aspects will enable India to
continue to provide the quality of manpower it needs. The fundamental aspects are
defined in more detail in Section 3.
This report is divided as follows. In Section 2, we discuss the education system in India
– policy, scale of provision, role of different providers, etc. In Section 3, we provide a
theoretical model of factors that influence quality. In Section 4, we provide our
methodology of assessment and sources of data. Section 5 provides the results of our
assessment. Section 6 provides a concluding discussion.
11
Section 2 The education system in India
The role of the state
India has a federal constitution, under which education is a ‘concurrent’ subject, i.e., a
joint responsibility of the federal (central) government in New Delhi and the states. The
division of responsibilities is clear in some cases and not as clear in others. The central
government, it is agreed, is solely responsible for determining standards for teaching and
research. The state governments are supposed to establish universities and colleges that
meet these standards, allow private colleges to affiliate with universities, and are
responsible for the universities’ funding and management. Note that the university in the
Indian higher education system has a different meaning than in America. Indian
universities are largely ‘affiliating’ universities at the undergraduate level. They do not
offer their own courses but prescribe to the affiliated colleges the course of study, hold
examinations and award degrees. The colleges hire teachers, recruit students and
educate them.
About 80% of the funding for higher education is provided by the states and 20% by the
center through various bodies such as the University Grants Commission (see below).
Coordination between the central and state governments is done by the Central Advisory
Board of Education (CABE).
12
The division of responsibilities between the federal and state governments started to
overlap when India’s first Prime Minister, Nehru, ordered the federal ministry of
education to establish universities directly controlled by the federal government. This
was because Nehru was keen to speed up the quality of technical education in order to
realize his vision of the country as an industrial superpower. He felt that this needed
direct supervision from New Delhi rather than by the states. The Indian Institutes of
Technology (IITs) were an outcome of that vision. Currently, there are 18 federally run
universities of a total of over 300. They offer a higher quality of education than state
universities for several reasons, including superior funding. The policy direction of
selectively creating new federal universities continues to the present day, because it is
still policymaker opinion that the best institutions can only be created by federal-level
oversight.
Most university education, however continues to be provided by the states. This creates
the lack of the quality continuum mentioned above. The generously-funded central
universities occupy the upper quality tier and the state universities are, in general,
significantly behind. This feature also restricts the natural flow of the best students to
successively higher tiers within state-level institutions. In the U.S., a community college
student can end up within two years in a top-tier state university by performing well in
community college. This is not possible in India.
The federal government exercises its responsibility for setting and maintaining standards
through an apex body, the University Grants Commission, established in 1956, that is
13
“responsible for coordination, determination and maintenance of standards and the
release of grants”. http://www.education.nic.in/higedu.asp, downloaded June 6, 2007.
The UGC relies on professional councils set up by the federal government to recognize
colleges and universities and courses. The councils also channel UGC grants for
undergraduate education, while UGC directly funds other aspects of public higher
education, such as research and general budgets. The council that manages IT education
is the All India Council for Technical Education (AICTE).
14
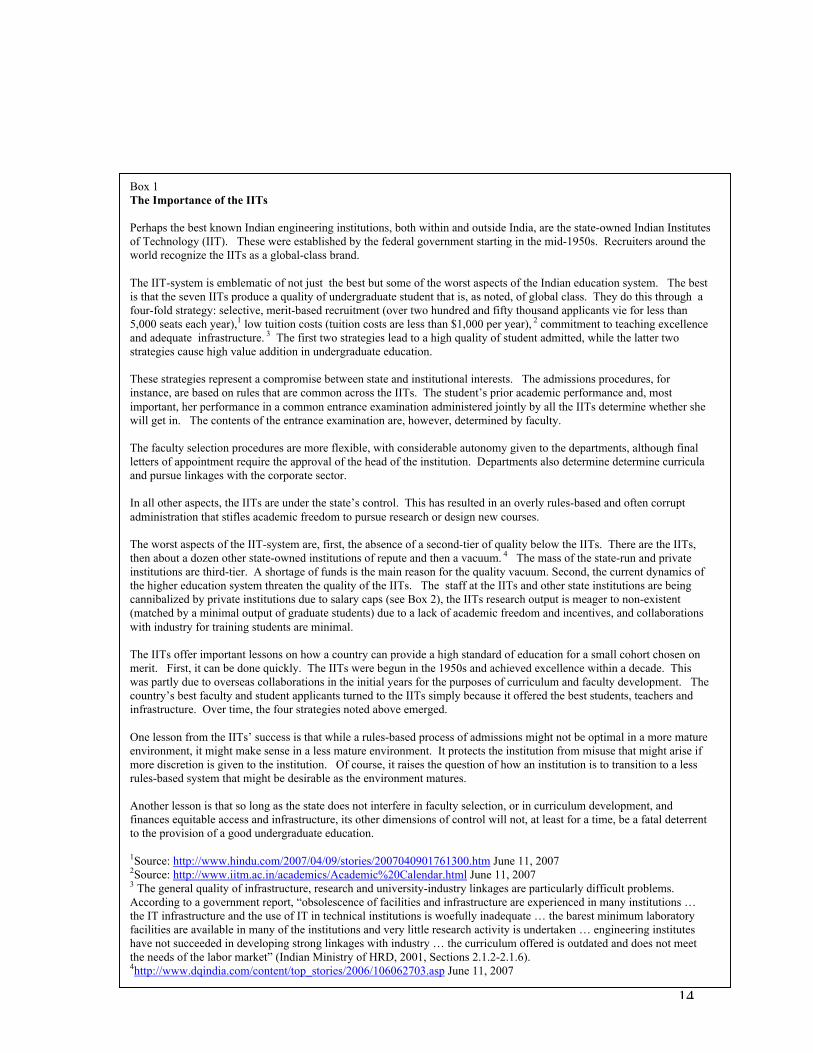
Box 1The Importance of the IITs
Perhaps the best known Indian engineering institutions, both within and outside India, are the state-owned Indian Institutesof Technology (IIT). These were established by the federal government starting in the mid-1950s. Recruiters around theworld recognize the IITs as a global-class brand.
The IIT-system is emblematic of not just the best but some of the worst aspects of the Indian education system. The bestis that the seven IITs produce a quality of undergraduate student that is, as noted, of global class. They do this through afour-fold strategy: selective, merit-based recruitment (over two hundred and fifty thousand applicants vie for less than5,000 seats each year),1 low tuition costs (tuition costs are less than $1,000 per year), 2 commitment to teaching excellenceand adequate infrastructure. 3 The first two strategies lead to a high quality of student admitted, while the latter twostrategies cause high value addition in undergraduate education.
These strategies represent a compromise between state and institutional interests. The admissions procedures, forinstance, are based on rules that are common across the IITs. The student’s prior academic performance and, mostimportant, her performance in a common entrance examination administered jointly by all the IITs determine whether shewill get in. The contents of the entrance examination are, however, determined by faculty.
The faculty selection procedures are more flexible, with considerable autonomy given to the departments, although finalletters of appointment require the approval of the head of the institution. Departments also determine determine curriculaand pursue linkages with the corporate sector.
In all other aspects, the IITs are under the state’s control. This has resulted in an overly rules-based and often corruptadministration that stifles academic freedom to pursue research or design new courses.
The worst aspects of the IIT-system are, first, the absence of a second-tier of quality below the IITs. There are the IITs,then about a dozen other state-owned institutions of repute and then a vacuum. 4 The mass of the state-run and privateinstitutions are third-tier. A shortage of funds is the main reason for the quality vacuum. Second, the current dynamics ofthe higher education system threaten the quality of the IITs. The staff at the IITs and other state institutions are beingcannibalized by private institutions due to salary caps (see Box 2), the IITs research output is meager to non-existent(matched by a minimal output of graduate students) due to a lack of academic freedom and incentives, and collaborationswith industry for training students are minimal.
The IITs offer important lessons on how a country can provide a high standard of education for a small cohort chosen onmerit. First, it can be done quickly. The IITs were begun in the 1950s and achieved excellence within a decade. Thiswas partly due to overseas collaborations in the initial years for the purposes of curriculum and faculty development. Thecountry’s best faculty and student applicants turned to the IITs simply because it offered the best students, teachers andinfrastructure. Over time, the four strategies noted above emerged.
One lesson from the IITs’ success is that while a rules-based process of admissions might not be optimal in a more matureenvironment, it might make sense in a less mature environment. It protects the institution from misuse that might arise ifmore discretion is given to the institution. Of course, it raises the question of how an institution is to transition to a lessrules-based system that might be desirable as the environment matures.
Another lesson is that so long as the state does not interfere in faculty selection, or in curriculum development, andfinances equitable access and infrastructure, its other dimensions of control will not, at least for a time, be a fatal deterrentto the provision of a good undergraduate education.
1Source: http://www.hindu.com/2007/04/09/stories/2007040901761300.htm June 11, 20072Source: http://www.iitm.ac.in/academics/Academic%20Calendar.html June 11, 20073 The general quality of infrastructure, research and university-industry linkages are particularly difficult problems.According to a government report, “obsolescence of facilities and infrastructure are experienced in many institutions …the IT infrastructure and the use of IT in technical institutions is woefully inadequate … the barest minimum laboratoryfacilities are available in many of the institutions and very little research activity is undertaken … engineering instituteshave not succeeded in developing strong linkages with industry … the curriculum offered is outdated and does not meetthe needs of the labor market” (Indian Ministry of HRD, 2001, Sections 2.1.2-2.1.6).4http://www.dqindia.com/content/top_stories/2006/106062703.asp June 11, 2007
15
Degrees
The primary higher education degree is the bachelor’s/undergraduate degree.3 For
professional fields, including engineering, this requires four years of study after
completing twelve years of primary and secondary school. Some professional fields,
such as medicine and architecture, require five years. For other fields, such as arts,
commerce and physical and social sciences, the bachelor’s degree requires three years of
study.
The next higher level is the master’s/graduate degree, which requires two years of study
beyond the bachelor’s degree. In engineering, admission to graduate programs requires
taking a standardized aptitude test, the Graduate Aptitude Test in Engineering. Due to
the recent high demand for software engineers, the UGC approved an unusual degree
course a few years ago, the Master of Computer Applications (MCA). The MCA is a
three year graduate program, typically taken by those with non-technical undergraduate
degrees. Most upper-tier recruiters such as Google will typically not recruit a student
with an MCA because such a student will not have done the fourth year design projects.
The highest level is the doctoral degree which typically requires at least three years of
study after the Master’s degree and a thesis based on original research.
3 We shall use American terminology in this paper. A bachelor’s education in both India and the US is referred to as anundergraduate education. A bachelor’s degree is referred to in the US as an undergraduate degree, in India as agraduate degree. A master’s education and degree is referred to as a postgraduate education and degree in India and agraduate education and degree in the US.
16
Non-degree courses include vocational courses leading up to a diploma. These are
typically one to two year courses.
Only a university recognized by one of the central government councils may award a
degree. Almost all the country’s universities are publicly owned. As noted above, most
universities are largely ‘affiliating’ universities at the undergraduate level. They do not
offer their own courses but prescribe to the affiliated colleges the course of study, hold
examinations and award degrees. The colleges within a university may be privately or
publicly owned. Recently, some colleges that are of high quality have been declared
‘autonomous colleges’. In these, the responsibility for proposing and developing courses
of study lies with the college, while the university must approve the courses as eligible
for degree-level instruction. The degree awarded in such cases is still by the university,
although it also bears the name of the autonomous college.
Although private higher education has been a feature of the system from the beginning, it
has become important only over the past decade. The change has been policy-driven.
Prior to 1991, the state took the view that higher education should only be provided by
the state. However, the country has seen low rates of enrollment that have increasingly
been attributed to exclusive state provision. India’s gross enrolment ratio, i.e., the
number of age-unadjusted enrollees as a share of the eligible population that goes to
university is, as of 2006, only 9% compared with 35% who complete secondary school.
While the absence of private provision has not always led to rises in enrollment in other
countries (see Appendix 1) – for instance, the state might reduce its commitment to
17
higher education as a result, in India, it has prompted a policy initiative since 1991 to
increase the share of private provision. The other driver of private participation has been
the policy decision to reverse the historical bias of the state’s education spending in favor
of tertiary education. Historically, the government has spent about 3-4% of GDP on
education and this accounts for 13% of public spending (Hiromi, p.8). These numbers
are comparable to many other developing countries such as China. About 15% of the
total budget (equal to Rs.120 bn or $3 bn in 2004) is spent on higher education (Nuepa,
p.23). Of this, about a fourth is spent on technical education. (Nuepa, p.5) On a per
capita enrolment basis, however, the amount spent on tertiary education is three times
that spent on primary and secondary education combined. By contrast, in China, about
two-thirds, on a per capita enrolment basis, is spent on primary and secondary education.
About 700,000 students were enrolled in undergraduate degree courses in engineering (all
fields) in 2003. This has risen rapidly in recent years. According to Nasscom (2007,
p.92), the number of new undergraduates in engineering was expected to be 264,000 in
2006. The IT workforce was further bolstered by those with engineering diplomas
(usually a two year course, as noted above) (196,000 new diploma holders in 2006) and
those with a Master’s degree in Computer Applications (MCA). (35,000 new awardees in
2006).
18
Box 2
English in India
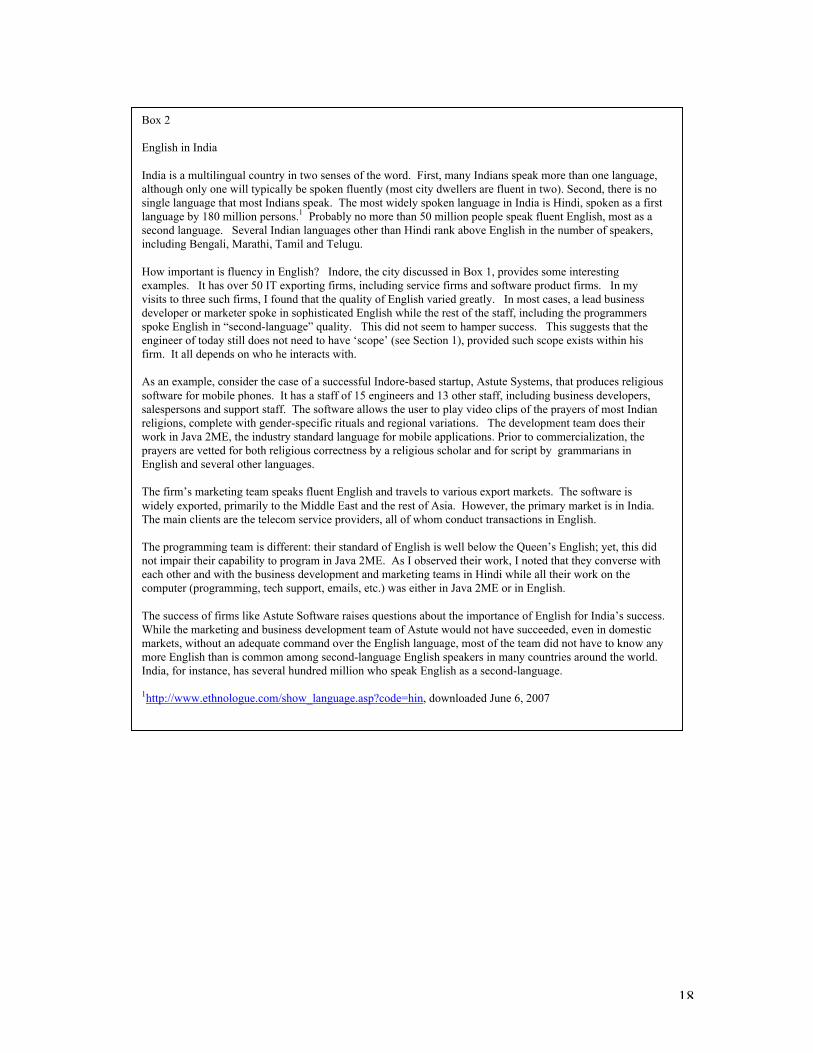
India is a multilingual country in two senses of the word. First, many Indians speak more than one language,although only one will typically be spoken fluently (most city dwellers are fluent in two). Second, there is nosingle language that most Indians speak. The most widely spoken language in India is Hindi, spoken as a firstlanguage by 180 million persons.1 Probably no more than 50 million people speak fluent English, most as asecond language. Several Indian languages other than Hindi rank above English in the number of speakers,including Bengali, Marathi, Tamil and Telugu.
How important is fluency in English? Indore, the city discussed in Box 1, provides some interestingexamples. It has over 50 IT exporting firms, including service firms and software product firms. In myvisits to three such firms, I found that the quality of English varied greatly. In most cases, a lead businessdeveloper or marketer spoke in sophisticated English while the rest of the staff, including the programmersspoke English in “second-language” quality. This did not seem to hamper success. This suggests that theengineer of today still does not need to have ‘scope’ (see Section 1), provided such scope exists within hisfirm. It all depends on who he interacts with.
As an example, consider the case of a successful Indore-based startup, Astute Systems, that produces religioussoftware for mobile phones. It has a staff of 15 engineers and 13 other staff, including business developers,salespersons and support staff. The software allows the user to play video clips of the prayers of most Indianreligions, complete with gender-specific rituals and regional variations. The development team does theirwork in Java 2ME, the industry standard language for mobile applications. Prior to commercialization, theprayers are vetted for both religious correctness by a religious scholar and for script by grammarians inEnglish and several other languages.
The firm’s marketing team speaks fluent English and travels to various export markets. The software iswidely exported, primarily to the Middle East and the rest of Asia. However, the primary market is in India.The main clients are the telecom service providers, all of whom conduct transactions in English.
The programming team is different: their standard of English is well below the Queen’s English; yet, this didnot impair their capability to program in Java 2ME. As I observed their work, I noted that they converse witheach other and with the business development and marketing teams in Hindi while all their work on thecomputer (programming, tech support, emails, etc.) was either in Java 2ME or in English.
The success of firms like Astute Software raises questions about the importance of English for India’s success.While the marketing and business development team of Astute would not have succeeded, even in domesticmarkets, without an adequate command over the English language, most of the team did not have to know anymore English than is common among second-language English speakers in many countries around the world.India, for instance, has several hundred million who speak English as a second-language.
1http://www.ethnologue.com/show_language.asp?code=hin, downloaded June 6, 2007
19
Private providers
The impact of private provision can be seen in the following data: from a negligible
presence upto 1990, as of 2005, they accounted for half of total undergraduate enrolment
of about 10 million students and over 60% of the number of degree-awarding institutions
(see Appendix 1). In more commercially lucrative fields such as engineering, they
accounted for over three fourths of the number of institutions.
Accredited private providers must, by Indian law, be organized as non-profit institutions.
They can be of two kinds: self-funded or government-aided. The latter forces them to
offer government pay scales to teachers and charge government tuition rates for
admission.4
The legal requirement of non-profit status for private institutions means that they are
invariably established as trusts. This allows them to make profits provided these are
ploughed back into the institution. Of course, in practice, given India’s murky record with
tracking and disciplining malpractice, many, probably the vast majority (Nuepa, 2006,
p.43), suck large sums away through devices such as charging upfront ‘capitation’ fees
that are not tracked, employing family members of the trust’s founders at enormous
salaries and so on.
4 A recent trend is the private provision of foreign degrees in India by foreign universities operating in India. This,being outside the Indian education system, is little documented although its impact is believed to be small. It consistslargely of little-known institutions in the western world charging high fees for degrees awarded by the foreignuniversities. By many accounts, most of these are ‘fly-by-night’ operations.
20
The private providers have focused on the more lucrative fields such as engineering and
management education, as noted above. As a result of their presence, the Indian higher
education system has become increasingly differentiated. The private providers tend to
specialize in only a few fields for which demand is high. By contrast, the state providers
offer a wider range of studies.
21
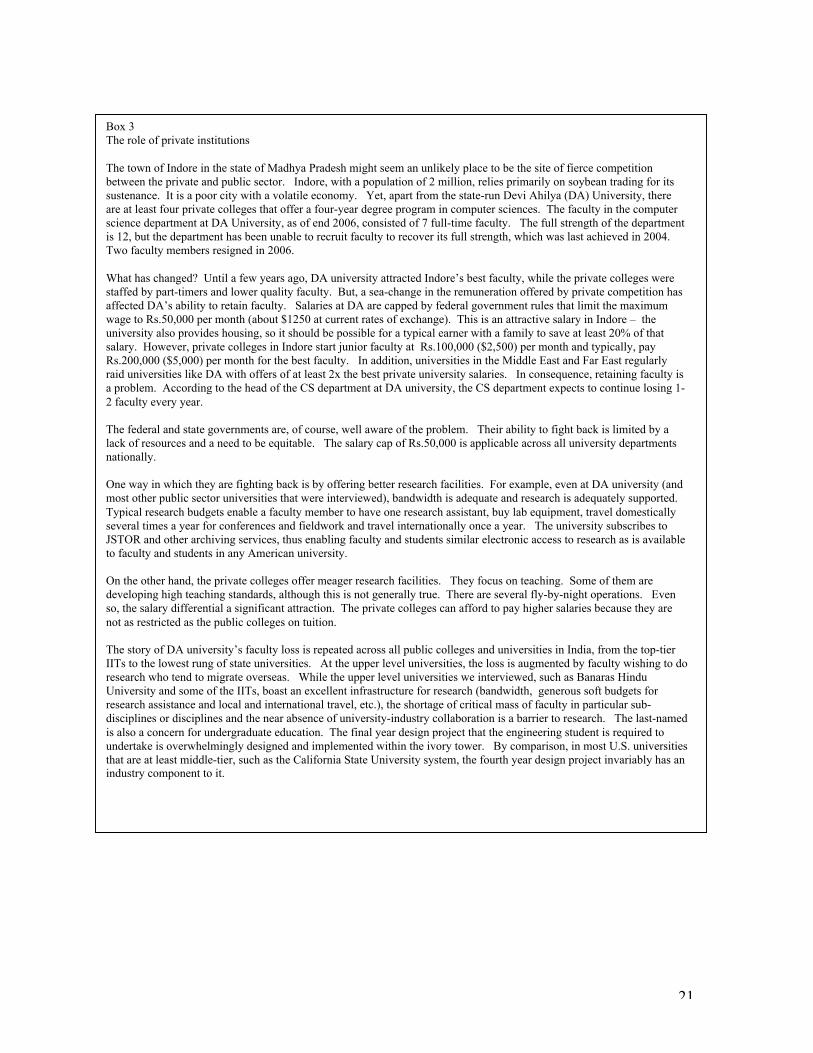
Box 3The role of private institutions
The town of Indore in the state of Madhya Pradesh might seem an unlikely place to be the site of fierce competitionbetween the private and public sector. Indore, with a population of 2 million, relies primarily on soybean trading for itssustenance. It is a poor city with a volatile economy. Yet, apart from the state-run Devi Ahilya (DA) University, thereare at least four private colleges that offer a four-year degree program in computer sciences. The faculty in the computerscience department at DA University, as of end 2006, consisted of 7 full-time faculty. The full strength of the departmentis 12, but the department has been unable to recruit faculty to recover its full strength, which was last achieved in 2004.Two faculty members resigned in 2006.
What has changed? Until a few years ago, DA university attracted Indore’s best faculty, while the private colleges werestaffed by part-timers and lower quality faculty. But, a sea-change in the remuneration offered by private competition hasaffected DA’s ability to retain faculty. Salaries at DA are capped by federal government rules that limit the maximumwage to Rs.50,000 per month (about $1250 at current rates of exchange). This is an attractive salary in Indore – theuniversity also provides housing, so it should be possible for a typical earner with a family to save at least 20% of thatsalary. However, private colleges in Indore start junior faculty at Rs.100,000 ($2,500) per month and typically, payRs.200,000 ($5,000) per month for the best faculty. In addition, universities in the Middle East and Far East regularlyraid universities like DA with offers of at least 2x the best private university salaries. In consequence, retaining faculty isa problem. According to the head of the CS department at DA university, the CS department expects to continue losing 1-2 faculty every year.
The federal and state governments are, of course, well aware of the problem. Their ability to fight back is limited by alack of resources and a need to be equitable. The salary cap of Rs.50,000 is applicable across all university departmentsnationally.
One way in which they are fighting back is by offering better research facilities. For example, even at DA university (andmost other public sector universities that were interviewed), bandwidth is adequate and research is adequately supported.Typical research budgets enable a faculty member to have one research assistant, buy lab equipment, travel domesticallyseveral times a year for conferences and fieldwork and travel internationally once a year. The university subscribes toJSTOR and other archiving services, thus enabling faculty and students similar electronic access to research as is availableto faculty and students in any American university.
On the other hand, the private colleges offer meager research facilities. They focus on teaching. Some of them aredeveloping high teaching standards, although this is not generally true. There are several fly-by-night operations. Evenso, the salary differential a significant attraction. The private colleges can afford to pay higher salaries because they arenot as restricted as the public colleges on tuition.
The story of DA university’s faculty loss is repeated across all public colleges and universities in India, from the top-tierIITs to the lowest rung of state universities. At the upper level universities, the loss is augmented by faculty wishing to doresearch who tend to migrate overseas. While the upper level universities we interviewed, such as Banaras HinduUniversity and some of the IITs, boast an excellent infrastructure for research (bandwidth, generous soft budgets forresearch assistance and local and international travel, etc.), the shortage of critical mass of faculty in particular sub-disciplines or disciplines and the near absence of university-industry collaboration is a barrier to research. The last-namedis also a concern for undergraduate education. The final year design project that the engineering student is required toundertake is overwhelmingly designed and implemented within the ivory tower. By comparison, in most U.S. universitiesthat are at least middle-tier, such as the California State University system, the fourth year design project invariably has anindustry component to it.
22
Section 3
The quality of education: a theoretical framework.
The role of the state
The quality of a nation’s higher educational system reflects a complex partnership
between the nation’s state and its citizens. For instance, we have earlier discussed
examples where the corporate sector takes on roles that the state is either unwilling or
incapable of doing, or needs partners. In some cases, the state takes a leading role, such
as in determining budgets for higher education and allocating responsibilities between the
federal and state governments; in other cases, such as determining research goals, both
the state and non-state sectors may help to determine outcomes.
Even in an environment in which private provision thrives, as in the U.S., the state’s role
is critical. The ways that the state plays a critical role include the financing of education
for efficiency and equity, directing science and engineering courses towards problem
solving and creative thinking, and organizing the policy environment, governance
structures and institutional administration to produce higher quality training (Martinez,
2002).
The policy decisions primarily concern the mix of teaching and research and the focus on
accessibility by targeted student populations. Depending on the charter of the institution
and the environment (including competition), the role of the state in determining policy
can vary.
23
The governance structures indicate the formal and informal arrangements allowing higher
education institutions to make decisions and take action on strategic variables that
influence the outcomes of these policies, such as setting fees and managing costs (World
Bank, 2000, p.83). The state, in many cases, not only determines policy priorities but
may tightly govern the institution as well. For example, it may limit the freedom to
pursue research, or regulate fees and costs. We term such a state role as ‘regulatory’. In
other cases, the state does not take an active role in defining policy, controlling the
strategic variables or ensuring that these are met. However, it may still finance deficits.
We term such a state role as ‘advocatory’. In between the advocatory and regulatory
states, the ‘steering state’ helps to set policy priorities but leaves it to the institution to
establish and manage the governance structures that will help to realize those priorities.
This may happen even while the state finances deficits.
The administrative structures refer to rules and regulations that create the incentives for
meeting the strategic choices. Examples are the rules for resource mobilization or terms
of tenure. These may be bureaucratic, i.e., rules-based, or, if not, subject to faculty
influence or other influences such as donors and trustees. The state’s role, if present, is
usually higher when the administrative structures are bureaucratic and lower otherwise.
Obviously, the role of the state in a particular institution is constrained by the dependence
of that educational institution on the state for resources and on the charter of the
institution. In general, private institutions will be different from state institutions.
24
Within state institutions, the role of the state tends to focus more on advocacy for upper-
tier institutions, whereas lower-tier institutions are usually more tightly regulated in order
to improve access to less-privileged populations.
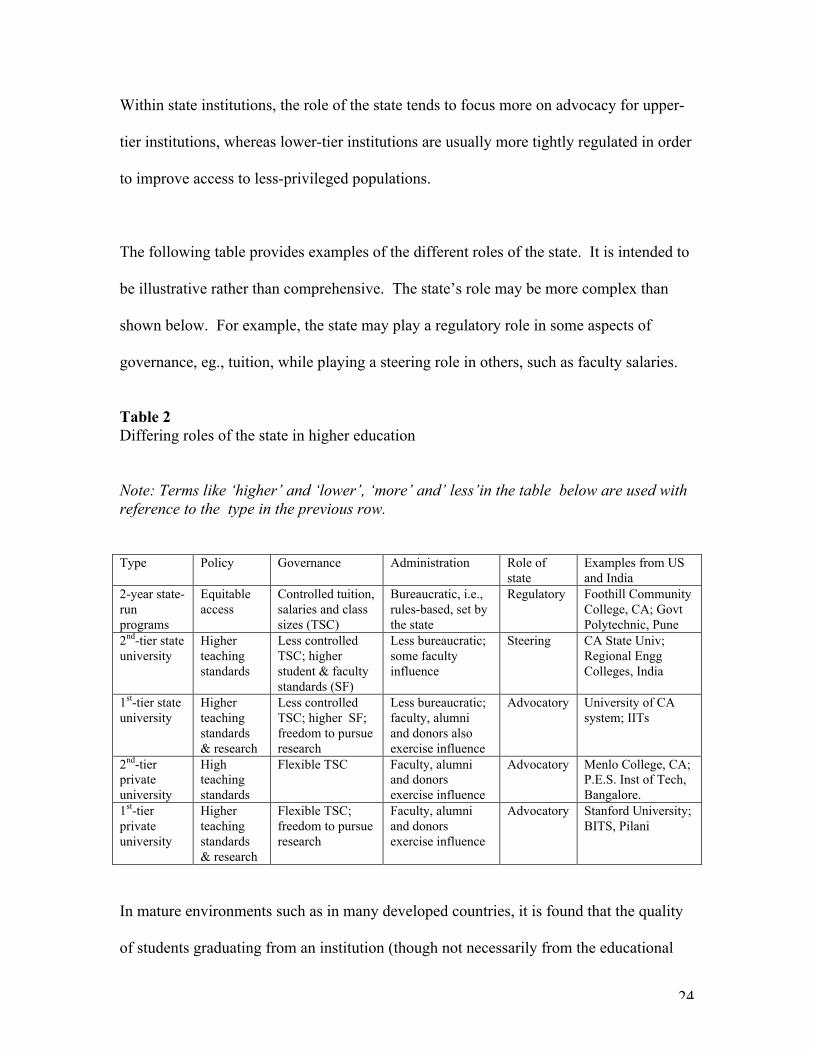
The following table provides examples of the different roles of the state. It is intended to
be illustrative rather than comprehensive. The state’s role may be more complex than
shown below. For example, the state may play a regulatory role in some aspects of
governance, eg., tuition, while playing a steering role in others, such as faculty salaries.
Table 2Differing roles of the state in higher education
Note: Terms like ‘higher’ and ‘lower’, ‘more’ and’ less’in the table below are used withreference to the type in the previous row.
Type Policy Governance Administration Role ofstate
Examples from USand India
2-year state-runprograms
Equitableaccess
Controlled tuition,salaries and classsizes (TSC)
Bureaucratic, i.e.,rules-based, set bythe state
Regulatory Foothill CommunityCollege, CA; GovtPolytechnic, Pune
2nd-tier stateuniversity
Higherteachingstandards
Less controlledTSC; higherstudent & facultystandards (SF)
Less bureaucratic;some facultyinfluence
Steering CA State Univ;Regional EnggColleges, India
1st-tier stateuniversity
Higherteachingstandards& research
Less controlledTSC; higher SF;freedom to pursueresearch
Less bureaucratic;faculty, alumniand donors alsoexercise influence
Advocatory University of CAsystem; IITs
2nd-tierprivateuniversity
Highteachingstandards
Flexible TSC Faculty, alumniand donorsexercise influence
Advocatory Menlo College, CA;P.E.S. Inst of Tech,Bangalore.
1st-tierprivateuniversity
Higherteachingstandards& research
Flexible TSC;freedom to pursueresearch
Faculty, alumniand donorsexercise influence
Advocatory Stanford University;BITS, Pilani
In mature environments such as in many developed countries, it is found that the quality
of students graduating from an institution (though not necessarily from the educational
25
system as a whole) will be lower if: (1) state policy favors student accessibility (equity)
over merit, (2) state policy favors teaching over research. (3) governance structures focus
more on managing tuition costs than admission standards. (4) governance structures
focus more on managing salaries than faculty selection criteria, (5) administrative
structures are more bureaucratic. (6) administrative structures exclude non-state
stakeholders such as faculty and alumni (McDaniel, 1996, World Bank, 2000).
We hypothesize that the impact of a higher role of the state might be different in some
respects in India. This is because the system has dramatically changed in respect of the
share of private provision, as noted above. Most of the new providers are new and in the
private sector. In some other respects, the role of the state should be similar to more
mature environments.
One area of difference could be in the state’s role in faculty selection. A common
criticism of the newer private institutions in India is that they employ faculty of poor
quality. For example, M. Anandakrishnan, Chair of the state-owned Madras Institute of
Development Studies, a division of the National Institute of Social Science Research, has
argued that the quality of faculty in private institutions is below that of public institutions.
He argues that this is because “They (the self-financing private institutions) generally
treat the faculty somewhat like bonded labor in matters of salary and service conditions
(Nuepa, p.43).”
26
Similarly, the private institutions often waive their admission norms in favor of those
willing to pay more.
The private institutions get away with such behavior because of poor regulation and the
newness of private provision. As a result, it is argued, students cannot easily distinguish
good from bad private institutions (World Bank, 2000). On the other hand, the state-
owned institutions, which are more rules-based, ensure that faculty selection and salaries,
and admission criteria meet minimum standards, even if suboptimal (see also Box 1 for a
discussion of this with regard to the IITs).
Hence, in an immature environment like India, we would expect that a responsible state
will play a role that is more intrusive than in a more mature environment. For instance, if
there is an excess demand for software engineering courses and if students are unable to
distinguish good from bad institutions, the state may lay down minimum standards for
faculty selection in new institutions (both private and public), such as possession of a
graduate degree in engineering.
By contrast, there would be other respects in which the newness or immaturity of the
system would not lead to differences between India and more mature environments. For
instance, we would expect that high state involvement in determining which research
projects to undertake would reduce quality even in a new institution. Shared governance
between the state and other stakeholders such as faculty should also always be a positive
contributor to quality.
27
Note that, sometimes, an immature state might be an obstacle to institutional maturation.
Although the overall environment for software engineering education is immature, there
are several mature institutions. For the latter, the state ought to have different standards.
In practice, a common complaint of the Indian higher educational system is that the state
is intrusive even when it is not needed. One of the goals of this paper is to identify areas
where the state has not been responsive to the evolving institutional environment.
We now turn to our detailed hypotheses, methodology and data.
Section 4
Methodology and Data
Methodology
The variables that are most reliably observed are administrative variables, such as the
rules for setting tuition or eligibility requirements. Governance structures and the
underlying policies can be inferred from these, although we also use qualitative
questions, eg., asking whether the institution focuses on cost management rather than
faculty quality, in order to make more direct, if less reliable, assessments on governance
structures and policy.
28
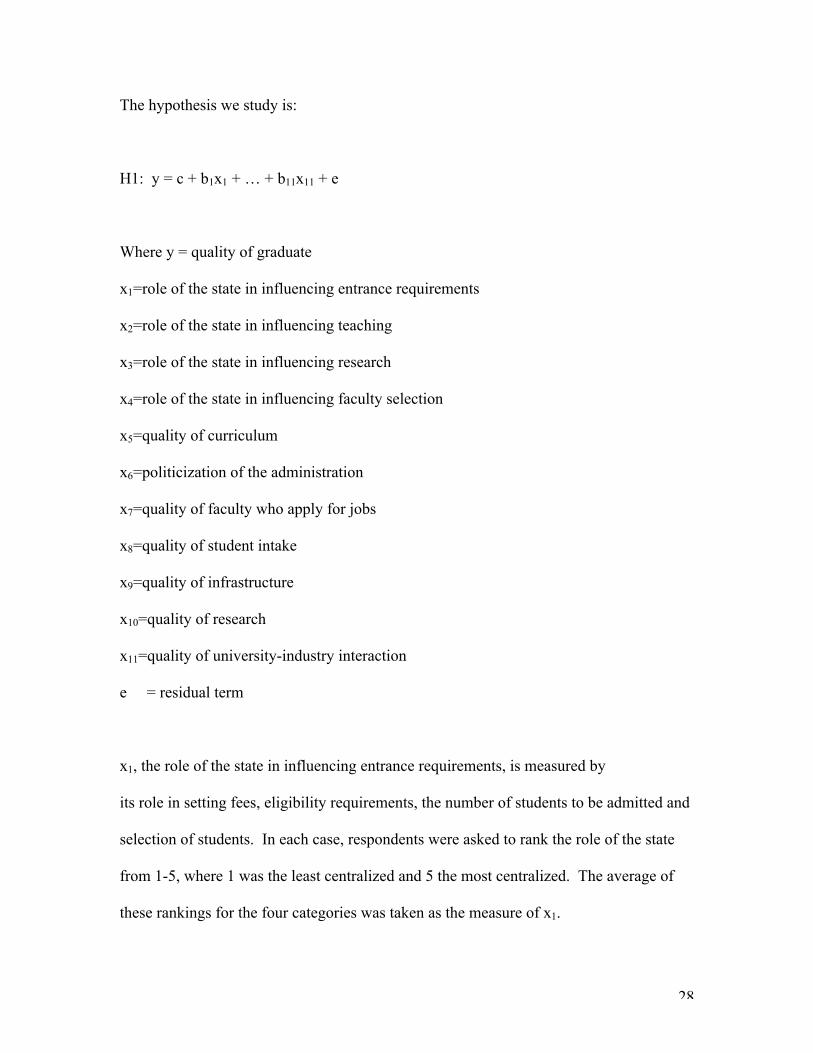
The hypothesis we study is:
H1: y = c + b1x1 + … + b11x11 + e
Where y = quality of graduate
x1=role of the state in influencing entrance requirements
x2=role of the state in influencing teaching
x3=role of the state in influencing research
x4=role of the state in influencing faculty selection
x5=quality of curriculum
x6=politicization of the administration
x7=quality of faculty who apply for jobs
x8=quality of student intake
x9=quality of infrastructure
x10=quality of research
x11=quality of university-industry interaction
e = residual term
x1, the role of the state in influencing entrance requirements, is measured by
its role in setting fees, eligibility requirements, the number of students to be admitted and
selection of students. In each case, respondents were asked to rank the role of the state
from 1-5, where 1 was the least centralized and 5 the most centralized. The average of
these rankings for the four categories was taken as the measure of x1.
29
Given India’s institutional immaturity, we expect that the state will play an important role
in influencing entrance requirements in most institutions. Within the immature
environment, we expect that the mature state will offer greater freedom to more mature,
higher quality institutions. Hence, we expect that the mean value for x1 will exceed three,
while the sign of the regression coefficient will be positive. The predicted regression
coefficients for this and subsequent variables are shown in Table 3 below.
x2, the role of the state in influencing teaching, is measured by its role in starting a new
discipline, starting a new disciplinary specialization, determining the course syllabus,
selecting textbooks, and assessing the quality of teaching. Respondents were asked to
rank the role of the state from 1-5, where 1 is very low and 5 is very high. The average of
these rankings for the five categories was taken as the measure of x2. The expected
value and sign are similar to x1.
x3, the role of the state in influencing research, is measured by its role in determining
research projects, on university-industry interaction and revenue-sharing between faculty
and department for outside work, such as consultancy projects. Respondents were asked
to rank the role of the state from 1-5, where 1 is very low and 5 is very high. The average
of these rankings for the three categories was taken as the measure of x3. As discussed
above, the state should play a hands-off role in research regardless of the maturity of the
system. Hence, we expect that the mean value will be less than 3 and that the role of the
state will not vary with institutional rank, i.e., the predicted sign of the coefficient is zero.
30
x4, the role of the state in selecting faculty, is measured by its role in determing the
categories of faculty, the required qualifications of faculty and faculty salaries.
Respondents were asked to rank the role of the state from 1-5, where 1 is very low and 5
is very high. The average of these rankings for the three categories was taken as the
measure of x4. The expected value and sign are similar to x1.
A set of independent variables was used as control variables. These were the quality of
the curriculum, the quality of student intake, the quality of faculty, the quality of
physical infrastructure (libraries, electronic media, bandwidth, etc.), the quality of
research, interaction between academia and industry, and the politicization of the
administration. Of these seven variables, the first six were ranked from from 1-5, where
1 measured the best quality and 5 the lowest quality. In all six cases, we expect that
higher ranked institutions will have higher quality, i.e., the coefficient sign should be
positive.
The mean values are likely to be less uniform. Curricula are likely to be less demanding
in a weaker institution; given the newness of most providers, we expect that the mean
value will be greater than 3. A similar argument applies to the quality of faculty, quality
of physical infrastructur, quality of research and the quality of university-industry
interaction. However, the quality of students depends on many other factors, including
the options available in other fields and the quality of the secondary and primary
education system.
31
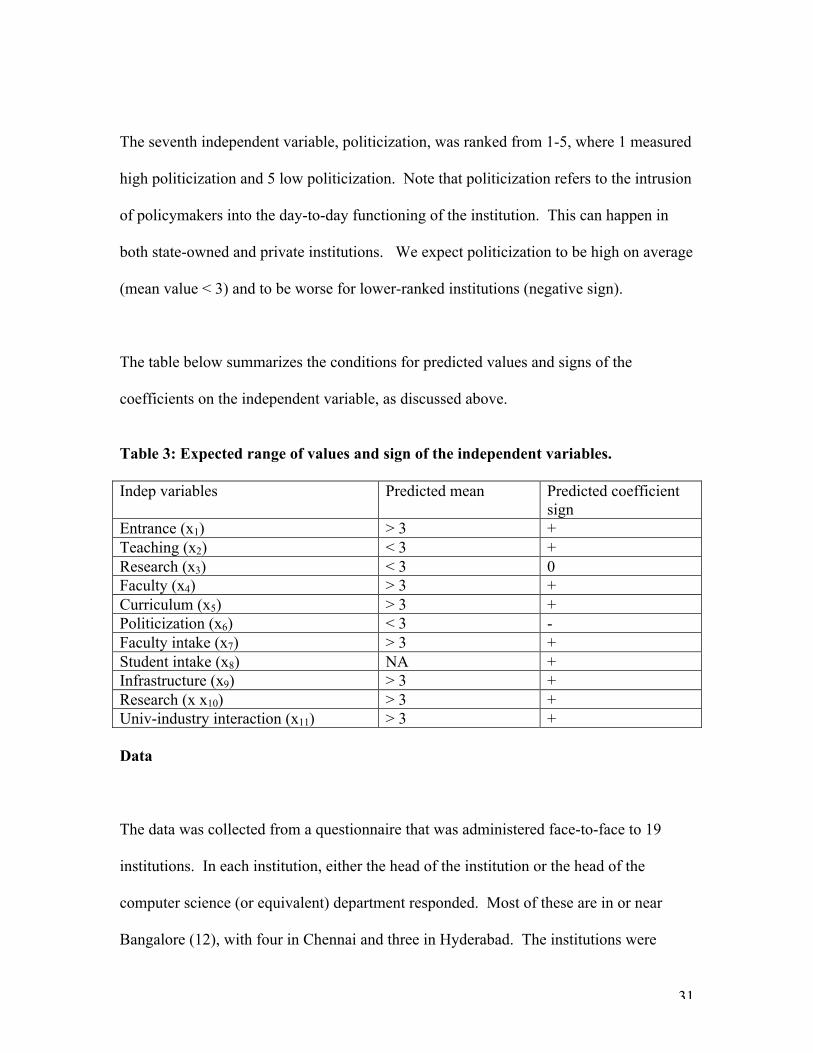
The seventh independent variable, politicization, was ranked from 1-5, where 1 measured
high politicization and 5 low politicization. Note that politicization refers to the intrusion
of policymakers into the day-to-day functioning of the institution. This can happen in
both state-owned and private institutions. We expect politicization to be high on average
(mean value < 3) and to be worse for lower-ranked institutions (negative sign).
The table below summarizes the conditions for predicted values and signs of the
coefficients on the independent variable, as discussed above.
Table 3: Expected range of values and sign of the independent variables.
Indep variables Predicted mean Predicted coefficientsign
Entrance (x1) > 3 +Teaching (x2) < 3 +Research (x3) < 3 0Faculty (x4) > 3 +Curriculum (x5) > 3 +Politicization (x6) < 3 -Faculty intake (x7) > 3 +Student intake (x8) NA +Infrastructure (x9) > 3 +Research (x x10) > 3 +Univ-industry interaction (x11) > 3 +
Data
The data was collected from a questionnaire that was administered face-to-face to 19
institutions. In each institution, either the head of the institution or the head of the
computer science (or equivalent) department responded. Most of these are in or near
Bangalore (12), with four in Chennai and three in Hyderabad. The institutions were
32
chosen randomly after stratifying the population into private colleges, state-run colleges
and centrally-run colleges.
Three institutions that recruit software engineers, the Indian Institute of Management,
Bangalore (for graduate management studies), Wipro and Google were asked for to rank
the 19 institutions relative to best global standards. The institutions were ranked from 1-
5, where 1 is the highest rank, 3 the middle rank and 5 is the lowest rank. These ranks
were averaged to obtain the dependent variable.
Other data was collected by administering the same questionnaire nationally to a number
of institutions. We also interviewed three American institutions using the same
questionnaire and also to assess the quality of Indian undergraduates who apply to
graduate programs in the United States. However, this data was used to corroborate the
findings of the Bangalore survey and is not part of the sample regression analysis below.
The full list of institutions is provided in Appendix 2.
Section 5
Findings
The average rank of the institutions sampled is provided in the table below.
The table below provides information on the average ranks of each tier.
33
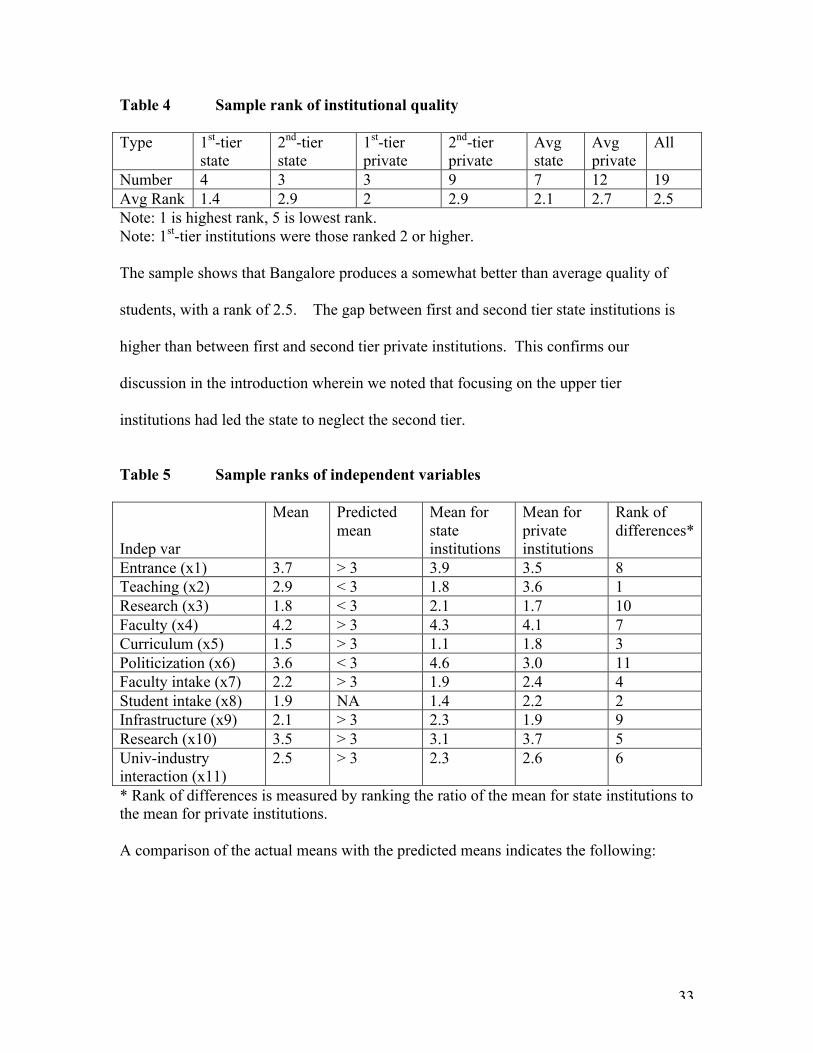
Table 4 Sample rank of institutional quality
Type 1st-tierstate
2nd-tierstate
1st-tierprivate
2nd-tierprivate
Avgstate
Avgprivate
All
Number 4 3 3 9 7 12 19Avg Rank 1.4 2.9 2 2.9 2.1 2.7 2.5Note: 1 is highest rank, 5 is lowest rank.Note: 1st-tier institutions were those ranked 2 or higher.
The sample shows that Bangalore produces a somewhat better than average quality of
students, with a rank of 2.5. The gap between first and second tier state institutions is
higher than between first and second tier private institutions. This confirms our
discussion in the introduction wherein we noted that focusing on the upper tier
institutions had led the state to neglect the second tier.
Table 5 Sample ranks of independent variables
Indep var
Mean Predictedmean
Mean forstateinstitutions
Mean forprivateinstitutions
Rank ofdifferences*
Entrance (x1) 3.7 > 3 3.9 3.5 8Teaching (x2) 2.9 < 3 1.8 3.6 1Research (x3) 1.8 < 3 2.1 1.7 10Faculty (x4) 4.2 > 3 4.3 4.1 7Curriculum (x5) 1.5 > 3 1.1 1.8 3Politicization (x6) 3.6 < 3 4.6 3.0 11Faculty intake (x7) 2.2 > 3 1.9 2.4 4Student intake (x8) 1.9 NA 1.4 2.2 2Infrastructure (x9) 2.1 > 3 2.3 1.9 9Research (x10) 3.5 > 3 3.1 3.7 5Univ-industryinteraction (x11)
2.5 > 3 2.3 2.6 6
* Rank of differences is measured by ranking the ratio of the mean for state institutions tothe mean for private institutions.
A comparison of the actual means with the predicted means indicates the following:
34
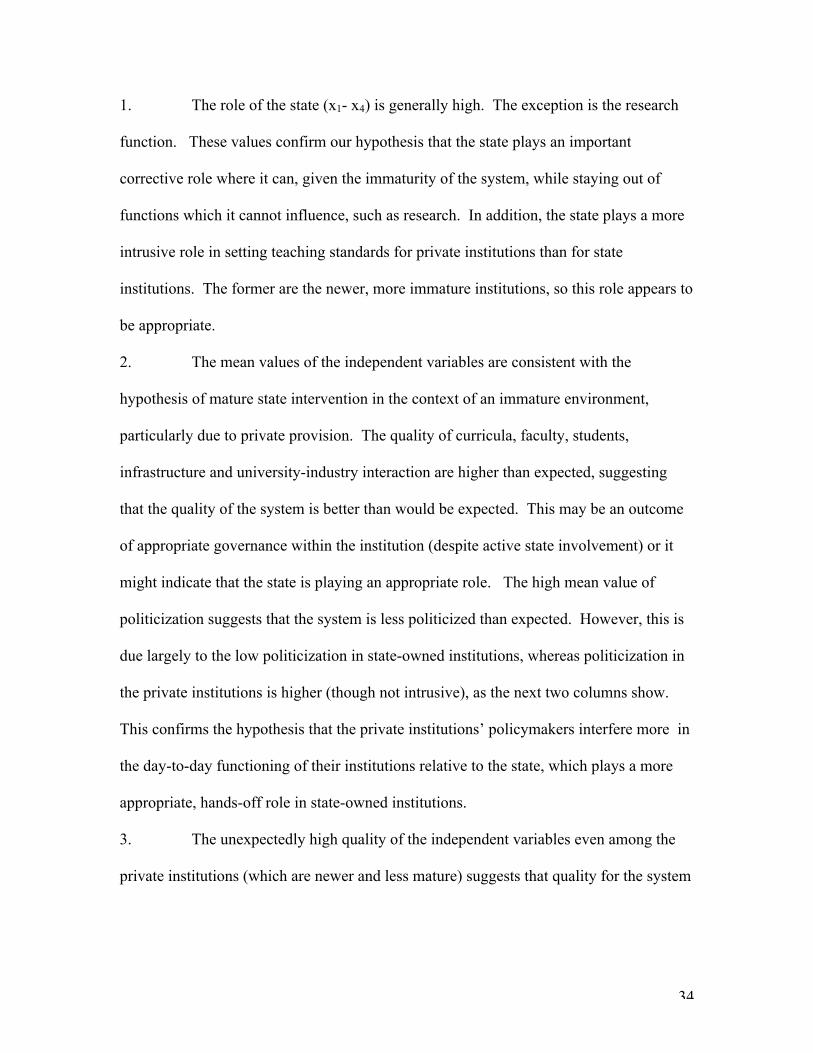
1. The role of the state (x1- x4) is generally high. The exception is the research
function. These values confirm our hypothesis that the state plays an important
corrective role where it can, given the immaturity of the system, while staying out of
functions which it cannot influence, such as research. In addition, the state plays a more
intrusive role in setting teaching standards for private institutions than for state
institutions. The former are the newer, more immature institutions, so this role appears to
be appropriate.
2. The mean values of the independent variables are consistent with the
hypothesis of mature state intervention in the context of an immature environment,
particularly due to private provision. The quality of curricula, faculty, students,
infrastructure and university-industry interaction are higher than expected, suggesting
that the quality of the system is better than would be expected. This may be an outcome
of appropriate governance within the institution (despite active state involvement) or it
might indicate that the state is playing an appropriate role. The high mean value of
politicization suggests that the system is less politicized than expected. However, this is
due largely to the low politicization in state-owned institutions, whereas politicization in
the private institutions is higher (though not intrusive), as the next two columns show.
This confirms the hypothesis that the private institutions’ policymakers interfere more in
the day-to-day functioning of their institutions relative to the state, which plays a more
appropriate, hands-off role in state-owned institutions.
3. The unexpectedly high quality of the independent variables even among the
private institutions (which are newer and less mature) suggests that quality for the system
35
as a whole will improve further as the system matures. Meanwhile, the state-owned
institutions currently offer a higher quality of education.
4. The low quality of research, despite limited state interference, suggests that
other factors might be at work, such as private incentives. In our interviews, we found
that the research function at even the highest ranked institutions is generally neglected.
This is despite relatively generous allowances for research. Even in the smaller state-
run institutions, it was found that faculty can relatively simply obtain funds for domestic
travel, materials and assistance. In some of the larger state schools, even international
travel for conferences is funded. The might improve if the state instituted rules that
required, for instance, that a certain proportion of research funding needs to come from
industry or if rules of tenure included a research evaluation (this factor is mostly missing
even in the highly-ranked institutions). As the table above shows, the private sector ranks
even more poorly than the state institutions on research, as may be expected given our
discussion above.
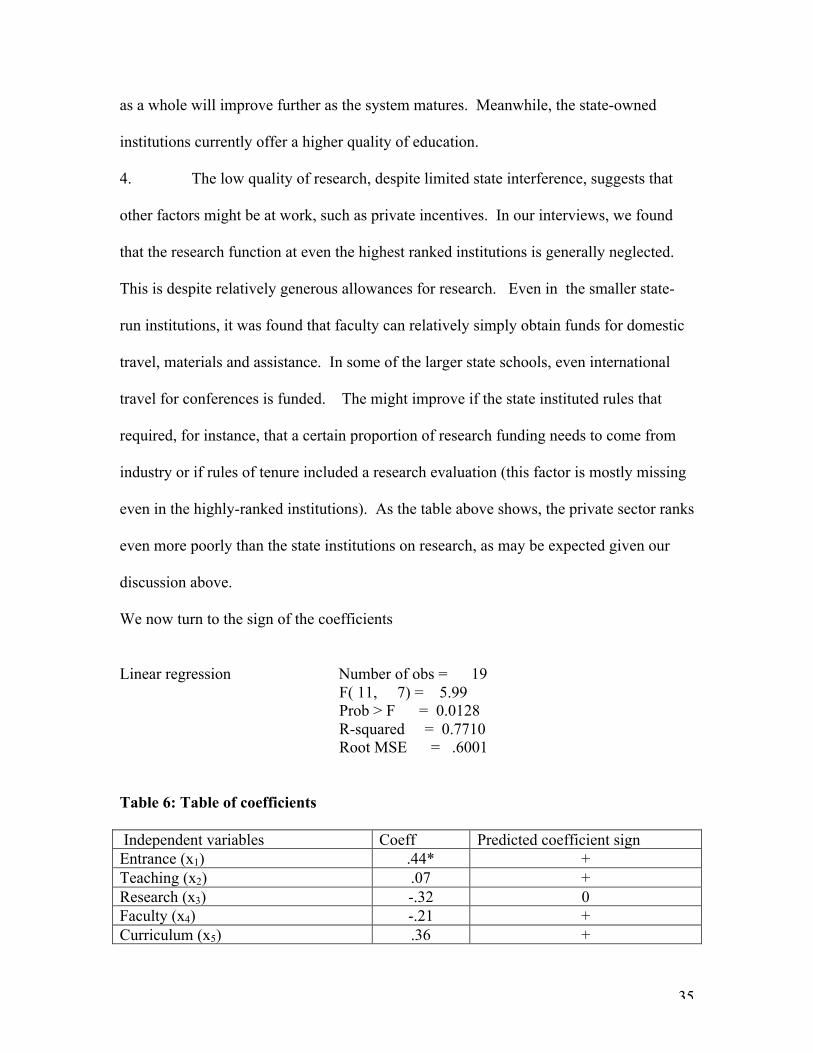
We now turn to the sign of the coefficients
Linear regression Number of obs = 19 F( 11, 7) = 5.99 Prob > F = 0.0128 R-squared = 0.7710 Root MSE = .6001
Table 6: Table of coefficients
Independent variables Coeff Predicted coefficient signEntrance (x1) .44* +Teaching (x2) .07 +Research (x3) -.32 0Faculty (x4) -.21 +Curriculum (x5) .36 +
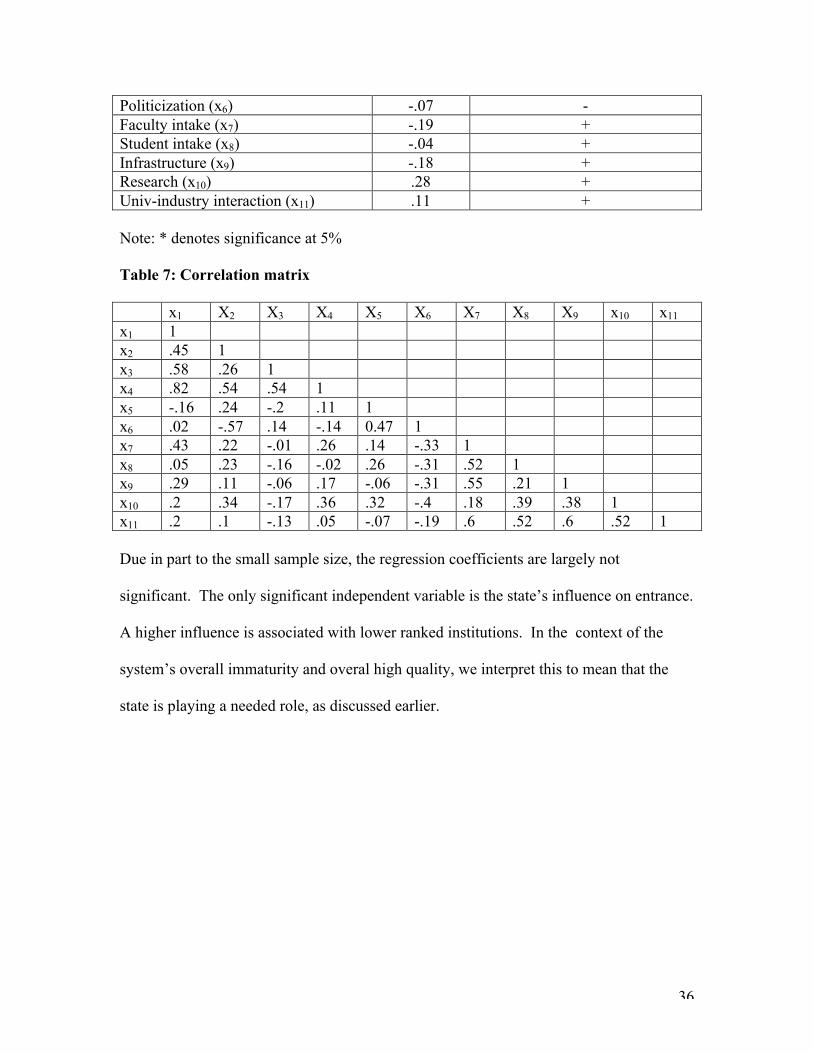
36
Politicization (x6) -.07 -Faculty intake (x7) -.19 +Student intake (x8) -.04 +Infrastructure (x9) -.18 +Research (x10) .28 +Univ-industry interaction (x11) .11 +
Note: * denotes significance at 5%
Table 7: Correlation matrix
x1 X2 X3 X4 X5 X6 X7 X8 X9 x10 x11
x1 1x2 .45 1x3 .58 .26 1x4 .82 .54 .54 1x5 -.16 .24 -.2 .11 1x6 .02 -.57 .14 -.14 0.47 1x7 .43 .22 -.01 .26 .14 -.33 1x8 .05 .23 -.16 -.02 .26 -.31 .52 1x9 .29 .11 -.06 .17 -.06 -.31 .55 .21 1x10 .2 .34 -.17 .36 .32 -.4 .18 .39 .38 1x11 .2 .1 -.13 .05 -.07 -.19 .6 .52 .6 .52 1
Due in part to the small sample size, the regression coefficients are largely not
significant. The only significant independent variable is the state’s influence on entrance.
A higher influence is associated with lower ranked institutions. In the context of the
system’s overall immaturity and overal high quality, we interpret this to mean that the
state is playing a needed role, as discussed earlier.
37
Section 6
Concluding Discussion
As with any system undergoing rapid change, the rate of change makes it hard to rate the
quality of engineering graduates. It is common for software firms in India to express
fears about the quality of manpower relative to costs. This is attributed by them to the
high demand for IT engineers relative to the supply. However, the data show that, at
least for the near term, there is adequate supply. For example, in 2006, the number of
new engineering graduates, MCAs and engineering diploma holders was expected to be
495,000 (Nasscom, 2007, p.92). The growth rate of graduates is about 20 % per annum.
This should have comfortably met the software exporting industry’s need for an
additional 200,000 employees in 2006, a figure that is growing at about 30% per annum.
The difference in growth rates helps to explain why there is a perception of falling quality
of recruit despite a rising average quality of graduate. Even though average quality of
the graduate is rising, the average quality of recruit at the firm level can fall. Whereas in
earlier times, only the best engineers found jobs in the export sector, more recently, even
poorer quality engineers find jobs.
It is important to note that the quality of work done may be higher even if the quality of
the recruit is lower. This is because many of the leading IT firms in India provide their
38
own training to supplement a university education. These include the leading Indian
software service firms. Others work directly with educational institutions, providing
curriculum and teaching kits. For example, Texas Instruments claims to have over 400
such collaborations with institutions in India.
In this report, our intent was to provide the beginnings of a framework for analyzing the
Indian higher education system’s readiness for a services economy. We argued that
several conventional arguments about the advantages of the Indian education system,
such as knowledge of the English language, technical excellence and scale of supply
needed to be reassessed in the light of changes in the type of engineer needed and the
changes within the Indian education system. The former set of changes required a
consideration of the creative and managerial competences of engineers, while the latter
was needed because of the dramatic change in the role of private provision.
For purposes of this introductory analysis, we considered only one discipline, software
engineering, and limited our scope to an assessment of technical education. We first
showed that India’s greatest success was in establishing certain elite institutions, such as
the IITs. The elite institutions like the IITs are managed and funded under a different
organizational model than the overwhelming majority of state-owned institutions. They
are run by the federal government with levels of funding that would be unaffordable were
these to be generally applicable to all state-owned institutions. This means that, under
the present environment, the “IIT-model” is not widely replicable within the country.
39
Nevertheless, elite institutions like the IITs offer some important lessons. The first is
that the policy goal of achieving excellence for a small cohort of students chosen entirely
on a rules-based criterion of merit and funded primarily by the state can achieve the
strategic target of attracting the country’s best students and faculty into a small number of
institutions. This sets the conditions for a rapid establishment of high quality. Certain
minimal other conditions need to be fulfilled, such as a hands-off approach by the state to
the educational core of faculty selection, curriculum development and minimal
infrastructure. But, beyond this, even an intrusive state that otherwise runs a
bureaucratic, even a corrupt administration, can co-exist with a high quality education.
Nevertheless, the elite institutions are under threat. The primary threat is to faculty
retention. The state caps salaries at its institutions (currently to Rs.50,000 per month, or
about $1250), at levels significantly below what private institutions can afford. The
recent proliferation of private provision with higher budgets has allowed them to poach
the best faculty and has already led to considerable erosion in faculty quality across the
board from leading to smaller state-owned institutions countrywide. The state has tried to
be responsive, offering better infrastructure and research budgets, but it remains
insufficient when the private providers can offer salaries that are several times what
faculty in the state-owned institution currently earn.
The overwhelming majority of state-owned provision is by individual states. This is an
outcome of India’s constitution where the central (federal) government assumes
40
responsibility for setting standards while the state governments take responsibility for
funding and provision.
The institutions run by the individual states are generally of significantly lower quality
than federally-run institutions. This is largely an outcome of funding and results in a
serious quality gap. In software engineering, for instance, there are about a dozen
institutions, mostly federally-run, that offer a high (1st-tier) quality education, then a large
gap, followed by lower-tier (3rd-tier) state-run institutions. The absence of a quality
continuum at the second-tier disadvantages students who fail to enter the elite institutions
and must settle for a third-tier institution.
The state began to recognize this problem in the 1990s and responded with encouraging
private provision. The private providers have, in turn, responded energetically. Though
they are required to be legally organized as non-profit trusts, private provision offers
enough opportunities, given the immature environment, for personal gain. In
engineering, over three fourths of the providers are now private, a dramatic turnaround
from a decade ago, when their presence was negligible.
The private providers are key to the system’s future. Although they currently occupy the
lowest tiers of quality, over time, as they mature, they, more than state-owned providers,
are going to provide the scale, depth and scope of the system. There are already signs
that some private providers are maturing into high quality providers.
41
Nevertheless, the state remains a critical player. Its institutions set the current
benchmarks for standards, of course (as well as providing fertile ground for recruiting
faculty!). But its primary influence is through its role as the system’s regulator. The
system allows it to be as intrusive as it wants. This is because the law allows the state to
set institution-specific admissions standards; standards for faculty recruitment; funding
standards for research; and to shut down those institutions that fail to meet these
standards.
Hence, there is now a complex environment that characterizes the higher education
sector. The state as regulator, provider and financier must interact increasingly with the
private sector as provider. What sort of outcomes have resulted? Do they meet the
needs of the nation?
To assess this, we surveyed institutions that are important suppliers of software engineers
to India’s software capital, Bangalore. We considered the role of the state through the
assessment of its influence on fundamental aspects of an institution, such as entrance
requirements, teaching, research and faculty selection. The influence was evaluated
through three layers: influence on institutional policy (such as the focus on teaching
versus research, equity versus merit, etc.), influence on governance structures (such as the
rules for selecting or compensating faculty) and influence on the administrative structures
(how flexible are the rules for admission? Do policymakers influence admissions directly
and waive standards in return for higher fees?). These influences and quality outcomes
42
such as the quality of research and the quality of curriculum were evaluated against the
quality of the institutions as ranked by recruiters, both commercial and academic.
We found that the average quality of the institutions that supply Bangalore with software
graduate is high and that the public sector is of better quality than private institutions.
The state owned institutions are superior in certain key variables: curriculum, students
and faculty. Nevertheless, even the private providers score well in these respects and
score better than the state-owned providers on infrastructure. At the operating level, the
state-owned providers tend to be less influenced by policymakers. By contrast, the
private providers are more politicized. In one key respect, research, the weakness of
quality cuts across all types of institutions.
The unexpectedly high quality of the independent variables even among the private
institutions (which are newer and less mature) suggests that quality for the system as a
whole will improve further as the system matures.
Second, we found that influence of the state is generally high on teaching, entrance and
faculty selection. The exception is the research function, where the state plays a hands-
off role. These findings confirm our hypothesis that the state plays an important
corrective role where it can, given the immaturity of the system, while staying out of
functions which it cannot influence, such as research. In addition, the state plays a more
intrusive role in setting teaching standards for private institutions than for state
43
institutions. The former are the newer, more immature institutions, so this role appears to
be appropriate.
The low quality of research, despite limited state interference, suggests that other factors
might be at work, such as private incentives. In our interviews, we found that the
research function at even the highest ranked institutions is generally neglected. This
seems to reflect poor university-industry linkages for research, even though they appear
to be satisfactory from a recruiter’s viewpoint. Even the final year design project of the
student is typically done within the university rather than at a commercial enterprise.
This weakness in research is despite relatively generous allowances for research. Even
in the smaller state-run institutions, it was found that faculty can relatively simply obtain
funds for domestic travel, materials and assistance. In some of the larger state schools,
even international travel for conferences is funded. The might improve if the state
instituted rules that required, for instance, that a certain proportion of research funding
needs to come from industry or if rules of tenure included a research evaluation (this
factor is mostly missing even in the highly-ranked institutions). The private sector ranks
even more poorly than the state institutions on research.
In summary, the education environment we studied shows that the institutional structure
seems to have the capacity to produce a quality of engineer that is suited for the present
needs of the workplace. Interestingly, all institutions, from the lowest to the highest
44
ranked, seem to aim to produce technically competent engineers rather than a creativity-
driven quality continuum.
As the demands of the marketplace evolve, certain weaknesses, particularly in the
research and project management functions, will need to be addressed. We have argued
that the role of the state will be critical. So far, the state has demonstrated its capability
of being an effective regulator. To address evolving demands, new capabilities will no
doubt be needed by the state. In particular, the state needs to address the issue of the
quality gap at the second-tier and the absence of research capabilities at the first tier. It
also needs to increase autonomy to first-tier institutions, particularly in administrative
structures. Towards private providers, the state currently plays a more intrusive role than
it would in a more mature system. This reflects the immaturity of the private provision
system, as evidenced by politicization and generally lower quality outcomes. The
challenge the state’s role raises is how the state ought to fashion its regulatory role so that
it can transition to a less rules-based system as the environment matures. This is a
transition that it has not achieved even in the best state-owned institutions and remains,
therefore, a challenge.
45
References
1. Arora, A and A Gambardella (eds.). 2005. From Underdogs to Tigers,
Oxford: Oxford University Press, 2005
2. Dossani, R. 2006. ‘Origins of India’s IT industry’, in Rowen, H. (ed.), Making
IT, Stanford University Press: Stanford
3. Dossani, R. and N. Denny. 2007. The Internet’s Role in Offshored Services: A
Case Study of India, ACM TOIT, 7(3), forthcoming
4. Dossani, R. and M. Kenney. 2007. the Next Wave of Globalization:
Relocating Service Provision to India, World Development, 35(5), 772-791
5. Forbes, N. 2003. ‘Higher Education, Scientific Research and Industry:
Reflections on Priorities for India.’ Working Paper, Stanford University.
6. Freeman, C. 1997. ‘The National System of Innovation' in Historical
Perspective' in D. Archibugi and J. Michie (eds) Technology, Globalization
and Economic Performance Cambridge: Cambridge University Press.
7. Freeman, C. 2005. ‘Does Globalization of the Scientific/Engineering
Workforce Threaten US Economic Leadership’, NBER Working Paper 11457.
8. Hiromi, A. 2006. Investing in education in india: inferences from an analysis
of the rates of return to education across indian states. Ph.D. Dissertation,
Stanford University
9. Intarakumnerd, P., Chairatana, P., and Tangchitpiboon, T. 2002. `National
Innovation System in Less Successful Developing Countrie, Research Policy
31, 1445-57.
46
10. Krugman, P. 1994. The Myth of Asia’s Miracle, Foreign Affairs,73(6),
November/December 1994
11. Martinez, M. 2002. ‘Understanding state higher education systems: applying a
new framework.’ Journal of Higher Education. 73(3) 349-75
12. McDaniel, O. 1996.“The Paradigms of of governance in higher education
systems.” Higher Education Policy 9(2) 137-158
13. Ministry of Human Resource Development. 2001. ‘Technical Education
Quality Improvement Project of the Government of India’, Ministry of
HRD:New Delhi
14. Nasscom. 2006, 2007. Strategic Review. New Delhi: Nasscom
15. Nelson, R. 1987. Understanding Technical Progress as a Evolutionary
Process, Amsterdam:Elsevier
16. Nuepa, 2006. Privatization and Commercialization of Higher Education, New
Delhi: National University of Educational Planning and Administration
17. Rosenberg, N. 1972 Technology and American Economic Growth, New York:
Harper and Row
18. Sahay, S, B Nicholson and S Krishna. 2004. Global IT Outsourcing: Software
Development across Borders. Cambridge: Cambridge University Press
19. Wadhwa, V., G. Gereffi, B. Rissing and R. Ong, Where the Engineers Are,
Issues in Science and Technology, Spring 2007
20. World Bank Task Force on Higher Education and Society, “Higher Education
in Developing Countries: Peril and Promise.” (2000) Washington, DC: World
Bank.
47
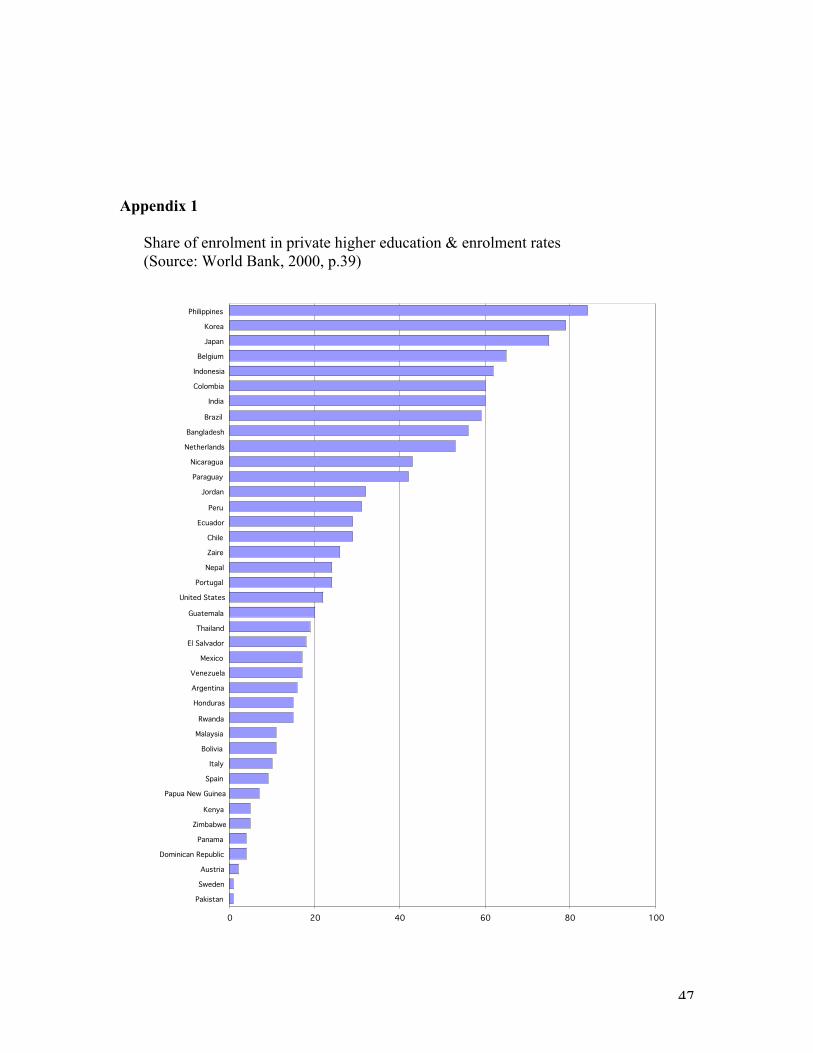
Appendix 1
Share of enrolment in private higher education & enrolment rates(Source: World Bank, 2000, p.39)
0 20 40 60 80 100
Philippines
Korea
Japan
Belgium
Indonesia
Colombia
India
Brazil
Bangladesh
Netherlands
Nicaragua
Paraguay
Jordan
Peru
Ecuador
Chile
Zaire
Nepal
Portugal
United States
Guatemala
Thailand
El Salvador
Mexico
Venezuela
Argentina
Honduras
Rwanda
Malaysia
Bolivia
Italy
Spain
Papua New Guinea
Kenya
Zimbabwe
Panama
Dominican Republic
Austria
Sweden
Pakistan
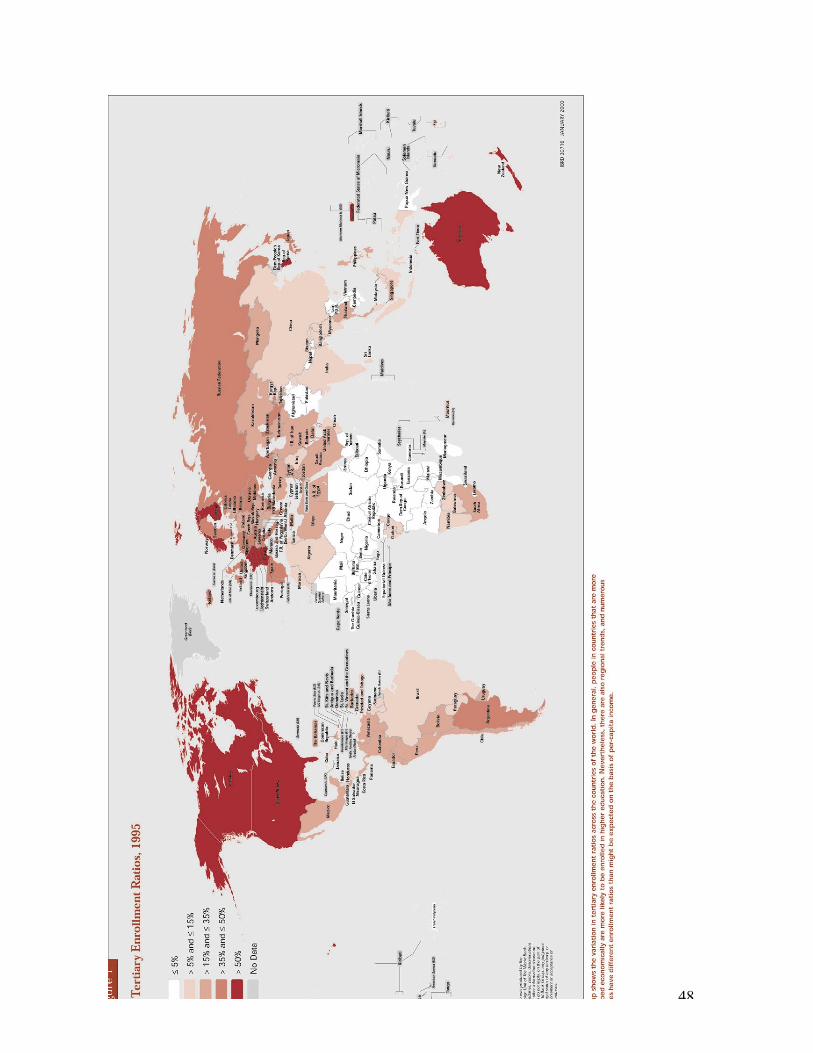
48
s
49
Appendix 2
List of institutions in sample (in Bangalore, unless otherwise noted)
Acharya PolytechnicBellary Engineering CollegeBMS College of EngineeringCollege of Engineering, Guindy (Chennai)Dayananda Sagar College of EngineeringGovernment Polytechnic for WomenIIT Madras (Chennai)International Institute of Information Technology (Hyderabad)Indian Institute of ScienceJawaharlal Nehru Technological University (Hyderabad)JSS Academy of Technical EducationMSR Institute of TechnologyMadras Institute of Technology (Chennai)Nizam Institute of Engineering and Technology (Hyderabad)P.E.S.Institute of TechnologySJ Government PolytechnicSRM Institute of Science and Technology (Chennai)VVS PolytechnicVijaynagar Engineering College
Other institutions interviewed (not used for sample tests)
India:Allahabad University, AllahabadBanaras Hindu University, VaranasiDevi Ahilyabai University, IndoreIIM, CalcuttaIIT, BombayJSS Mahavidyapeeth, DelhiUS:Illinois Institute of Technology, Champaign-Urbana, ILSan Jose State University, San Jose, CAStanford University, Stanford, CA