Embed Size (px)
Citation preview
Preparing for a “Change” in Severe Hail Warning Criteria in 2010
Brian J. FrugisNWS WFO Albany, NY
NROW XI November 4-5, 2009
Motivation for Study
• NWS ER will be changing severe hail criteria from 0.75” to 1.00” on January 1, 2010
• All current hail studies for the region are based on 0.75”– VIL of the Day– VIL Density– Common warning techniques using dBZ heights
relative to the -20° C level
• New thresholds and techniques are needed to accurately warn for the new hail criteria
What was done
• Examined radar returns for each report of severe hail (0.75” or larger) from the major severe cases of hail from the summer of 2009– July 16th and June 15th hail events
• Compiled data and compared averages of each parameter that was examined
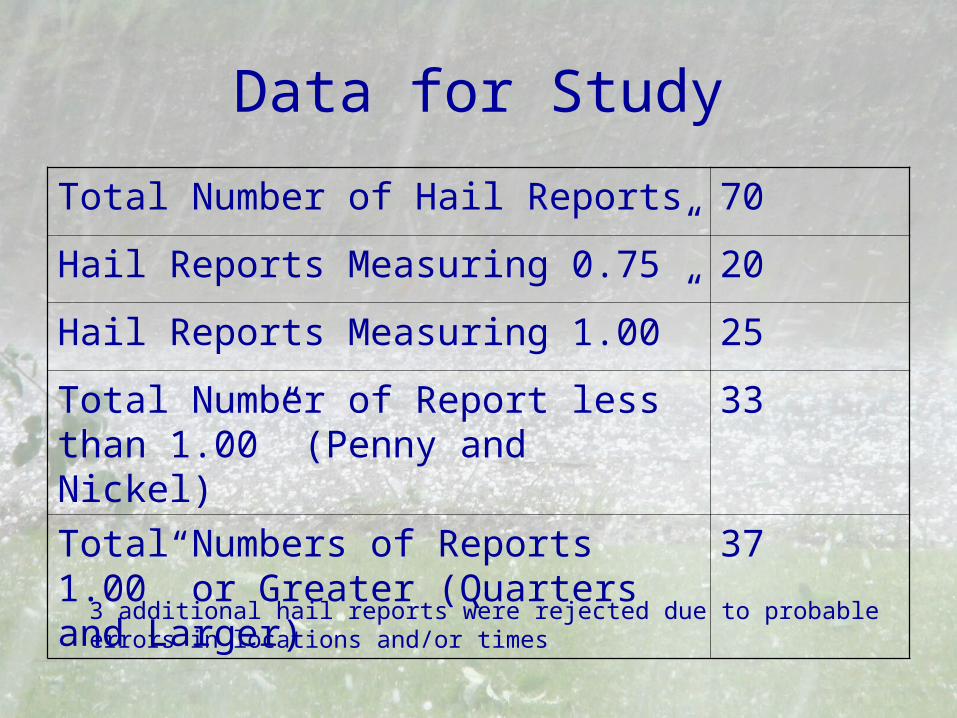
Data for Study
Total Number of Hail Reports 70
Hail Reports Measuring 0.75” 20
Hail Reports Measuring 1.00” 25
Total Number of Report less than 1.00” (Penny and Nickel)
33
Total Numbers of Reports 1.00” or Greater (Quarters and Larger)
37
3 additional hail reports were rejected due to probable errors in locations and/or times
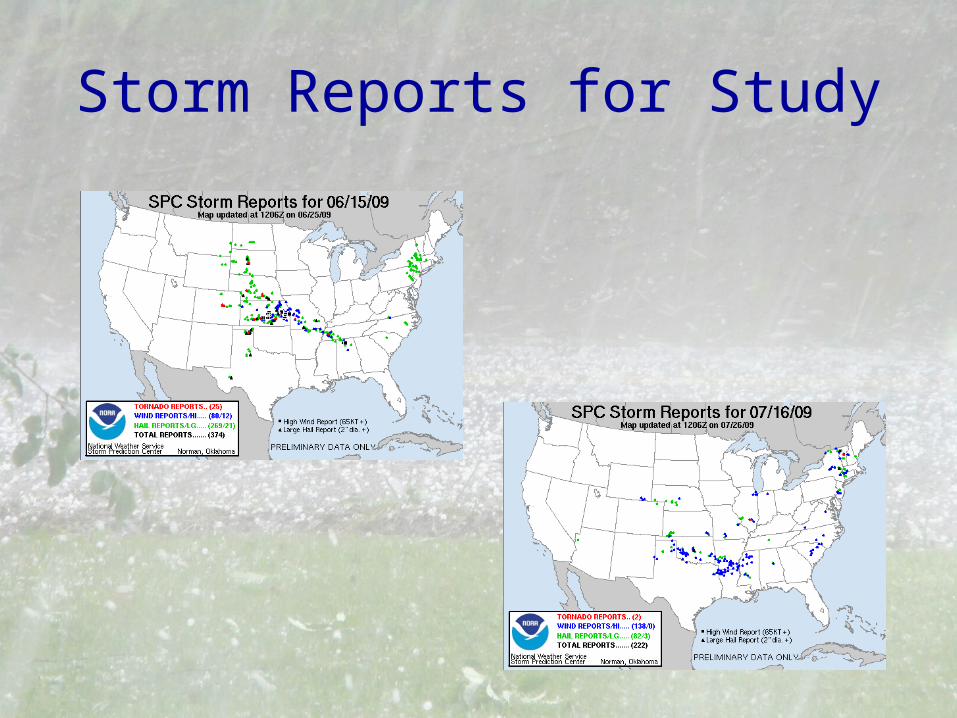
Storm Reports for Study
Parameters Studied
• 50 dBZ Echo Top• 55 dBZ Echo Top• 60 dBZ Echo Top• 65 dBZ Echo Top• Vertically Integrated Liquid (VIL)• Storm Echo Tops (ET)• VIL Density• Height of 50 dBZ Echo Top above -20° Celsius
isotherm
Why dBZ heights?
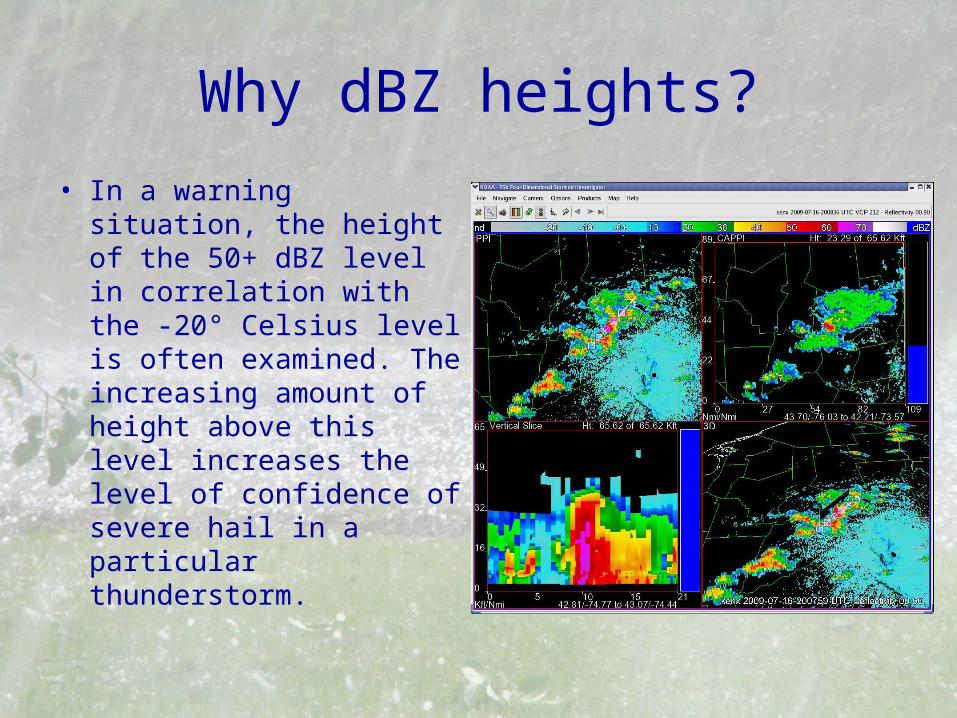
• In a warning situation, the height of the 50+ dBZ level in correlation with the -20° Celsius level is often examined. The increasing amount of height above this level increases the level of confidence of severe hail in a particular thunderstorm.

Why VIL Density?
• VIL Density = (VIL/ET) * 1000
• Units are in g m-3
• This helps “normalize” the VIL to produce a common values for thunderstorms producing hail, independent of the particular air mass.
Previous Studies on VIL Density
• Previous studies have been done examining VIL Density for the ALY CWA– VIL density values of 3.50 g m-3 identified 82% of severe
hail based on a 0.75” criteria in a paper by Blaes et. al in 1998
– They also determined that a VIL density of 3.70 g m-3 would depict 91% of severe hail cases based on a proposed 1.00”criteria (based on 154 total reports)
– However, this study also mentioned that this isn’t reliable since there would also be a False Alarm Rate (FAR) of 48% based on the data set used
• There were limited 1.00” reports in their database• It was recommended that additional studies be done
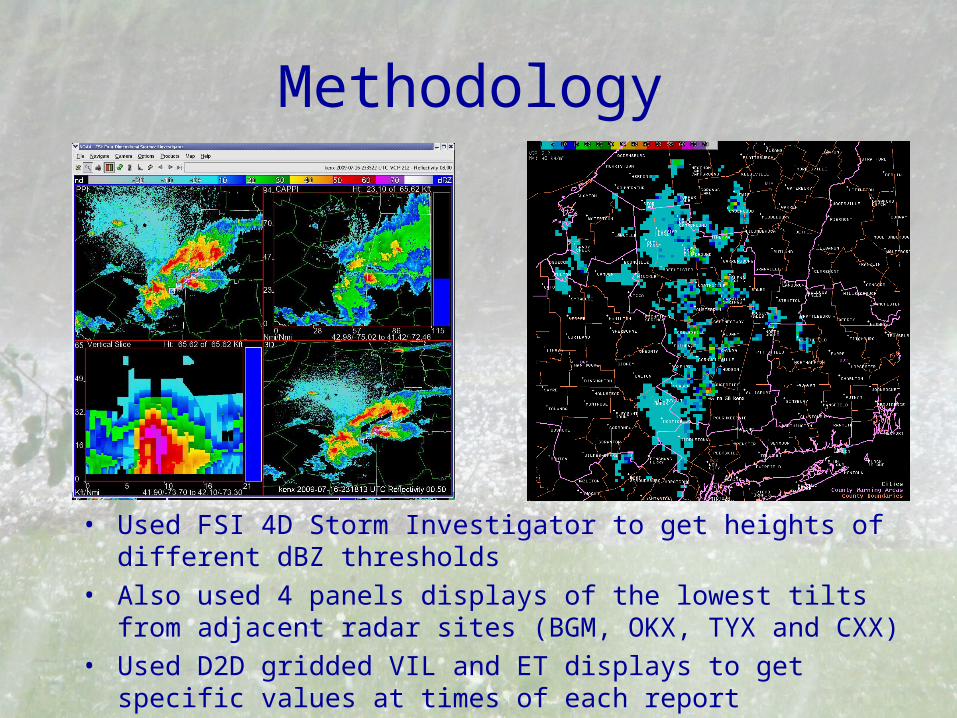
Methodology
• Used FSI 4D Storm Investigator to get heights of different dBZ thresholds
• Also used 4 panels displays of the lowest tilts from adjacent radar sites (BGM, OKX, TYX and CXX)
• Used D2D gridded VIL and ET displays to get specific values at times of each report
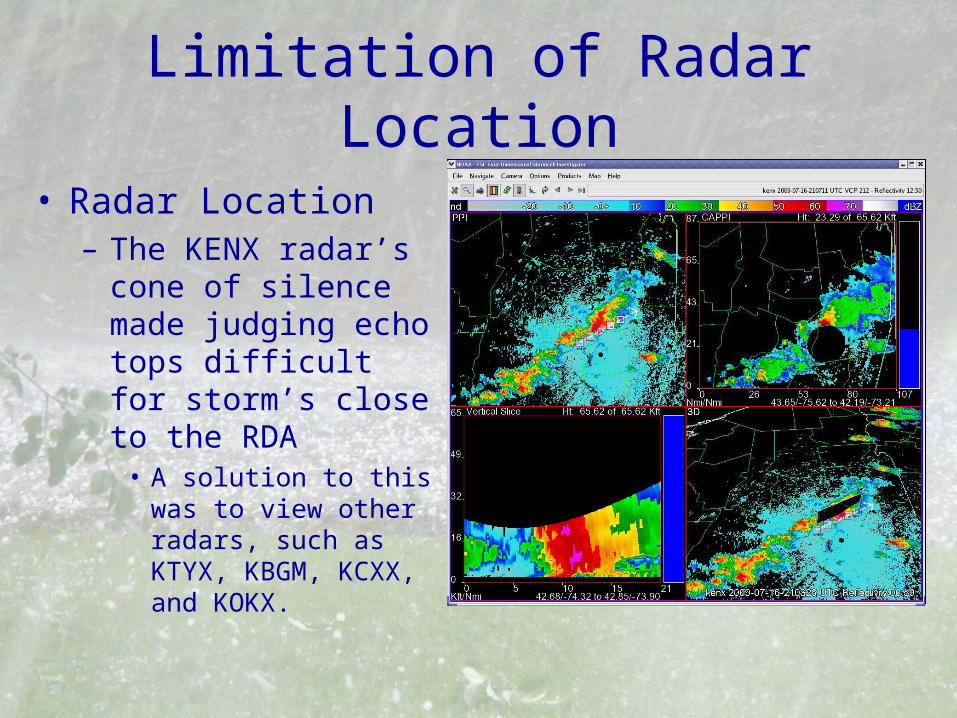
Limitation of Radar Location
• Radar Location– The KENX radar’s
cone of silence made judging echo tops difficult for storm’s close to the RDA
• A solution to this was to view other radars, such as KTYX, KBGM, KCXX, and KOKX.
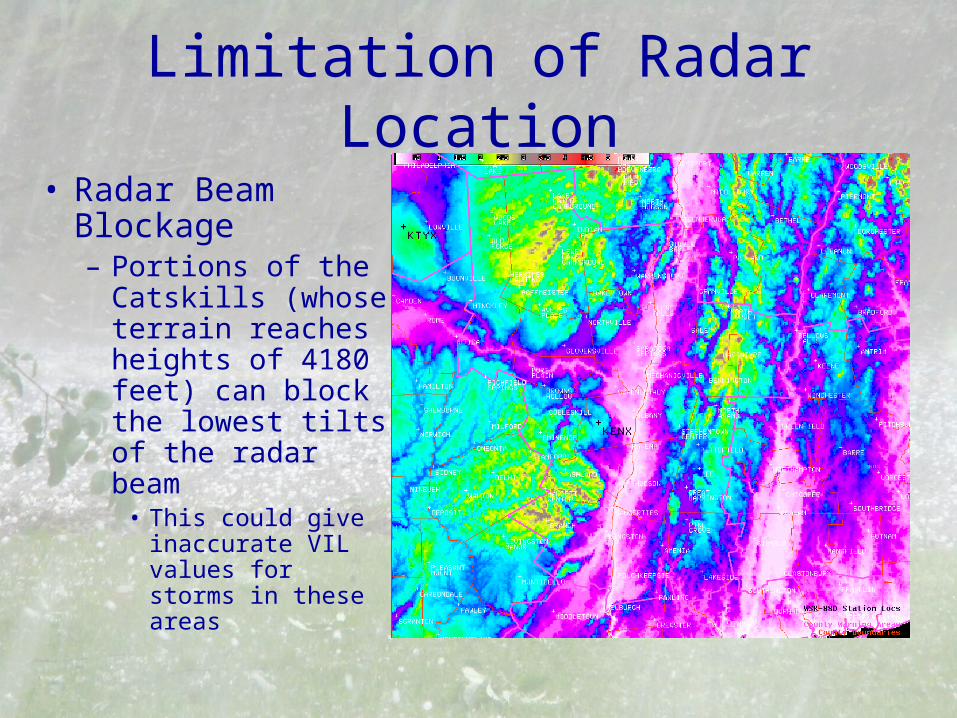
Limitation of Radar Location
• Radar Beam Blockage– Portions of the
Catskills (whose terrain reaches heights of 4180 feet) can block the lowest tilts of the radar beam
• This could give inaccurate VIL values for storms in these areas
Problems with Hail Reports
– Size is not always accurately measured• Spotters don’t always use rulers and some reports
are from the untrained public
– Location and time• Some locations and times listed on hail report may
be estimated and some spotters may not have given their exact latitude and longitude
– Have tried to include only the reports that made sense based on radar for this study
• Some hail reports may have occurred in unpopulated areas or in places where spotters were not available
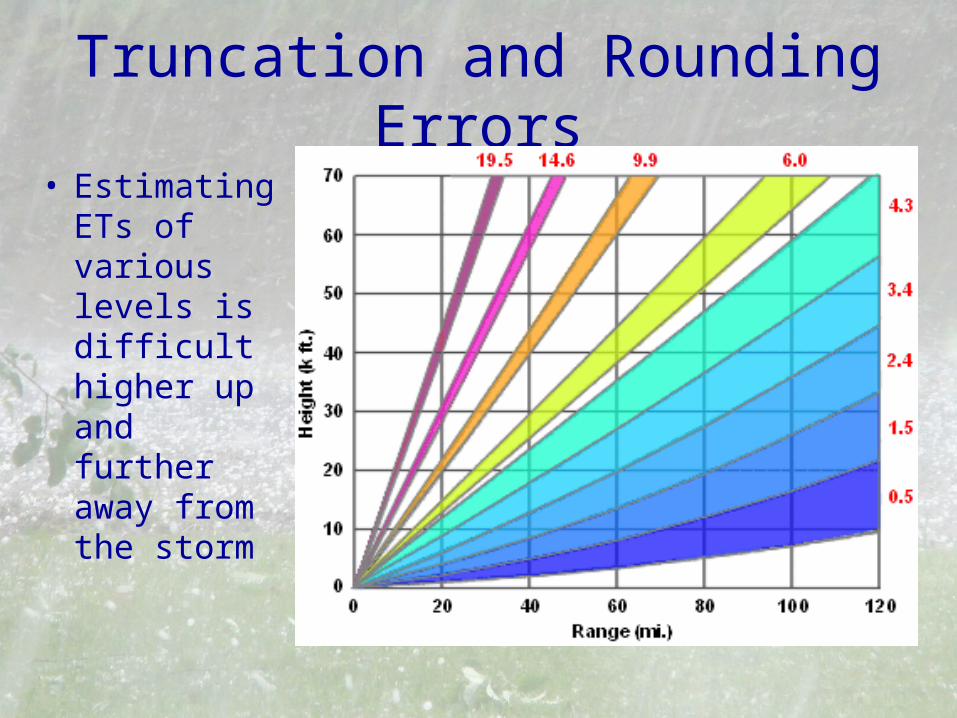
Truncation and Rounding Errors
• Estimating ETs of various levels is difficult higher up and further away from the storm
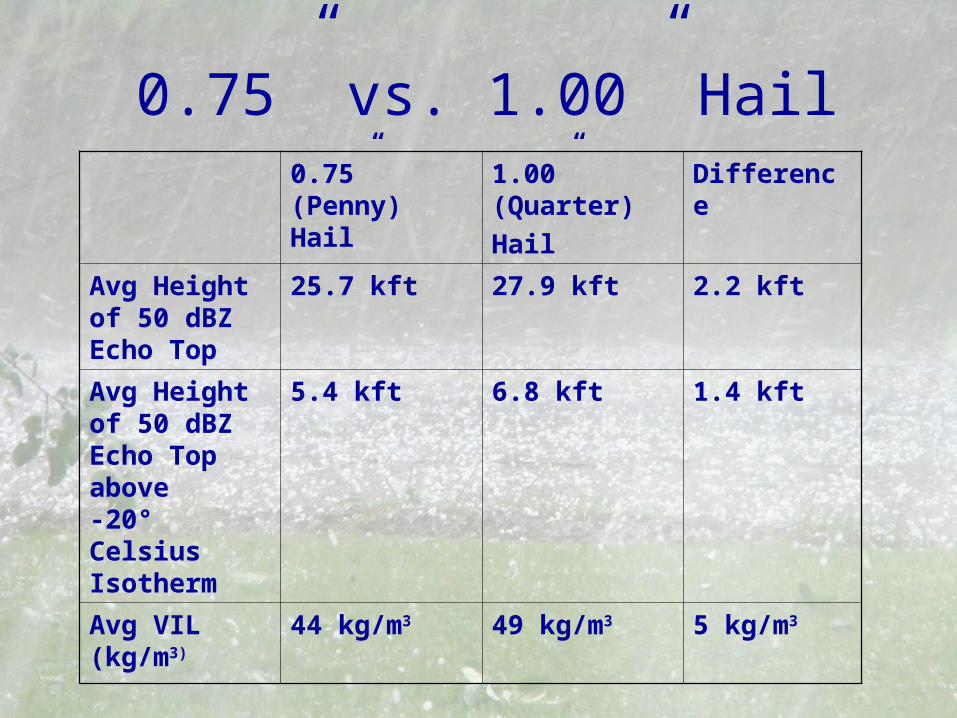
0.75” vs. 1.00” Hail0.75” (Penny) Hail
1.00” (Quarter)
Hail
Difference
Avg Height of 50 dBZ Echo Top
25.7 kft 27.9 kft 2.2 kft
Avg Height of 50 dBZ Echo Top above -20° Celsius Isotherm
5.4 kft 6.8 kft 1.4 kft
Avg VIL (kg/m3)
44 kg/m3 49 kg/m3 5 kg/m3
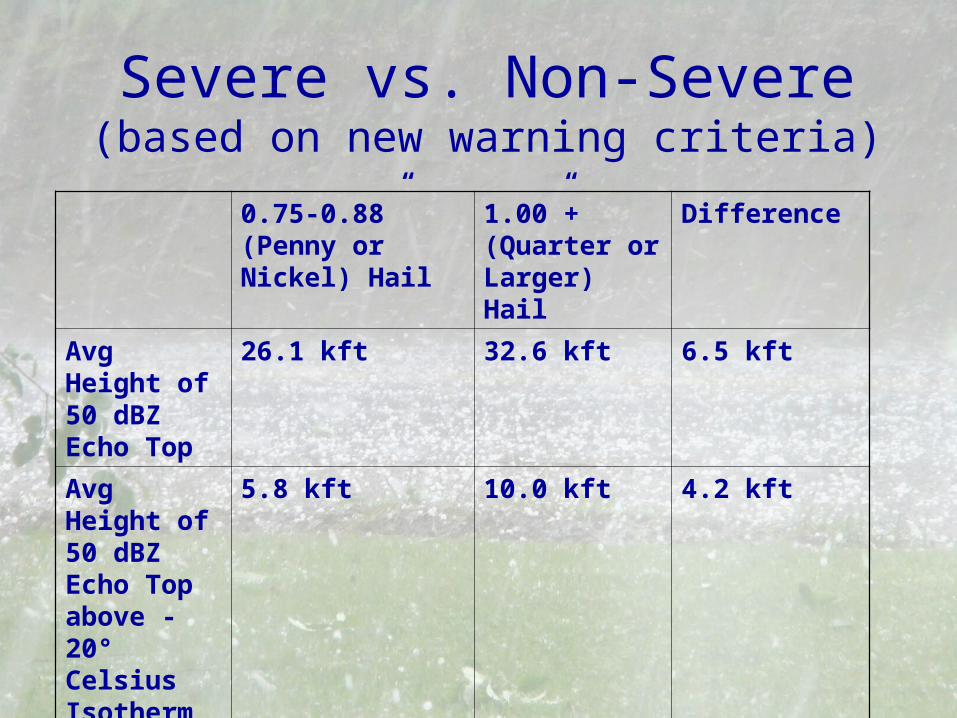
Severe vs. Non-Severe(based on new warning criteria)
0.75-0.88” (Penny or Nickel) Hail
1.00”+ (Quarter or Larger) Hail
Difference
Avg Height of 50 dBZ Echo Top
26.1 kft 32.6 kft 6.5 kft
Avg Height of 50 dBZ Echo Top above -20° Celsius Isotherm
5.8 kft 10.0 kft 4.2 kft
Avg VIL
(kg/m3)
45 kg/m3 52 kg/m3 7 kg/m3
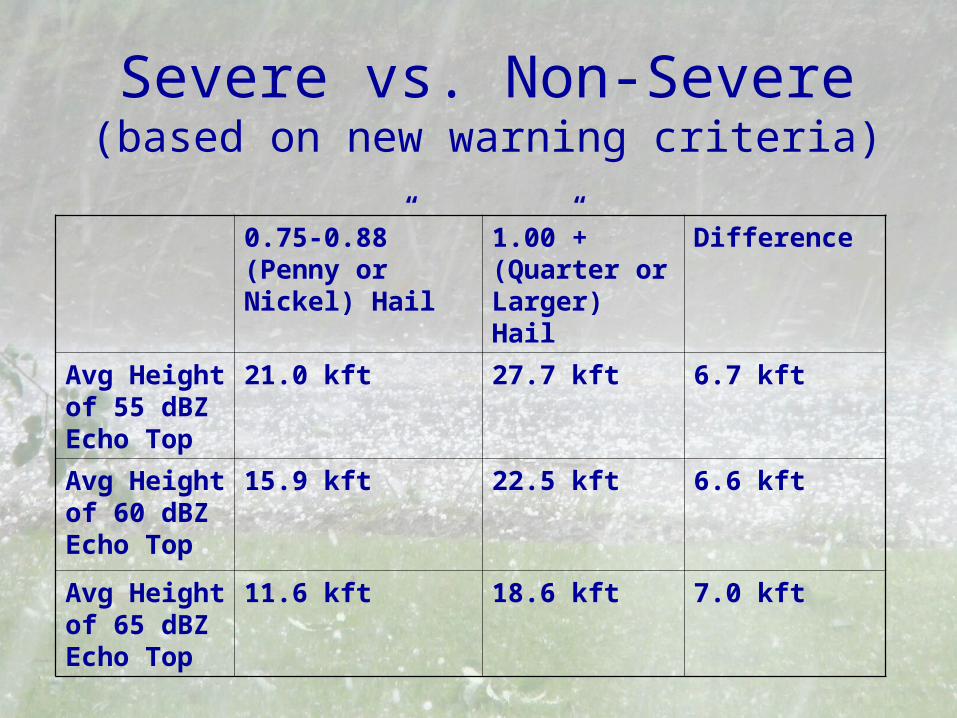
Severe vs. Non-Severe(based on new warning criteria)
0.75-0.88” (Penny or Nickel) Hail
1.00”+ (Quarter or Larger) Hail
Difference
Avg Height of 55 dBZ Echo Top
21.0 kft 27.7 kft 6.7 kft
Avg Height of 60 dBZ Echo Top
15.9 kft 22.5 kft 6.6 kft
Avg Height of 65 dBZ Echo Top
11.6 kft 18.6 kft 7.0 kft
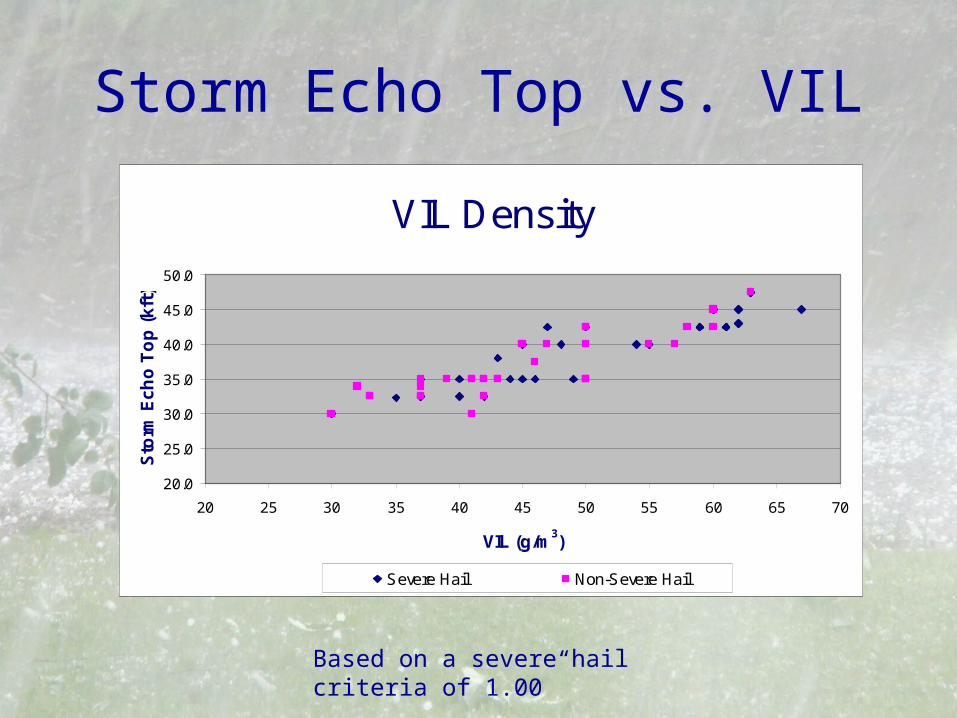
Storm Echo Top vs. VIL
VIL Density
20.0
25.0
30.0
35.0
40.0
45.0
50.0
20 25 30 35 40 45 50 55 60 65 70
VIL (g/m3)
Sto
rm E
ch
o T
op
(k
ft)
Severe Hail Non-Severe Hail
Based on a severe hail criteria of 1.00”
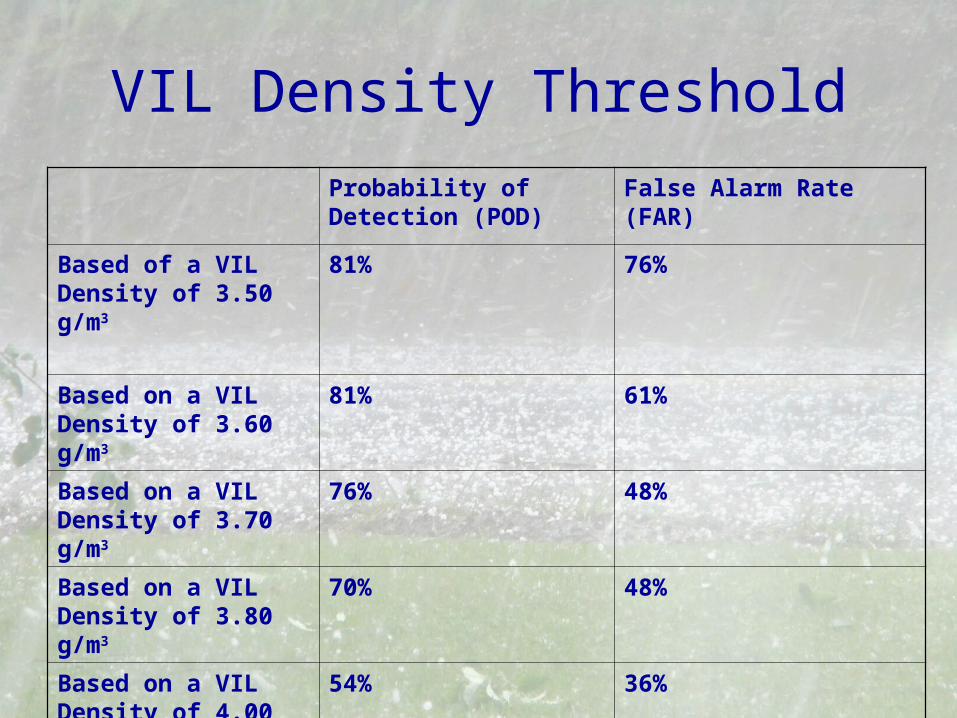
VIL Density Threshold
Probability of Detection (POD)
False Alarm Rate (FAR)
Based of a VIL Density of 3.50 g/m3
81% 76%
Based on a VIL Density of 3.60 g/m3
81% 61%
Based on a VIL Density of 3.70 g/m3
76% 48%
Based on a VIL Density of 3.80 g/m3
70% 48%
Based on a VIL Density of 4.00 g/m3
54% 36%
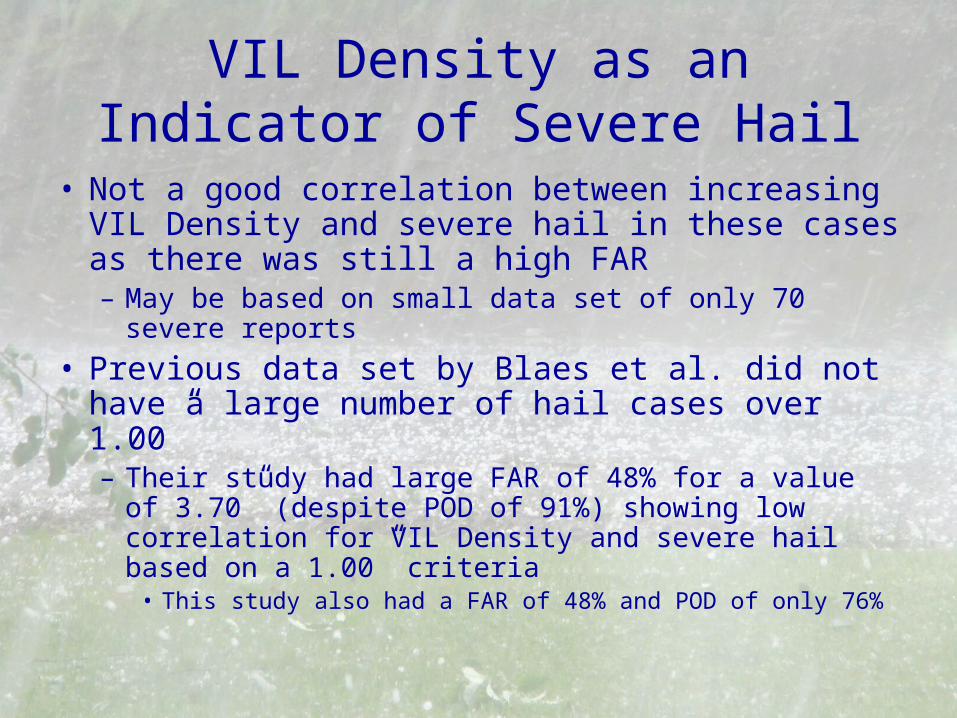
VIL Density as an Indicator of Severe Hail
• Not a good correlation between increasing VIL Density and severe hail in these cases as there was still a high FAR– May be based on small data set of only 70 severe
reports
• Previous data set by Blaes et al. did not have a large number of hail cases over 1.00”– Their study had large FAR of 48% for a value of 3.70”
(despite POD of 91%) showing low correlation for VIL Density and severe hail based on a 1.00” criteria
• This study also had a FAR of 48% and POD of only 76%
Summary
• The 50 dBZ ETs are in general about 10 kft above the -20° Celsius level– Average height is around 32.6 kft
• The dBZ echo tops (for 50, 55, 60 and 65 dBZ) are about 6-7 kft higher in a severe over a non-severe storm based on the new criteria
• No particular values of VIL Density seem to correlate well in our area for severe hail– At least based off this limited sample
Future Work
• Compile statistics from other events from 2009 as well as previous years– Will differences between severe and non-
severe storms be similar?
• Create a new “VIL of the Day” nomogram for operational use
• Attempt to see if VIL Density has a better correlation with a larger database
Acknowledgements
• Many thanks to Joe Villani and Tom Wasula for their help and guidance on this project!