Embed Size (px)
Citation preview

Hydrologic Trends Associated with Urban Development for Selected Streams in the Puget Sound Basin, Western Washington
Hydrologic Trends Associated with Urban Development for Selected Streams in the Puget Sound Basin, Western Washington
Prepared in cooperation with the Washington Department of Ecology
U.S. Department of the InteriorU.S. Geological Survey
Water-Resources Investigations Report 02-4040 Water-Resources Investigations Report 02-4040
U.S. GEOLOGICAL SURVEY
Water-Resources Investigations Report 02-4040
Hydrologic Trends Associated with Urban Development for Selected Streams in the Puget Sound Basin, Western Washington
Prepared in cooperation with the
WASHINGTON DEPARTMENT OF ECOLOGY
By Christopher P. Konrad, U.S. Geological Survey, Tacoma, WAand Derek B. Booth, University of Washington, Seattle, WA
Tacoma, Washington2002

U.S. DEPARTMENT OF THE INTERIOR
GALE A. NORTON, Secretary
U.S. GEOLOGICAL SURVEY
Charles G. Groat, Director
For additional information write to:
District ChiefU.S. Geological Survey1201 Pacific Avenue – Suite 600Tacoma, Washington 98402
http://wa.water.usgs.gov
Copies of this report can be purchasedfrom:
U.S. Geological SurveyInformation ServicesBuilding 810Box 25286, Federal CenterDenver, CO 80225-0286
Any use of trade, product, or firm names in this publication is for descriptive purposes only and does not imply endorsement by the U.S. Government.
District ChiefU.S. Geological Survey1201 Pacific Avenue – Suite 600Tacoma, Washington 98402http://wa.water.usgs.gov

Contents iii
CONTENTS
Abstract ................................................................................................................................................................ 1Introduction .......................................................................................................................................................... 1Description of Study Area.................................................................................................................................... 2Previous Investigations ........................................................................................................................................ 5
Hydrologic Effects of Urban Development ................................................................................................ 5Streamflow Variability................................................................................................................................ 5Alternative Measure of the Hydrologic Effects of Urban Development .................................................... 6
Methods for Identifying Hydrologic Trends Associated with Urban Development............................................ 7Annual Mean Discharge.............................................................................................................................. 11Fraction of Year Annual Mean Discharge Was Exceeded.......................................................................... 11Annual 7-day Low Flow ............................................................................................................................. 11Annual Maximum Discharge ...................................................................................................................... 12Continuous Trends ...................................................................................................................................... 12Error Analysis ............................................................................................................................................. 13
Hydrologic Trends................................................................................................................................................ 24Trends Over the Entire Period of Record.................................................................................................... 24Errors in Long-Term Trend Identification Using Short-Term Period of Records ...................................... 35Hydrologic Effects of Urban Development ................................................................................................ 35
Implications of Trend Analysis for Hydrologic Monitoring................................................................................ 37Summary .............................................................................................................................................................. 38References Cited .................................................................................................................................................. 38

iv Contents
FIGURES
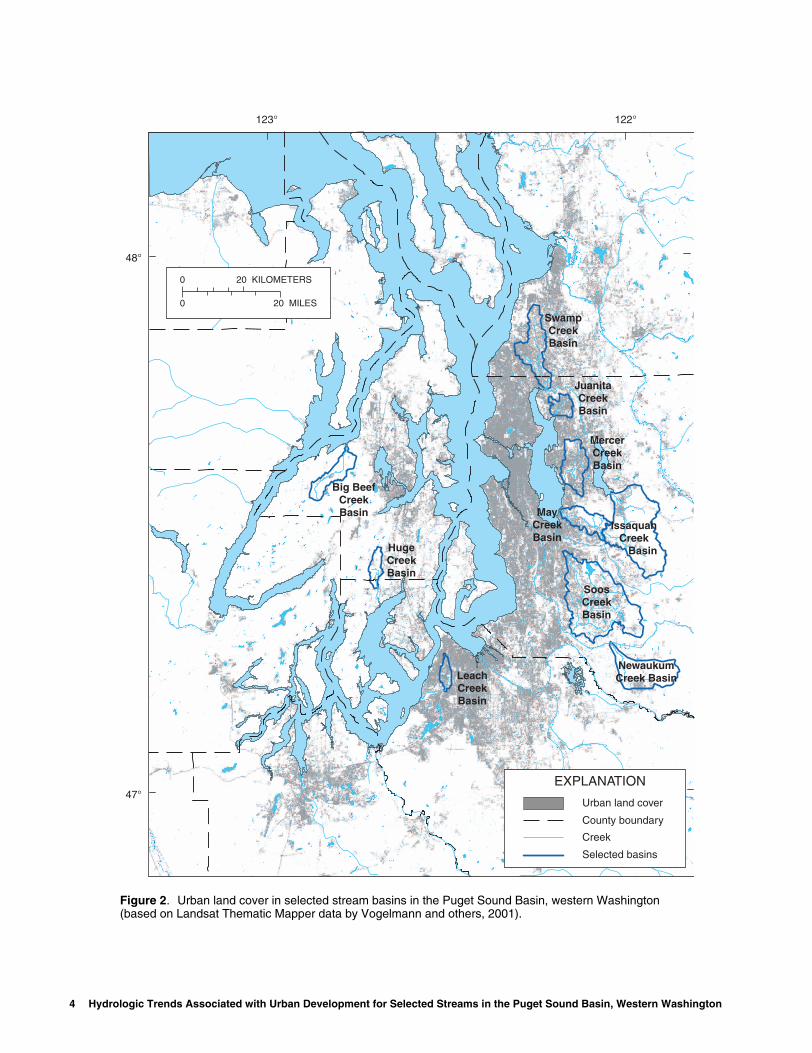
Figure 1. Map showing location of selected streams in the Puget Sound Basin, western Washington ............ 3Figure 2. Map showing urban land cover in selected stream basins in the Puget Sound Basin,
western Washington (based on Landsat Thematic Mapper data by Vogelmann and others, 2001) ............................................................................................................ 4
Figure 3. Graph showing population density relative to land use for selected streams in the Puget Sound Basin, western Washington, 1940 to 2000 ................................................................... 9
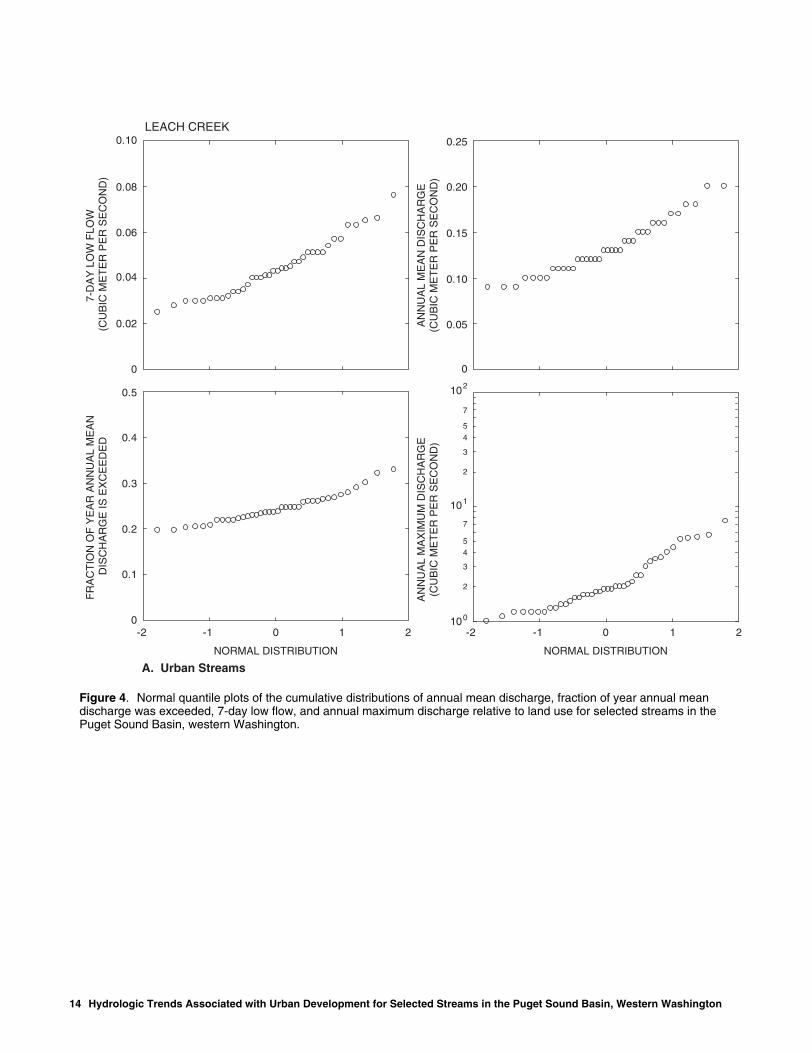
Figure 4. Normal quantile plots of the cumulative distributions of annual mean discharge, fraction of year annual mean discharge was exceeded, 7-day low flow, and annual maximum discharge relative to land use for selected streams in the Puget Sound Basin, western Washington........................................................................................................................... 14
Figure 5. Graphs showing annual values of mean discharge (Qmean), fraction of year mean discharge was exceeded (TQmean), 7-day low flow (Qmin), and maximum discharge (Qmax) relative to land use for selected streams in the Puget Sound Basin, western Washington........................................................................................................................... 25
Figure 6. Graph showing fraction of year daily mean discharge exceeds annual mean discharge (TQmean) in two rural streams — Issaquah and Newaukum Creeks in the Puget Sound Basin, western Washington, water years 1964-2000 .................................................................................... 37

Contents v
TABLES
Table 1. Land use, drainage area, and period of streamflow records for 10 selected streams in the Puget Sound Basin, western Washington ................................................................................ 8
Table 2. Mean value and coefficient of variation (CV) for streamflow statistics over period of record for 10 selected streams in the Puget Sound Basin, western Washington ............................... 10
Table 3. Hydrologic trends in streamflow statistics over the entire period of record for 10 selected streams in the Puget Sound Basin, western Washington ..................................................... 35
Table 4. Error rates for comparisons of trends in streamflow statistics for 10-year periods of record with trends over the entire period of record for each of the 10 selected streams in the Puget Sound Basin, western Washington ................................................................................ 36
vi Conversion Factors
CONVERSION FACTORS AND VERTICAL DATUM
Sea level: In this report "sea level" refers to the National Geodetic Vertical Datum of 1929 (NGVD of1929)--a geodetic datum derived from a general adjustment of the first-order level nets of both theUnited States and Canada, formerly called Sea Level Datum of 1929.
Altitude, as used in this report, refers to distance above or below sea level.
Multiply By To obtain
millimeter (mm) 0.03937 inchmeter (m) 3.281 foot
kilometer (km) 0.6214 mile square kilometer (km2) 0.3861 square mile
cubic meter per second (m3/s) 70.07 acre-foot per day 35.31 cubic foot per second

Hydrologic Trends Associated with Urban Development for Selected Streams in the Puget Sound Basin, Western Washington
By Christopher P. Konrad, U.S. Geological Survey, Tacoma, WAand Derek B. Booth, University of Washington, Seattle, WA
ABSTRACT
Annual streamflow statistics from 10 selected streams in the Puget Sound Basin in western Washington were analyzed to identify possible hydrologic trends associated with urban development and to evaluate the effect of record length on errors in trend analysis. The analysis used three common streamflow statistics (annual mean discharge, annual maximum discharge, and 7-day low flow) and introduced an alternative statistic (fraction of year annual mean discharge was exceeded) for assessing the hydrologic effects of urban development. Although trends were identified in each of the four statistics analyzed, trends were not consistent in any of the four statistics for all selected streams. Instead, trends in two statistics – (1) fraction of year annual mean discharge was exceeded, and (2) annual (instantaneous) maximum discharge – were evident in streams with the highest levels of urban development over the period of record but not in streams with the lowest levels of urban development. Trends were not consistent for either annual mean discharge or 7-day low flow in urban streams. Trends were sensitive to the period of analysis for all four statistics, but particularly for the 7-day low flow, which showed increasing and decreasing trends for 10 subsets of the period of record in some streams.
INTRODUCTION
Urban development in western Washington has altered runoff processes in many stream basins resulting in modified streamflow patterns. The hydrologic consequences of urban development have deleterious effects on people and stream ecosystems including increased flooding and bank erosion, the redistribution of water from periods of baseflow to stormflow, and physical disturbance of and changes to aquatic habitat (Hammer, 1972; Orser and Shure, 1972; Ebisemiju, 1989; Booth, 1990; Konrad, 2000). The hydrologic effects of urban development and the stormwater-management activities intended to mitigate those effects are not easily evaluated because variability in streamflow patterns, over time ranging from hours to decades, is not necessarily a consequence of anthropogenic activities (Lins and Slack, 1999).
A cooperative investigation between the U.S. Geological Survey (USGS) and the Washington State Department of Ecology (DOE) was initiated in 2001 to evaluate methods for monitoring the hydrologic effects of urban development and management activities intended to mitigate those effects. The results of this investigation identify streamflow statistics that exhibit trends in response to urban development but, otherwise, have relatively low inter-annual variability. These statistics may be incorporated as monitoring requirements in the National Pollutant Discharge Elimination System, Phase I, Municipal General Stormwater Permit issued by DOE.
Introduction 1

The purpose of this report is to assess the suitability of four streamflow statistics for monitoring hydrologic changes associated with urban development and, potentially, from activities intended to mitigate effects of those land-use changes. The four statistics are annual mean discharge, annual maximum discharge, annual 7-day low flow, and the fraction of a year that annual mean discharge is exceeded. Hydrologic changes due to urban development are characterized in terms of trends in annual values of the statistics over the entire periods of record for 10 selected streams in the Puget Sound Basin in western Washington. Errors in trend identification due to hydrologic variability unrelated to land-use changes are evaluated by comparing trends over the entire period of record to trends over subsets of the entire period of record.
DESCRIPTION OF STUDY AREA
The Puget Sound Basin is a 35,000-square-kilometer region of western Washington bounded by the Cascade Range and Olympic Mountains (fig. 1). The geology and topography of the Puget Lowland reflects repeated glaciation with glacial till plateaus, outwash plains, and many north-south trending valleys. Wetlands and lakes are common on the plateaus with
streams forming ravines at the margins of the plateaus. Many streams flow directly into Puget Sound or Lake Washington rather than into the large rivers such as the Nisqually, Puyallup, Duwamish, and Snohomish Rivers. The region has a maritime climate and annually receives about 1,000 mm of precipitation. Much of the annual precipitation falls between November and April as rain and with occasional snow at high altitudes. Streamflow is produced by runoff during frequent rainstorms and ground-water discharge from shallow aquifers. The combined effect of low rainfall rates and deep, permeable soils limit runoff in forested areas largely to shallow subsurface flow and saturation overland flow.
About 70 percent of the population in Washington lives in the Puget Sound Basin, though most of the basin is forested (Ebbert and others, 2000).The population is concentrated in the Puget Lowland around the metropolitan centers of Seattle, Tacoma, and Everett (fig. 2). Much of the urban development in the region has occurred recently: the population of the four-county region of King, Kitsap, Pierce, and Snohomish Counties has grown 16 to 46 percent per decade from 820,000 in 1940 to 3,275,000 in 2000 (Washington State, 2001).
2 Hydrologic Trends Associated with Urban Development for Selected Streams in the Puget Sound Basin, Western Washington

Sw
am
p C
reek
Juan
ita
Cre
ek
May Creek
Issaquah Creek
Soos
Cre
ek
Newauk um CreekLeach C
re
ek
Big
Bee
f Cre
ek
Huge C
reek
Mer
cer C
ree
k
122°123°
48°
47°
CLALLAM COUNTY
JEFFERSONCOUNTY
MASONCOUNTY
GRAYSHARBOR COUNTY
THURSTONCOUNTY
KITSAPCOUNTY
SNOHOMISH COUNTY
KINGCOUNTY
PIERCECOUNTY
ISLANDCOUNTY
12011200
12069550
12108500
12112600
12119600
12121600
12120000
12120500
12127100
12069550
EXPLANATION
County boundary
Creek
0
0 20 KILOMETERS
20 MILES
Study location
WASHINGTON
STREAMFLOW GAGING STATION AND NUMBER Streamflow records from these stations were analyzed for trends (see table 1)
12069550
Figure 1. Location of selected streams in the Puget Sound Basin, western Washington.
Description of Study Area 3
123° 122°
48°
47°
SwampCreekBasin
JuanitaCreekBasin
MercerCreekBasin
MayCreekBasin
IssaquahCreek
Basin
SoosCreekBasin
NewaukumCreek Basin
HugeCreekBasin
Big BeefCreekBasin
LeachCreekBasin
0
0 20 KILOMETERS
20 MILES
EXPLANATION
County boundary
Creek
Urban land cover
Selected basins
4 Hyd
Figure 2. Urban land cover in selected stream basins in the Puget Sound Basin, western Washington (based on Landsat Thematic Mapper data by Vogelmann and others, 2001).
rologic Trends Associated with Urban Development for Selected Streams in the Puget Sound Basin, Western Washington

PREVIOUS INVESTIGATIONS
The conversion of lowland forests to urban land uses has many hydrologic effects with significant sociological and ecological ramifications. Hydrologic trends resulting from urban development can be difficult to identify because development and its effects proceed by small increments and variability in streamflow over time masks anthropogenic trends. Although a number of streamflow statistics are likely to change in response to urban development, some streamflow statistics also may indicate ecological relevant changes.
Hydrologic Effects of Urban Development
Urban development has many potential effects on runoff processes, streamflow patterns, and, as a result, stream ecosystems (Savini and Kammerer, 1961; Leopold, 1968; Hollis, 1975; Booth, 1991). Urban development modifies hydrologic processes when vegetation is cleared from hillslopes, the land surface is graded, and building and roads are constructed. These changes reduce interception, infiltration, subsurface flow, evapotranspiration, stormwater storage on hillslopes, and the time required for stormwater to travel over and through a hillslope to a stream (Savini and Kammerer, 1961; Dinicola, 1990; Burges and others, 1998). As a result, streams have more frequent stormflow events with high peak discharge but rapid stormflow recession (Carter, 1961; Harris and Rantz, 1964; Leopold, 1968). Peak discharge rates of small, frequent floods in particular increase by a greater percentage of pre-development rates than large, infrequent floods (James, 1965; Hollis, 1975).
Sawyer (1963) illustrated the redistribution of runnoff from baseflow to stormflow for an urban stream on Long Island, New York. Simmons and Reynolds (1982) estimated baseflow as a fraction of annual discharge on a part of Long Island, and found an inverse correlation with the amount of urban development. The greatest change in baseflow occurred with the construction of sanitary and storm sewers, which decreased the baseflow fraction of
streamflow from 95 to 20 percent. When septic systems remained in urbanized (storm-sewered) areas, the baseflow fraction of streamflow decreased to 84 percent. In comparison to estimates of recharge for pre-development conditions on Long Island, New York, annual recharge is estimated to have increased by 12 percent in areas served by infiltration basins but decreased by 10 percent where storm sewers collect runoff and discharge if to streams or the ocean (Ku and others, 1992).
The rapid recession of stormflow in urban streams leads to lower baseflow on a unit-area basis during the winter wet-season than in suburban streams in western Washington (Konrad, 2000). Likewise, Klein (1979) studied 27 small catchments in Maryland and concluded that wet-season baseflow decreased by as much as 90 percent in catchments with predominantly impervious land cover. The increase in stormflow and decrease in wet-season baseflow represent the redistribution of runoff from subsurface flow and storage in depressions, the soil column, and on vegetation to overland flow and open-channel flow in culverts and ditches.
The effects of urban development on dry-season baseflow in some cases contrast to the effects of urban development on baseflow during the wet season. Harris and Rantz (1964) determined that dry-season discharge in Permanente Creek, California, increased in response to urban development as a result of landscape irrigation.
Streamflow Variability
Streamflow variability at the scale of storms, seasons, or years is so great in many streams that it may obscure the effects of urban development. As a result, trends may not be apparent even over a relatively long period of record. Alternatively, variability due to climatic conditions may produce trends in streamflow that are not necessarily anthropogenic (Lins and Slack, 1999). Even short, multi-year sequences of wet or dry years can produce statistically significant trends, particularly when those sequences are at the start or end of a period of record (Wahl, 1998).
Previous Investigations 5

A variety of streamflow statistics, including annual maximum discharge, the rate of stormflow recession, and the lag time between rainfall and runoff can indicate hydrologic effects of urban development (Leopold, 1968). As a result, we evaluate the annual variability of four different streamflow statistics to assess which ones show consistent trends in response to urban development but otherwise have low inter-annual variability. However, the variability of these statistics is not necessarily related to land use.
Aquatic organisms are adapted to some forms and magnitude of variability in streamflow. For example, biological conditions in streams re-establish quickly, often within months after periods of extreme but short-lived streamflow, such as floods and droughts (Boulton and others, 1992; Bayley and Osborne, 1993; Jones and others, 1995). In contrast, long-duration streamflow patterns are likely to have a persistent biological influence on stream ecosystems (Poff and others, 1997).
The hydrologic effects of urban development that are most relevant to stream ecosystems may be distinguished from other symptomatic effects of urban development, in part, by the temporal scale of the statistics used to characterize streamflow patterns. The intra-annual distribution of runoff between stormflow and baseflow has been identified in particular as a factor influencing the composition and structure of lotic communities (Poff and Ward, 1989; Poff and Allen, 1995).
The intra-annual hydrologic variability in a stream can be measured in a number of ways including the coefficient of variation of daily discharge, the skew of daily discharge, or inter-quantile ratios (Helsel and Hirsch, 1993). Each of those statistics indicates a particular form of hydrologic variability. For example, the coefficient of variation and skew of daily discharge are sensitive to the magnitude of high but infrequent flows. In contrast, the inter-quartile ratio (Q0.75/Q0.25) is insensitive to the magnitude of extremely high or low flows, but may indicate variability in common flows between wet and dry seasons.
Alternative Measure of the Hydrologic Effects of Urban Development
Intra-annual hydrologic variability is determined in the broadest sense by the distribution of annual runoff between stormflow and recessional and baseflows. These flow conditions are not defined by a precise discharge and, moreover, they vary among streams and in a stream from year to year and season to season. As an alternative, annual mean discharge (Qmean), which is typical of the winter baseflow in Puget Lowland streams (Konrad, 2000), can be used to separate the annual distribution of daily discharge into stormflow and recessional and baseflows.
Mean annual discharge has been used to normalize and to index discharge of streams in regional analyses where annual availability is not an issue. Saville and Watson (1933) and Morgan (1936) found that the distributions of daily discharges for streams in a region were similar when the distribution for each stream was normalized by mean annual discharge. Likewise, Leopold and Maddock (1953) used mean annual discharge of rivers as an index of geomorphically effective flows in their hydraulic geometry relations because mean annual discharge was exceeded on average the same number of days in the rivers they analyzed and, thus, provided a consistent index of discharge.
For most streams, there are more days when discharge is less than Qmean than when discharge is greater than Qmean because the distribution of daily discharge in a stream generally has a positive skew as a result of relatively high discharge rates on a few days in a year. However, the distribution of daily discharge relative to Qmean is not invariant among streams: daily mean discharge is less than Qmean much of the time and only occasionally exceeds Qmean in flashy streams (high peak discharge, relative to baseflow, rapid recession rates), although daily discharge more commonly exceeds Qmean in streams with relatively large, consistent ground-water inflows. Indeed, Morgan (1936, p. 425) observed that the distribution of daily flows relative to the mean "is affected by topography, arrangement of tributaries with regard to time of concentration of surface flow, geologic structure, soil, vegetation, weather, and human developments related to flow of water."
6 Hydrologic Trends Associated with Urban Development for Selected Streams in the Puget Sound Basin, Western Washington

The redistribution of water from baseflow to stormflow decreases the fraction of year daily mean discharge in a stream exceeds annual mean discharge (TQmean) of streams. Konrad (2000) showed statistically significant step trends in TQmean between water years 1960 to 1969 and water years 1989 to 1998 using the non-parametric Wilcoxon rank-sum test for three urban streams (Juanita, Leach, and Mercer Creeks) in western Washington but only one suburban stream (Newaukum Creek).
Furthermore, a comparison of mean values of TQmean for 23 streams in the Puget Lowland for water years 1989 through 1998 indicated an inverse relation between TQmean and urban development as measured using road density (Konrad, 2000). TQmean was inversely correlated with road density (Pearson correlation coefficient, ρ = -0.50; probability that ρ is significantly different than 0, p = 0.01). The mean value of TQmean for 11 urban streams (defined as a road density greater than 6 km/km2) was 0.29 while it was 0.34 for 12 suburban streams (road density less than 6 km/km2). The difference was statistically significant (p < 0.01 using a two-tailed Student's t-test among groups with equal variance). TQmean was greater than or equal to 0.32 in "suburban" streams with one exception (Huge Creek). TQmean was less than or equal to 0.31 in "urban" streams with one exception (Clover Creek).
Independent of urban development, large streams typically have more attenuated streamflow patterns than small streams and, as a consequence, high values of TQmean. However, an analysis of the 10-year mean values of TQmean of urban and suburban streams with drainage areas greater than 20 km2 still showed an inverse correlation between TQmean and road density (ρ = -0.51, p = 0.01) (Konrad, 2000). Thus, TQmean is a reliable indicator of hydrologic differences resulting from urban development when comparing streams with similar drainage areas and, presumably, other physiographic factors.
METHODS FOR IDENTIFYING HYDROLOGIC TRENDS ASSOCIATED WITH URBAN DEVELOPMENT
Hydrologic trends associated with urban development were assessed by (1) identifying changes in annual streamflow statistics for selected streams in western Washington over time during periods of urban development, and (2) comparing the variation in the annual streamflow statistics with the population density of representative communities in each stream basin. Because all large river basins in the region are mostly rural or forested with mountain headwaters, the analysis was limited to small streams (drainage area less than 200 km2) in the Puget Lowland (altitudes less than 200 m above sea level). The focus on small, lowland streams limits the extent to which physiographic differences (topography, hypsometry, geology, and drainage area) are likely to produce differences in hydrologic processes (runoff mechanism and channel routing) or hydrologic trends. Continuous streamflow records spanning at least 30 years (not all records are continuous) from 10 USGS gages were analyzed to characterize the hydrologic effects of urban development and to assess the likelihood of errors in identifying trends from using relatively short periods of record (table 1). Discharge records at all of the gaging stations were rated good with the exception of Juanita and Big Beef, which were rated fair. The gaging station on May Creek was operated by King County Division of Surface-Water Management for the period for 1989 to 1998.
Streamflow has been regulated to varying degrees in the selected basins (Kimbrough and others, 2001). Mercer Creek basin has numerous detention ponds to limit flooding. High flows in Leach Creek have been regulated since 1962 by a large detention pond and, since 1994 by an interbasin bypass intended to limit peak discharge to less than 1.7 m3/s. Low flows in Leach Creek have been supplemented by ground-water pumping since June 1993 to maintain aminimum flow of 0.43 m3/s for water-quality concerns.
Methods for Identifying Hydrologic Trends Associated with Urban Development 7

8
. Table 1. Land use, drainage area, and period of streamflow records for 10 selected streams in the Puget Sound Basin, western Washington
[km2, square kilometer; km/km2; kilometer per square kilometer]
StreamUSGS
Station No.Drainage area
(km2)Road density
(km/km2)
Period of streamflow record
Mean dailydischarge
Annual maximum discharge
Urban
Leach Creek 12011200 12 9.9 1958-851989-2000
1958-99
Juanita Creek 12120500 17 11.3 1964-90 1964-91
Mercer Creek 12120000 31 9.1 1956-2000 1956-99
Suburban
Swamp Creek 12127100 25 7.9 1964-90 1964-90
May Creek 12119600 32 5.0 1965-711989-901993-99
1955-791989-98
Soos Creek 12112600 171 4.7 1961-2000 1961-99
Rural
Huge Creek 12069550 17 2.5 1947-691978-2000
1948-98
Big Beef Creek 12069550 35 2.1 1970-811996-99
1970-811996-99
Newaukum Creek 12108500 70 2.6 1945-501953-2000
1945-99
Issaquah Creek 12121600 145 2.4 1964-2000 1964-99
The hydrologic effects of these flood-control and flow-augmentation systems are anticipated to reduce the magnitude of trends related to increased stormflow and decreased baseflow. Other basins may have structures regulating streamflow, but they are likely to have little effect on the streamflow records.
In the urban and most suburban stream basins (Leach, Mercer, Juanita, Swamp, and May), much of the domestic water is supplied via interbasin transfers and much of the wastewater is collected in a regional wastewater treatment system and discharged to Puget Sound or the Duwamish River. In most rural stream basins (Huge, Big Beef, and Newaukum), domestic water is supplied by ground-water pumping and wastewater is discharged back to the ground. In parts of the Issaquah Creek and Soos Creek basins, however, water is supplied by ground-water pumping and wastewater is collected, treated, and discharged out of
the basin. The combination of ground-water pumping and interbasin wastewater transfers may deplete streamflow in these creeks as a result.
Hydrologic trends are likely to coincide with periods of the greatest rate of development in terms of the area of a basin graded for construction and connected to storm sewers or other drainage systems including road networks. Streamflow records do not necessarily span these periods in each basin, so hydrologic trends may not be evident where records began after extensive urban development (Leach Creek) or where development only recently has expanded (1990-2000) (Issaquah Creek).
Urban development was characterized by population growth of representative communities and road density in each stream basin. Population growth and urban development during the 20th century has not been uniform in western Washington (fig. 3).
Hydrologic Trends Associated with Urban Development for Selected Streams in the Puget Sound Basin, Western Washington

1940 1950 1960 1970 1980 1990 20000
200
400
600
800
1,000
1,200
1,400
1,600
1,800
(PE
OP
LE P
ER
SQ
UA
RE
KIL
OM
ET
ER
)
CALENDAR YEAR
Swamp Creek
Soos Creek
May Creek
SUBURBAN STREAMS
Issaquah Creek
Big Beef and Huge Cre
Newaukum Creek
RURAL STREAMS
EXPLANATION
Juanita Creek
Mercer Creek
URBAN STREAMSLeach Creek
Figure 3. Population density relative to land use for selected streams in the Puget Sound Basin, western Washington, 1940 to 2000.
(Population density data from Washington State, 2001).
Methods for Identifying Hydrologic Trends Associated with Urban Development 9

Populations expanded rapidly during the latter half of the 20th century in urban basins with low, though increasing growth rates in the suburban and rural basins (King County, 2001; Washington State, 2001). The largest cities grew quickly and attained higher population densities than the surrounding areas, while growth in smaller cities lagged. For example, the population density around Leach Creek in Tacoma had reached a relatively high level (1,100 people/km2) by 1950 while the population around Mercer Creek, which drains Bellevue, did not reach this density until 1990 (Washington State, 2001). Hydrologic trends are expected to be most pronounced in Juanita and Mercer Creeks where population growth has been greatest during periods with streamflow records.
Road densities (about 1995) were used to classify the basins as urban, suburban, or rural. Leach, Juanita, and Mercer Creeks are "urban" with road densities greater than 9 km/km2. Swamp, May, and Soos, Creeks are "suburban" with road densities of 4 to 8 km/km2. Huge, Big Beef, Newaukum, and Issaquah Creeks are "rural" with road densities of less than 3 km/km2. Road densities (table 1) correlate well with population densities of representative communities from each basin (table 2).
Four annual streamflow statistics were investigated to characterize the range of streamflow patterns that may be affected by urban development: annual mean discharge, the fraction of year annual mean discharge was exceeded, 7-day low flow, and annual maximum (instantaneous) discharge.
10 H
Table 2. Mean value and coefficient of variation (CV) for streamflow statistics over period of record for 10 selected streams in the Puget Sound Basin, western Washington
[For Qmax, summary statistics are geometric mean values in cubic meters per second and coefficient of variation assuming a two-parameter log normal distribution of annual maximum discharge]
Stream
Streamflow statistics (in cubic meters per second)
Annual mean discharge
(Qmean)
Fraction of year annual mean discharge was exceeded (TQmean)
7-day low flow
(Qmin)
Annual maximum
discharge (Qmax)
Urban
Leach Creek Mean 0.13 0.25 0.04 2.0
CV 0.25 0.16 0.33 0.47
Juanita Creek Mean 0.31 0.30 0.07 4.3
CV 0.21 0.11 0.20 0.31
Mercer Creek Mean 0.64 0.29 0.17 8.6
CV 0.21 0.14 0.23 0.39
Suburban
Swamp Creek Mean 0.96 0.31 0.13 12.6
CV 0.21 0.11 0.20 0.31
May Creek Mean 0.66 0.33 0.09 6.5
CV 0.27 0.11 0.14 0.45
Soos Creek Mean 3.49 0.39 0.72 20.4
CV 0.27 0.10 0.20 0.42
Rural
Huge Creek Mean 0.31 0.27 0.11 3.7
CV 0.28 0.18 0.15 0.63
Big Beef Creek Mean 1.22 0.28 0.10 18.0
CV 0.35 0.21 0.21 0.26
Newaukum Creek Mean 1.70 0.35 0.42 18.9
CV 0.24 0.10 0.22 0.45
Issaquah Creek Mean 3.77 0.35 0.68 40.0
CV 0.26 0.09 0.22 0.47
ydrologic Trends Associated with Urban Development for Selected Streams in the Puget Sound Basin, Western Washington

Annual Mean Discharge
Annual mean discharge (Qmean) provides a central measure of the range of discharge in a stream and indicates the annual runoff volume. Changes in annual Qmean without corresponding changes in timing of runoff would effectively change the aquatic habitat available in a stream. A decrease in annual Qmean would decrease stream depth and wetted surface area and an increase in annual Qmean would increase stream depth and wetted surface area. The productivity and diversity of aquatic communities generally vary with habitat area or other measures related to Qmean such as drainage area (Welcomme, 1979, Allan, 1995). Thus biological conditions of a stream could be expected to vary directly with trends in annual Qmean. However, urban development is not anticipated to have a systematic effect on Qmean, unless (1) irrigation in a basin is extensive with water imported from other basins or pumped from deep aquifers, (2) rates of consumptive water use of surface water or ground water from shallow aquifers that would otherwise discharge to the stream are high, or (3) interbasin transfers of stormwater are large.
Fraction of Year Annual Mean Discharge Was Exceeded
The fraction of year annual mean discharge was exceeded (TQmean) provides a temporal measure of the distribution of annual runoff in a stream between stormflow periods and recessional and baseflow periods. TQmean is high in streams with sustained stormflow periods with gradual recession rates and relatively high baseflow. TQmean is low when stormflow periods are brief but with high magnitudes and rapid recession rates ("flashy" hydrographs). TQmean is calculated as the fraction of days in a given water year that daily discharge exceeds that year's Qmean. TQmean may be low in years with large floods when Qmean is high but not necessarily the number of days when daily discharge exceeds Qmean. However, TQmean is less sensitive to the magnitude of large floods than other statistics such as the coefficient of variation or skew of daily discharge rates that are derived from the difference between daily and annual mean discharge rates.
An increase in hydrologic variability is likely important to the structure and composition of lotic communities (Shelford and Eddy, 1929; Odum, 1956; Horwitz, 1978; Poff and Allan, 1995). The increased variability specifically referenced by TQmean, which is an increase in stormflow volume relative to winter baseflow, is likely to represent an increase in the frequency of streambed disturbance and diminished extent of ambient aquatic habitat. The biological effects of this variability in Puget Lowland streams was evident in the variation of diversity of benthic macroinvertebrate assemblages with TQmean (Konrad, 2000). TQmean is expected to decrease in streams during periods of urban development as runoff is redistributed from periods of stormflow recession and baseflow to stormflow.
Annual 7-day Low Flow
The 7-day low flow (Qmin) provides a measure of the lowest magnitude of streamflow during summer baseflow conditions in selected streams in western Washington. Qmin is calculated as the minimum mean daily discharge for 7 consecutive days. Qmin provides a measure of the severity of annual droughts in a stream, although the biological significance of a drought may depend on other conditions such as water depth or temperature. Even though aquatic communities may recover rapidly from a severe drought (Bayley and Osborne, 1993), a decreasing trend of low flows in a stream may signify a decrease in the habitat available to fish and other aquatic organisms during the summer with consequent reductions in the diversity and complexity of lotic communities in habituating that stream (Stehr and Branson, 1938; Rabeni and Wallace, 1998). The effects of urban development on Qmin warrants further examination in western Washington streams given the conflicting responses observed in other regions (Sawyer, 1963; Harris and Rantz, 1964; Klein, 1979).
Methods for Identifying Hydrologic Trends Associated with Urban Development 11

Annual Maximum Discharge
Annual maximum (instantaneous) discharge (Qmax) provides a measure of the magnitude of the largest flood in a stream during a year. By transporting and depositing bed material, floods represent a form of ecological disturbance. As with droughts, aquatic communities can recover rapidly from floods (Stehr and Branson, 1938; Fisher and others, 1982). In alluvial streams, an increase in the magnitude of floods expected from urban development may cause only a transient increase in the frequency extent of biological disturbances during periods of channel expansion (Booth, 1990). Once a stream channel has expanded, it may accommodate frequent foods without extensive erosion. However, streams in urban areas generally are not free to erode their banks, thus even frequent floods may represent a persistent form of disturbance. Indeed, Orser and Shure (1972) suggested that the decrease in salamander populations in urban streams in Georgia was a consequence of the increased frequency and magnitude of floods.
Qmax increases in response to urban development in a stream basin, particularly for smaller magnitude events, which can increase by as much as an order of magnitude (Hollis, 1975). More typical increases for less frequent (but more potentially damaging) storms in western Washington, evaluated using the Hydrologic Simulation Program Fortran (HSPF), show two- to three-fold increases following urban development (King County, 1991). This is approximately the same range of variability imposed by fluctuations in year-to-year weather conditions, even in the absence of any changes in a drainage basin. As a consequence, trends in Qmax may be statistically significant only for long records spanning a period of urban development.
Continuous Trends
Trends in the streamflow statistics were evaluated using nonparametric and parametric tests. The nonparametric tests for correlation between each statistic and time used Kendall's correlation coefficient (Helsel and Hirsch, 1993):
(1)
where
Kendall's t has a value of 1 where the value of a statistic increases each year and has a value of -1 where the value decreases each year. The statistical significance of trends were evaluated in terms of the probability (p) of observing the statistic S, where S = I - D, given the null hypothesis of no trend. This provided a "two-tailed" test for either an increasing or decreasing trend. If p was less than 5 percent, the trend was identified as significant. S-PLUS 2000 (MathSoft, 2000) was used to perform the tests.
The parametric test for trends assessed the correlation between each statistic and population density of the representative communities for each stream using the Pearson correlation coefficient (ρ) (Helsel and Hirsch, 1993):
(2)
where
The significance of the correlation was assessed using a two-tailed Student's t distribution where t was calculated by (Helsel and Hirsch, 1993):
(3)
with n-2 degrees of freedom where n is the number of years of record. If p < 0.05, then the correlation is significant, though its strength depends on the value of ρ.τ 2 I D–( )
n n 1–( )--------------------=
I = Number of pairs of annual values of a statistic that have an increasing value over time,
D = Number of pairs of annual values that have a decreasing value over time, and
n = Total number of annual values of the statistic.
xi is population density for year i,x is the mean population density,sx is the standard deviation of population density,yi is the streamflow statistic for year i,y is the mean streamflow statistic, andsy is the standard deviation of the streamflow
statistic.
ρ 1n 1–------------
i 1=
n
∑xi x–
sx------------ yi y–
sy------------ =
t ρ n 2–
1 ρ2–-------------------=
12 Hydrologic Trends Associated with Urban Development for Selected Streams in the Puget Sound Basin, Western Washington

Normal quantile plots were used to evaluate the distributions of the four statistics (fig. 4). A normally distributed variable will plot as a straight line on a normal quantile plot. Qmean, TQmean, and Qmin have approximately normal distributions in most streams. Qmax generally is skewed with the largest floods in a stream having greater magnitudes than are expected for a normal distribution (fig. 4) so it was plotted on a log-scale. In this case, Qmax will plot as a straight line if it has a log normal distribution.
Error Analysis
Tests for anthropogenic trends in streamflow patterns are likely to produce a relatively high error rate because of the high annual variability in streamflow and the incremental effects of urban development on streamflow patterns over time. Short-term hydrologic trends can emerge over periods of a few years to a decade as a result of climatic conditions, but are unlikely to be effects of urban development, which tend to be monotonic and permanent. If a trend due to climatic variability is mistakenly identified as a "consequence of urbanization," it represents a Type I statistical error (false positive). Alternatively, statistical tests may not detect trends in an annual streamflow statistic where the incremental change each year is small relative to annual variability or where the trend occurred outside of the period of record. In such cases, a statistical test would not recognize the importance of the short-term change and so produce a Type II error (false negative).
The use of "error" in this report, then, is limited to cases where the results of testing a portion of the period of record for trends diverge from the results of
testing the entire period of record for trends. Errors are identified by either a trend during a portion of a period of record that did not persist over the period of record (Type I) or the lack of a trend during a portion of the period of record when there was a trend over the entire period of record (Type II).
The error rates of trend tests for each individual stream were analyzed by comparing the results of trend tests for selected intervals to the results of the test for the entire period of record. Kendall's t test was applied to 10-year periods of record beginning in 1960, 1965, 1970, 1975, 1980, 1985, and 1990. Type I errors (false positives) were identified for any stream that had a statistically significant trend over the 10-year period but did not have a trend, or had a trend of the opposite direction, over the entire period of record. Type II errors (false negatives) were identified for any stream that showed no statistically significant trends during any of 10-year periods but did have a trend based on a Kendall's t test over the entire period of record.
The error analysis for the parametric tests proceeded as with the nonparametric tests. Type I errors were identified for streams where the correlation between the value of a statistic and population density for a 10-year period was significant, but the correlation between the statistic and population density was not significant over the entire period of record. Type II errors were identified for streams where the correlation between the value of a statistic and population density for any 10-year period was not significant, but the statistic was significantly correlated with population density over the entire period of record.
Methods for Identifying Hydrologic Trends Associated with Urban Development 13
0
0.02
0.04
0.06
0.08
0.10
0
0.1
0.2
0.3
0.4
0.5
-2 -1 0 1 2 -2 -1 0 1 2
0
0.05
0.10
0.15
0.20
0.25LEACH CREEK
FR
AC
TIO
N O
F Y
EA
R A
NN
UA
L M
EA
N
DIS
CH
AR
GE
IS E
XC
EE
DE
D7-
DA
Y L
OW
FLO
W
(CU
BIC
ME
TE
R P
ER
SE
CO
ND
)
AN
NU
AL
MA
XIM
UM
DIS
CH
AR
GE
(CU
BIC
ME
TE
R P
ER
SE
CO
ND
)A
NN
UA
L M
EA
N D
ISC
HA
RG
E(C
UB
IC M
ET
ER
PE
R S
EC
ON
D)
NORMAL DISTRIBUTION NORMAL DISTRIBUTION
A. Urban Streams
100
101
102
2
3
45
7
2
3
4
5
7
Figure 4. Normal quantile plots of the cumulative distributions of annual mean discharge, fraction of year annual mean discharge was exceeded, 7-day low flow, and annual maximum discharge relative to land use for selected streams in the Puget Sound Basin, western Washington.
14 Hydrologic Trends Associated with Urban Development for Selected Streams in the Puget Sound Basin, Western Washington

0
0.02
0.04
0.06
0.08
0.10
0
0.1
0.2
0.3
0.4
0.5
FR
AC
TIO
N O
F Y
EA
R A
NN
UA
L M
EA
N
DIS
CH
AR
GE
IS E
XC
EE
DE
D7-
DA
Y L
OW
FLO
W
(CU
BIC
ME
TE
R P
ER
SE
CO
ND
)
-2 -1 0 1 2 -2 -1 0 1 2
NORMAL DISTRIBUTION NORMAL DISTRIBUTION
A. Urban Streams.--Continued
0
0.05
0.10
0.15
0.20
0.25
AN
NU
AL
MA
XIM
UM
DIS
CH
AR
GE
(CU
BIC
ME
TE
R P
ER
SE
CO
ND
)A
NN
UA
L M
EA
N D
ISC
HA
RG
E(C
UB
IC M
ET
ER
PE
R S
EC
ON
D)
100
101
102
2
3
45
7
2
3
4
5
7
JUANITA CREEK
Figure 4.—Continued.
Methods for Identifying Hydrologic Trends Associated with Urban Development 15

0
0.05
0.10
0.15
0.20
0.25
0
0.1
0.2
0.3
0.4
0.5
-2 -1 0 1 2 -2 -1 0 1 2
0
0.2
0.4
0.6
0.8
1.0
1.2MERCER CREEK
A. Urban Streams.--Continued
FR
AC
TIO
N O
F Y
EA
R A
NN
UA
L M
EA
N
DIS
CH
AR
GE
IS E
XC
EE
DE
D7-
DA
Y L
OW
FLO
W
(CU
BIC
ME
TE
R P
ER
SE
CO
ND
)
AN
NU
AL
MA
XIM
UM
DIS
CH
AR
GE
(CU
BIC
ME
TE
R P
ER
SE
CO
ND
)A
NN
UA
L M
EA
N D
ISC
HA
RG
E(C
UB
IC M
ET
ER
PE
R S
EC
ON
D)
NORMAL DISTRIBUTION NORMAL DISTRIBUTION
100
101
102
2
3
45
7
2
3
4
5
7
Figure 4.—Continued.
16 Hydrologic Trends Associated with Urban Development for Selected Streams in the Puget Sound Basin, Western Washington

0
0.05
0.10
0.15
0.20
0
0.1
0.2
0.3
0.4
0.5
-2 -1 0 1 2 -2 -1 0 1 2
0
0.4
0.8
1.2
1.6SWAMP CREEK
FR
AC
TIO
N O
F Y
EA
R A
NN
UA
L M
EA
N
DIS
CH
AR
GE
IS E
XC
EE
DE
D7-
DA
Y L
OW
FLO
W
(CU
BIC
ME
TE
R P
ER
SE
CO
ND
)
AN
NU
AL
MA
XIM
UM
DIS
CH
AR
GE
(CU
BIC
ME
TE
R P
ER
SE
CO
ND
)A
NN
UA
L M
EA
N D
ISC
HA
RG
E(C
UB
IC M
ET
ER
PE
R S
EC
ON
D)
NORMAL DISTRIBUTION NORMAL DISTRIBUTION
100
101
102
2
3
45
7
2
3
4
5
7
B. Suburban Streams
Figure 4.—Continued.
Methods for Identifying Hydrologic Trends Associated with Urban Development 17

0
0.02
0.04
0.06
0.08
0.10
0.12
0
0.1
0.2
0.3
0.4
0.5
-2
0
0.2
0.4
0.6
0.8
1.0
1.2
FR
AC
TIO
N O
F Y
EA
R A
NN
UA
L M
EA
N
DIS
CH
AR
GE
IS E
XC
EE
DE
D7-
DA
Y L
OW
FLO
W
(CU
BIC
ME
TE
R P
ER
SE
CO
ND
)
AN
NU
AL
MA
XIM
UM
DIS
CH
AR
GE
(CU
BIC
ME
TE
R P
ER
SE
CO
ND
)A
NN
UA
L M
EA
N D
ISC
HA
RG
E(C
UB
IC M
ET
ER
PE
R S
EC
ON
D)
NORMAL DISTRIBUTION NORMAL DISTRIBUTION
100
101
102
2
3
45
7
2
3
4
5
7
B. Suburban Streams.--Continued
-1 0 1 2 -2 -1 0 1 2
MAY CREEK
Figure 4.—Continued.
18 Hydrologic Trends Associated with Urban Development for Selected Streams in the Puget Sound Basin, Western Washington

0
0.02
0.04
0.06
0.08
0.10
0
0.1
0.2
0.3
0.4
0.5
1
2
3
4
6
5
FR
AC
TIO
N O
F Y
EA
R A
NN
UA
L M
EA
N
DIS
CH
AR
GE
IS E
XC
EE
DE
D7-
DA
Y L
OW
FLO
W
(CU
BIC
ME
TE
R P
ER
SE
CO
ND
)
AN
NU
AL
MA
XIM
UM
DIS
CH
AR
GE
(CU
BIC
ME
TE
R P
ER
SE
CO
ND
)A
NN
UA
L M
EA
N D
ISC
HA
RG
E(C
UB
IC M
ET
ER
PE
R S
EC
ON
D)
100
101
102
2
3
45
7
2
3
4
5
7
-2 -1 0 1 2 -2 -1 0 1 2
NORMAL DISTRIBUTION NORMAL DISTRIBUTION
B. Suburban Streams.--Continued
SOOS CREEK
0
Figure 4.—Continued.
Methods for Identifying Hydrologic Trends Associated with Urban Development 19

0
0.04
0.08
0.12
0.16
0
0.1
0.2
0.3
0.4
0.5
-2 -1 0 1 2 -2 -1 0 1 2
0
0.1
0.2
0.3
0.4
0.5
0.6
FR
AC
TIO
N O
F Y
EA
R A
NN
UA
L M
EA
N
DIS
CH
AR
GE
IS E
XC
EE
DE
D7-
DA
Y L
OW
FLO
W
(CU
BIC
ME
TE
R P
ER
SE
CO
ND
)
AN
NU
AL
MA
XIM
UM
DIS
CH
AR
GE
(CU
BIC
ME
TE
R P
ER
SE
CO
ND
)A
NN
UA
L M
EA
N D
ISC
HA
RG
E(C
UB
IC M
ET
ER
PE
R S
EC
ON
D)
NORMAL DISTRIBUTION NORMAL DISTRIBUTION
100
101
102
2
3
45
7
2
3
4
5
7
C. Rural Streams
HUGE CREEK
Figure 4.—Continued.
20 Hydrologic Trends Associated with Urban Development for Selected Streams in the Puget Sound Basin, Western Washington

0
0.05
0.10
0.15
0.20
0
0.1
0.2
0.3
0.4
0.5
-2
FR
AC
TIO
N O
F Y
EA
R A
NN
UA
L M
EA
N
DIS
CH
AR
GE
IS E
XC
EE
DE
D7-
DA
Y L
OW
FLO
W
(CU
BIC
ME
TE
R P
ER
SE
CO
ND
)
-1 0 1 2 -2 -1 0 1 2
NORMAL DISTRIBUTION NORMAL DISTRIBUTION
100
101
102
2
3
45
7
2
3
4
5
7
C. Rural Streams.--Continued
0.5
1.0
1.5
2.0
2.5
AN
NU
AL
MA
XIM
UM
DIS
CH
AR
GE
(CU
BIC
ME
TE
R P
ER
SE
CO
ND
)A
NN
UA
L M
EA
N D
ISC
HA
RG
E(C
UB
IC M
ET
ER
PE
R S
EC
ON
D)
BIG BEEF CREEK
0
Figure 4.—Continued.
Methods for Identifying Hydrologic Trends Associated with Urban Development 21

0
0.1
0.2
0.3
0.4
0.6
0.5
0
0.1
0.2
0.3
0.4
0.5
-2 -1 0 1 2 -2 -1 0 1 2
FR
AC
TIO
N O
F Y
EA
R A
NN
UA
L M
EA
N
DIS
CH
AR
GE
IS E
XC
EE
DE
D7-
DA
Y L
OW
FLO
W
(CU
BIC
ME
TE
R P
ER
SE
CO
ND
)
NORMAL DISTRIBUTION NORMAL DISTRIBUTION
C. Rural Streams.--Continued
0
0.5
1.0
1.5
2.0
2.5
AN
NU
AL
MA
XIM
UM
DIS
CH
AR
GE
(CU
BIC
ME
TE
R P
ER
SE
CO
ND
)A
NN
UA
L M
EA
N D
ISC
HA
RG
E(C
UB
IC M
ET
ER
PE
R S
EC
ON
D)
100
101
102
2
3
45
7
2
3
4
5
7
NEWAUKUM CREEK
Figure 4.—Continued.
22 Hydrologic Trends Associated with Urban Development for Selected Streams in the Puget Sound Basin, Western Washington

0
0.2
0.4
0.6
0.8
1.0
0
0.1
0.2
0.3
0.4
0.5
-2 -1 0 1 2 -2 -1 0 1 2
0
1
2
3
4
6
5
FR
AC
TIO
N O
F Y
EA
R A
NN
UA
L M
EA
N
DIS
CH
AR
GE
IS E
XC
EE
DE
D7-
DA
Y L
OW
FLO
W
(CU
BIC
ME
TE
R P
ER
SE
CO
ND
)
AN
NU
AL
MA
XIM
UM
DIS
CH
AR
GE
(CU
BIC
ME
TE
R P
ER
SE
CO
ND
)A
NN
UA
L M
EA
N D
ISC
HA
RG
E(C
UB
IC M
ET
ER
PE
R S
EC
ON
D)
NORMAL DISTRIBUTION NORMAL DISTRIBUTION
100
101
102
2
3
45
7
2
3
4
5
7
C. Rural Streams.--Continued
ISSAQUAH CREEK
Figure 4.—Continued.
Methods for Identifying Hydrologic Trends Associated with Urban Development 23

HYDROLOGIC TRENDS
Although hydrologic trends were identified in each of the four statistics analyzed, trends were not consistent for any of the four streamflow statistics in all streams. Trends in TQmean and Qmax over the entire period of record emerged consistently in urban streams using nonparametric and parametric tests. The nonparametric tests for trends over 10-year periods frequently produced results inconsistent with those for trends for the entire period of record.
Trends Over the Entire Period of Record
Each of the four streamflow statistics exhibited trends in some of the streams. Only TQmean and Qmax consistently exhibited trends in the three urban streams: Leach, Juanita, and Mercer Creeks (fig. 5). Qmax increased significantly (p < 0.001 of no trend) over the entire period of record in all three urban streams using the nonparametric tests and was significantly correlated with population density using the parametric Pearson tests (ρ ranged from 0.28 to 0.52, p < 0.001) (table 3). Qmax also was significantly correlated with population density in Big Beef Creek (ρ = 0.54, p = 0.025). TQmean decreased significantly over time (p < 0.001 of no trend) in Juanita and Mercer Creeks using the nonparametric tests. TQmean was correlated with population density in Juanita Creek (ρ = -0.42, p = 0.043), Mercer Creek (ρ = -0.71, p = 0.043), and Swamp Creek (ρ = -0.53, p = 0.023). Trends in Qmax or TQmean using either parametric or nonparametric tests were not significant in any of the suburban or other rural streams.
Trends in Qmean and Qmin were not consistent for urban, suburban, or rural streams (fig. 5). For urban streams, a significant increase (p < 0.001) in Qmean was detected in Leach Creek but not in Juanita or Mercer Creeks using the nonparametric tests. Qmean was correlated with population density in Leach Creek (ρ = 0.58, p < 0.001). The increase in Qmean for Leach Creek was possibly due to low-flow augmentation or the particularly wet years of 1996, 1997, and 1999, though the higher than average streamflow during those years did not produce significant trends in Qmean in other streams. A significant decrease (p < 0.001) in Qmean was evident in Issaquah Creek using the nonparametric test and Qmean was inversely correlated with population density (ρ = -0.64, p < 0.001). The decrease in Qmean may be associated with the combination of ground-water pumping and wastewater collection in the Issaquah Creek basin. Qmin increased over the entire period of record in Mercer Creek (p < 0.001) and correlated with population density (ρ = 0.73, p < 0.001). In contrast, Qmin decreased over time in Issaquah Creek (p = 0.008) and negatively correlated with population density in Issaquah (ρ = -0.64, p < 0.001) and Newaukum Creeks (ρ = -0.52, p = 0.003).
24 Hydrologic Trends Associated with Urban Development for Selected Streams in the Puget Sound Basin, Western Washington

STREAMFLOW STATISTICS, IN CUBIC METERS PER SECOND
EXPLANATION
Annual mean discharge (Qmean)
Annual maximum discharge (Qmax)
7-day low flow (Qmin)
Fraction of time that mean discharge rate is exceeded (TQmean)
1940 1950 1960 1970 1980 1990 20000
0.1
1
10
100
0
0.1
0.2
0.3
0.4
0.5LEACH CREEK
WATER YEAR
A. Urban Streams
FR
AC
TIO
N O
F Y
EA
R M
EA
N D
ISC
HA
RG
E IS
EX
CE
ED
ED
(TQ
mea
n)
DIS
CH
AR
GE
(C
UB
IC M
ET
ER
PE
R S
EC
ON
D)
Figure 5. Annual values of mean discharge (Qmean), fraction of year mean discharge was exceeded (TQmean), 7-day low flow (Qmin), and maximum discharge (Qmax) relative to land use for selected streams in the Puget Sound Basin, western Washington.
Hydrologic Trends 25

STREAMFLOW STATISTICS, IN CUBIC METERS PER SECOND
EXPLANATION
Annual mean discharge (Qmean)
Annual maximum discharge (Qmax)
7-day low flow (Qmin)
Fraction of time that mean discharge rate is exceeded (TQmean)
1940 1950 1960 1970 1980 1990 20000
0.1
1
10
100
0
0.1
0.2
0.3
0.4
0.5
WATER YEAR
FR
AC
TIO
N O
F Y
EA
R M
EA
N D
ISC
HA
RG
E IS
EX
CE
ED
ED
(TQ
mea
n)
JUANITA CREEK
A. Urban Streams--Continued
DIS
CH
AR
GE
(C
UB
IC M
ET
ER
PE
R S
EC
ON
D)
Figure 5.—Continued.
26 Hydrologic Trends Associated with Urban Development for Selected Streams in the Puget Sound Basin, Western Washington

STREAMFLOW STATISTICS, IN CUBIC METERS PER SECOND
EXPLANATION
Annual mean discharge (Qmean)
Annual maximum discharge (Qmax)
7-day low flow (Qmin)
Fraction of time that mean discharge rate is exceeded (TQmean)
1940 1950 1960 1970 1980 1990 20000
0.1
1
10
100
0
0.1
0.2
0.3
0.4
0.5MERCER CREEK
WATER YEAR
A. Urban Streams--Continued
FR
AC
TIO
N O
F Y
EA
R M
EA
N D
ISC
HA
RG
E IS
EX
CE
ED
ED
(TQ
mea
n)
DIS
CH
AR
GE
(C
UB
IC M
ET
ER
PE
R S
EC
ON
D)
Figure 5.—Continued.
Hydrologic Trends 27

STREAMFLOW STATISTICS, IN CUBIC METERS PER SECOND
EXPLANATION
Annual mean discharge (Qmean)
Annual maximum discharge (Qmax)
7-day low flow (Qmin)
Fraction of time that mean discharge rate is exceeded (TQmean)
1940 1950 1960 1970 1980 1990 20000
0.1
1
10
100
0
0.1
0.2
0.3
0.4
0.5
WATER YEAR
B. Suburban Streams
SWAMP CREEK
FR
AC
TIO
N O
F Y
EA
R M
EA
N D
ISC
HA
RG
E IS
EX
CE
ED
ED
(TQ
mea
n)
DIS
CH
AR
GE
(C
UB
IC M
ET
ER
PE
R S
EC
ON
D)
Figure 5.—Continued.
28 Hydrologic Trends Associated with Urban Development for Selected Streams in the Puget Sound Basin, Western Washington

STREAMFLOW STATISTICS, IN CUBIC METERS PER SECOND
EXPLANATION
Annual mean discharge (Qmean)
Annual maximum discharge (Qmax)
7-day low flow (Qmin)
Fraction of time that mean discharge rate is exceeded (TQmean)
1940 1950 1960 1970 1980 1990 20000
0.1
1
10
100
0
0.1
0.2
0.3
0.4
0.5MAY CREEK
WATER YEAR
B. Suburban Streams--Continued
FR
AC
TIO
N O
F Y
EA
R M
EA
N D
ISC
HA
RG
E IS
EX
CE
ED
ED
(TQ
mea
n)
DIS
CH
AR
GE
(C
UB
IC M
ET
ER
PE
R S
EC
ON
D)
Figure 5.—Continued.
Hydrologic Trends 29

STREAMFLOW STATISTICS, IN CUBIC METERS PER SECOND
EXPLANATION
Annual mean discharge (Qmean)
Annual maximum discharge (Qmax)
7-day low flow (Qmin)
Fraction of time that mean discharge rate is exceeded (TQmean)
1940 1950 1960 1970 1980 1990 20000
0.1
1
10
100
0
0.1
0.2
0.3
0.4
0.5SOOS CREEK
WATER YEAR
B. Suburban Streams--Continued
FR
AC
TIO
N O
F Y
EA
R M
EA
N D
ISC
HA
RG
E IS
EX
CE
ED
ED
(TQ
mea
n)
DIS
CH
AR
GE
(C
UB
IC M
ET
ER
PE
R S
EC
ON
D)
Figure 5.—Continued.
30 Hydrologic Trends Associated with Urban Development for Selected Streams in the Puget Sound Basin, Western Washington

STREAMFLOW STATISTICS, IN CUBIC METERS PER SECOND
EXPLANATION
Annual mean discharge (Qmean)
Annual maximum discharge (Qmax)
7-day low flow (Qmin)
Fraction of time that mean discharge rate is exceeded (TQmean)
1940 1950 1960 1970 1980 1990 20000
0.1
1
10
100
0
0.1
0.2
0.3
0.4
0.5HUGE CREEK
WATER YEAR
C. Rural Streams
FR
AC
TIO
N O
F Y
EA
R M
EA
N D
ISC
HA
RG
E IS
EX
CE
ED
ED
(TQ
mea
n)
DIS
CH
AR
GE
(C
UB
IC M
ET
ER
PE
R S
EC
ON
D)
Figure 5.—Continued.
Hydrologic Trends 31

STREAMFLOW STATISTICS, IN CUBIC METERS PER SECOND
EXPLANATION
Annual mean discharge (Qmean)
Annual maximum discharge (Qmax)
7-day low flow (Qmin)
Fraction of time that mean discharge rate is exceeded (TQmean)
1940 1950 1960 1970 1980 1990 20000
0.1
1
10
100
0
0.1
0.2
0.3
0.4
0.5BIG BEEF CREEK
WATER YEAR
C. Rural Streams--Continued
FR
AC
TIO
N O
F Y
EA
R M
EA
N D
ISC
HA
RG
E IS
EX
CE
ED
ED
(TQ
mea
n)
DIS
CH
AR
GE
(C
UB
IC M
ET
ER
PE
R S
EC
ON
D)
Figure 5.—Continued.
32 Hydrologic Trends Associated with Urban Development for Selected Streams in the Puget Sound Basin, Western Washington

1940 1950 1960 1970 1980 1990 20000.1
1
10
100
0
0.1
0.2
0.3
0.4
0.5NEWAUKUM CREEK
WATER YEAR
C. Rural Streams--Continued
FR
AC
TIO
N O
F Y
EA
R M
EA
N D
ISC
HA
RG
E IS
EX
CE
ED
ED
(TQ
mea
n)
DIS
CH
AR
GE
(C
UB
IC M
ET
ER
PE
R S
EC
ON
D)
STREAMFLOW STATISTICS, IN CUBIC METERS PER SECOND
EXPLANATION
Annual mean discharge (Qmean)
Annual maximum discharge (Qmax)
7-day low flow (Qmin)
Fraction of time that mean discharge rate is exceeded (TQmean)
Figure 5.—Continued.
Hydrologic Trends 33

STREAMFLOW STATISTICS, IN CUBIC METERS PER SECOND
EXPLANATION
Annual mean discharge (Qmean)
Annual maximum discharge (Qmax)
7-day low flow (Qmin)
Fraction of time that mean discharge rate is exceeded (TQmean)
1940 1950 1960 1970 1980 1990 20000.1
1
10
100
1,000
0
0.1
0.2
0.3
0.4
0.5ISSAQUAH CREEK
WATER YEAR
C. Rural Streams--Continued
FR
AC
TIO
N O
F Y
EA
R M
EA
N D
ISC
HA
RG
E IS
EX
CE
ED
ED
(TQ
mea
n)
DIS
CH
AR
GE
(C
UB
IC M
ET
ER
PE
R S
EC
ON
D)
Figure 5.—Continued.
34 Hydrologic Trends Associated with Urban Development for Selected Streams in the Puget Sound Basin, Western Washington

Table 3. Hydrologic trends in streamflow statistics over the entire period of record for 10 selected streams in the Puget Sound Basin, western Washington
[Hydrologic trends in streamflow statistics were evaluated with nonparametric and parametric tests. Kendall’s τ: Nonparametric test of correlation between streamflow statistic and time. Pearson ρ: Parametric test of correlation between streamflow statistic and population density. ns, not significant (probability of no correlation <0.05)]
Land use Stream
Trends in Streamflow Statistics
Mean annual discharge (Qmean)
Fraction of year annual mean
discharge was exceeded (TQmean)
7-day low flow(Qmin)
Log max annual discharge (Log
Qmax)
Kendall's τ
Pearson ρ
Kendall's τ
Pearson ρ
Kendall's τ
Pearson ρ
Kendall's τ
Pearson ρ
Urban Leach Creek 0.4 0.58 ns ns ns ns 0.43 0.52
Juanita Creek ns ns -0.31 -0.42 ns ns 0.48 0.59
Mercer Creek ns 0.27 -0.46 -0.71 0.43 0.73 0.47 0.28
Suburban Swamp Creek ns ns ns -0.53 0.43 ns ns ns
May Creek ns ns ns ns ns ns ns ns
Soos Creek ns ns ns ns ns -0.64 ns ns
Rural Huge Creek ns ns ns ns ns ns ns ns
Big Beef Creek ns ns ns ns ns ns ns 0.54
Newaukum Creek ns ns ns ns -0.27 -0.52 ns ns
Issaquah Creek -0.3 -0.43 ns ns -0.45 -0.64 ns ns
Errors in Long-Term Trend Identification Using Short-Term Period of Records
Trends in streamflow statistics over 10-year periods were compared to trends over the entire period of record for each stream. Results of analyzing 10-year periods for trends frequently diverged from the result of analyzing the entire period of record (table 4). The nonparametric Kendall correlation tests produced lower Type I errors (false positives) but slightly higher Type II errors (false negatives) than the parametric Pearson correlation tests. Thus, neither the nonparametric nor the parametric tests confers a clear advantage for identifying long-term hydrologic trends based on a 10-year period of record. The high rate of Type I errors (90 percent of streams) produced with the Pearson correlation coefficient indicates that a lower significance level than p = 0.05 may be appropriate for identifying long-term trends when using 10-year period of records but as a result, Type II error rate would increase.
Hydrologic Effects of Urban Development
The hydrologic effects of urban development in western Washington are manifested as changes in annual streamflow patterns: in particular, TQmean decreased while Qmax increased in urban streams. These trends represent the redistribution of runoff from stormflow recession and baseflow to stormflow that is a result of urban development. Trends in Qmean and Qmin were not consistent in urban streams and, in fact, trends in these statistics were observed for some suburban and rural streams lacking extensive changes in land use at the scale of a drainage basin over the entire period of record. Although urban development may affect Qmean or Qmin in some streams, relations between development and these statistics were not consistent.
Hydrologic Trends 35

36 Hydrol
Table 4. Error rates for comparisons of trends in streamflow statistics for 10-year periods of record with trends over the entire period of record for each of the 10 selected streams in the Puget Sound Basin, western Washington
[Hydrologic trends in streamflow statistics were evaluated with nonparametric and parametric tests. Kendall’s τ: Nonparametric test of correlation between streamflow statistic and time. Pearson ρ: Parametric test of correlation between streamflow statistic and population density. Type I error: Fraction of streams with a trend over a 10-year period but no trend over the period of record or a trend with the opposite direction. Type II error: Fraction of streams with no trends over 10-year periods but a significant trend over the period of record]
Tests
Error rates for comparisons of trends in streamflow statistics
Fraction of year annual mean discharge was exceeded (TQmean)
7-day low flow (Qmin)Log maximum annual discharge (Log Qmax)
Type I error (false
positive
Type II error (false
negative)
Type I error (false
positive
Type II error (false
negative)
Type I error (false
positive
Type II error (false
negative)
Kendall's τ 0.30 1.00 0.40 0.50 0.10 0.33
Pearson ρ 0.90 0.33 0.90 0.25 0.90 0.25
Although trends were not consistent for any statistic in all 10 of the selected streams in western Washington, trends in Qmin were identified in five streams over the entire periods of record. Trends in Qmin demonstrated the greatest sensitivity to the 10-year period of record selected for analysis with a mix of upward and downward trends occurring over different periods in the same stream. These findings are in general agreement with the results of Lins and Slack (1999) who found decreasing discharge rates at all quantiles from minimum to maximum daily discharge in many, but not all, Pacific Northwest rivers.
Although Qmin was not consistently affected by urban development in the Puget Lowland streams, the increasing trends in Mercer and Swamp Creeks could be responses to urban development as water may be supplied to these basins by interbasin transfers. Likewise, the decreasing trends in Issaquah and Newaukum Creeks may be responses to withdrawal of shallow ground water in these basins. Changes in hydrologic processes, such as infiltration and recharge, resulting from urban development apparently do not have a general influence on annual low flows even as wet-season baseflow is low in urban streams (Konrad, 2000).
TQmean and Qmax appear to be reliable indicators of hydrologic trends resulting from urban development. Although TQmean generally is less variable (annual coefficient of variation ranging from 0.09 to 0.21 for the streams in this analysis) than Qmax (coefficient of variation of 0.26 to 0.63), the relative change in TQmean as a result of urban development is less than the relative change in Qmax. Thus, trends in TQmean resulting from urban development may be less significant than trends in Qmax despite the low annual variability of TQmean. TQmean is a broader measure of streamflow patterns than Qmax and offers a practical advantage when monitoring large numbers of streams that are likely to have brief and synchronous peak discharges. Whereas, Qmax requires accurate measurement or estimation of these peaks, TQmean is less sensitive to the accuracy or the lack of high flow measurements in a continuous record.
Land use or management activities that have a small incremental effect on runoff processes in a stream basin may be difficult to detect given other sources of hydrologic variability. Indeed, trends may be evident only for streams with extensive urban development where the magnitude of the trends are large relative to the variation caused by climatic conditions and where hydrologic data span a relatively long period of time.
ogic Trends Associated with Urban Development for Selected Streams in the Puget Sound Basin, Western Washington

0.25
0.30
0.35
0.40
0.45
0.50
0.25 0.30 0.35 0.40 0.45
FRACTION OF YEAR DAILY MEAN DISCHARGE EXCEEDS ANNUAL MEAN DISCHARGE FOR ISSAQUAH CREEK
FR
AC
TIO
N O
F Y
EA
R D
AIL
Y M
EA
N D
ISC
HA
RG
E E
XC
EE
DS
A
NN
UA
L M
EA
N D
ISC
HA
RG
E F
OR
NE
WA
UK
UM
CR
EE
K
Figure 6. Fraction of year daily mean discharge exceeds annual mean discharge (TQmean) in two rural streams — Issaquah and Newaukum Creeks in the Puget Sound Basin, western Washington, water years 1964-2000.
IMPLICATIONS OF TREND ANALYSIS FOR HYDROLOGIC MONITORING
The analysis of streamflow trends in this investigation holds several implications for monitoring the hydrologic response of drainage basins to urban development and to activities intended to mitigate the hydrologic effects of urban development.
Streamflow records spanning a decade generally are unreliable for identifying trends due to urban development because of background variability in streamflow statistics and the relatively incremental effect of urban development on streamflow patterns at the scale of a decade. Analysis of 10-year periods are likely to show trends in a streamflow statistic even if there is no significant trend over a long period of record for the stream (Type I error). Conversely, a 10-year period may be insufficient for identifying a trend for a longer period (Type II error). The dependency of trend analyses on record length suggests that there are sources of hydrologic variability unrelated to land use that operate over time scales of a year to a decade and
that streamflow patterns may change incrementally in response to land use. As a result, any conclusions about hydrologic trends based on periods of 10 years or less should be tentative and may not apply to periods before or after the period analyzed.
Long periods of record are not available at many streamflow-gaging stations for estimating either previous or current values of TQmean. The feasibility of extending records using a reference station with a long period of record was evaluated by comparing values of TQmean for Newaukum and Issaquah Creeks. Neither basin has had major systematic land-use changes for the period of simultaneous gaging (1964-98) and neither stream had a trend in TQmean over time (table 3). However, annual TQmean was not correlated between Newaukum and Issaquah Creeks (fig. 6). Thus, a short-time series of TQmean from one streamflow-gaging station cannot be extended based on a longer TQmean time series from another gaging station.
Implications of Trend Analysis for Hydrologic Monitoring 37

Nonparametric or parametric tests may be useful for analyzing hydrologic trends. The results of the analyses for the period of record (table 3) generally are similar for nonparametric and parametric tests, though the Pearson correlation coefficient appears to be slightly more sensitive than the Kendall correlation coefficient. The sensitivity of the Pearson correlation coefficient was evident in its consistently high Type I error rate when 10-year trends were compared to trends over the entire period of record.
SUMMARY
Annual streamflow statistics were analyzed for trends in 10 selected streams in western Washington. The statistics, which represented a variety of flow conditions, included mean discharge (Qmean), fraction of year Qmean was exceeded (TQmean), 7-day low flow (Qmin), and maximum discharge (Qmax). TQmean decreased over time in two urban streams. Qmax increased over time in three urban streams and one rural stream. Trends in Qmin were mixed, increasing in one urban stream and one suburban stream and decreasing in one suburban and two rural streams. Qmean increased over time in two urban streams and decreased in one rural stream.
TQmean may offer practical advantages over Qmax for assessing the hydrologic effects of urban development or activities designed to mitigate those effects. The error in TQmean is likely less than that of Qmax, which results from measurement error at high flow. Qmax is often difficult to measure particularly for a group of small urban streams where flood peaks are brief and simultaneous. Moreover, TQmean provides a broader measure of the hydrological changes produced by urban development than Qmax. As a result, TQmean may better indicate ecological consequences of land-use changes.
The analyses of trends in streamflow statistics over 10-year periods in many streams were not consistent with analyses for the entire period of record. Thus, trend tests of any hydrologic statistic using 10 years or less of streamflow record are likely to identify trends not associated with land-use changes and may fail to identify the hydrologic trends produced by urban development that proceed incrementally over periods of more than a decade.
REFERENCES CITED
Allan, J.D., 1995, Stream Ecology: London, Chapman and Hall, 388 p.
Bayley, P.B., and Osborne, L.L., 1993, Natural rehabilitation of stream fish populations in an Illinois catchment: Freshwater Biology, v. 29, p. 295-300.
Booth, P.B., 1990, Stream channel migration following drainage basin urbanization: Water Resources Bulletin, v. 26, no. 3, p. 407-417.
Booth, D.B., 1991, Urbanization and the natural drainage system-impacts, solutions, and prognoses: Northwest Environmental Journal, v. 7, p. 93-118.
Boulton, A.J., Peterson, C.G., Grimm, N.B., and Fisher, S.G., 1992, Stability of an aquatic macroinvertebrate community in a multiyear hydrologic disturbance regime: Ecology, v. 73, no. 6, p. 2192-2207.
Burges, S.J, Wigmosta, M.S., and Meena, J.M., 1998, Hydrologic effects of land-use change in a zero-order catchment: Journal of Hydrologic Engineering, v. 3, no. 2, p. 86-97.
Carter, R.W., 1961, Magnitude and frequency of floods in suburban areas: U.S. Geological Survey Professional Paper 424-B, p. 9-11.
Dinicola, R.S., 1990, Characterization and simulation of rainfall-runoff relations for headwater basins in western King and Snohomish Counties, Washington: U.S. Geological Survey Water-Resources Investigations Report 89-4052, 52 p.
38 Hydrologic Trends Associated with Urban Development for Selected Streams in the Puget Sound Basin, Western Washington

Ebbert, J.C., Embrey, S.S., Black, R.W., Tesoriero, A.J., and Haggland, A.L., 2000, Water quality in the Puget Sound Basin, Washington and British Columbia, 1996-98: U.S. Geological Survey Circular 1216, 31 p.
Ebisemiju, F.S., 1989, The response of headwater stream channels to urbanization in the humid tropics: Hydrological Processes, v. 3, p. 237-253.
Fisher, S.G., Gray L.J., Grimm, N.B., and Busch, D.E., 1982, Temporal succession in a desert stream ecosystem following flash flooding: Ecological Monographs, v. 52, no. 1, p. 93-110.
Hammer, T.R., 1972, Stream channel enlargement due to urbanization: Water Resources Research, v. 8, no. 6, p. 1530-1546.
Harris, E.E., and Rantz, S.E., 1964, Effect of urban growth on stream flow regime of Permanente Creek, Santa Clara County, California: U.S. Geological Survey Water-Supply Paper 1591-B, 18 p.
Helsel, D.R., and Hirsch, R.M., 1993, Statistical methods in water resources: Amsterdam, Elsevier and Co., 529 p.
Hollis, G.E., 1975, The effects of urbanization on floods of different recurrence intervals: Water Resources Research, v. 11, no. 3, p. 431-435.
Horwitz, R.J., 1978, Temporal variability patterns and distributional patterns of stream fishes: Ecological Monographs, v. 48, no. 3, p. 307-321.
James, L.D., 1965, Using a digital computer to estimate the effects of urban development on flood peaks: Water Resources Research, v. 1, no. 2, p. 223-234.
Jones, J.B., Jr., Fisher, S.G., and Grimm, N.B., 1995, Vertical hydrologic exchange and ecosystem metabolism in a Sonoran Desert stream: Ecology, v. 76, no. 3, p. 942-952.
Kimbrough, R.A., Smith, R.R., Rupert, G.P., Wiggins, W.D., Knowles, S.M., and Renslow, V.F., 2001, Water Resources Data, Washington, Water Year 2000: U.S. Geological Survey Water-Data Report WA-00-1, 541 p.
King County, 1991, Hylebos Creek and Lower Puget Sound Basin Plan: Seattle, Department of Public Works, Surface Water Management Division, [about 100 p.].
———2001, Annual Growth Report, Office of Regional Policy and Planning.
Klein, R.D., 1979, Urbanization and stream quality impairment: Water Resources Bulletin, v. 15, no. 4, p. 948-969.
Konrad, C.P., 2000, The frequency and extent of hydrologic disturbances in streams in the Puget Lowland, Washington: Seattle, University of Washington, Ph.D. Dissertation, 212 p.
Ku, H.F.H., Hagelin, N.W., and Buxton, H.T., 1992, Effects of urban storm-runoff control on ground-water recharge in Nassau County, New York: Ground Water, v. 30, no. 4, p. 507-514.
Leopold, L.B, 1968, The hydrologic effects of urban land use: Hydrology for urban land planning — A guidebook of the hydrologic effects of urban land use: U.S. Geological Survey Circular 554, 18 p.
Leopold, L.B., and Maddock T., 1953, The hydraulic geometry of stream channels and some physiographic implications: U.S. Geological Survey Professional Paper 252, 57 p.
Lins, H.F., and Slack, J.R., 1999, Streamflow trends in the United States: Geophysical Research Letters, v. 26, no. 2, p. 227-230.
MathSoft, 2000, S-Plus 2000, professional release 2.
Morgan, J.H., 1936, Flow-duration characteristics of Illinois streams: Transactions of the American Geophysical Union, Part 2, p. 418-426.
Odum, H.T., 1956, Primary production in flowing waters: Liminology and Oceanography, v. 1, no. 1, p. 102-117.
Orser, P.N., and Shure, D.J., 1972, Effects of urbanization on the salamander, Desmognathus fuscus fuscus: Ecology, v. 53, no. 6, p. 1148-1154.
Poff, N.L. and Allan, J.D., 1995, Functional organization of stream fish assemblages in relation to hydrologic variability: Ecology, v. 76, no. 2, p. 606-627.
Poff, N.L., Allan, J.D., Bain, M.B., Karr, J.R., Prestegaard, K.L., Richter, B.D., Sparks, R.E., and Stromberg, J.C., 1997, The natural flow regime: a paradigm for river conservation and restoration: Bioscience, v. 47, no. 11, p. 769-784.
Poff, N.L., and Ward, J.V., 1989, Implications of streamflow variability and predictability for lotic community structure: a regional analysis of streamflow patterns: Canadian Journal of Fisheries and Aquatic Sciences, v. 46, p. 1805-1818.
References Cited 39

Rabeni, C.F., and Wallace, G.S., The influence of flow variation on the ability to evaluate the biological health of headwater streams, in Kovar, K., Tappeiner, U., Peters, N.E., and Craig, R.G., editors, Hydrology, Water Resources and Ecology in Headwaters: International Association of Hydrological Sciences, Publication no. 248, p. 411-418.
Saville, T., and Watson, J.D., 1933, An investigation of the flow-duration characteristics of North Carolina streams: Transactions of the American Geophysical Union, p. 406-425.
Savini, J., and Kammerer, J.C., 1961, Urban growth and the water regime: U.S. Geological Survey Water-Supply Paper 1591-A, 43 p.
Sawyer, R.M., 1963, Effects of urbanization on storm discharge and ground-water recharge in Nassau County, New York: U.S. Geological Survey Professional Paper 475-C, p. C185-C187.
Shelford, V.E. and Eddy, S., 1929, Methods for the study of stream communities: Ecology, v. 10, no. 4, p. 382-391.
Simmons, D.L., and Reynolds, R.J., 1982, Effects of urbanization on baseflow of selected south-shore streams, Long Island, New York: Water Resources Bulletin, v. 18, no. 5, p. 797-805.
Stehr, W.C., and Branson, J.W., 1938, An ecological study of an intermittent stream, Ecology, v. 19, no. 2, p. 294-310.
Vogelmann, J.E., Howard, S.M., Yang, L., Larson, C.R., Wylie, B.K., Van Driel, N., 2001, Completion of the 1990s national land cover data set for the conterminous United States from Landsat Thematic Mapper data and ancillary data sources: Photogrammetric Engineering and Remote Sensing, v. 67, p. 650-652.
Wahl, K.L., 1998, Sensitivity of non-parametric trend analyses to multi-year extremes in Proceedings of the Western Snow Conference: Snowbird, Utah, p. 157-160.
Washington State, 2001, Historical Data Set: Decennial Population counts for the State, counties, and cities, 1890 to 2000: Office of Financial Management. http://www.ofm.wa.gov/pop189090/pop189090toc.htm
Welcomme, R.L., 1979, Fisheries Ecology of Floodplain Rivers: London, Longman, 317 p.
40 Hydrologic Trends Associated with Urban Development for Selected Streams in the Puget Sound Basin, Western Washington

Printed on recycled paper
HYDROLOGIC TRENDS ASSOCIATED W
ITH URBAN DEVELOPM
ENT FOR SELECTED STREAM
S IN
THE PUGET SOUND BASIN
, WESTERN
WASHIN
GTONHYDROLOGIC TREN
DS ASSOCIATED WITH URBAN
DEVELOPMEN
T FOR SELECTED STREAMS
IN THE PUGET SOUN
D BASIN, W
ESTERN W
ASHINGTON
C.P . KONRAD AN
D D.B. BOOTHUSGS W
RIR 02-4040