Embed Size (px)
Citation preview
Jurisdictional
Review of Natural
Gas Distribution
System Expansions
March 31, 2015
Prepared for the
Ontario Energy Board
CONFIDENTIAL
Confidential
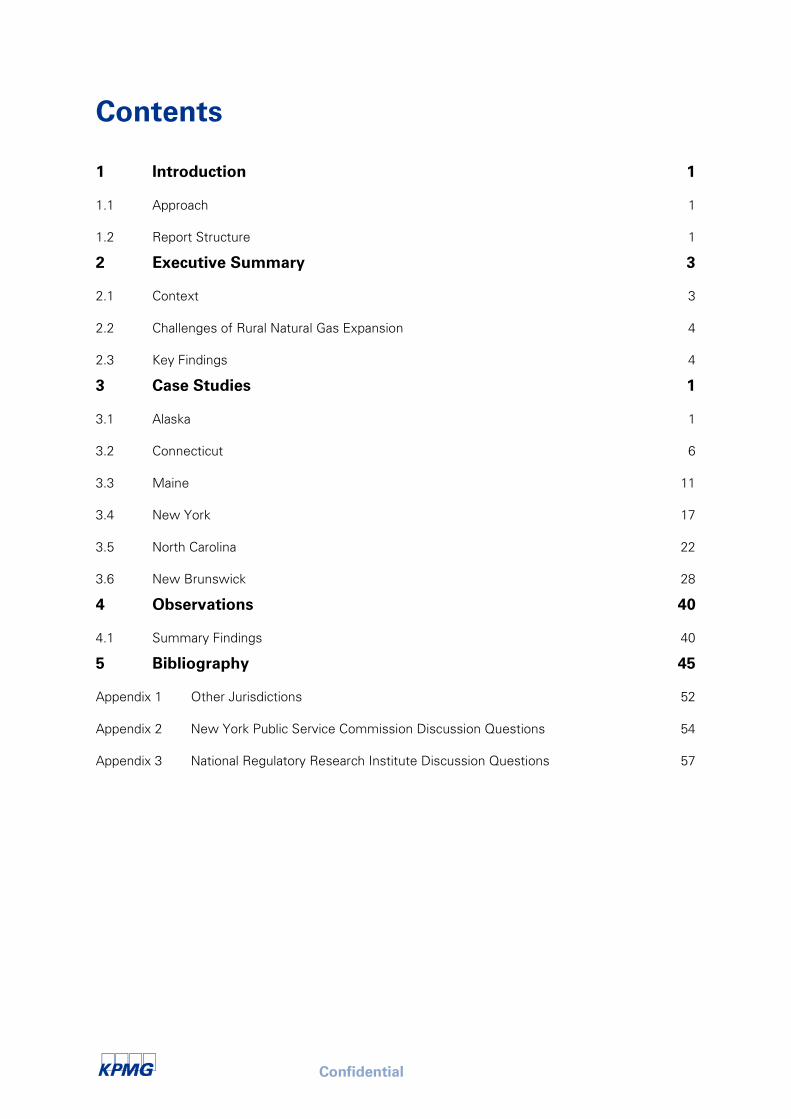
Contents
1 Introduction 1
1.1 Approach 1
1.2 Report Structure 1
2 Executive Summary 3
2.1 Context 3
2.2 Challenges of Rural Natural Gas Expansion 4
2.3 Key Findings 4
3 Case Studies 1
3.1 Alaska 1
3.2 Connecticut 6
3.3 Maine 11
3.4 New York 17
3.5 North Carolina 22
3.6 New Brunswick 28
4 Observations 40
4.1 Summary Findings 40
5 Bibliography 45
Appendix 1 Other Jurisdictions 52
Appendix 2 New York Public Service Commission Discussion Questions 54
Appendix 3 National Regulatory Research Institute Discussion Questions 57
Confidential
1
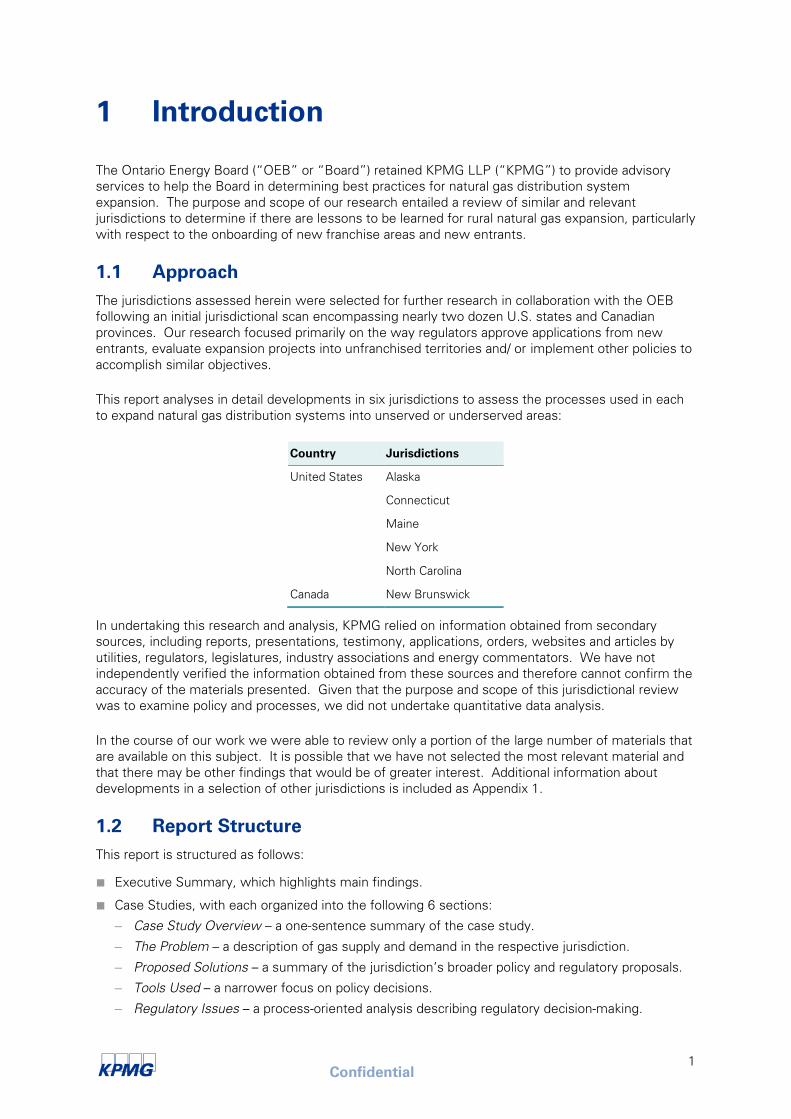
1 Introduction
The Ontario Energy Board (“OEB” or “Board”) retained KPMG LLP (“KPMG”) to provide advisory
services to help the Board in determining best practices for natural gas distribution system
expansion. The purpose and scope of our research entailed a review of similar and relevant
jurisdictions to determine if there are lessons to be learned for rural natural gas expansion, particularly
with respect to the onboarding of new franchise areas and new entrants.
1.1 Approach
The jurisdictions assessed herein were selected for further research in collaboration with the OEB
following an initial jurisdictional scan encompassing nearly two dozen U.S. states and Canadian
provinces. Our research focused primarily on the way regulators approve applications from new
entrants, evaluate expansion projects into unfranchised territories and/ or implement other policies to
accomplish similar objectives.
This report analyses in detail developments in six jurisdictions to assess the processes used in each
to expand natural gas distribution systems into unserved or underserved areas:
Country Jurisdictions
United States Alaska
Connecticut
Maine
New York
North Carolina
Canada New Brunswick
In undertaking this research and analysis, KPMG relied on information obtained from secondary
sources, including reports, presentations, testimony, applications, orders, websites and articles by
utilities, regulators, legislatures, industry associations and energy commentators. We have not
independently verified the information obtained from these sources and therefore cannot confirm the
accuracy of the materials presented. Given that the purpose and scope of this jurisdictional review
was to examine policy and processes, we did not undertake quantitative data analysis.
In the course of our work we were able to review only a portion of the large number of materials that
are available on this subject. It is possible that we have not selected the most relevant material and
that there may be other findings that would be of greater interest. Additional information about
developments in a selection of other jurisdictions is included as Appendix 1.
1.2 Report Structure
This report is structured as follows:
■ Executive Summary, which highlights main findings.
■ Case Studies, with each organized into the following 6 sections:
– Case Study Overview – a one-sentence summary of the case study.
– The Problem – a description of gas supply and demand in the respective jurisdiction.
– Proposed Solutions – a summary of the jurisdiction’s broader policy and regulatory proposals.
– Tools Used – a narrower focus on policy decisions.
– Regulatory Issues – a process-oriented analysis describing regulatory decision-making.

Confidential
2
– Outcomes – a description of any subsequent developments, if known.
■ Observations that elaborate on the Executive Summary.
■ Comparative Tables that provide an overview of the jurisdictional review.
■ Appendix 1, which presents a high-level summary of relevant findings from the initial jurisdictional
scan.
■ Appendix 2, which presents a list of 21 discussion questions issued by the New York State Public
Service Commission in advance of a technical conference it held on natural gas expansion.
■ Appendix 3, which presents a list of 15 discussion questions published by the National Regulatory
Research Institute on issues that utility commissions should consider on natural gas expansion.
Confidential
3
2 Executive Summary
2.1 Context
Approximately 3.5 million homes and businesses in Ontario have access to natural gas.1 However
less than 20 percent of rural residents do.2 Some estimates indicate that there may be 40
communities with populations greater than 500 that could be considered viable candidates for new
gas distribution systems.3 As a result, policymakers and regulators have an interest in evaluating
potential strategies for expanding natural gas service.
On February 18, 2015, the Ontario Energy Board issued a letter to all applicants and potential
applicants with the appropriate financial and technical expertise, giving them the opportunity to
propose plans for natural gas distribution system expansion in Ontario. In the letter, the Board said it
would hear applicants’ requests for regulatory flexibility pertaining to proposed system expansion
projects on matters such as:
■ The potential use of surcharges to improve project feasibility by reducing the level of upfront
capital contribution;
■ The potential allowance for recovery of the revenue requirement associated with expansion costs
in rates prior to the end of any incentive regulation plan term once the assets are used and useful;
and,
■ The potential consideration of individual projects with a “Profitability Index”4 of less than 0.8 and/
or a portfolio of expansion projects with a PI of less than 1.0.
Prior to the Board’s February 2015 letter, the Province of Ontario had indicated in its Long-Term
Energy Plan and in mandate letters to related ministers a potential for government assistance in
facilitating natural gas distribution system expansions.5 These proposals included the potential
creation of:
■ “Natural Gas Access Loans” – totalling $200 million over 2 years to help communities partner
with utilities to extend access to natural gas supplies; and,
1 This figure includes residential, commercial and industrial consumers. Source: Ontario. Ministry of Energy. Achieving
Balance: Ontario’s Long-Term Energy Plan. Toronto: Ministry of Energy, 2013. Web. March 2015.
2 The Ontario Federation of Agriculture estimates there are 500,000 rural families and 30,000 farms and small businesses in
Ontario that would benefit from access to natural gas. Sources: Ontario Federation of Agriculture. “Turning up the Heat for
Natural Gas Expansion in Rural Ontario.” News. Ontario Federation of Agriculture, 2013. Web. March 2015; and Ontario
Federation of Agriculture. “Natural Gas Infrastructure.” Issues. Ontario Federation of Agriculture, 2015. Web. March 2015.
3 Examples include Kincardine, Milverton, Bancroft and Marathon. Source: Union Gas. Ontario’s Economic Renaissance
Fuelled by Natural Gas. Union Gas, 2013. Web. March 2015.
4 The Profitability Index (“PI”) is a net present value calculation that the Ontario Energy Board uses to evaluate whether
proposed natural gas distribution expansion projects will shield existing customers from the additional costs of system
expansion. A PI of 1.0 indicates that over the life of the portfolio of projects, the additional customers connected to the
existing system will pay the entire costs of the expansion. The PI can be evaluated through rates and/ or an upfront capital
contribution. The PI test specifies that any one individual expansion project within a portfolio must meet a PI of 0.8, which is
intended to prevent cross-subsidization within a portfolio. Source: Ontario. Ontario Energy Board. E.B.O. 188. Final Report on
Natural Gas Distribution System Expansion and Appendix B Guidelines. Ontario Energy Board, 30 January 1998. Web. March
2015.
5 Ontario. Ministry of Economic Development, Employment and Infrastructure. Mandate Letter. Ministry of Economic
Development, Employment and Infrastructure, 25 September 2014. Web. March 2015.
Confidential
4
■ “Natural Gas Economic Development Grants” – in the amount of $30 million to help fund
economic development projects.
These recent initiatives in Ontario make it a timely point to review the experiences of other
jurisdictions.
2.2 Challenges of Rural Natural Gas Expansion
There are a number of reasons that could potentially explain why a region remains unserved, why a
franchise area does not exist or why new entrants have refrained from entering an otherwise
established gas distribution market. These reasons may include:
■ Regional transmission pipeline constraints;
■ Substantial upfront costs associated with fuel-switching, such as equipment replacement;
■ Difficulties in accurately forecasting household conversions, such as in areas where electric
baseboard heating must be replaced at high cost;
■ Topographical challenges, such as rocky, mountainous, coastal or far-northern terrain;
■ Unfavourable local economic conditions, including (but not limited to) low customer density, sub-
median per capita income and/ or a declining population;
■ Regulatory prohibitions on utility cross-subsidization through rates; and,
■ Regulatory economic tests that do not provide the flexibility needed to take a long-term view or
manage additions on a portfolio basis.
2.3 Key Findings
■ No jurisdiction we evaluated was prepared to deviate significantly from the practice of using an
economic test – based on a net present value calculation or similar metric – for determining
whether a proposed expansion project should be approved.
■ We did not observe an explicit preference in the jurisdictions examined for inviting new entrants,
creating new service territories or using municipally-based systems to address a lack of service in
rural areas.
■ Decision-makers were generally not willing to broadly socialize the costs associated with
extending service to areas that did not pass the economic test over the existing natural gas
distribution grid and existing natural gas distribution customers.
■ There was an emphasis across jurisdictions on identifying and prioritizing industrial, commercial or
institutional anchor loads.
■ With the exception of North Carolina, where certain refunds/ monies were made available to
natural gas distributors from the upstream transportation sector, none of the jurisdictions we
examined were willing to impose a surcharge or subsidy on the commodity cost of natural gas to
fund system expansions.
■ To facilitate expansion efforts, regulators experimented with time-limited, project-specific
innovations that demonstrated flexibility with respect to a number of factors.
■ With the exception of the major greenfield development in New Brunswick, we did not observe
an extensive use of deferral and variance accounts to postpone the recovery of costs associated
with natural gas system expansions
Confidential
1
3 Case Studies
3.1 Alaska
3.1.1 Case Study Overview
This case study examines Alaska’s efforts to expand natural gas distribution service to remote
communities in the state’s interior.
3.1.2 Problem
Among U.S. states, only Texas produces more natural gas than Alaska. Yet despite this abundant
local supply, many of the state’s residents lack access to natural gas distribution service because the
gas is used instead at well sites for oil extraction or to fuel the state’s electricity generation.6 This is
a problem because Alaska’s residents consume significant amounts of energy to heat their homes.
Only Wyoming and Louisiana consume more energy on a per-capita basis than Alaska.7 As a result,
household energy bills are “extremely high.”8 In fact, Fairbanks – the state’s second biggest city –
has some of the highest residential energy costs of any city in the United States.9
Figure 1: Location of Fairbanks, Alaska
Source: Google
6 U.S. Energy Information Administration. “Profile Analysis.” State Profile and Energy Estimates: Alaska. U.S. Department of
Energy, 19 June 2014. Web. March 2015.
7 Ibid.
8 The predominant energy source in Fairbanks is fuel oil. Source: Alaska Industrial Development and Export Authority. Alaska
Interior Energy Plan. Alaska Industrial Development and Export Authority, 22 February 2013. Web. March 2015. Pg. 2.
9 Alaska Industrial Development and Export Authority. Interior Energy Project. Alaska Industrial Development and Export
Authority, 19 February 2015. Web. March 2015.
Confidential
2
3.1.3 Proposed Solutions
In 2012, then-Governor Sean Parnell proposed the Interior Energy Plan, which is also commonly
referred to as the Interior Energy Project. The Interior Energy Plan was a major proposal to lower
energy bills quickly and to improve the region’s air quality. As Governor Parnell described it in his
2013 State of the State Address:
“To keep the state of our state strong, let us choose a future of affordable and
abundant energy. Despite all our energy sources, energy costs remain a huge
burden on Alaskans. That needs to change. That's why we developed the Interior
Energy Plan, a strategy that includes low-interest loans, gas storage tax credits and
cash for a moveable gas liquefaction plant and distribution system… It will slash
energy costs for homes and businesses.”10
The underlying supply components supporting the Interior Energy Plan were:
■ Natural gas sourced from Alaska’s North Slope, the state’s vast oil- and gas-rich area along its
northern, Arctic coastline;
■ Gas liquefied at a new North Slope LNG plant;
■ LNG trucked south to Fairbanks;
■ A new regasification and storage plant in Fairbanks; and,
■ Local distribution system expansion in the interior communities of Fairbanks and North Pole.
3.1.4 Tools Used
The Interior Energy Plan was implemented using two tools:
■ A state financing plan; and,
■ The creation of a new municipally-owned utility in the Fairbanks area.
3.1.4.1 State Financing Plan
In 2013, the Alaska State Legislature approved a comprehensive financing package for the Interior
Energy Plan.11
Financing came from a few sources:12
■ $150 million USD in loans for expanding the local distribution system;
■ $125 million USD in loans for the North Slope LNG plant;
■ $57.5 million USD in grant funding “to directly reduce the cost of LNG”;13
and,
■ $30 million USD in existing tax credits ($15 million USD per qualifying LNG storage tank).14
10 Governor Sean Parnell. 2013 State of the State Address. State of Alaska, 16 January 2013. Web. March 2015.
11 Alaska. Legislature. Senate. An Act Relating to development project financing by the Alaska Industrial Development and
Export Authority… (SB 23) 2013 Reg. Sess. (12 April 2013) Alaska State Legislature. Web. March 2015.
12 These are the figures as they appeared in the Regulatory Commission of Alaska’s order granting Interior Alaska Natural Gas
Utility a certificate of public convenience and necessity. Source: Regulatory Commission of Alaska. Docket: U-13-103. Order
Denying Application of Fairbanks Natural Gas, LLC To Amend Certificate of Public Convenience and Necessity and Granting,
With Condition, Application of Interior Alaska Natural Gas Utility for Certificate of Public Convenience and Necessity. Order No.
19. (Dated and Effective 20 December 2013). Web. March 2015.
13 AIDEA, 2013. Pg. 3.
14 In 2010, Alaska implemented natural gas storage tax credits equal to $1.50 USD per thousand cubic feet of "working gas"
storage capacity, up to the lesser of $15 million USD or 25 percent of the costs incurred to establish gas storage facility.
These credits may be used to offset up to 100 percent of corporate income tax liability. Sources: Bill White. “Guide to Alaska
natural gas projects.” Alaska Natural Gas Transportation Projects. Office of the Federal Coordinator, 21 January 2015. Web.
Confidential
3
Included in the legislation is an increase in the bonding authority of an existing state agency designed
to finance the expansion plans and an interest rate cap of three percent charged to any project
financed from the revolving fund established by the financing plan.
3.1.4.2 Creation of New Municipally-Owned Utility
In anticipation of the Interior Energy Plan’s development in and around Fairbanks, two utilities applied
to the Regulatory Commission of Alaska (“RCA” or “Commission”) for authorization to supply natural
gas service to the new service territory:
■ Fairbanks Natural Gas, LLC (“FNG”), wholly owned by Pentex Alaska Natural Gas Company LLC
(“Pentex”). Pentex owns three companies in Alaska involved in natural gas transportation and
distribution services, but is itself headquartered in Texas and owned by a collection of investment
funds headquartered in Minnesota; and,
■ Interior Alaska Natural Gas Utility (“IANGU” or “IGU”), a newly formed, public corporation wholly
owned by Fairbanks North Star Borough (“FNSB”). FNSB is an upper municipality (the functional
equivalent of a county) that includes both the City of Fairbanks and the City of North Pole, which is
on the outskirts of Fairbanks.
FNG had served the densely-populated areas of downtown Fairbanks since 1998 and, as of the time
of the Interior Energy Plan, had approximately 1,100 customers. Its natural gas is sourced in the form
of LNG from Cook Inlet to the south and trucked to Fairbanks where it is vaporized and distributed
through FNG’s distribution system. FNG expanded in 1999 and 2005, but subsequent expansion
plans were delayed due to uncertainty around future LNG supplies from Cook Inlet. With the
prospects of new LNG supplies sourced from Alaska’s North Slope and a new regasification and
storage plant in Fairbanks, FNG applied to the RCA to amend its Certificate of Public Convenience
and Necessity (“CPCN” or “certificate”) to expand its service territory.
Concurrent to FNG’s filing, IGU was a new entrant that filed for a certificate to service the areas
surrounding FNG’s territory. It was formed when the two cities within FNSB (i.e., Fairbanks and
North Pole) voted to transfer their utility powers to the Borough. While municipally-owned utilities
are exempt from regulation in Alaska, they do need to apply to the Commission for their initial
CPCN.15
For reasons discussed in the next section, the Regulatory Commission of Alaska denied FNG’s
application and granted IGU the new franchise and service territory. From our own review of the
applications’ details, it appears that the two proposals offered comparable economics but that IGU
committed to a more aggressive expansion program and could offer to finance the expansion without
the need for a return on equity. The data in the application indicate:
Entity Customers Rate Base per
Customer Sales (MCF) Tariff per MCF
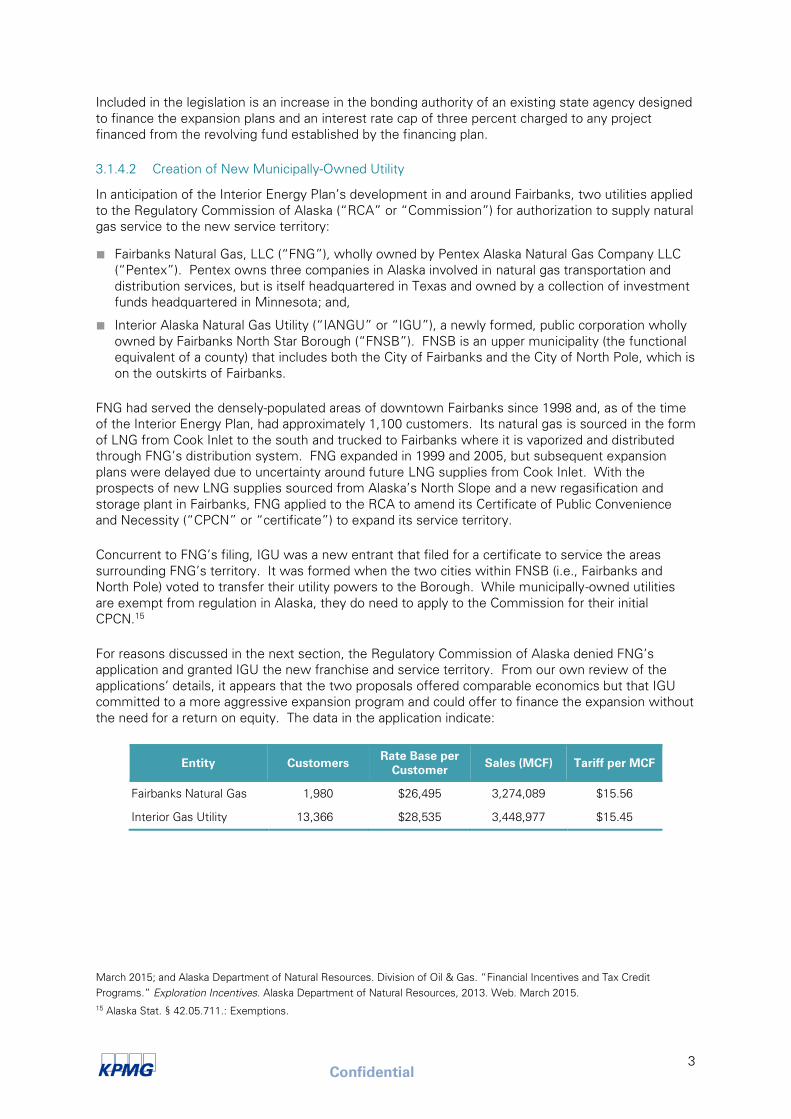
Fairbanks Natural Gas 1,980 $26,495 3,274,089 $15.56
Interior Gas Utility 13,366 $28,535 3,448,977 $15.45
March 2015; and Alaska Department of Natural Resources. Division of Oil & Gas. “Financial Incentives and Tax Credit
Programs.” Exploration Incentives. Alaska Department of Natural Resources, 2013. Web. March 2015.
15 Alaska Stat. § 42.05.711.: Exemptions.
Confidential
4
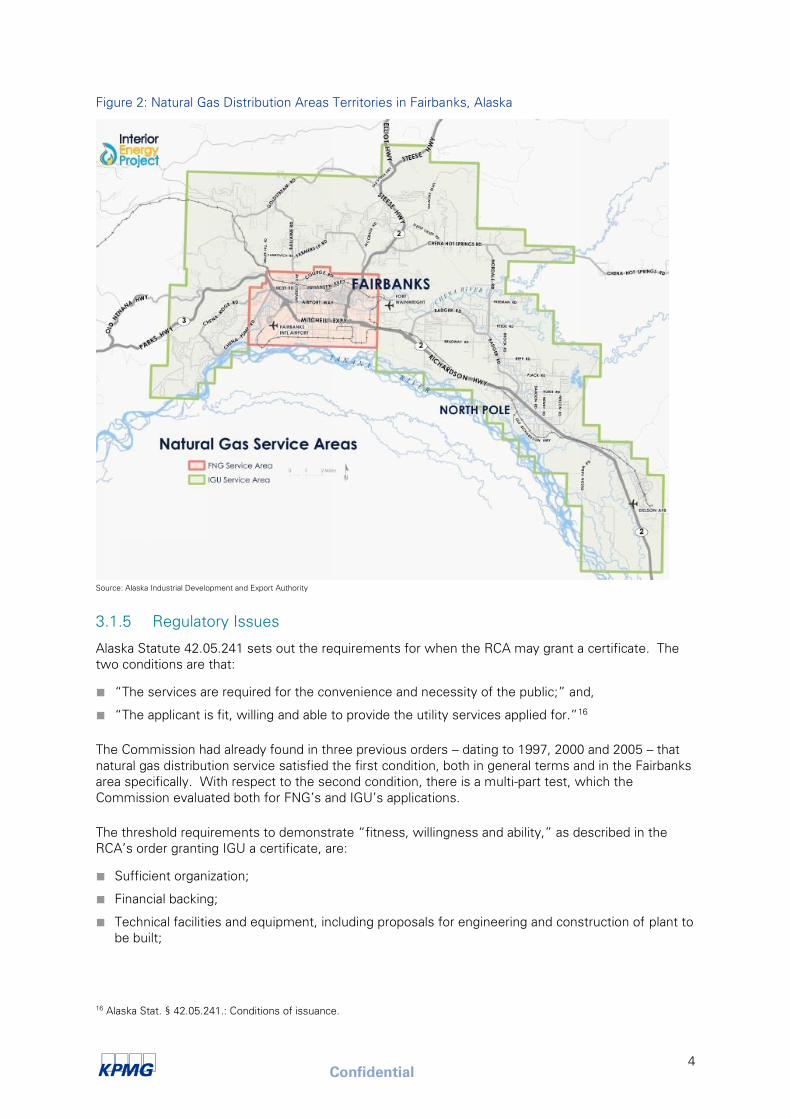
Figure 2: Natural Gas Distribution Areas Territories in Fairbanks, Alaska
Source: Alaska Industrial Development and Export Authority
3.1.5 Regulatory Issues
Alaska Statute 42.05.241 sets out the requirements for when the RCA may grant a certificate. The
two conditions are that:
■ “The services are required for the convenience and necessity of the public;” and,
■ “The applicant is fit, willing and able to provide the utility services applied for.”16
The Commission had already found in three previous orders – dating to 1997, 2000 and 2005 – that
natural gas distribution service satisfied the first condition, both in general terms and in the Fairbanks
area specifically. With respect to the second condition, there is a multi-part test, which the
Commission evaluated both for FNG’s and IGU’s applications.
The threshold requirements to demonstrate “fitness, willingness and ability,” as described in the
RCA’s order granting IGU a certificate, are:
■ Sufficient organization;
■ Financial backing;
■ Technical facilities and equipment, including proposals for engineering and construction of plant to
be built;
16 Alaska Stat. § 42.05.241.: Conditions of issuance.
Confidential
5
■ Operations expertise; and,
■ Management and administrative experience.
The Commission found that FNG failed to demonstrate it had a viable expansion plan for the
proposed new area, which resulted in its application to expand its service territory to be denied.
Specifically the Commission was skeptical of FNG’s ability to guarantee the industrial load that its
expansion plan was based upon.
Conversely IGU had advantages in a few categories. In addition to relying on the state financial
assistance as part of the Interior Energy Plan, IGU was backed by:
■ The resources of the Borough;
■ Its ability to raise taxes; and,
■ Its ability to issue bonds.
The Commission wrote:
“IANGU has access to intra-agency loans from the FNSB, has access to tax-exempt
financing such as revenue and general obligation bonds, has income and property tax
exempt status, and has the ability to qualify for state and federal loan and grant
programs. IANGU presented testimony that it has an advantage over an investor-
owned utility in accessing low cost debt and grant financing.”17
In support of its application, IGU also submitted a six-year build-out plan to achieve 80 percent
saturation within the franchise area by 2021, a peer-reviewed design and a commitment to reinvest
any profits back into the infrastructure.
As a result, the Commission found that IGU “demonstrated sufficient levels of fitness, willingness
and ability… to provide natural gas utility service in the FNSB,” while FNG “failed to demonstrate a
threshold level of fitness, willingness and ability sufficient for expansion of its service area.”18
The Commission’s ruling against FNG, as noted above, came down to the inadequacy of FNG’s
proposed expansion plan, and not because it lacked sufficient financial backing or technical expertise.
The Commission explained:
“We make no negative finding in these proceedings regarding FNG’s continued
fitness, willingness and ability to provide service in its existing certificated area. We
note that there is a significant customer base available for FNG to expand service
within its existing certificated area, and we expect FNG to do so as gas becomes
available.”19
IGU’s certificate came with only one condition. Security of supply was important to the Commission,
and IGU is required to maintain a five-day supply of LNG in storage – a condition that also applied to
FNG’s existing certificate.
3.1.6 Outcomes
IGU’s application projected that it would serve:
■ 1,403 customers by the end of calendar year 2017; and,
17 Regulatory Commission of Alaska. Order No. 19. Pg. 24.
18 Ibid. Pg. 27.
19 Ibid. Pg. 19.
Confidential
6
■ 13,336 customers by the end of calendar year 2021.
However, there have been two significant developments since the creation of the Interior Alaska
Natural Gas Utility:
■ As of today, the supply of LNG from the North Slope is in doubt. Due to escalating costs, the
private-sector contractor that would have transported LNG to Fairbanks via trucking was unable to
proceed with the contract. Alaska ended its formal agreement with the partner company and is
currently reviewing options, such as using the state-owned railroad to transport the gas instead.
■ To speed the transition to natural gas, the State of Alaska is considering buying Fairbanks Natural
Gas through its state economic development agency, the Alaska Industrial Development and
Export Authority (“AIDEA”). Due diligence is underway.20
3.2 Connecticut
3.2.1 Case Study Overview
This case study examines Connecticut’s recent policy proposals to expand natural gas distribution
service to reach the state’s rural communities.
3.2.2 Problem
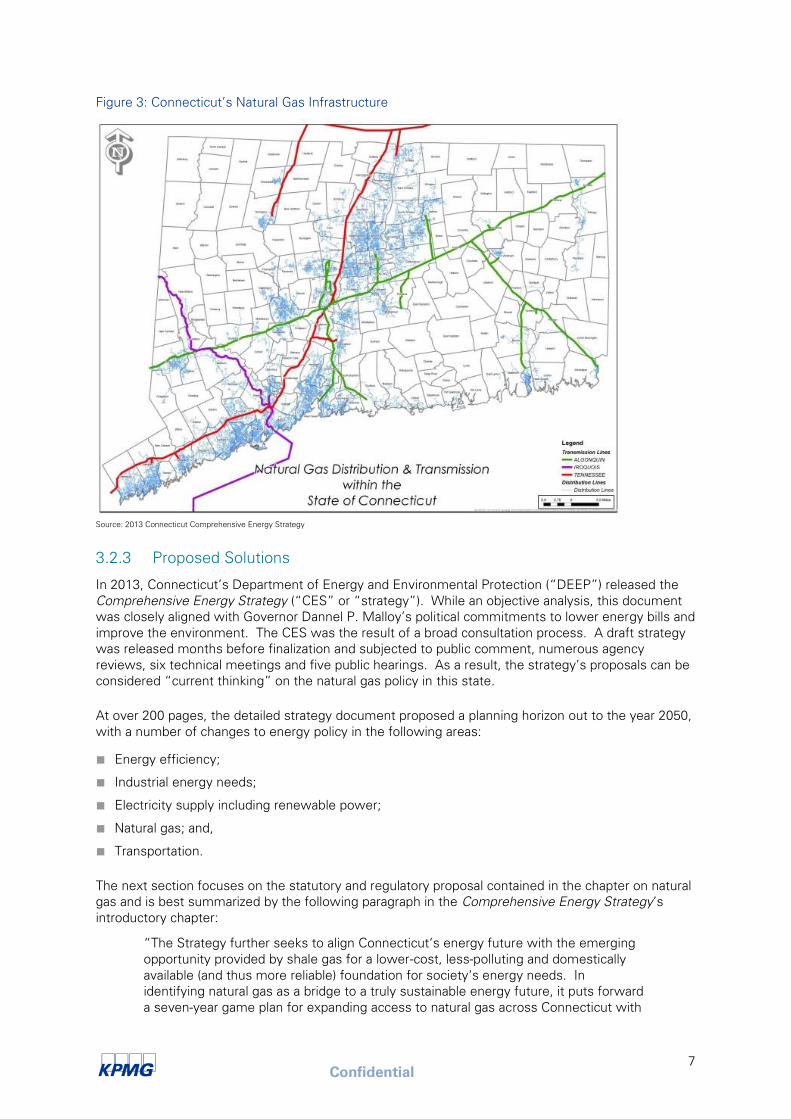
Unlike in neighbouring Massachusetts and Rhode Island where nearly half of all households use
natural gas for space heating, less than a third do so in Connecticut.21
The state’s gas infrastructure
currently leaves many rural communities far from transmission and distribution mains, and even in
areas where gas mains exist, approximately 216,000 residential and commercial customers22
have
not converted – despite the fact their hook-up costs would be covered by LDCs.23
An additional
89,000 “off-main” customers would require 900 miles of new mains to reach. For these households
and businesses, Connecticut’s Department of Energy and Environmental Protection estimates it
would cost $1.44 billion USD to provide distribution infrastructure to all of them (broken down as
$512 million USD for service and meters and $926 million USD for gas main extensions). (These
figures imply average costs of $16,160 per customer for the off-main group.) To add to these costs –
for a state with just over 3.5 million people – an additional $1.16 billion USD would be required for
residential or commercial equipment conversion.24
Similar to other states in New England, Connecticut has no in-state sources of natural gas, relying on
interstate pipelines for supply instead. This has led to concerns about supply, especially in cold
winter months, as the state has been increasing the share of natural gas used for electricity
generation.25
20 Dermot Cole. “State agency to purchase Fairbanks natural gas utility.” Alaska Dispatch News, 28 January 2015. Web. March
2015.
21 Connecticut. Department of Energy and Environmental Protection. 2013 Comprehensive Energy Strategy for Connecticut.
Department of Energy and Environmental Protection, 19 February 2013. Web. March 2015.
22 Ibid.
23 Connecticut’s three gas LDCs are Connecticut Natural Gas Corporation, The Southern Connecticut Gas Company and
Yankee Gas Services Company.
24 All monetary figures attributable to the Comprehensive Energy Strategy. Population estimate from United States Census
Bureau.
25 U.S. Energy Information Administration. “Profile Analysis.” State Profile and Energy Estimates: Connecticut. U.S.
Department of Energy, 18 December 2013. Web. March 2015.
Confidential
7
Figure 3: Connecticut’s Natural Gas Infrastructure
Source: 2013 Connecticut Comprehensive Energy Strategy
3.2.3 Proposed Solutions
In 2013, Connecticut’s Department of Energy and Environmental Protection (“DEEP”) released the
Comprehensive Energy Strategy (“CES” or “strategy”). While an objective analysis, this document
was closely aligned with Governor Dannel P. Malloy’s political commitments to lower energy bills and
improve the environment. The CES was the result of a broad consultation process. A draft strategy
was released months before finalization and subjected to public comment, numerous agency
reviews, six technical meetings and five public hearings. As a result, the strategy’s proposals can be
considered “current thinking” on the natural gas policy in this state.
At over 200 pages, the detailed strategy document proposed a planning horizon out to the year 2050,
with a number of changes to energy policy in the following areas:
■ Energy efficiency;
■ Industrial energy needs;
■ Electricity supply including renewable power;
■ Natural gas; and,
■ Transportation.
The next section focuses on the statutory and regulatory proposal contained in the chapter on natural
gas and is best summarized by the following paragraph in the Comprehensive Energy Strategy’s
introductory chapter:
“The Strategy further seeks to align Connecticut‘s energy future with the emerging
opportunity provided by shale gas for a lower-cost, less-polluting and domestically
available (and thus more reliable) foundation for society‘s energy needs. In
identifying natural gas as a bridge to a truly sustainable energy future, it puts forward
a seven-year game plan for expanding access to natural gas across Connecticut with
Confidential
8
a goal of providing nearly 300,000 [additional] Connecticut homes, businesses and
other facilities with an energy choice that includes natural gas.”26
In several places throughout the CES, it is emphasized that the state legislature, DEEP, the Public
Utilities Regulatory Authority (“PURA”) and other state agencies are to use the strategy’s priorities
and proposals to guide future decision making.
3.2.4 Tools Used
This section describes the detailed recommendations outlined in the Comprehensive Energy
Strategy. While the CES has a planning horizon out to 2050, the natural gas expansion planning
horizon was intended to take place over the seven years following the strategy’s release. The most
relevant policy proposals to expanding distribution services to unserved and underserved areas are27
:
■ Establish a planning process for natural gas expansion;
■ Raise customer awareness of the opportunities for fuel-switching through marketing;
■ Make energy efficiency investments and fuel-switching affordable through financing and
incentives for choosing the most energy efficient technology;
■ Enact regulatory changes to broaden the reach of financing options that utilities may provide and
update Connecticut’s regulatory accounting processes; and,
■ Coordinate and streamline permitting and siting processes for building underground infrastructure.
3.2.4.1 Establish a planning process for natural gas expansion
The strategy recommends that Connecticut’s three LDCs be required to submit annual expansion
plans that track a number of elements, including:
■ Customer conversion plans and schedules that outline which customers in their service
territory are targeted that year for conversion, sub-divided into a number of categories like on-main
and off-main, and residential, commercial and industrial, etc. Further, these plans should target
anchor loads and assess their respective economic development potential, as well as target
residential areas where customer conversion is likely to be high – such as newer developments or
prior expressions of consumer interest;
■ Feasibility analysis that includes estimated capital budgets, assessment of market conditions
(e.g., gas-to-oil spread) and cost/ benefit analysis;
■ Outreach and marketing efforts to gauge customer awareness;
■ Assessment of pipeline supply capacity to ensure reliability;
■ Financing mechanisms that could be leveraged to finance capital and operational expenditures;
■ Cost-reduction strategies that demonstrate the LDCs have taken into account measures to
reduce the cost of expansion (e.g., targeting whole neighbourhoods at once, dedicating specific
crews for main extensions, streamlining permitting and siting, etc.); and,
■ Regulatory proposals that the LDCs recommend for the Public Utilities Regulatory Authority’s
consideration, to help each LDC implement its plans.
26 DEEP, 2013. Pg. ii.
27 An additional set of recommendations in the CES were targeted at those Connecticut households and businesses where
fuel-switching to natural gas is not considered feasible at this time, in that projected savings under current prices could not be
made to cover the costs of conversion/ expansion. Those additional recommendations were primarily aimed at energy
efficiency issues, such as more efficient oil and propane furnaces, solar thermal water heating, ground source heat pumps,
mandating low-sulfur heating oil, among other proposals.
Confidential
9
3.2.4.2 Raise customer awareness of the opportunities for fuel-switching through marketing
The CES estimates that a “robust marketing effort” by Connecticut’s three LDCs would cost
approximately $1.5 million USD to $2 million USD a year. The strategy proposes that each utility
seek to increase customer awareness in its service area about the cost savings from fuel-switching,
the importance of planning ahead (as opposed to waiting until a furnace must be replaced) and the
ability to reduce individual household costs by aggregating fuel-switching with neighbours or a local
anchor load.
3.2.4.3 Make energy efficiency investments and fuel-switching affordable through financing and
incentives for choosing the most energy efficient technology
An issue common to the challenge of converting customers to natural gas is the oftentimes high
upfront costs of conversions – both to extend service lines to residences and to replace existing,
functioning equipment. Even if customers fully understand the benefits of natural gas and would like
to convert, they may simply be unable to afford to pay these costs.
The CES puts forward several proposals to address this issue:
■ Loan programs for high efficiency heating and domestic hot water systems, delivered through
participating banks and credit unions and potentially with state support in the form of a subsidy;
■ On-bill financing programs delivered through participating gas companies;
■ For particularly high-cost conversions, the strategy calls on LDCs to include in their annual
expansion plans proposals on how to offer lower interest financing28
to specific sets of off-main
consumers; and,
■ Direct incentives (e.g., time-limited tax credits or program spending) to encourage off-main
households or businesses to convert.
3.2.4.4 Enact regulatory changes to broaden the reach of financing options utilities may provide and
update Connecticut’s regulatory accounting processes
These proposals are discussed in more detail in Section 3.4.5: Regulatory Issues below.
3.2.4.5 Coordinate and streamline permitting and siting processes for building underground
infrastructure
In 2012, legislators in Connecticut passed a law that, among other things, required municipalities and
the Department of Transportation to notify the Public Utilities Regulatory Authority about pending
construction projects on public highways so that PURA could in turn notify utilities of opportunities to
install underground infrastructure (e.g., gas lines, water mains, sewers, etc.). The strategy calls for
LDCs to seek to align their expansion projects along these corridors when possible. According to the
CES, installing gas mains at the same time road construction is already underway can lead to savings
of 20 percent, for example, by sharing the cost of excavation and paving.
To avoid bottlenecks in the permitting, siting and inspections of future gas expansions – which could
be expected during the proposed 7-year build-out period – the strategy proposes a generic approvals
process, standardizing the application process and bulk procurement where feasible.
28 The CES does not provide more detail on this proposal, saying instead “Because there is a wide difference in conversion
economics and in the assumptions created by various policy underpinnings, it is essential to evaluate expansion options in
detail by sub-segment and geographic location as well as under various policy refinements.” DEEP, 2013. Pg. 151.
Confidential
10
3.2.5 Regulatory Issues
Connecticut’s Comprehensive Energy Strategy proposes the following regulatory changes:
■ Change the “hurdle rate test” to reduce the upfront customer charge for main extensions;
■ Alternative rate riders to assist customers in paying for main extension costs – e.g., contributions
in aid of construction (“CIAC”) – over time as opposed to an upfront payment;
■ Allow greater flexibility when calculating customers’ main extension costs; and,
■ Establish a mechanism for the timely recovery of capital expenditures made by gas companies.
3.2.5.1 Hurdle Rate Test
Similar to many jurisdictions, Connecticut uses a regulatory mechanism called “the hurdle rate test”
to determine whether the costs associated with connecting new customers will be sufficiently
covered by the expected future increases in revenue from adding those additional customers. The
purpose of this calculation is to ensure gas companies pursue customers that will be cost effective.
As of the 2013 strategy, the “payback period” used by PURA to calculate the hurdle rate test ranged
from 15 years for one LDC to 20 years for the other two. The CES proposed to extend the payback
period to 25 years for all three LDCs, noting that one LDC in Massachusetts is even permitted to use
33 years for residential customers. According to DEEP estimates, this one regulatory adjustment
(from 15 years to 25 years) could reduce off-main consumers’ CIACs by 40 percent. Similarly,
commercial and industrial consumers would see substantial benefits.
3.2.5.2 Alternative Rate Riders
One of the most significant costs of conversion for residents that live far from distribution mains is
the upfront contribution in aid of construction. Implementing these charges is also time-consuming
and carries a cost for LDCs to administer, as CIACs must be calculated for each individual residence.
As an alternative to this approach, the strategy recommends that PURA consider spreading these
costs over time by “setting rates generically for customers that require a CIAC payment based on
similar characteristics such as usage and distance from the main.”29
In this way, similar customers
would be pooled together, with CIAC costs potentially spread among a larger group. The CES does
not go into detail about how this might be made to work, except to acknowledge that it might require
PURA to revise or rescind previous orders.
3.2.5.3 Greater Flexibility Calculating Customers’ Main Extension Costs
LDCs in Connecticut are currently permitted to include revenue projections in hurdle rate tests only if
there is a firm customer commitment to convert to natural gas. This makes project planning
unnecessarily complex, as a project’s profitability must be recalculated whenever additional
customers sign up or previously committed customers fall through. The strategy recommends
providing LDCs with the flexibility to make reasonable projections about future customer conversions
and include these revenues in their hurdle rate calculations. As this flexibility would entail a greater
element of risk, the effect of this change could be monitored over time and adjusted. The also CES
recommends moving toward a portfolio view that allows LDCs to group projects together.
3.2.5.4 Mechanism for Timely Recovery of Capital Expenditures
The CES proposes using a new mechanism for LDCs to recover costs associated with gas main
extensions in a timely way without proceeding to a full rate hearing, though there is not much detail
in the strategy’s text as to what this would entail. Instead, the Public Utilities Regulatory Authority is
simply asked to study it further.
29 DEEP, 2013. Pg. 152.
Confidential
11
3.2.6 Outcomes
Subsequent to the release of the Comprehensive Energy Plan, Connecticut’s three gas LDCs
submitted to PURA a joint, detailed expansion plan.30
While Connecticut may achieve its goal of providing half the state’s residences (and three quarters of
commercial and industrial customers) access to natural gas, the other half of the state is,
unfortunately, considered to provide “unlikely prospects for conversion,” with locations too remote
to ever recoup costs from energy bill savings under current assumptions and projections.31
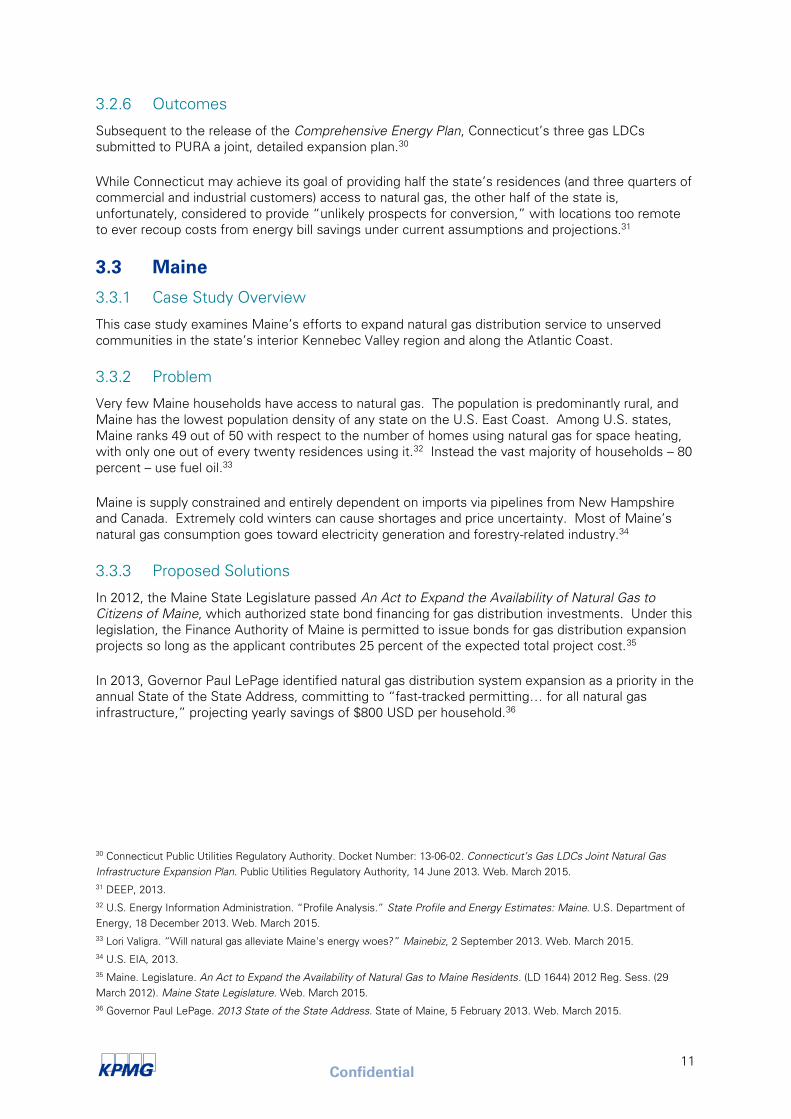
3.3 Maine
3.3.1 Case Study Overview
This case study examines Maine’s efforts to expand natural gas distribution service to unserved
communities in the state’s interior Kennebec Valley region and along the Atlantic Coast.
3.3.2 Problem
Very few Maine households have access to natural gas. The population is predominantly rural, and
Maine has the lowest population density of any state on the U.S. East Coast. Among U.S. states,
Maine ranks 49 out of 50 with respect to the number of homes using natural gas for space heating,
with only one out of every twenty residences using it.32
Instead the vast majority of households – 80
percent – use fuel oil.33
Maine is supply constrained and entirely dependent on imports via pipelines from New Hampshire
and Canada. Extremely cold winters can cause shortages and price uncertainty. Most of Maine’s
natural gas consumption goes toward electricity generation and forestry-related industry.34
3.3.3 Proposed Solutions
In 2012, the Maine State Legislature passed An Act to Expand the Availability of Natural Gas to
Citizens of Maine, which authorized state bond financing for gas distribution investments. Under this
legislation, the Finance Authority of Maine is permitted to issue bonds for gas distribution expansion
projects so long as the applicant contributes 25 percent of the expected total project cost.35
In 2013, Governor Paul LePage identified natural gas distribution system expansion as a priority in the
annual State of the State Address, committing to “fast-tracked permitting… for all natural gas
infrastructure,” projecting yearly savings of $800 USD per household.36
30 Connecticut Public Utilities Regulatory Authority. Docket Number: 13-06-02. Connecticut’s Gas LDCs Joint Natural Gas
Infrastructure Expansion Plan. Public Utilities Regulatory Authority, 14 June 2013. Web. March 2015.
31 DEEP, 2013.
32 U.S. Energy Information Administration. “Profile Analysis.” State Profile and Energy Estimates: Maine. U.S. Department of
Energy, 18 December 2013. Web. March 2015.
33 Lori Valigra. “Will natural gas alleviate Maine's energy woes?” Mainebiz, 2 September 2013. Web. March 2015.
34 U.S. EIA, 2013.
35 Maine. Legislature. An Act to Expand the Availability of Natural Gas to Maine Residents. (LD 1644) 2012 Reg. Sess. (29
March 2012). Maine State Legislature. Web. March 2015.
36 Governor Paul LePage. 2013 State of the State Address. State of Maine, 5 February 2013. Web. March 2015.
Confidential
12
Additionally, Maine law and regulatory precedent allow for a greater degree of utility competition than
our research found in other jurisdictions. Specifically:
■ A utility that has been previously authorized to provide natural gas service in Maine does not need
to obtain further regulatory approval to expand into another area – so long as that other area is
currently unserved. Maine’s Revised Statutes 35-A §2104 reads: “…a gas utility authorized to
furnish service and serving customers within the State is not required to obtain the approval of the
commission to serve in any municipality in which no other gas utility is furnishing similar
service…”;37
and,
■ Maine’s Public Utilities Commission (“MPUC” or “Commission”) has “a longstanding policy in
favor of gas utility competition and does not grant exclusive gas franchise territories.” Even if a
community is served by an existing LDC, the regulator can grant authorization as a second utility
under Maine’s Revised Statutes 35-A §2105.38
3.3.4 Tools Used
Natural gas distribution system expansion to unserved areas in Maine has been accomplished
recently through the approval – and subsequent expansion – of a new entrant, Summit Natural Gas of
Maine (“SNG” or “Summit”). SNG is a subsidiary of Summit Utilities, Inc., a privately-held natural
gas transmission and distribution company that operates subsidiaries in Maine, Missouri and
Colorado. The company describes its business strategy as “to aggressively seek opportunities to
provide natural gas transmission and distribution in areas where natural gas is underutilized.”39
In June 2012, SNG applied to the MPUC for unconditional approval to provide natural gas services.
SNG’s proposal was to build transmission and distribution lines servicing 17 communities40
in central
Maine’s Kennebec Valley, which includes the state capital of Augusta. A handful of industrial
facilities – mainly paper mills and a farm – would act as anchor loads, and gas would be supplied via
the Maritimes & Northeast Pipeline. Two transmission lines of 12.9 miles and 52.2 miles were
proposed as the backbone for local distribution mains and service lines throughout the valley.
The key elements of SNG’s plan were:
■ A $350 million USD investment to create a network to service 15,000 customers during an initial
period;
■ A 10-year rate plan – with annual reviews and (if necessary) modifications capped at 4 percent of
last year’s tariff recovery – that includes an adjustment for return on equity that is below a five-
year running average rate;
■ A rate of return on equity that is below utility industry standards for the initial years in the tariff
plan;
■ Rates that include an allowance for the utility to fund construction when a new customer is more
than the standard distance from the existing pipeline network;
■ “Second utility” status to allow SNG to serve alongside an incumbent utility in Augusta; and,
■ An opportunity to fund pipeline expansion and customer conversion rebates using Tax Incentive
Financing.
37 Maine Revised Statutes, 35-A §2104: Commission approval for gas companies to furnish service.
38 Summit Natural Gas of Maine, Inc. Response to Towns of Cumberland, Falmouth and Yarmouth: Natural Gas Pipeline and
Utility Service Request for Proposals. SNG, 25 January 2013. Web. March 2015. Pg. 15.
39 State of Maine Public Utilities Commission. Docket No. 2012-258. Petition for Authority to Furnish Service as a Gas Utility.
SNG, 1 June 2012. Web. March 2015.
40SNG’s service area would comprise: Richmond, Farmingdale, Gardiner, Hallowell, Augusta, Sidney, Belgrade, Waterville,
Oakland, Fairfield, Norridgewock, Madison, Skowhegan, China, Albion, Windsor and Winslow.
Confidential
13
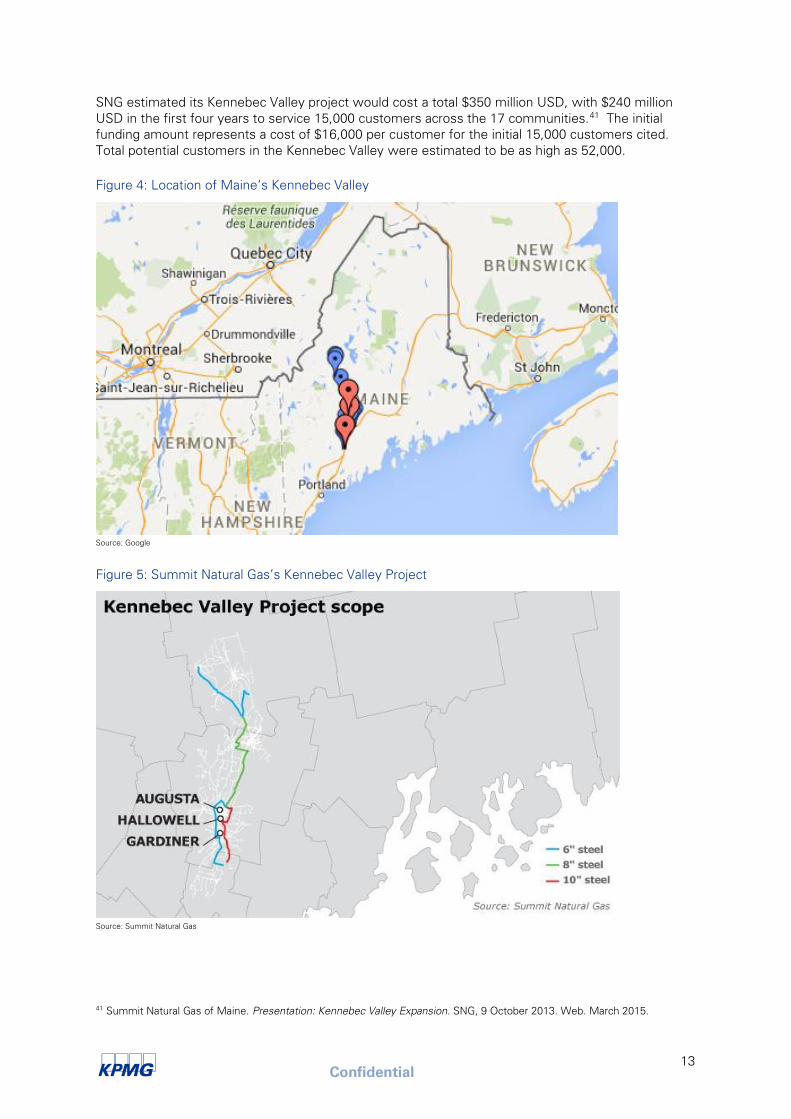
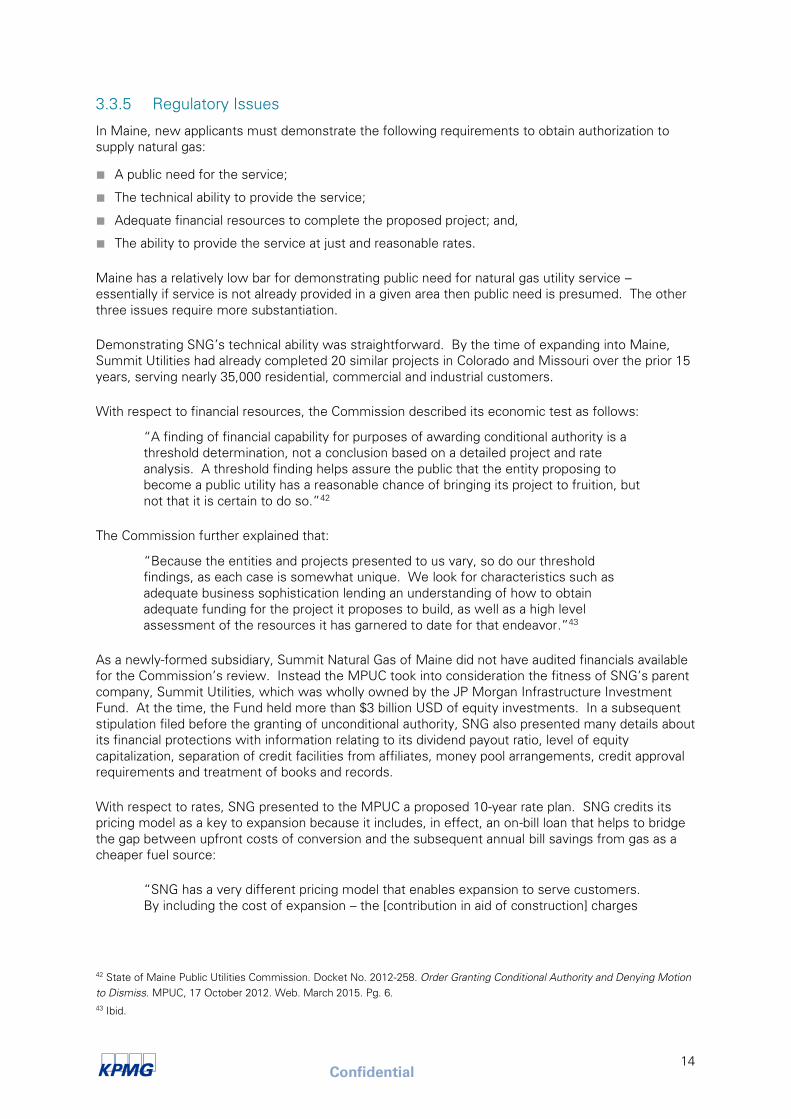
SNG estimated its Kennebec Valley project would cost a total $350 million USD, with $240 million
USD in the first four years to service 15,000 customers across the 17 communities.41
The initial
funding amount represents a cost of $16,000 per customer for the initial 15,000 customers cited.
Total potential customers in the Kennebec Valley were estimated to be as high as 52,000.
Figure 4: Location of Maine’s Kennebec Valley
Source: Google
Figure 5: Summit Natural Gas’s Kennebec Valley Project
Source: Summit Natural Gas
41 Summit Natural Gas of Maine. Presentation: Kennebec Valley Expansion. SNG, 9 October 2013. Web. March 2015.
Confidential
14
3.3.5 Regulatory Issues
In Maine, new applicants must demonstrate the following requirements to obtain authorization to
supply natural gas:
■ A public need for the service;
■ The technical ability to provide the service;
■ Adequate financial resources to complete the proposed project; and,
■ The ability to provide the service at just and reasonable rates.
Maine has a relatively low bar for demonstrating public need for natural gas utility service –
essentially if service is not already provided in a given area then public need is presumed. The other
three issues require more substantiation.
Demonstrating SNG’s technical ability was straightforward. By the time of expanding into Maine,
Summit Utilities had already completed 20 similar projects in Colorado and Missouri over the prior 15
years, serving nearly 35,000 residential, commercial and industrial customers.
With respect to financial resources, the Commission described its economic test as follows:
“A finding of financial capability for purposes of awarding conditional authority is a
threshold determination, not a conclusion based on a detailed project and rate
analysis. A threshold finding helps assure the public that the entity proposing to
become a public utility has a reasonable chance of bringing its project to fruition, but
not that it is certain to do so.”42
The Commission further explained that:
“Because the entities and projects presented to us vary, so do our threshold
findings, as each case is somewhat unique. We look for characteristics such as
adequate business sophistication lending an understanding of how to obtain
adequate funding for the project it proposes to build, as well as a high level
assessment of the resources it has garnered to date for that endeavor.”43
As a newly-formed subsidiary, Summit Natural Gas of Maine did not have audited financials available
for the Commission’s review. Instead the MPUC took into consideration the fitness of SNG’s parent
company, Summit Utilities, which was wholly owned by the JP Morgan Infrastructure Investment
Fund. At the time, the Fund held more than $3 billion USD of equity investments. In a subsequent
stipulation filed before the granting of unconditional authority, SNG also presented many details about
its financial protections with information relating to its dividend payout ratio, level of equity
capitalization, separation of credit facilities from affiliates, money pool arrangements, credit approval
requirements and treatment of books and records.
With respect to rates, SNG presented to the MPUC a proposed 10-year rate plan. SNG credits its
pricing model as a key to expansion because it includes, in effect, an on-bill loan that helps to bridge
the gap between upfront costs of conversion and the subsequent annual bill savings from gas as a
cheaper fuel source:
“SNG has a very different pricing model that enables expansion to serve customers.
By including the cost of expansion – the [contribution in aid of construction] charges
42 State of Maine Public Utilities Commission. Docket No. 2012-258. Order Granting Conditional Authority and Denying Motion
to Dismiss. MPUC, 17 October 2012. Web. March 2015. Pg. 6.
43 Ibid.
Confidential
15
– within our rates, we are able to expand to serve customers without having those
customers pay separately for construction of lines to serve them. Moreover, our
rates include a generous allowance – actual cash rebates – to help customers pay for
the cost of converting to natural gas. Our model is unique, but it is the basis for our
high penetration rates. Other utilities may have lower rates, but their rates do not
permit expansion. A low rate is of no value to customers who cannot obtain gas
service. SNG’s rate structure is geared toward getting lines built to serve customers.
With respect to commercial customers, SNG does not provide conversion
rebates.”44
The Commission found that SNG’s proposed rate plan was similar to ones it had approved previously
and contained the right balance of ratepayer and shareholder protections. It is worth noting the
MPUC did observe:
“Although SNG Maine’s average distribution rates for all classes are higher than
rates currently charged by other Maine gas utilities, SNG Maine will offer a lower
cost alternative compared to other fuels, most notably heating oil and propane. In
addition, SNG Maine will provide up-front financial incentives to customers to help
defray the costs to convert to natural gas.”45
The Commission acknowledged that flexibility was necessary to facilitate expansion:
“We observe that where, as here, the utility is seeking customers who are in no
sense ‘captives’ of the utility – since virtually all can satisfy their energy needs using
other fuels but will reduce their energy costs by adding natural gas as a resource – it
makes little sense to apply all the traditional metrics for establishing that rates are
‘just and reasonable.’ Thus in this case we conclude that we can approve a rate plan
for SNG Maine that would likely, for a genuinely ‘monopoly’ provider, result in rates
that would either qualify as excessive or insufficiently compensatory relative to
costs. We will, of course, be vigilant to ensure that customers who take service
from SNG Maine are informed of the rate plan and the manner in which rates under
the plan can change. As time progresses, alternative equipment ages (and even
becomes inoperative) and customers become more dependent and limited in their
energy options, the more traditional attributes of monopoly regulation may become
more appropriate.”46
In January 2013, the MPUC granted unconditional authority to SNG Maine to supply natural gas utility
service to 17 municipalities in the Kennebec Valley.
3.3.6 Outcomes
Development has been slower than SNG projected. Since 2013, Summit has delivered natural gas
distribution service to only 3,000 customers in 12 communities.47
These customers are split
between the Kennebec Valley Project and a second expansion project on the coast, which SNG
announced shortly after it received approval to supply natural gas in Maine from the MPUC. 48
44 SNG, 25 January 2013. Pg. 23.
45 State of Maine Public Utilities Commission. Docket No. 2012-258. Order Approving Stipulation. MPUC, 29 January 2013.
Web. March 2015. Pg. 11.
46 Ibid. Pg. 12.
47 Summit Natural Gas of Maine. Summit Natural Gas of Maine Announces 2015 Construction Plan. PR Newswire. SNG, 25
February 2015. Web. March 2015.
48 Tux Turkel. “For Summit Natural Gas, the path hasn’t been easy.” Portland Press Herald. 19 March 2015. Web. March 2015.
Confidential
16
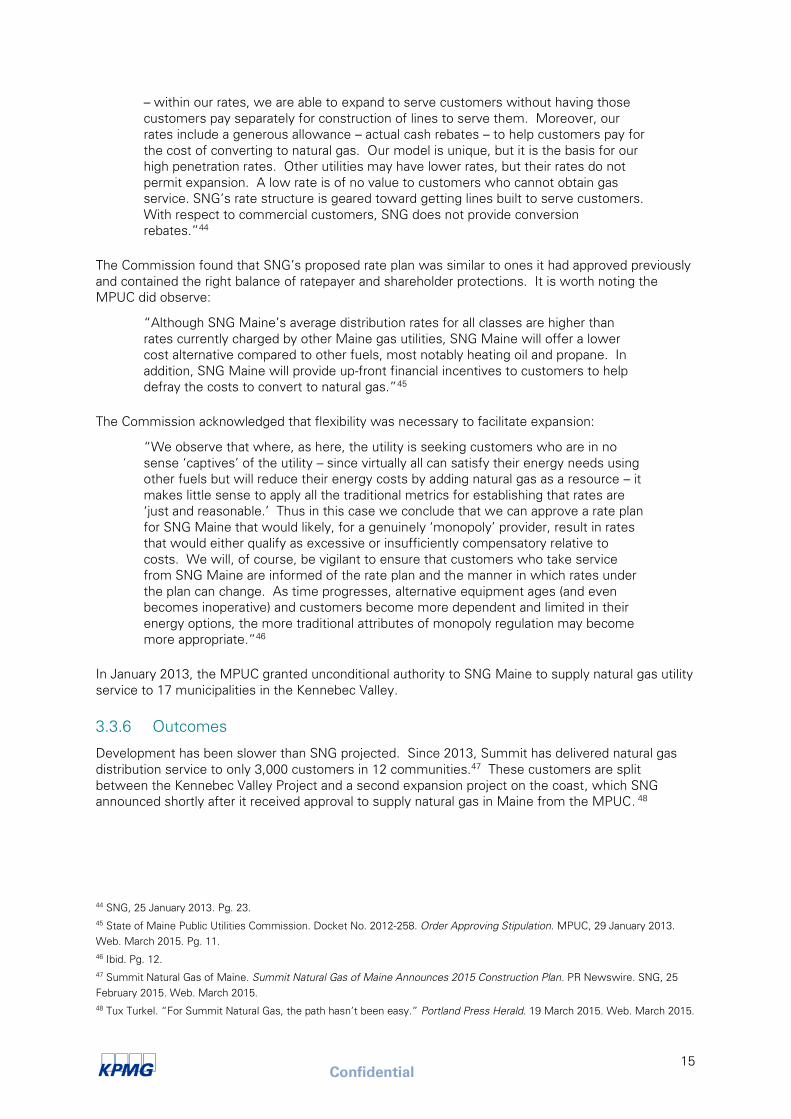
In March 2013, SNG won a competitive bidding process held by the Maine coastal communities of
Cumberland, Falmouth and Yarmouth, which are located just north of Maine’s most populous city,
Portland. The three Portland suburbs issued a Request for Proposals to design, construct and
operate a local distribution system in the three communities. Two of Maine’s utilities submitted bids
– Maine Natural Gas and Summit Natural Gas of Maine – while a third, Unitil, declined to submit a bid,
choosing instead to focus on its existing areas.
Evaluation criteria were evenly split between three items49
:
■ Saturation plan;
■ Pricing structure, capacity, schedule and related considerations; and,
■ Previous experience in similar communities, with marketing/ saturation, safety, customer service,
reliability, pricing, public outreach and similar concerns.
The communities cited SNG’s “experience, saturation commitment and pricing” as the reason for its
selection.50
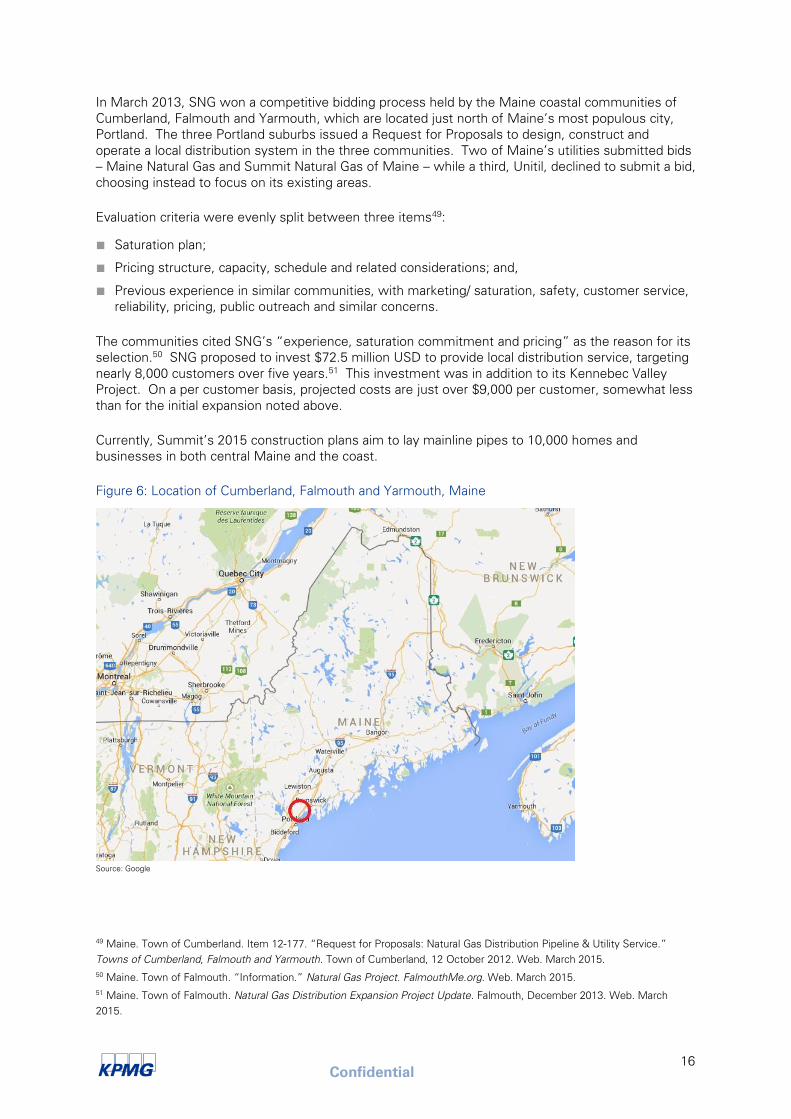
SNG proposed to invest $72.5 million USD to provide local distribution service, targeting
nearly 8,000 customers over five years.51
This investment was in addition to its Kennebec Valley
Project. On a per customer basis, projected costs are just over $9,000 per customer, somewhat less
than for the initial expansion noted above.
Currently, Summit’s 2015 construction plans aim to lay mainline pipes to 10,000 homes and
businesses in both central Maine and the coast.
Figure 6: Location of Cumberland, Falmouth and Yarmouth, Maine
Source: Google
49 Maine. Town of Cumberland. Item 12-177. “Request for Proposals: Natural Gas Distribution Pipeline & Utility Service.”
Towns of Cumberland, Falmouth and Yarmouth. Town of Cumberland, 12 October 2012. Web. March 2015.
50 Maine. Town of Falmouth. “Information.” Natural Gas Project. FalmouthMe.org. Web. March 2015.
51 Maine. Town of Falmouth. Natural Gas Distribution Expansion Project Update. Falmouth, December 2013. Web. March
2015.
Confidential
17
Figure 7: Cumberland, Falmouth, Yarmouth Expansion Project
Source: Summit Natural Gas and The Portland Press Herald
3.4 New York
3.4.1 Case Study Overview
This case study examines New York’s efforts to expand natural gas distribution service to upstate
communities, with an example of a recent expansion.
3.4.2 The Problem
More than half of New York residences use gas for space heating, yet there are still well over one
million households within existing service territories with no access to natural gas. This figure breaks
down to approximately 550,000 residences within 100 feet from an existing gas main and 580,000
beyond that distance. 52
Furthermore, despite New York’s high saturation rate, there are still
unfranchised territories considered too expensive to expand into due to remote, rocky or
mountainous terrain.
Instead of ample in-state production, New York has been primarily supplied with natural gas from
major pipelines extending from the U.S. Gulf Coast and Canada, with interstate pipelines extending
beyond into New England.53
More recently, significant shale production in Pennsylvania has led to
52 U.S. Energy Information Administration. “Profile Analysis.” State Profile and Energy Estimates: New York. U.S. Department
of Energy, 18 December 2013. Web. March 2015; and New York State Public Service Commission. Case 12-G-0297.
“Proceeding on Motion of the Commission to Examine Policies Regarding the Expansion of Natural Gas Service.” Order
Instituting Proceeding and Establishing Further Procedures. New York Public Service Commission, 30 November 2012. Web.
March 2015.
53 U.S. Energy Information Agency, 2013.
Confidential
18
additional pipeline capacity from both existing infrastructure and planned expansions. New York, too,
has major shale gas deposits. However the state became the first in the U.S. to officially ban
hydraulic fracturing in December 2014, though a temporary ban had been in place for 6 years prior.54
3.4.3 Proposed Solutions
On November 15, 2012, New York released a 116-page, long-term energy strategy entitled The New
York Energy Highway Blueprint (“Blueprint”).55
The Blueprint was officially issued by the Governor’s
New York Energy Highway Task Force and based on a comprehensive consultation process. The
Blueprint’s 13 action items predominantly related to electricity policy (e.g., renewable power
generation, smart grid technologies, retiring old power plants, etc.), but natural gas was also included.
The most relevant recommendation to natural gas distribution expansion was an action item labelled
“Accelerate investments in natural gas distribution to reduce costs to consumers and promote
reliability, safety, and emission reductions.” According to the Blueprint, New York’s gas LDCs have
been investing significantly in utility infrastructure -- $5 billion USD in natural gas infrastructure over
the prior five years and projected to invest another $5 billion USD in the subsequent five years,
covering both equipment replacement and system expansion to accommodate load growth.56
Coming out of the Blueprint was the direction to further examine natural gas expansion policies. This
task was assigned to the New York State Public Service Commission (“PSC” or “Commission”). In
response, the Commission instituted a proceeding to examine existing state policies, which included
a technical conference that took place on January 9, 2013 with 13 presentations from LDCs.
The 16-page order instituting this proceeding provides considerable insight into the Commission’s
thinking and priorities. The order highlights that over one million people heat with fuels other than
natural gas, despite the fact that New York already has 19 regulated gas utilities and considerable
existing gas infrastructure.57
Echoing the Blueprint, the Commission lays out the environmental, economic and household benefits
of switching to natural gas and goes into more detail about the types of specific regulatory issues it is
interested in examining further. In particular, the Commission points out that while current statutory
and regulatory requirements related to natural gas expansion policy permit some flexibility, “only
rarely, however, have utilities sought to employ such flexibility.”58
In advance of the technical conference, the PSC published a lengthy and detailed list of discussion
questions indicating the topics it was interested in exploring. Among the issues to be considered at
the technical conference:
■ Barriers to Extension and Expansion of Natural Gas Facilities;
■ Rate and Ratepayer Considerations;
■ Economic Development;
■ Public/ Private Partnerships;
■ Environmental Impact; and,
54 Thomas Kaplan. “Citing Health Risks, Cuomo Bans Fracking in New York State.” New York Times, 17 December 2014.
Web. March 2015.
55 New York. New York Energy Highway Task Force. New York Energy Highway Blueprint. New York Energy Highway Task
Force, 15 November 2012.
56 Ibid. Pg. 55.
57 For a complete list of the natural gas utilities regulated by the New York State Public Service Commission, please visit:
http://www.dps.ny.gov/
58 New York State Public Service Commission, 2012. Pg. 7.
Confidential
19
■ Planning.
The full list of questions is attached as Appendix 2.
3.4.4 Tools Used
Even though the Commission held the technical conference on the topic of natural gas expansion
policy – and posted the 13 LDC presentations59
to its Department of Public Service website – the
PSC did not issue a summary report with recommendations to policymakers, which it had initially set
out to do.60
Instead, the Commission decided it was more appropriate to deal with the specifics of
natural gas expansion policy during future rate cases, applications for certificates of public
convenience and necessity, etc. As a result, the next section of this case study will describe the
process used by the Commission in advance of one of its orders granting a certificate to a utility to
expand into a new service territory.
Last year, New York State Electric & Gas Corporation (“NYSEG”) was granted an amended certificate
to exercise a new franchise, expanding into a neighbouring unserved territory far upstate. The
Commission’s decision to deviate from established expansion policies to provide more flexibility
around the expansion project’s development period, as well as to require more attention to informing
potential new customers of expansion, is illustrative. Specifically, the PSC adopted a ten-year
development period for the expansion of gas service, as opposed to the established development
period of five years.
3.4.5 Regulatory Issues
In New York, gas utility expansions or new entrants require both a franchise agreement with the
locality it seeks to service and a certificate of public convenience and necessity authorizing franchise
rights, as prescribed in Public Service Law Section 68:
“In making such a determination, the commission shall consider the economic
feasibility of the corporation, the corporation's ability to finance improvements of a
gas plant or electric plant, render safe, adequate and reliable service, and provide just
and reasonable rates, and whether issuance of a certificate is in the public
interest.”61
The Public Service Commission interprets these requirements to mean that expansion projects must
be economic for ratepayers62
in order to be afforded normal rate treatment, and its policy for
59 New York State Public Service Commission. Case 12-G-0297. Natural Gas Expansion – Presentations from the Jan. 9, 2013
Technical Conference. New York Public Service Commission, 2013. Web. March 2015.
60 The order instituting the proceeding had said, “Upon completion of the Technical Conference, Staff will provide a report to
the Commission along with any recommendations it may develop” (page 9). Similarly, the Blueprint listed as an initiative, “By
the end of 2012, [Department of Public Service] to issue notice on natural gas expansion policies” (page 57).
61 NY Pub Serv L § 68 (2012): Certificate of public convenience and necessity.
62 New York State Public Service Commission. Case 12-G-0499. “Petition of New York State Electric & Gas Corporation to
Amend its Certificate of Public Convenience and Necessity and to Exercise a Gas Franchise in the Town of Plattsburgh, Clinton
County, New York.” Order Amending Certificate of Public Convenience and Necessity and Requiring System Improvements.
New York Public Service Commission, 29 July 2014. Web. March 2015. Pg. 12-13.
Confidential
20
determining whether expansion projects would unfairly burden existing ratepayers has been in place
since 1989.63
The key elements of that policy include64
:
■ Assessment of franchise proposal over a five-year development period;
■ The requirement to earn the utility’s Commission-permitted rate of return in the new franchise
area by the end of the five-year development period;
■ The ability of the utility to levy a surcharge on all customers in the new franchise area during the
five-year development period, if the rate of return at the end of that period is projected to be less
than the utility’s Commission-permitted rate of return; and,
■ If the utility levies a surcharge it must be limited solely to what is needed to recover the estimated
shortfall that would exist at the end of the five-year development period.
The rate of return test is applied to profitability at the end of the development period as an annual
calculation. With respect to revenue deficiency, the expected deficiency (ex ante) is collected
through a surcharge, which may be the same as the contribution in aid of construction surcharge. It
is expected to compensate the utility for the losses in the early years. For broader rate-making
purposes (involving the utility as a whole), the revenues from the surcharge are excluded from
revenue deficiency estimates. As long as the expansion proceeds as projected, the utility would be
kept whole. There is a possibility that the actual deficiency (ex post) is different from the ex ante
level – for example, if expansion was slower than anticipated or costs were higher. In that case,
there is a possibility that the actual deficiency will be larger than anticipated. It is not clear from the
1989 policy statement whether the utility is at risk or if the surcharge could be continued beyond the
development period to keep the utility whole.
3.4.5.1 New York State Electric & Gas Corporation Expansion
NYSEG provides electricity and natural gas services to customers across New England, including 40
percent of upstate New York.65
In 2012 it proposed its largest distribution system expansion project
in 15 years66
by seeking to expand its natural gas franchise in the far north-eastern part of the state to
include a municipal-wide franchise67
in the Town of Plattsburgh, a rural, agricultural and sparsely-
populated area it had long bordered since the time it started providing service to the neighbouring
community of City of Plattsburgh.
63 New York State Public Service Commission. Case 89-G-078. Policy for Rate Treatment of Gas Service Expansion into New
Franchise Areas. New York Public Service Commission, 11 December 1989. Web. March 2015.
64 Paraphrased using the original policy statement (1989) and subsequent Commission descriptions in orders from 2012 and
2014.
65 New York State Electric & Gas Corporation. “Our Company: Service Area.” NYSEG.com. NYSEG, 2015. Web. March 2015.
66 Staci DaSilva. “NYSEG Announces Major Gas Line Expansion In Plattsburgh.” My Champlain Valley, 22 October 2014. Web.
March 2015.
67 NYSEG had distributed gas to some of the Town’s residences along major roadways bordering the City of Plattsburgh but
did not have a franchise to distribute to the rural areas.
Confidential
21
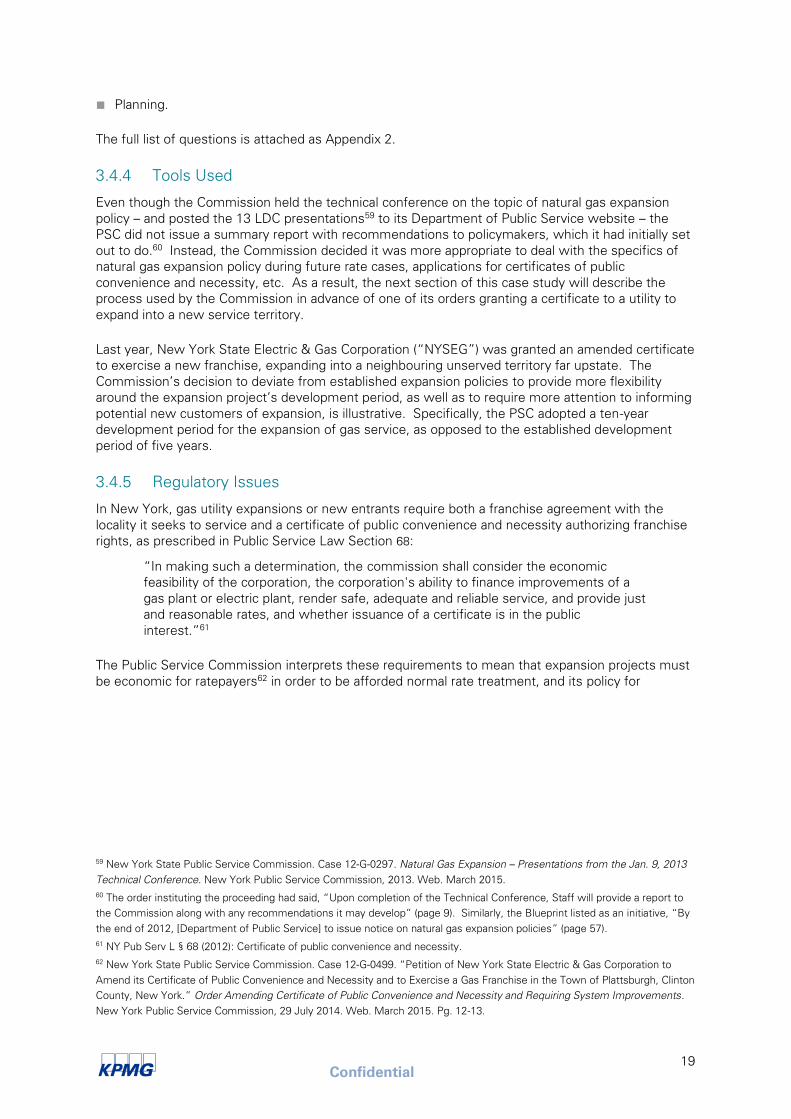
Figure 8: Location of Town of Plattsburgh, New York
Source: Google
NYSEG’s application for a new franchise area was broadly supported by the Town, the local chamber
of commerce and the economic development corporation. As part of its petition, NYSEG asked for
expedited approval to service an anchor customer (Nova Bus), which the Commission quickly granted
for its potential economic benefits and the company’s agreement to the required surcharges. With a
potential new customer base of 1,200 and initial surveys indicating nearly three-quarters of
respondents saying they would convert, the PSC’s approval for the rest of the application appeared
straightforward.
However the proceeding lasted from November 2012 to July 2014 due to a lengthy back-and-forth
between NYSEG and the Commission’s staff around feasibility studies, models and build-out plans
and multiple iterations thereof. A breakthrough occurred when NYSEG submitted, at the
Commission’s request, a ten-year development period (twice as long as the one envisioned by the
Commission’s 1989 policy statement). The significance of the longer development period is that it is
the period of time over which rate surcharges can be collected. As a result, the longer development
period “significantly reduced estimated monthly CIAC surcharges to customers.”68
After
Commission staff further modified build-out plans in consultation with Town of Plattsburgh officials, a
workable solution was agreed upon.
The Commission found that a ten-year development period was justified in light of:
■ Current natural gas prices;
■ Population density of potential customers; and,
■ Significant reductions in monthly CIAC surcharge bill impacts.69
Taken together, these elements balanced the need to meet the utility’s Commission-permitted rate
of return by the end of the development period while still resulting in rates competitive enough that
68 New York State Public Service Commission, 2014. Pg. 7.
69 The surcharge rate ($0.282 per therm) equates to $300 a year for the average residential customer. Even accounting for this
amount, customers could save $1,400 annually compared oil or $2,200 annually compared to propane. Source: New York
State Public Service Commission, 2014, and DaSilva, 2014.
Confidential
22
would encourage fuel-switching. In the Commission’s conclusion to the order, it explained that the
benefits of this approach included:
“…the economic benefits of increased development in Plattsburgh due to the
construction of this project and the expected continued availability of gas as a lower
cost heating fuel. Increasing the availability of natural gas to the community may
also have the added benefit of business attraction, retention, and expansion.”70
Similar to North Carolina’s focus on tracking interest from potential customers, the New York Public
Service Commission required NYSEG to keep a record of any potential customer’s interest in
receiving gas service. The Commission explicitly laid out the types of required information: 71
■ The date a customer inquired;
■ Their address;
■ What documents NYSEG provided to the customer, if any; and,
■ How the inquiry or request was finally resolved.
3.4.6 Outcomes
By 2017, 70 percent of residents in the Town of Plattsburgh are expected to have access to natural
gas.72
At the time of this writing, Leatherstocking Gas Company – a new entrant looking to service
communities in northern Pennsylvania and southern New York – filed for a new franchise with the
Public Service Commission.73
3.5 North Carolina
3.5.1 Case Study Overview
This case study examines North Carolina’s efforts to expand natural gas distribution service to a
significant portion of the state over the past 25 years.
3.5.2 Problem
In 1989, North Carolina began a state-wide push to expand natural gas distribution service. At the
time, the North Carolina Utilities Commission (“NCUC” or “Commission”) had identified 38 counties
out of 100 with no gas service or only minimal service availability. 20 of those 38 counties were
located in unfranchised territories of the state.74
70 Ibid. Pg. 34.
71 New York Public Service Commission, 2014, page 31.
72 DaSilva, 2014.
73 Leatherstocking Gas Company, LLC. Case numbers 15-G-0098 and 15-G-0099 Verified Petition. Public Service Commission,
20 February 2015. Web. March 2015.
74 North Carolina Utilities Commission. “Analysis and Summary of Expansion Plans of North Carolina Natural Gas Utilities and
the Status of Natural Gas Service in North Carolina.” Report of the Public Staff North Carolina Utilities Commission to the Joint
Legislative Commission on Governmental Operations. NCUC, 24 April 2012. Web. March 2015.
Confidential
23
3.5.3 Proposed Solutions
North Carolina enacted 3 key pieces of legislation to promote the expansion of natural gas distribution
service:
■ The Natural Gas Planning Act, 1989;75
■ The Natural Gas Expansion/ Cost Act, 1991;76
■ The Clean Water and Natural Gas Critical Needs Bond Act, 1998.77
3.5.3.1 The Natural Gas Planning Act, 1989
North Carolina has four private-sector LDCs and eight municipal gas systems.78
The Natural Gas
Planning Act requires each LDC to file biennial reports with the NCUC on the status of expansion
projects within their respective franchise territories. The legislation was later amended to apply only
to LDCs with unserved areas within their franchised service territories.
Upon receiving the LDCs’ reports, the NCUC compiles and summarizes the information and submits
it to legislative committees. LDCs are required to report on the following items:
■ Inquiries for natural gas service received from potential large users;
■ The status of expansion projects previously reported to the Commission; and,
■ Plans for potential expansion projects.
As an example, most recently the largest LDC in North Carolina – Piedmont Natural Gas Company –
stated it had received 97 inquiries from large commercial and industrial customers about potential gas
service:79
■ 11 were successful (new customers were added as a result of those inquiries);
■ 12 were progressing;
■ 32 were unsuccessful or not feasible (did not provide gas to the customer); and,
■ 42 were still pending (either waiting for data, being evaluated, or halted progress).
75 That Natural Gas Planning Act is the short title for the bill. Source: North Carolina. Legislature. House. An Act to Require
Natural Gas Local Distribution Companies to Report Plans for Providing Natural Gas Service in Unserved Areas to the Utilities
Commission and to Require the Utilities Commission to Report on Expansion of Natural Gas Service to the Joint Legislative
Utility Review Committee. (HB 970) 1989 Session. (31 March 1989) General Assembly of North Carolina. Web. March 2015.
Note: This law was later amended to require reporting to the Joint Legislative Commission on Governmental Operations.
76 The Natural Gas Expansion/ Cost Act is the short title for the bill. Source: North Carolina. Legislature. House. An Act to
Facilitate the Construction of Facilities In and the Extension of Natural Gas Service To Unserved Areas and To Revise the
Procedures for Gas Cost Adjustments for Natural Gas Local Distribution Companies. (HB 1039) 1991 Session. (8 July 1991)
General Assembly of North Carolina. Web. March 2015.
77 The Clean Water and Natural Gas Critical Needs Bond Act is the short title for the bill. Source: North Carolina. Legislature.
House. An Act to Authorize the Issuance of General Obligation Bonds of the State, Subject to a Vote of the Qualified Voters of
the State, to Address Statewide Critical Infrastructure Needs by Providing Funds (1) For Grants and Loans to Local
Government Units for Water Supply Systems, Wastewater Collection Systems, Wastewater Treatment Works, and Water
Conservation and Water Reuse Projects and (2) For Grants, Loans, or Other Financing to Public or Private Entities for
Construction of Natural Gas Facilities. (SB 1354) 1997 Session. (9 September 1998) General Assembly of North Carolina. Web.
March 2015.
78 The four private-sector LDCs are Piedmont Natural Gas Company, Inc.; Public Service Company of North Carolina, Inc., doing
business as PSNC Energy; Frontier Natural Gas Company, LLC; and Toccoa Natural Gas. The eight municipal systems are
Greenville, Rocky Mount, Wilson, Shelby, Bessemer City, Lexington, Monroe, and Kings Mountain. Piedmont and PSNC
Energy cover the vast majority of North Carolina’s territory.
79 North Carolina Utilities Commission. “The Status and Expansion of Natural Gas Service within the State.” Report of the
North Carolina Utilities Commission to the Joint Legislative Commission on Governmental Operations. NCUC, 28 April 2014.
Web. March 2015.
Confidential
24
3.5.3.2 The Natural Gas Expansion/ Cost Act, 1991
The initial expansion reports filed under The Natural Gas Planning Act indicated that “the extension of
natural gas service in some areas of the State may not be economically feasible with traditional
funding methods.”80
In response, state lawmakers passed The Natural Gas Expansion/ Cost Act,
which authorized “the creation of an expansion fund for each natural gas local distribution company
to be administered under the North Carolina Utilities Commission.”81
This Act enables the Commission, following a hearing, to order LDCs to create “a special natural gas
expansion fund” to be supervised and administered by the Commission. The legislation
implementing the expansion fund included two specific and one non-specific funding sources:
■ Expansion surcharges applied to the bills of all customers of the local distribution company;
■ Refunds received – from gas and transportation service suppliers – by local distribution companies
as a result of decisions made by the Federal Energy Regulatory Commission, the federal
government’s regulatory body in the United States (comparable to the National Energy Board);
and,
■ Other funding sources approved by the North Carolina Utilities Commission.
However despite these three options, only supplier refunds and the interest associated with those
refunds have been used so far. Changes to U.S. federal legislation and regulation in the years since
The Natural Gas Expansion/ Cost Act may limit its applicability today.82
3.5.3.3 The Clean Water and Natural Gas Critical Needs Bond Act,1998
By 1998, the North Carolina General Assembly found that “While the 1991 legislation has been
successful in providing some natural gas service to previously unserved areas of the State, that
legislation has not been sufficient to facilitate the extension of service that is necessary and in the
public interest, and there are still counties with no gas service or virtually no gas service.”83
The Clean Water and Natural Gas Critical Needs Bond Act authorized the issuance of $200 million
USD in North Carolina State general obligation bonds “to provide grants, loans, or other financing to
natural gas local distribution companies, persons seeking natural gas distribution franchises, State or
local government agencies, or other entities for construction of natural gas facilities.”84
Section 5 of
the Act outlined what the funding could be used for, including (but not limited to) the costs of:
■ Pipelines;
■ Compressors;
■ Interests in real property; and,
■ Related equipment for the delivery of natural gas.
3.5.4 Tools Used
All three pieces of legislation noted above have been used. Overall, nearly $510 million USD has
been invested to expand the availability of natural gas to North Carolina’s unserved and underserved
80 Quoted from the preamble of The Natural Gas Expansion/ Cost Act, 1991.
81 Ibid.
82 In the context of the legislation, “suppliers” meant interstate natural gas pipelines and equivalent entities that were subject
to rate regulation. The North Carolina legislation predates the implementation of subsequent reforms (e.g., 1992 Energy Policy
Act). Today most gas is either sold under market-based rate authority or in a newer rate-making environment where refunds
occur far less frequently.
83 Quoted from The Clean Water and Natural Gas Critical Needs Bond Act, 1998.
84 Ibid. Section 2(b).
Confidential
25
areas. Of this total amount, $200 million USD was provided by natural gas bonds and $115 million
USD by LDC expansion funds.85
The remaining $195 million USD was provided primarily by LDC
investors. Frequent and detailed biennial reports showed lawmakers and regulators where state,
LDC and investor funds were being spent on expansion projects.
3.5.5 Regulatory Issues
The North Carolina Utilities Commission administers the use of expansion funds and natural gas
bonds according to the same criteria. Both sources of funding are prescribed by their respective
legislation to be used only for the “infeasible portion” of an expansion project. If at any time the
proposed project becomes feasible, the Commission may require the expansion funds or bond
funding to be returned. The economically infeasible portion of a project is defined as:
“In determining economic feasibility, the Commission shall employ the net present
value method of analysis on a project specific basis. Only those projects with a
negative net present value shall be determined to be economically infeasible for the
company to construct.”86
In calculating the net present value, the Commission uses a discount rate approximating the utility
cost of capital. Additionally, in determining whether funds can be used, the Commission is required
to consider:
■ The scope of a proposed project, including the number of unserved counties and the number of
anticipated customers that would be served; and,
■ The total cost of the project.
3.5.6 Outcomes
Despite North Carolina’s relatively southern U.S. geography, which suggests that heating loads are
not large, the expansion of its natural gas distribution system over the past 25 years has been a
priority for policymakers. As of 2014, 96 out of 100 counties in North Carolina are being served by a
gas LDC. The remaining 4 counties without an LDC franchise servicing them are all located in North
Carolina’s mountainous west. Even there, one LDC is currently exploring ways to expand.87
Since 1991, $114.6 million USD of expansion funds have been used by three LDCs.88
The table
below provides a brief description of what these projects looked like.
85 NCUC, 2012 and 2014.
86 Quoted from The Natural Gas Expansion/ Cost Act, 1991.
87 Frontier is “exploring ways to cost effectively expand into Allegheny County to serve the town of Sparta.” NCUC, 2014. Pg.
2.
88 Note that a former LDC – the North Carolina Natural Gas Corporation (“NCNG”) – was acquired by Piedmont.
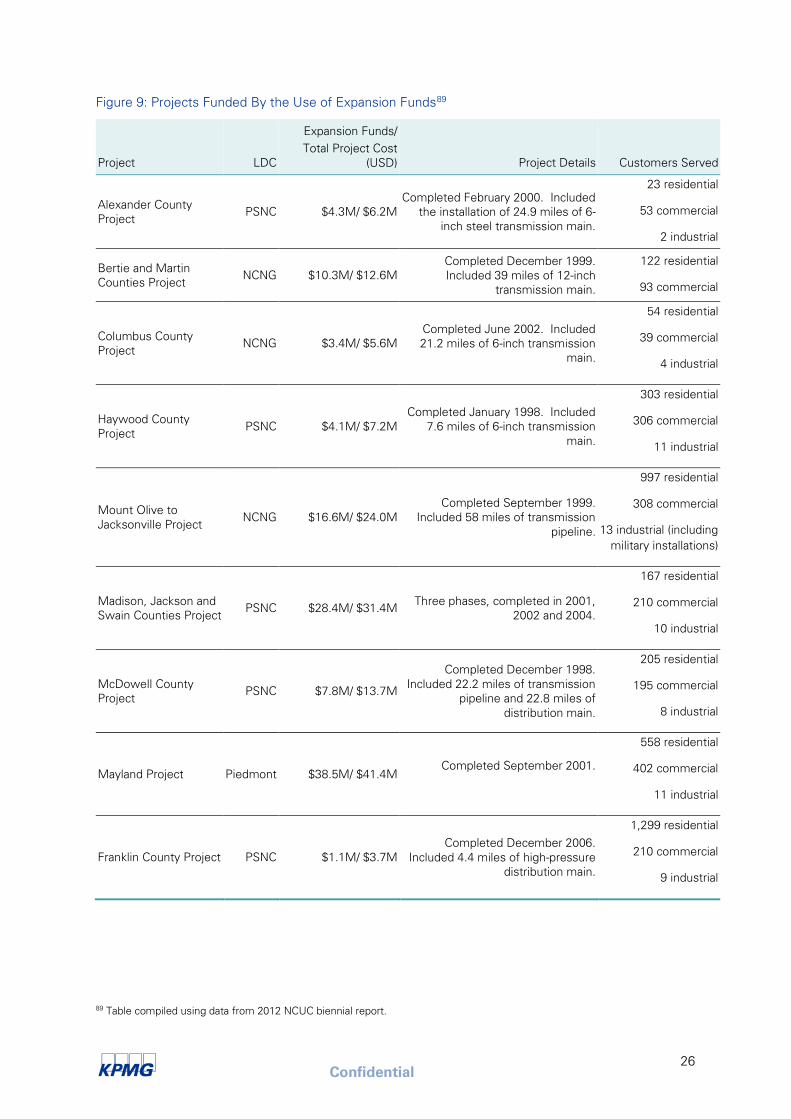
Confidential
26
Figure 9: Projects Funded By the Use of Expansion Funds89
Project LDC
Expansion Funds/
Total Project Cost
(USD) Project Details Customers Served
Alexander County
Project PSNC $4.3M/ $6.2M
Completed February 2000. Included
the installation of 24.9 miles of 6-
inch steel transmission main.
23 residential
53 commercial
2 industrial
Bertie and Martin
Counties Project NCNG $10.3M/ $12.6M
Completed December 1999.
Included 39 miles of 12-inch
transmission main.
122 residential
93 commercial
Columbus County
Project NCNG $3.4M/ $5.6M
Completed June 2002. Included
21.2 miles of 6-inch transmission
main.
54 residential
39 commercial
4 industrial
Haywood County
Project PSNC $4.1M/ $7.2M
Completed January 1998. Included
7.6 miles of 6-inch transmission
main.
303 residential
306 commercial
11 industrial
Mount Olive to
Jacksonville Project NCNG $16.6M/ $24.0M
Completed September 1999.
Included 58 miles of transmission
pipeline.
997 residential
308 commercial
13 industrial (including
military installations)
Madison, Jackson and
Swain Counties Project PSNC $28.4M/ $31.4M
Three phases, completed in 2001,
2002 and 2004.
167 residential
210 commercial
10 industrial
McDowell County
Project PSNC $7.8M/ $13.7M
Completed December 1998.
Included 22.2 miles of transmission
pipeline and 22.8 miles of
distribution main.
205 residential
195 commercial
8 industrial
Mayland Project Piedmont $38.5M/ $41.4M
Completed September 2001.
558 residential
402 commercial
11 industrial
Franklin County Project PSNC $1.1M/ $3.7M
Completed December 2006.
Included 4.4 miles of high-pressure
distribution main.
1,299 residential
210 commercial
9 industrial
89 Table compiled using data from 2012 NCUC biennial report.
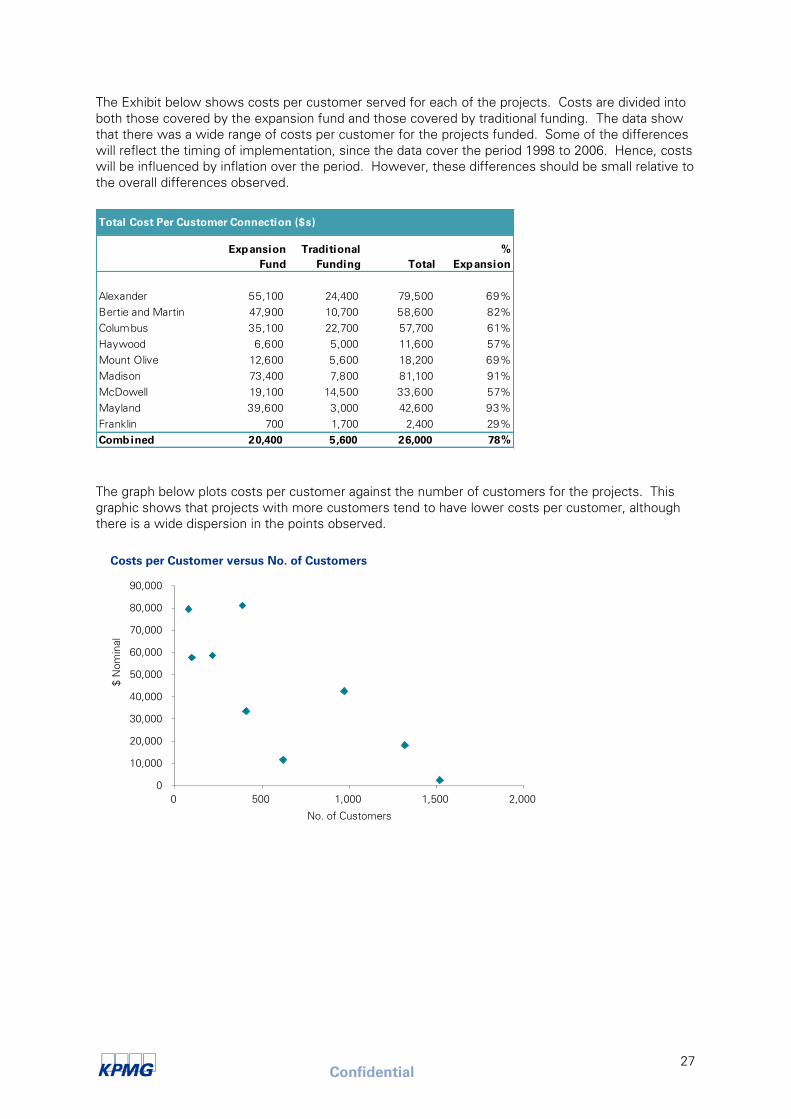
Confidential
27
The Exhibit below shows costs per customer served for each of the projects. Costs are divided into
both those covered by the expansion fund and those covered by traditional funding. The data show
that there was a wide range of costs per customer for the projects funded. Some of the differences
will reflect the timing of implementation, since the data cover the period 1998 to 2006. Hence, costs
will be influenced by inflation over the period. However, these differences should be small relative to
the overall differences observed.
The graph below plots costs per customer against the number of customers for the projects. This
graphic shows that projects with more customers tend to have lower costs per customer, although
there is a wide dispersion in the points observed.
Total Cost Per Customer Connection ($s)
Expansion
Fund
Traditional
Funding Total
%
Expansion
Alexander 55,100 24,400 79,500 69%
Bertie and Martin 47,900 10,700 58,600 82%
Columbus 35,100 22,700 57,700 61%
Haywood 6,600 5,000 11,600 57%
Mount Olive 12,600 5,600 18,200 69%
Madison 73,400 7,800 81,100 91%
McDowell 19,100 14,500 33,600 57%
Mayland 39,600 3,000 42,600 93%
Franklin 700 1,700 2,400 29%
Combined 20,400 5,600 26,000 78%
0
10,000
20,000
30,000
40,000
50,000
60,000
70,000
80,000
90,000
0 500 1,000 1,500 2,000
$ N
om
inal
No. of Customers
Costs per Customer versus No. of Customers
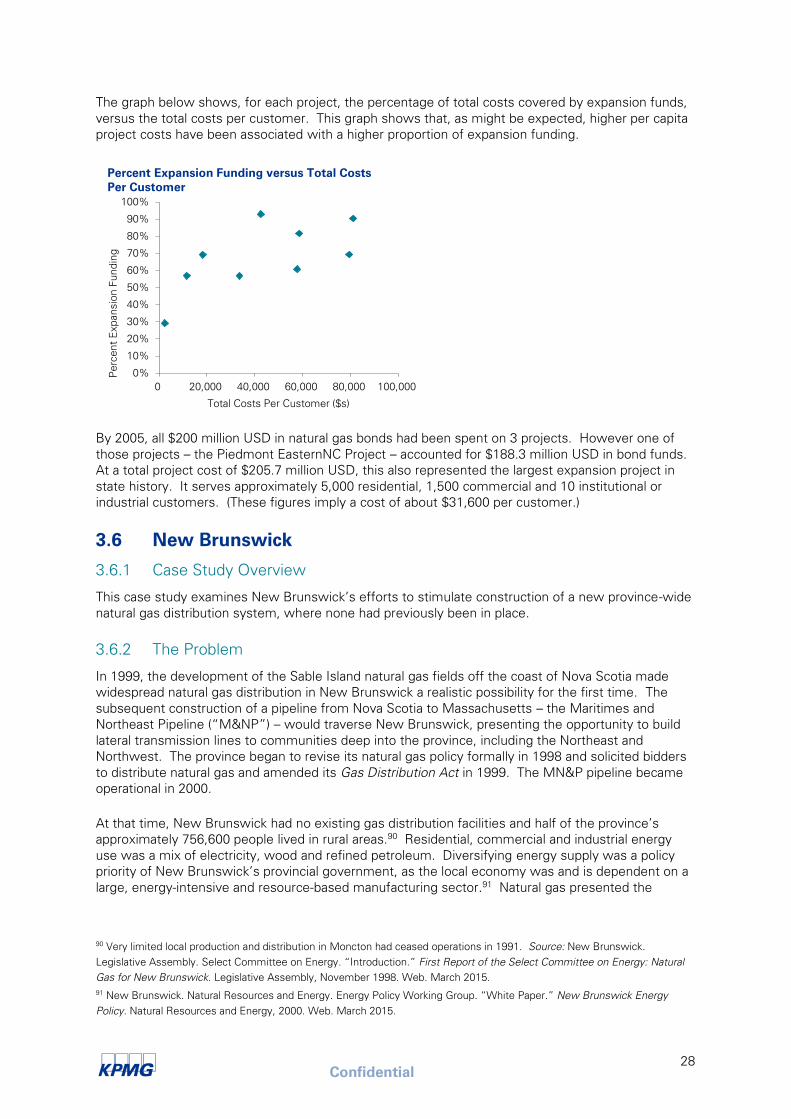
Confidential
28
The graph below shows, for each project, the percentage of total costs covered by expansion funds,
versus the total costs per customer. This graph shows that, as might be expected, higher per capita
project costs have been associated with a higher proportion of expansion funding.
By 2005, all $200 million USD in natural gas bonds had been spent on 3 projects. However one of
those projects – the Piedmont EasternNC Project – accounted for $188.3 million USD in bond funds.
At a total project cost of $205.7 million USD, this also represented the largest expansion project in
state history. It serves approximately 5,000 residential, 1,500 commercial and 10 institutional or
industrial customers. (These figures imply a cost of about $31,600 per customer.)
3.6 New Brunswick
3.6.1 Case Study Overview
This case study examines New Brunswick’s efforts to stimulate construction of a new province-wide
natural gas distribution system, where none had previously been in place.
3.6.2 The Problem
In 1999, the development of the Sable Island natural gas fields off the coast of Nova Scotia made
widespread natural gas distribution in New Brunswick a realistic possibility for the first time. The
subsequent construction of a pipeline from Nova Scotia to Massachusetts – the Maritimes and
Northeast Pipeline (“M&NP”) – would traverse New Brunswick, presenting the opportunity to build
lateral transmission lines to communities deep into the province, including the Northeast and
Northwest. The province began to revise its natural gas policy formally in 1998 and solicited bidders
to distribute natural gas and amended its Gas Distribution Act in 1999. The MN&P pipeline became
operational in 2000.
At that time, New Brunswick had no existing gas distribution facilities and half of the province’s
approximately 756,600 people lived in rural areas.90
Residential, commercial and industrial energy
use was a mix of electricity, wood and refined petroleum. Diversifying energy supply was a policy
priority of New Brunswick’s provincial government, as the local economy was and is dependent on a
large, energy-intensive and resource-based manufacturing sector.91
Natural gas presented the
90 Very limited local production and distribution in Moncton had ceased operations in 1991. Source: New Brunswick.
Legislative Assembly. Select Committee on Energy. “Introduction.” First Report of the Select Committee on Energy: Natural
Gas for New Brunswick. Legislative Assembly, November 1998. Web. March 2015.
91 New Brunswick. Natural Resources and Energy. Energy Policy Working Group. “White Paper.” New Brunswick Energy
Policy. Natural Resources and Energy, 2000. Web. March 2015.
0%
10%
20%
30%
40%
50%
60%
70%
80%
90%
100%
0 20,000 40,000 60,000 80,000 100,000
Pe
rcent E
xpansio
n Fundin
g
Total Costs Per Customer ($s)
Percent Expansion Funding versus Total Costs
Per Customer
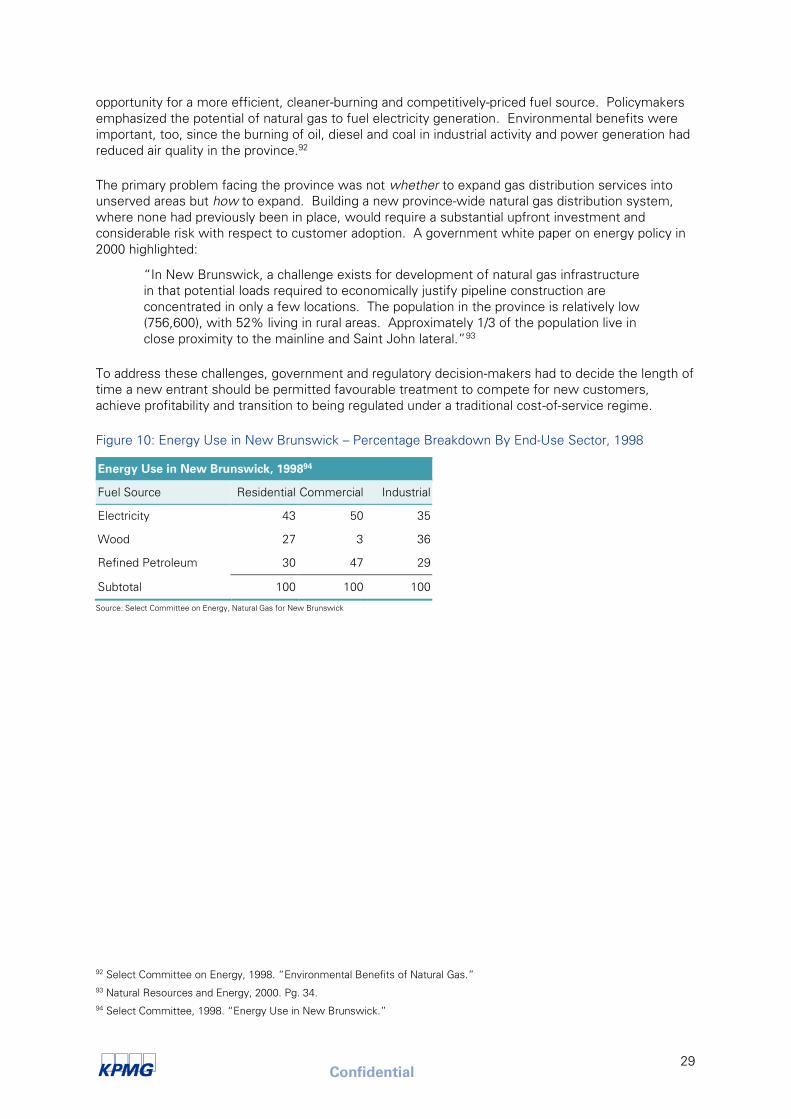
Confidential
29
opportunity for a more efficient, cleaner-burning and competitively-priced fuel source. Policymakers
emphasized the potential of natural gas to fuel electricity generation. Environmental benefits were
important, too, since the burning of oil, diesel and coal in industrial activity and power generation had
reduced air quality in the province.92
The primary problem facing the province was not whether to expand gas distribution services into
unserved areas but how to expand. Building a new province-wide natural gas distribution system,
where none had previously been in place, would require a substantial upfront investment and
considerable risk with respect to customer adoption. A government white paper on energy policy in
2000 highlighted:
“In New Brunswick, a challenge exists for development of natural gas infrastructure
in that potential loads required to economically justify pipeline construction are
concentrated in only a few locations. The population in the province is relatively low
(756,600), with 52% living in rural areas. Approximately 1/3 of the population live in
close proximity to the mainline and Saint John lateral.”93
To address these challenges, government and regulatory decision-makers had to decide the length of
time a new entrant should be permitted favourable treatment to compete for new customers,
achieve profitability and transition to being regulated under a traditional cost-of-service regime.
Figure 10: Energy Use in New Brunswick – Percentage Breakdown By End-Use Sector, 1998
Energy Use in New Brunswick, 199894
Fuel Source Residential Commercial Industrial
Electricity 43 50 35
Wood 27 3 36
Refined Petroleum 30 47 29
Subtotal 100 100 100
Source: Select Committee on Energy, Natural Gas for New Brunswick
92 Select Committee on Energy, 1998. “Environmental Benefits of Natural Gas.”
93 Natural Resources and Energy, 2000. Pg. 34.
94 Select Committee, 1998. “Energy Use in New Brunswick.”
Confidential
30
Figure 11: Location of Sable Island and Maritimes & Northeast Pipeline
Source: U.S. Securities and Exchange Commission
3.6.3 Proposed Solutions
To develop, on a greenfield basis, a completely new natural gas distribution system with service
across the province required a number of policy decisions and initiatives. The Legislative Assembly
of New Brunswick appointed a Select Committee on Energy (“Select Committee”) that held a broad
consultation, including a set of public hearings. In its final report, the Select Committee proposed,
among other things, that:
■ The provincial government should proceed to a formal Request For Proposals (“RFP”) process to
solicit bidders for a new gas distribution franchise;
■ Province-wide access to natural gas distribution services should be a key criterion in evaluating
proposals;
■ The government should evaluate bidders’ overall business plans and their ability to finance the
business over the long term;
■ The provincial government should avoid a broad policy of subsidies and incentives, with two
exceptions:
– The provincial government should “aggressively seek” financial support from the federal
government to extend gas availability in the province; and,
– The provincial government should provide a contribution in aid of construction to enable lateral
construction into Northeastern and Northwestern New Brunswick if markets in those areas
were inadequate to meet economic threshold tests; and
■ All consumption of natural gas in the province should be regulated under a broad definition of gas
distribution and be under provincial jurisdiction.
Confidential
31
With respect to the necessity to regulate natural gas in the province, the Select Committee advised:
“The committee recommends the [Public Utilities Board95
(“Board”)] be given
flexibility in the methods it uses to determine a distribution company's charges to
consumers. The Board should also have authority over such matters as revenue
cycle services, supplier of last resort, load balancing, and the possible use of
incentives in regulation.”96
3.6.4 Tools Used
The Gas Distribution Act, 1999 separated gas distribution (i.e., the local distribution system) from gas
sales (i.e., marketers). This separation was intended to promote competition in the retail market for
the natural gas commodity and to limit “undue influence on the market” by a single distribution
utility.97
Policymakers had decided that a single general franchise agreement, rather than the use of
multiple franchises, to serve all of New Brunswick would best accomplish the objective of uniform
distribution rates and customer penetration by reducing “cherry picking” for distribution territories in
densely-populated areas.98
To promote lateral expansions from the MN&P, legislation allowed for the
awarding of single end use franchises. These franchises were to be awarded by the Board and
intended solely for a single industrial facility.99
The province also retained the right to award local
producer franchises for specific geographical areas involved in producing natural gas in New
Brunswick.100
In 1999, Enbridge Gas New Brunswick (“EGNB”) won the Province’s RFP to develop, design,
construct, finance, operate, manage and maintain the proposed province-wide natural gas utility.
EGNB was awarded a general franchise to service the entire province until 2020. Its initial
projections were to serve 70,000 customers in 23 communities by the end of its franchise
agreement.
On June 23, 2000, the Board issued its decision on EGNB’s application for approval of its rates and
tariffs.101
The Board used a number of tools to provide EGNB with flexibility to expand into New
Brunswick, and each of these topics are discussed in more detail in the next section:
■ Streamlined regulatory processes;
■ Regulatory flexibility during the initial development period, including with respect to its length of
time;
■ A market-based approach to rates;
■ Rate riders during the development period;
■ Postponement of cost of service studies; and,
95 Also referred to at the time as the Board of Commissioners of Public Utilities and is now the New Brunswick Energy and
Utilities Board.
96 Select Committee, 1998. “Executive Summary.”
97 Ibid.
98 Natural Resources and Energy, 2000. Pg. 32-34.
99 Single use franchises were subsequently only granted to large industrial companies in the Saint John area. Source: Enbridge
Gas New Brunswick. “Independent Natural Gas Distribution Systems: In New Brunswick” About Us. (Corporate Website).
EGNB, 2014. Web. March 2015.
100 Today, Potash Corporation of Saskatchewan Inc., located in Sussex, New Brunswick, is listed on the New Brunswick
Energy and Utilities Board website as the sole Local Gas Producer Franchise Holder.
101 New Brunswick. Board of Commissioners of Public Utilities. “In the Matter of an Application by Enbridge Gas New
Brunswick Inc. for Approval of its Rates and Tariffs.” Decision. Board of Commissioners of Public Utilities, 23 June 2000. Web.
March 2015.
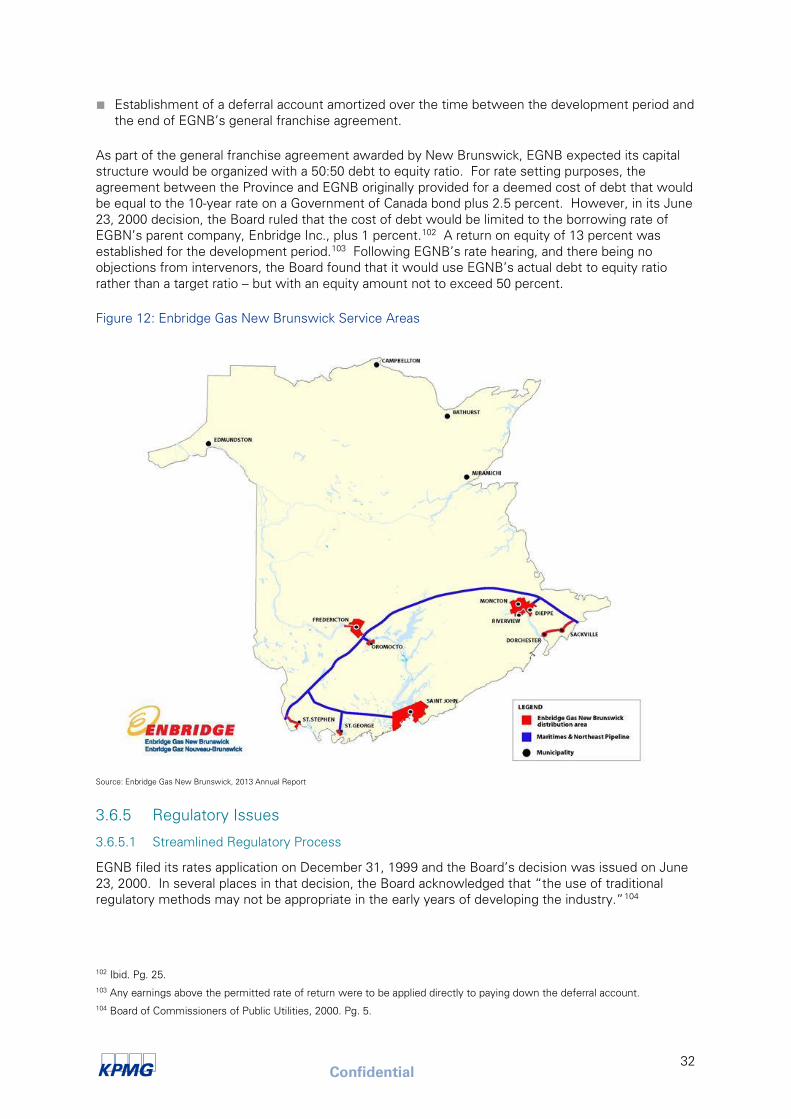
Confidential
32
■ Establishment of a deferral account amortized over the time between the development period and
the end of EGNB’s general franchise agreement.
As part of the general franchise agreement awarded by New Brunswick, EGNB expected its capital
structure would be organized with a 50:50 debt to equity ratio. For rate setting purposes, the
agreement between the Province and EGNB originally provided for a deemed cost of debt that would
be equal to the 10-year rate on a Government of Canada bond plus 2.5 percent. However, in its June
23, 2000 decision, the Board ruled that the cost of debt would be limited to the borrowing rate of
EGBN’s parent company, Enbridge Inc., plus 1 percent.102
A return on equity of 13 percent was
established for the development period.103
Following EGNB’s rate hearing, and there being no
objections from intervenors, the Board found that it would use EGNB’s actual debt to equity ratio
rather than a target ratio – but with an equity amount not to exceed 50 percent.
Figure 12: Enbridge Gas New Brunswick Service Areas
Source: Enbridge Gas New Brunswick, 2013 Annual Report
3.6.5 Regulatory Issues
3.6.5.1 Streamlined Regulatory Process
EGNB filed its rates application on December 31, 1999 and the Board’s decision was issued on June
23, 2000. In several places in that decision, the Board acknowledged that “the use of traditional
regulatory methods may not be appropriate in the early years of developing the industry.”104
102 Ibid. Pg. 25.
103 Any earnings above the permitted rate of return were to be applied directly to paying down the deferral account.
104 Board of Commissioners of Public Utilities, 2000. Pg. 5.
Confidential
33
Examples of traditional regulatory processes where the Board said it had been, or would be, flexible
include:
■ The Board asked parties to provide necessary information as quickly as possible to speed up
decision-making;
■ The Board established a committee process to resolve issues outside of the formal regulatory
process to speed up decision-making and to reduce cost; and,
■ The Board recognized that full public hearings on all rate changes could “add excessively” to the
costs of regulation.105
The Board also said that the regulatory framework described in its June 23, 2000 decision – which is
outlined in the other sub-sections below – would provide “the proper balance between minimizing
regulatory oversight and protecting the public interest.”106
3.6.5.2 Development Period
Transitioning from a greenfield situation to a developed natural gas distribution system involved a
number of risks. The price of natural gas fluctuated. There would be competition from existing
players, such as fuel oil distributors, who would seek to retain their customers. Significant losses
were expected in the initial years of development due to start-up costs. Therefore EGNB argued
before the Board that to respond to these potential issues it required flexibility for an extended period
of time. The period of time between the start of development and when the utility could be
regulated on a cost-of-service basis as a mature utility was deemed to be the development period.
To the Board, a mature utility implied one that could be expected to recover its full costs of service
on an ongoing basis. EGNB estimated this would take 8 years.
In response, the Board agreed that a development period was appropriate but it did not agree to the
initial 8-year request.107
Instead the Board set a five-year deadline of December 31, 2005, after which
the burden of proof would be on EGNB to justify an extension. The Board’s June 23, 2000 decision
notes that there was “considerable discussion” about how the end of the development period should
be determined. Samples of the criteria to be considered at a later time, in consultation with EGNB,
were:
■ Customer attachments;
■ Rate of return on equity;
■ Ability to forecast accurately;
■ Volumes of gas flowing; and,
■ Economic environment.
EGNB first applied to the Board in October 2004 to extend the development period from December
31, 2005, to December 31, 2010. In support of its application, EGNB cited lower levels of customer
conversion and throughput than originally forecast, as well as higher per-unit costs. The Board
granted this application and extended the development period to 2010.
In 2008, in advance of the expiry of the extended deadline in 2010, the Board scheduled a hearing to
address the issue of the development period. The purpose of the hearing, which was a public
proceeding, was to establish criteria for evaluating when the development period should end. In a
December 1, 2009 decision, the Board found that while issues like the ones listed above are
important considerations, they do not provide a basis by which to determine whether a developing
105 Ibid.
106 Ibid.
107 Ibid. Pg. 8.
Confidential
34
utility can be treated as a mature utility. Rather the Board devised a two-part test to distinguish
between development and maturity:108
■ Can the utility’s revenues recover its full costs on an annual basis?; and,
■ Are those revenues sustainable?
The first part of the test requires a comparison of revenues to costs – if revenues are equal to or
greater than costs, the first part of the test is satisfied. The second part of the test requires a
determination of whether or not revenues will continue to be equal to or greater than costs going
forward. In determining sustainability, the Board further explained:
“With respect to the appropriate period of time, the Board believes that use of a
forecast period of two years is reasonable. The Board finds that the rates that could
be charged on a sustainable basis are to be determined by using the approved rate
setting method in force at the time of performing the test.”109
In the Board’s 2009 decision, it directed EGNB to file evidence by January 2010 on:
■ The utility’s cost of service;
■ Proposed customer classes;
■ Proposed rate design;
■ Possible impacts of having different rate setting methods for different customer classes; and,
■ A 10-year forecast identifying:
– Number of customers for each class;
– Throughput for each class;
– Rates EGNB expects to charge;
– Costs for each major expense category; and,
– All other relevant information.110
Between the Board’s 2009 decision and the present, the legislative and regulatory context in which
EGNB operated changed, particularly with respect to how the deferral account (discussed in Section
3.6.5.6: Establishment of a Deferral Account below) is accounted for in setting rates. As a result, the
Board ordered EGNB to file a new application by June 1, 2015 to determine the expiry of the
development period.
3.6.5.3 Market-Based Approach to Rates
The market-based approach to rates proposed by EGNB, and subsequently approved by the Board,
worked by setting targets for the all-in delivered price of gas vis-à-vis competing fuel sources (e.g., 30
percent below fuel oil costs in the residential market for those customers that had previously used
fuel oil). The purpose of this approach, which would be applied on a “postage stamp” basis, was to
incentivize customer conversion. Targets were set separately for each customer class, based on
customers’ avoided cost of either electricity or fuel oil and on assumed efficiencies for conversion of
fuel or electricity to heat. While targets could be adjusted yearly to respond to market conditions,
EGNB could not charge its customers any more than the targets established for a given year.
108 New Brunswick. Energy and Utilities Board. “In the Matter of a Review of Issues Related to the Development Period for
Enbridge Gas New Brunswick Limited Partnership.” Decision. EUB, 1 December 2009. Web. March 2015.
109 Ibid. Pg. 5.
110 Energy and Utilities Board, 2009. Pg. 8.
Confidential
35
A challenge with the market-based rate structure is that it meant that the rates that could be charged
were very dependent on the commodity cost differential between natural gas and fuel oil. Natural
gas prices increased dramatically in the early years of the development period. As a consequence,
the all-in delivered cost of natural gas, particularly for residential consumers, was constrained by the
30 percent target savings required vis-à-vis fuel oil. This limited the amount that could be paid toward
distribution services, since natural gas commodity costs still had to be recovered within the overall
rate structure. The result of adverse commodity price movements was an increase in the distribution
costs accumulating in deferral accounts.
In recent years, even with the decline in natural gas commodity costs, prices to residential
consumers have continued to be constrained by the target price. Residential consumers therefore
did not appear to benefit from lower gas commodity costs. Rather, the decline reduced amounts that
were transferred to deferral accounts or that were borne by other customer classes. Distribution
tariffs collected from residential consumers have continued to be below those that should be charged
based on a full cost of service study, taking into account an appropriate allocation of costs among
individual customer classes. Other customer classes have paid more than their share of the utility’s
costs, resulting in significant cross-subsidization among classes. This is observed through revenue to
cost ratios that differ significantly from 1.0.111
This has recently resulted in some large customers,
notably Atlantic Wallboard Limited (“Atlantic Wallboard”), a subsidiary of J.D. Irving Ltd., seeking to
exit the system. In response to a May 2014 increase to its distribution rates, Atlantic Wallboard,
EGNB’s largest customer, announced it would replace gas supplied by EGNB’s system with
compressed natural gas supplied by truck, which is not prohibited under New Brunswick’s rules. The
company claims it can save one million dollars a year with the change.112
Delays in market penetration may also have been the result of decisions on market structure. As
noted above, the province implemented an open-access retail market as part of the new industry
structure. The province envisaged that multiple retailers would compete for commodity supply and
for related services, such as the sale of new gas appliances and furnaces. EGNB was therefore
limited to the “default” supply of natural gas commodity and rules limited its ability to provide
services that might be construed as providing unfair competition to retail energy suppliers. It can be
argued that these constraints limited EGNB’s ability to promote natural gas conversion.
3.6.5.4 Rate Riders During the Development Period
The Board approved the potential use of rate riders during the development period. This was meant
to provide further flexibility to incentivize customer conversion. Rate riders were intended to be
negative and used as necessary to provide further price reductions to one or more rate classes if
required to respond to changing market conditions. Any shortfalls associated with the use of rate
riders would be added to the deferral account. In 2014, in response to the changes in how the
deferral account was accounted for in rate setting, EGNB requested and the Board approved the
discontinuation of rate riders.
3.6.5.5 Postponed Cost of Service Studies
The Board granted EGNB’s request to delay filing cost of service studies (revenue-to-cost ratios) until
closer to the end of the development period. EGNB argued, and the Board agreed, that they would
be of limited practical value at the beginning of greenfield development.
111 Enbridge Gas New Brunswick. “Section 1.0 Application.” Review of 2013 Regulatory Financial Statements/ 2015 Rate
Application. Enbridge Gas New Brunswick, 27 June 2014. Web. March 2015. Pg. 4.
112 K100 News. “Enbridge loses big customer.” K100.ca. 26 May 2014. Web. March 2015.
Confidential
36
3.6.5.6 Establishment of a Deferral Account
In recognition that EGNB’s costs would be greater than revenues during the early years of the
development period, the Board ruled that these costs could be deferred for recovery in the future.
EGNB had originally proposed a 40-year amortization period and the use of two deferral accounts113
:
■ A Pricing Deferral Account (“PDA”);
– Including the deficiency caused by the Target Rates being established at a level that did not
recover the full cost of service; and,
– Including the deficiency resulting from the Actual Rates being lower than the Target Rates
after Rate Riders had been used during the year; and,
■ A Forecast Discrepancies Account (“FDDA”).
– Including the differences between actual and forecast revenues and cost of service that did not
take into account any rate reduction that EGNB had to make to the Target Rates during the
year which had to be captured in the PDA.
However the Board denied these requests. There was “no justification” for separating the deferral
account “particularly for regulatory purposes”. Instead the Board directed EGNB to establish one
deferral account to record differences between Board-approved revenue requirements and the actual
revenue EGNB received. The Board also expressed concern that, with respect to the amortization
timeline, “such a long period of amortization will not necessarily be in the best interests of
consumers.”114
The Board ruled instead that the deferral account would be required to be cleared by
the end of EGNB’s general franchise agreement in 2020.
Through the deferral account, costs that could not be recovered from consumers in the early periods,
given the need to keep rates at or below target levels, would be deferred until future years for
recovery then. The deferral account recognized the reality that EGNB’s total annual Revenue
Requirement, based on cost of service principles, was greater than the actual revenues that could be
raised from consumers in the early years. This reflects the fact that, while in the development
period, the company had made large investments in new physical plant but still had a limited number
of customers from whom to collect the associated costs. Amounts transferred to the deferral
account were allowed to accrue interest at a rate equal to the utility’s deemed cost of capital. This
was to ensure that EGNB would be compensated for the delay in receipt of associated revenues.
As noted above, as a result of lower levels of customer conversion, less throughput and higher per-
unit costs than originally forecast, EGNB applied to the Board in October 2004 to extend both the
development period and the amortization period of the deferral account. EGNB argued extending the
deferral account amortization timeline from the end of the franchise agreement in 2020 to the year
2040 was required because:
“It has become practically impossible for EGNB, without violating essential precepts
of EGNB’s rate/ business model, to recover the Deferral Account before the end of
the term of the initial General Franchise Agreement.”115
EGNB argued that in order to pay down the deferral account by 2020 it would require the utility to
charge rates in excess of the market-based approach, thereby making the challenges facing the utility
even worse. The Board ruled in favour of EGNB’s request. In its decision, the Board noted the
113 Information summarized from the Board’s June 23, 2000 decision. Pg. 29.
114 Ibid. Pg. 31-32.
115 Enbridge Gas New Brunswick. Application to Extend the Development Period and the Deferral Account Recovery Period.
EGNB, 8 October 2004. Web. March 2015.
Confidential
37
discrepancy between what EGNB had originally forecasted as the peak amount of the deferral
account ($13 million) and the forecasted peak at that time, which was $132.9 million.116
3.6.6 Outcomes
Today EGNB has approximately 12,000 customers in 10 New Brunswick communities, but its
distribution system was built to serve a total of 30,000 homes and businesses.117
The company’s
investment totalled more than $400 million and included construction of approximately 800
kilometres of distribution pipeline.118
However EGNB’s original proposal estimated that the utility
could reach 70,000 consumers in 23 communities by the end of its franchise agreement in 2020.
Hence, distribution build-out and market penetration have been much lower than were originally
forecast.
Fuel-switching was slow to start in New Brunswick, and the specific causal factors have been
debated in the years since. Contributing factors that have been cited include:
■ The prevalence of many sparsely-populated communities, which increased the time and cost
required to build out the distribution system and meant that fewer customers were passed by the
system;
■ The presence of existing home heating systems, such as electric baseboard, which increased
customers’ costs for conversion;
■ Customer adoption projections that did not materialize;
■ The structure of franchise agreements;
■ Market-based rate structures;
■ EGNB’s build-out plans; and,
■ Lack of effective regulatory and legislative oversight.119
From the perspective of the utility, a consequential decision was made early in New Brunswick’s
attempts to provide natural gas distribution. The Select Committee proposed, and changes to The
Natural Gas Act included, the segregation of franchise agreements into three types:
■ General Franchise Agreement – a franchise to distribute gas throughout New Brunswick;
■ Single End Use Franchise – a franchise granted to a specific industrial facility; and,
■ Local Gas Producer Franchise -- a franchise granted to a local gas producer.
In its 2011 submission to the New Brunswick Energy Commission, EGNB argued:
“The New Brunswick natural gas distribution system operates under highly unusual
conditions with the existence of single end use franchises that allow several large
industrial users, representing more than 80 percent of the natural gas consumed in
the province, to entirely bypass the system. Virtually all natural gas distribution
systems in North America have been developed without single end use franchises.
Consequently, these large users have never contributed to the development of the
116 New Brunswick. Board of Commissioners of Public Utilities. “In the Matter of an Application dated October 8, 2004 to
Request Extension of the Development Period and the Deferral Account Recovery Period.” Decision. Board of Commissioners
of Public Utilities, 21 January 2005. Web. March 2015.
117 Enbridge Inc. Annual Report. Enbridge, 2013. Web. March 2015; and Enbridge Gas New Brunswick. “Natural Gas: A
Strategic Piece of the Energy Puzzle.” Submission to the New Brunswick Energy Commission. EGNB, 2011. Web. March
2015.
118 Ibid.
119 Atlantica Centre for Energy. “A Clean Break: Resetting the Natural Gas.” Distribution System in New Brunswick: Economic
Development & the Public Interest. Atlantica Centre for Energy, 3 June 2011. Web. March 2015.
Confidential
38
distribution system which has had a profound effect on how the system has
developed to date.”120
The original rationale for this market structure, as explained in a year 2000 New Brunswick
Department of Natural Resources and Energy white paper:
“The objective is to encourage large industrial customers to act as anchor loads in
securing laterals and serves to satisfy the Province’s desire to use the Maritimes and
Northeast Pipeline lateral policy for as long as it is in effect. The single end use
franchise fee was set at $50,000 annually, indexed to the consumer price index. This
amount was determined as sufficiently large to ensure that small and medium-sized
consumers would find value in being served by the distribution company while not
being so high as to negatively impact the likelihood that large customers would
become anchor loads to the laterals. In support of developing a safe and effective
natural gas industry in New Brunswick, the Province will direct all franchise fees to
help defray expenses of the Board, particularly for costs associated with pipeline
safety.”121
From the government’s perspective, the issue of high distribution rates and low customer adoption
was attributable to the continued use of market-based rate targets instead of the cost-of-service
structure of mature markets. The unintended consequence, according to the Province’s 2011 Energy
Blueprint was that “the benefits of current and projected future low gas commodity prices are not
being passed onto the consumer.”122
As a response, the Government of New Brunswick tabled legislation in 2011 to change the way
EGNB’s rates were regulated, which in turn had the effect of disqualifying EGNB from using rate-
regulated accounting.123
EGNB was no longer allowed to build recovery of certain deferred costs into
its rates going forward. This change resulted in EGNB writing off $262 million worth of assets. The
company initiated legal proceedings against the Province for damages in breach of its contract.
These proceedings continue to the present time.
3.6.7 Observations
Experiences with Enbridge Gas New Brunswick show the challenges of building a completely new
distribution system on a greenfield basis. For example:
■ EGNB’s initial financial projections were built on the assumption that revenue shortfalls in the
early years, relative to the utility’s Revenue Requirement under traditional cost of service
methods, could be deferred for recovery in later years. When circumstances changed such that
shortfalls grew relative to forecast, this resulted in a rapid growth in deferral accounts to the point
where they could no longer be easily recovered.
■ Capital expansion costs proved to be higher than initially forecast. This was partly because of
challenges associated with the local topography. Capital cost increases put additional pressure on
the relative competitive position of natural gas service versus alternative, incumbent fuels and had
a negative effect on the utility’s financial position.
■ The market-based rate structure resulted in large losses in the early franchise years and, in later
years, the perception that savings from low gas commodity prices were not being passed onto
consumers, which created a negative public perception toward natural gas fuel-switching.
120 EGNB, 2011. Pg. 6.
121 Natural Resources and Energy, 2000. Pg. 30.
122 New Brunswick. Department of Energy. The New Brunswick Energy Blueprint. Department of Energy, October 2011. Web.
March 2015. Pg. 26.
123 Enbridge Inc., 2013. Pg. 77.

Confidential
39
■ Multiple franchises allowed industrial customers to by-pass EGNB’s system. These customers
could have been used as anchor loads, able to contribute to the development of the distribution
system. An anchor load could have stabilized the financial performance of the utility service
provider and potentially reduced the quantum of costs subject to deferral.
Confidential
40
4 Observations
Based on our review of experiences with natural gas distribution system expansion in six other North
American jurisdictions – Alaska, Connecticut, Maine, New York, North Carolina and New Brunswick –
we provide a number of observations as outlined below. These observations may assist the Board in
its consideration, as per its letter of February 18, 2015, regarding regulatory flexibility pertaining to
proposed system expansion projects.
4.1 Summary Findings
■ Although the extension of natural gas service to rural, remote or sparsely-populated unserved or
underserved areas was a policy priority in all six case studies, no jurisdiction we evaluated was
prepared to deviate significantly from the practice of using an economic test – based on a net
present value calculation or similar metric – for determining whether a proposed expansion project
should be approved. Policymakers and regulators were therefore challenged by the need to
mitigate the upfront capital cost of expanding service, to encourage customer conversions and to
maintain a rate structure that reflected well-established cost allocation and rate-design principles.
■ We did not observe an explicit preference in the jurisdictions examined for inviting new entrants,
creating new service territories or using municipally-based systems to address a lack of service in
rural areas. In Alaska and Maine, new entrants competed alongside incumbents and were
awarded franchise areas based on the merit of their respective proposals. In Connecticut, New
York and North Carolina, the tools and approaches used to encourage the extension of natural gas
service either favoured or were directed at incumbents. This may reflect the economies of scale
typically associated with network monopolies such as natural gas distribution, even when service
is being expanded into unserved areas.
■ While broader public policy goals were important to local decision-makers in all of the jurisdictions
we examined, decision-makers were generally not willing to broadly socialize the costs associated
with extending service to areas that did not pass the economic test over the existing natural gas
distribution grid and existing natural gas distribution customers. The tools and approaches used in
each of the case studies we examined implicitly recognized that customers have access to
alternative fuels. As such, the overall system cost, on a bundled basis, needed to remain
competitive with alternative energies.
■ There was an emphasis across jurisdictions on identifying and prioritizing industrial, commercial or
institutional anchor loads. These large-scale users of natural gas, with consistent and predictable
consumption, served as the basis for further retail-oriented expansion in a given area. Anchor
customers often are in a position to make long-term commitments to natural gas service, see
significant savings from conversion early and can help to defray a large portion of the expansion
costs.
■ With the exception of North Carolina, where certain refunds/ monies were made available to
natural gas distributors from the upstream transportation sector, none of the jurisdictions we
examined were willing to impose a surcharge or subsidy on the commodity cost of natural gas to
fund system expansions. This is consistent with the evolution of rate regulation such that
commodity costs are generally a straight pass through to customers without mark-up, and
distribution system costs are determined on a stand-alone basis.
■ Regulatory commissions have approved expansion programs in response to executive or
legislative mandates, requests from existing franchised utilities or from potential new entrants or
on their own initiative. To facilitate expansion efforts, regulators experimented with time-limited,
project-specific innovations that demonstrated flexibility with respect to (i) relaxed criteria for
approving expansion; (ii) inclusion of future construction financing through temporary surcharges;
(iii) extended development periods to achieve profitability; and, (iv) new entrants willing to accept
reduced rates of return on equity.
Confidential
41
■ A move to more transparent reporting was a feature of the policy frameworks in Connecticut,
New York and North Carolina. The policymakers or regulators asked for periodic reporting on the
number of requests received from potential customers in unserved or underserved areas (e.g.,
anchor loads, rural communities). This allowed policy makers to review progress toward intended
goals and aided in modifying new approaches during the early stages of expansion programs.
■ Examples of government assistance and the levels of public funding, if applicable, varied from
jurisdiction to jurisdiction and over time. Some jurisdictions were willing to use the government’s
ability to borrow at lower rates in order to help finance expansion projects, thereby reducing
utilities’ weighted average cost of capital. In turn, a requirement for lower returns improves
outcomes under existing economic tests associated with new service expansions. Other
examples of government support included direct on-lending of funds raised through public
sources and indirect grants funded outside of target development areas.
■ Extending gas distribution systems into unserved or underserved areas has a risk profile that is
greater than the risk of the existing system, on average. Extensions potentially span multiple
years and rate-setting cycles. Project risks include (i) lower than forecast customer conversions;
(ii) under-recovery of the revenue requirement associated with the cost of service, including the
return on and of capital, and the potential stranding of assets and of regulatory deferral accounts;
(iii) capital cost overruns; (iv) policy risk; and, (v) regulatory risk.
■ With the exception of the major greenfield development in New Brunswick, we did not observe
an extensive use of deferral and variance accounts to postpone the recovery of costs associated
with natural gas system expansions. As noted in our section on New Brunswick, reliance on
deferral accounts can create significant financial challenges when actual results vary from
forecast.
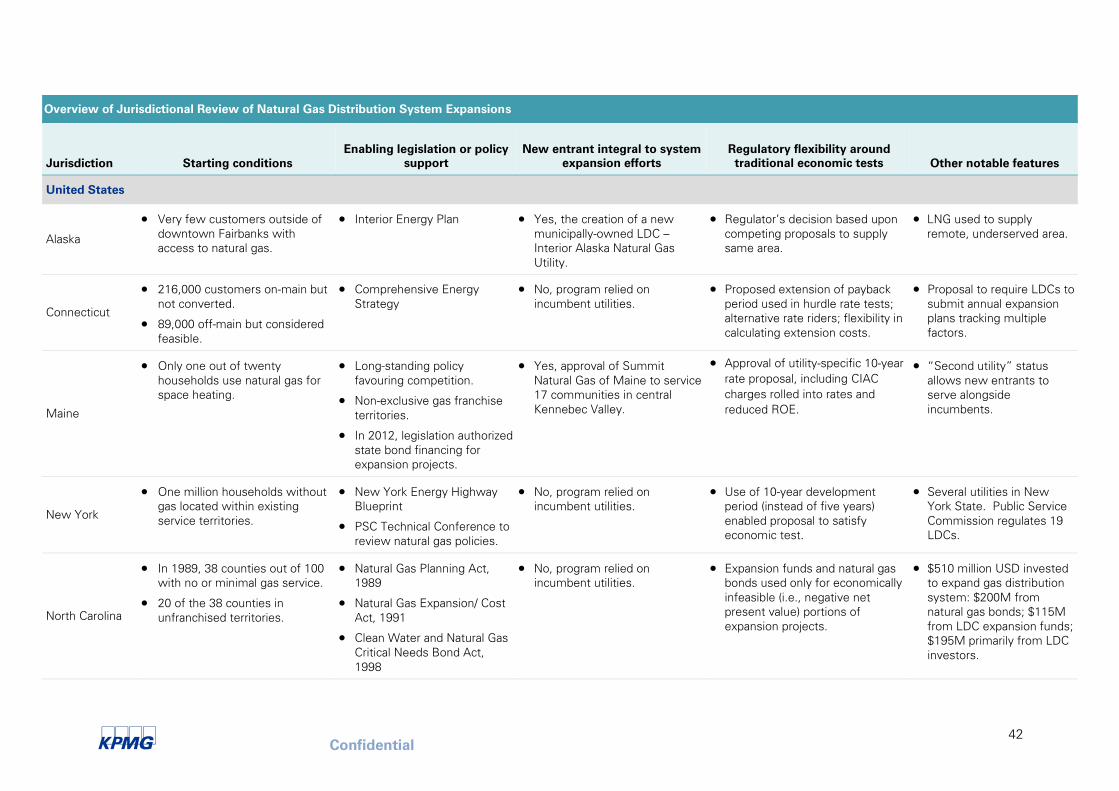
Confidential
42
Overview of Jurisdictional Review of Natural Gas Distribution System Expansions
Jurisdiction Starting conditions
Enabling legislation or policy
support
New entrant integral to system
expansion efforts
Regulatory flexibility around
traditional economic tests Other notable features
United States
Alaska
Very few customers outside of
downtown Fairbanks with
access to natural gas.
Interior Energy Plan Yes, the creation of a new
municipally-owned LDC –
Interior Alaska Natural Gas
Utility.
Regulator’s decision based upon
competing proposals to supply
same area.
LNG used to supply
remote, underserved area.
Connecticut
216,000 customers on-main but
not converted.
89,000 off-main but considered
feasible.
Comprehensive Energy
Strategy
No, program relied on
incumbent utilities.
Proposed extension of payback
period used in hurdle rate tests;
alternative rate riders; flexibility in
calculating extension costs.
Proposal to require LDCs to
submit annual expansion
plans tracking multiple
factors.
Maine
Only one out of twenty
households use natural gas for
space heating.
Long-standing policy
favouring competition.
Non-exclusive gas franchise
territories.
In 2012, legislation authorized
state bond financing for
expansion projects.
Yes, approval of Summit
Natural Gas of Maine to service
17 communities in central
Kennebec Valley.
Approval of utility-specific 10-year
rate proposal, including CIAC
charges rolled into rates and
reduced ROE.
“Second utility” status
allows new entrants to
serve alongside
incumbents.
New York
One million households without
gas located within existing
service territories.
New York Energy Highway
Blueprint
PSC Technical Conference to
review natural gas policies.
No, program relied on
incumbent utilities.
Use of 10-year development
period (instead of five years)
enabled proposal to satisfy
economic test.
Several utilities in New
York State. Public Service
Commission regulates 19
LDCs.
North Carolina
In 1989, 38 counties out of 100
with no or minimal gas service.
20 of the 38 counties in
unfranchised territories.
Natural Gas Planning Act,
1989
Natural Gas Expansion/ Cost
Act, 1991
Clean Water and Natural Gas
Critical Needs Bond Act,
1998
No, program relied on
incumbent utilities.
Expansion funds and natural gas
bonds used only for economically
infeasible (i.e., negative net
present value) portions of
expansion projects.
$510 million USD invested
to expand gas distribution
system: $200M from
natural gas bonds; $115M
from LDC expansion funds;
$195M primarily from LDC
investors.
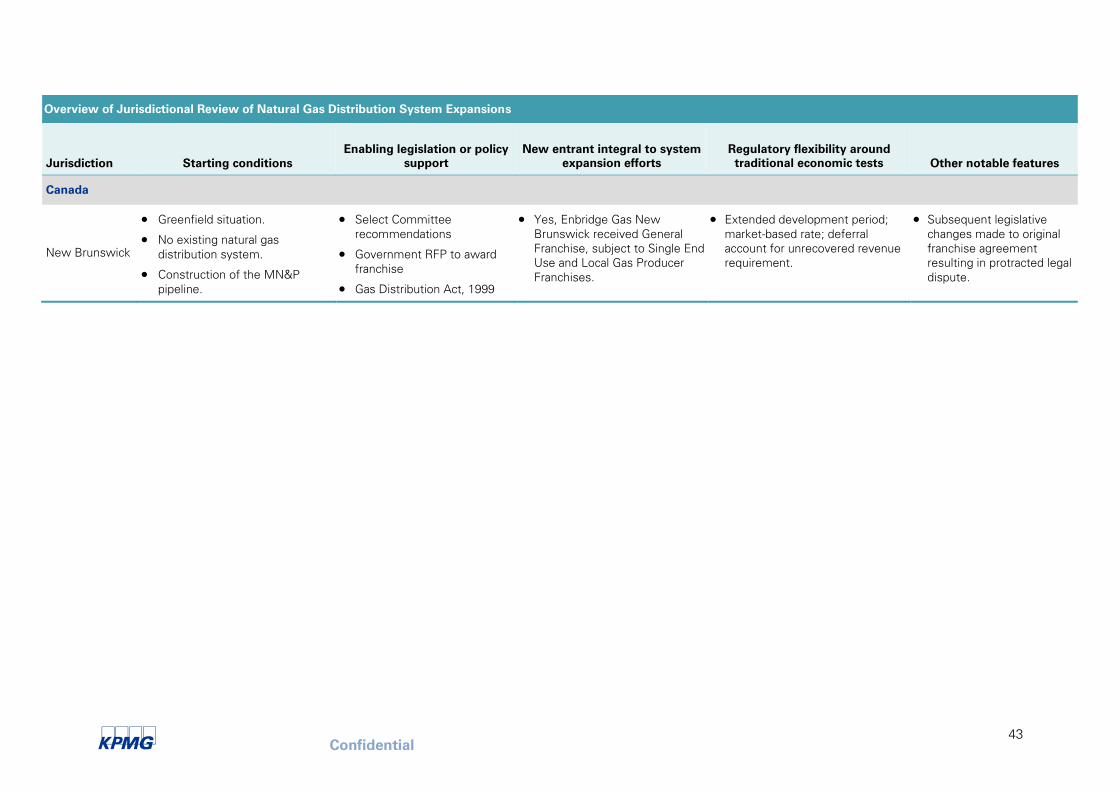
Confidential
43
Overview of Jurisdictional Review of Natural Gas Distribution System Expansions
Jurisdiction Starting conditions
Enabling legislation or policy
support
New entrant integral to system
expansion efforts
Regulatory flexibility around
traditional economic tests Other notable features
Canada
New Brunswick
Greenfield situation.
No existing natural gas
distribution system.
Construction of the MN&P
pipeline.
Select Committee
recommendations
Government RFP to award
franchise
Gas Distribution Act, 1999
Yes, Enbridge Gas New
Brunswick received General
Franchise, subject to Single End
Use and Local Gas Producer
Franchises.
Extended development period;
market-based rate; deferral
account for unrecovered revenue
requirement.
Subsequent legislative
changes made to original
franchise agreement
resulting in protracted legal
dispute.
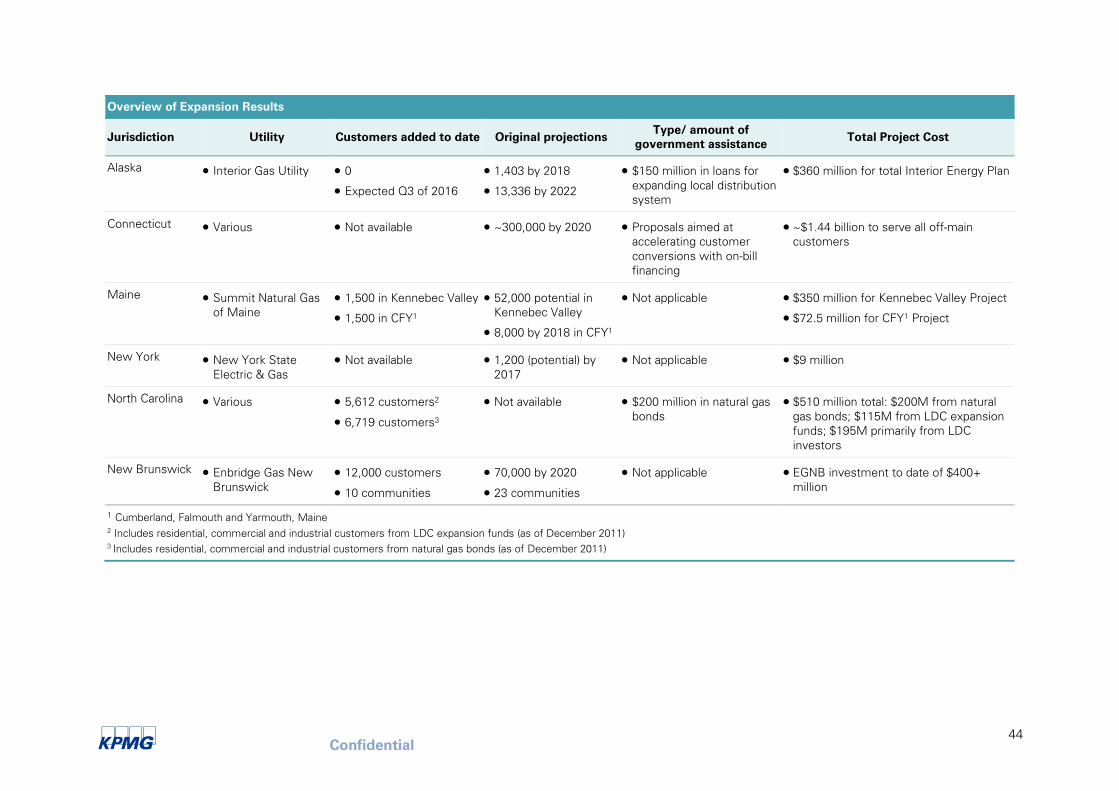
Confidential
44
Overview of Expansion Results
Jurisdiction Utility Customers added to date Original projections Type/ amount of
government assistance Total Project Cost
Alaska Interior Gas Utility 0
Expected Q3 of 2016
1,403 by 2018
13,336 by 2022
$150 million in loans for
expanding local distribution
system
$360 million for total Interior Energy Plan
Connecticut Various Not available ~300,000 by 2020 Proposals aimed at
accelerating customer
conversions with on-bill
financing
~$1.44 billion to serve all off-main
customers
Maine Summit Natural Gas
of Maine
1,500 in Kennebec Valley
1,500 in CFY1
52,000 potential in
Kennebec Valley
8,000 by 2018 in CFY1
Not applicable $350 million for Kennebec Valley Project
$72.5 million for CFY1 Project
New York New York State
Electric & Gas
Not available 1,200 (potential) by
2017
Not applicable $9 million
North Carolina Various 5,612 customers2
6,719 customers3
Not available $200 million in natural gas
bonds
$510 million total: $200M from natural
gas bonds; $115M from LDC expansion
funds; $195M primarily from LDC
investors
New Brunswick Enbridge Gas New
Brunswick
12,000 customers
10 communities
70,000 by 2020
23 communities
Not applicable EGNB investment to date of $400+
million
1 Cumberland, Falmouth and Yarmouth, Maine
2 Includes residential, commercial and industrial customers from LDC expansion funds (as of December 2011)
3 Includes residential, commercial and industrial customers from natural gas bonds (as of December 2011)
Confidential
45
5 Bibliography
Alaska. Legislature. Senate. An Act Relating to development project financing by the Alaska Industrial
Development and Export Authority… (SB 23) 2013 Reg. Sess. (12 April 2013) Alaska State
Legislature. Web. March 2015.
Alaska. Regulatory Commission of Alaska. Docket: U-13-103. Order Denying Application of Fairbanks
Natural Gas, LLC To Amend Certificate of Public Convenience and Necessity and Granting,
With Condition, Application of Interior Alaska Natural Gas Utility for Certificate of Public
Convenience and Necessity. Order No. 19. (Dated and Effective 20 December 2013). Web.
March 2015.
Alaska Industrial Development and Export Authority. Interior Energy Project. Anchorage: Alaska
Industrial Development and Export Authority, 19 February 2015. Web. March 2015.
Alaska Industrial Development and Export Authority. Alaska Interior Energy Plan. Anchorage: Alaska
Industrial Development and Export Authority, 22 February 2013. Web. March 2015.
Alaska Department of Natural Resources. Division of Oil & Gas. “Financial Incentives and Tax Credit
Programs.” Exploration Incentives. Anchorage: Alaska Department of Natural Resources,
2013. Web. March 2015.
Alberta. Legislative Assembly. Gas Distribution Act. (4 November 2008) Legislative Assembly of
Alberta. Web. March 2015.
Atlantica Centre for Energy. “A Clean Break: Resetting the Natural Gas.” Distribution System in New
Brunswick: Economic Development & the Public Interest. Saint John: Atlantica Centre for
Energy, 3 June 2011. Web. March 2015.
Bartos, Melissa. “Regulatory Policy and Residential Main Extensions.” Presentation to the Northeast
Gas Association’s Sales & Marketing Conference. [Marlborough, MA]: Concentric Energy
Advisors, 15 March 2013. Web. March 2015.
Cardno ENTRIX. Fairbanks LNG Distribution System Demand Analysis. Cardno ENTRIX, 14 January
2014. Web. March 2015.
Cole, Dermot. “State agency to purchase Fairbanks natural gas utility.” Alaska Dispatch News. 28
January 2015. Web. March 2015.
Cole, Dermot. “Beefy state loans energize efforts to expand natural gas distribution in Fairbanks.”
Alaska Dispatch News. 4 April 2014. Web. March 2015.
Connecticut. Connecticut Public Utilities Regulatory Authority. Docket Number: 13-06-02.
Connecticut’s Gas LDCs Joint Natural Gas Infrastructure Expansion Plan. Public Utilities
Regulatory Authority, 14 June 2013. Web. March 2015.
Connecticut. Department of Energy and Environmental Protection. 2013 Comprehensive Energy
Strategy for Connecticut. Hartford: Department of Energy and Environmental Protection, 19
February 2013. Web. March 2015.
Costello, Ken. “Expanding Gas Service: Developments and Considerations.” Presentation to National
Association of Regulatory Utility Commissioners Staff Subcommittee on Gas. Meeting held
in Washington, D.C., 3 February 2013. Web. March 2015.
Costello, Ken. Line Extensions for Natural Gas: Regulatory Considerations. Report No. 13-01.
Confidential
46
Silver Spring: National Regulatory Research Institute, 2013. Web. March 2015.
DaSilva, Staci. “NYSEG Announces Major Gas Line Expansion In Plattsburgh.” My Champlain Valley.
22 October 2014. Web. March 2015.
Delaware. Governor’s Energy Advisory Council. Delaware Energy Plan 2009‐2014. Dover: Office of
Governor Jack Markell, 26 March 2009. Web. March 2015.
Dodge, Matt. “Natural gas battle moves to greater Portland.” Mainebiz.com. 5 February 2013. Web.
March 2015.
Dodge, Matt. “2 firms battle over Kennebec Valley natural gas market.” Mainebiz.com. 7 January
2013. Web. March 2015.
Enbridge Inc. Annual Report. Calgary: Enbridge, 2013. Web. March 2015.
Enbridge Gas New Brunswick. “Section 1.0 Application.” Review of 2013 Regulatory Financial
Statements/ 2015 Rate Application. Fredericton: Enbridge Gas New Brunswick, 27 June
2014. Web. March 2015.
Enbridge Gas New Brunswick. “Natural Gas: A Strategic Piece of the Energy Puzzle.” Submission to
the New Brunswick Energy Commission. Fredericton: Enbridge Gas New Brunswick, 2011.
Web. March 2015.
Enbridge Gas New Brunswick. Application to Extend the Development Period and the Deferral
Account Recovery Period. Fredericton: Enbridge Gas New Brunswick, 8 October 2004. Web.
March 2015.
Federation of Alberta Gas Co-ops Ltd. “Federation History.” Who We Are. Sherwood Park:
Federation of Alberta Gas Co-ops Ltd., 2015. Web. March 2015.
Federation of Alberta Gas Co-ops Ltd. “Rural Gas Grant Program.” Public Info. Sherwood Park:
Federation of Alberta Gas Co-ops Ltd., 2015. Web. March 2015.
Haapaniemi, Peter. “Expanding the Reach of the Gas Infrastructure.” American Gas Magazine.
November 2013. Web. March 2015.
Harder, Chuck. “Infrastructure Issues (Pipeline Safety, Replacement, Expansion) & Cybersecurity.”
Presentation to National Association of Regulatory Utility Commissioners Staff
Subcommittee on Accounting & Finance. Spring 2013 Meeting held during 21-25 April 2013
in Oklahoma City. Houston: Centerpoint Energy, 2013. Web. March 2015.
Hussain, Yadullah. “Hawaiian deal shows possibilities for Canadian LNG as crunch time nears.”
Financial Post. 4 September 2014. Web. March 2015.
Kaplan, Thomas. “Citing Health Risks, Cuomo Bans Fracking in New York State.” New York Times.
17 December 2014. Web. March 2015.
Leatherstocking Gas Company, LLC. Case numbers 15-G-0098 and 15-G-0099. Verified Petition.
Albany: New York State Public Service Commission, 20 February 2015. Web. March 2015.
LePage, Paul. 2013 State of the State Address. Augusta: State of Maine, 5 February 2013. Web.
March 2015.
K100 News. “Enbridge loses big customer.” K100.ca. 26 May 2014. Web. March 2015.
Maine. Town of Cumberland. Item 12-177. “Request for Proposals: Natural Gas Distribution Pipeline
Confidential
47
& Utility Service.” Towns of Cumberland, Falmouth and Yarmouth. Town of Cumberland, 12
October 2012.
Maine. Town of Falmouth. “Information.” Natural Gas Project. FalmouthMe.org. Web. March 2015.
Maine. Town of Falmouth. Natural Gas Distribution Expansion Project Update. Town of Falmouth,
December 2013. Web. March 2015.
Maine. Maine Public Utilities Commission. Docket No. 2012-258. Order Approving Stipulation. Maine
Public Utilities Commission, 29 January 2013. Web. March 2015.
Maine. Maine Public Utilities Commission. Docket No. 2012-258. Order Granting Conditional
Authority and Denying Motion to Dismiss. Maine Public Utilities Commission, 17 October
2012. Web. March 2015.
Maine. Legislature. An Act to Expand the Availability of Natural Gas to Maine Residents. (LD 1644)
2012 Reg. Sess. (29 March 2012). Maine State Legislature. Web. March 2015.
Marple, Cynthia J. "Financing Natural Gas Expansions and Line Extensions." Presentation to National
Association of Regulatory Utility Commissioners Staff Subcommittee on Gas. Meeting held
in Washington, D.C., 3 February 2013. Web. March 2015.
McCloskey, Tanya J. “Extension Of Natural Gas Service.” Testimony before the Pennsylvania House
Consumer Affairs Committee. Harrisburg: Pennsylvania House Consumer Affairs Committee,
13 March 2013. Web. March 2015.
Michigan. Michigan Public Service Commission. Operations and Wholesale Markets Division. Gas
Operations Section. Natural Gas in Michigan. Lansing: Michigan Public Service Commission,
11 May 2012. Web. March 2015.
Minnesota. Minnesota Public Utilities Commission. Docket No. G-002/M-95-519. “In the Matter of a
Request by Northern States Power Gas Utility for a Miscellaneous Rate Change to Establish
a New Area Surcharge for Customers in the Community of Glyndon, Minnesota.” Order
Approving New Area Surcharges and Requiring Revised Tariff Sheet. Saint Paul: Minnesota
Public Utilities Commission, 22 November 1995. Web. March 2015.
National Association of Regulatory Utility Commissioners. Committee on Gas and the Committee on
Critical Infrastructure. Resolution Encouraging Natural Gas Line Investment and the
Expedited Replacement of High-Risk Distribution Mains and Service Lines. Adopted by the
NARUC Board of Directors on 24 July 2013. Web. March 2015.
National Association of State Energy Officials. An Overview of Statewide Comprehensive Energy
Plans: 2002 to 2011. Arlington: National Association of State Energy Officials, 2013. Web.
March 2015.
Nebraska. Legislature of Nebraska. An Act relating to jurisdictional utilities… (LB 1115) 2012 2nd
Session. Legislature of Nebraska. Web. March 2015.
New Brunswick. Board of Commissioners of Public Utilities. “In the Matter of an Application dated
October 8, 2004 to Request Extension of the Development Period and the Deferral Account
Recovery Period.” Decision. Saint John: Board of Commissioners of Public Utilities, 21
January 2005. Web. March 2015.
New Brunswick. Board of Commissioners of Public Utilities. “In the Matter of an Application by
Enbridge Gas New Brunswick Inc. for Approval of its Rates and Tariffs.” Decision. Saint
John: Board of Commissioners of Public Utilities, 23 June 2000. Web. March 2015.
Confidential
48
New Brunswick. Department of Energy. The New Brunswick Energy Blueprint. Fredericton:
Department of Energy, October 2011. Web. March 2016.
New Brunswick. Energy and Utilities Board. “In the Matter of a Review of Issues Related to the
Development Period for Enbridge Gas New Brunswick Limited Partnership.” Decision. Saint
John: Energy and Utilities Board, 1 December 2009. Web. March 2015.
New Brunswick. Legislative Assembly. Select Committee on Energy. First Report of the
Select Committee on Energy: Natural Gas For New Brunswick. Fredericton: Legislative
Assembly, November 1998. Web. March 2015.
New Brunswick. Natural Resources and Energy. Energy Policy Working Group. “White Paper.” New
Brunswick Energy Policy. Fredericton: Natural Resources and Energy, 2000. Web. March
2015.
New Jersey. 2011 New Jersey Energy Master Plan. Trenton: State of New Jersey, 6 December
2011. Web. March 2015.
New York. New York Energy Highway Task Force. New York Energy Highway Blueprint. Albany: New
York Energy Highway Task Force, 15 November 2012. Web. March 2015.
New York. New York Energy Planning Board. “Shaping the Future.” New York State Energy Plan.
Volume 1. 2014 Draft. Albany: New York Energy Planning Board, 2014. Web. March 2015.
New York. New York State Public Service Commission. Case 12-G-0499. “Petition of New York State
Electric & Gas Corporation to Amend its Certificate of Public Convenience and Necessity and
to Exercise a Gas Franchise in the Town of Plattsburgh, Clinton County, New York.” Order
Amending Certificate of Public Convenience and Necessity and Requiring System
Improvements. Albany: New York Public Service Commission, 29 July 2014. Web. March
2015.
New York. New York State Public Service Commission. Case 12-G-0297. Natural Gas Expansion –
Presentations from the Jan. 9, 2013 Technical Conference. Albany: New York State Public
Service Commission, 2013. Web. March 2015.
New York. New York State Public Service Commission. Case 12-G-0297. “Proceeding on Motion of
the Commission to Examine Policies Regarding the Expansion of Natural Gas Service.” Order
Instituting Proceeding and Establishing Further Procedures. Albany: New York State Public
Service Commission, 30 November 2012. Web. March 2015.
New York. New York State Public Service Commission. Case 89-G-078. Policy for Rate Treatment of
Gas Service Expansion into New Franchise Areas. Albany: New York State Public Service
Commission, 11 December 1989. Web. March 2015.
New York State Electric & Gas Corporation. “Our Company: Service Area.” NYSEG.com Binghamton:
New York State Electric & Gas, 2015. Web. March 2015.
North Carolina. Legislature. House. An Act to Require Natural Gas Local Distribution Companies to
Report Plans for Providing Natural Gas Service in Unserved Areas… (HB 970) 1989 Session.
(31 March 1989) General Assembly of North Carolina. Web. March 2015.
North Carolina. Legislature. House. An Act to Facilitate the Construction of Facilities In and the
Extension of Natural Gas Service To Unserved Areas… (HB 1039) 1991 Session. (8 July
1991) General Assembly of North Carolina. Web. March 2015.
North Carolina. Legislature. House. An Act to Authorize the Issuance of General Obligation Bonds of
the State, Subject to a Vote of the Qualified Voters of the State, to Address Statewide Critical
Confidential
49
Infrastructure Needs… (SB 1354) 1997 Session. (9 September 1998) General Assembly of
North Carolina. Web. March 2015.
North Carolina. North Carolina. North Carolina Utilities Commission. “The Status and Expansion of
Natural Gas Service within the State.” Report of the North Carolina Utilities Commission to
the Joint Legislative Commission on Governmental Operations. Raleigh: North Carolina
Utilities Commission, 28 April 2014. Web. March 2015.
North Carolina. North Carolina Utilities Commission. “Analysis and Summary of Expansion Plans of
North Carolina Natural Gas Utilities and the Status of Natural Gas Service in North Carolina.”
Report of the Public Staff North Carolina Utilities Commission to the Joint Legislative
Commission on Governmental Operations. Raleigh: North Carolina Utilities Commission, 24
April 2012. Web. March 2015.
Northeast Gas Association. The Role of LNG in Northeast Natural Gas (and Energy) Market.
[Needham, MA]: Northeast Gas Association, February 2015. Web. March 2015.
Ohio. Ohio Legislative Service Commission. “H.B. 319.” Bill Analysis. Columbus: Ohio Legislative
Service Commission, 2013. Web. March 2015.
Ontario. Ontario Energy Board. “Expansion of Natural Gas Distribution.” Letter to All Applicants and
Potential Applicants for Expansion of Natural Gas Distribution. Ontario Energy Board, 18
February 2015. Web. March 2015.
Ontario. Ontario Energy Board. E.B.O. 188. Final Report on Natural Gas Distribution System
Expansion and Appendix B Guidelines. Ontario Energy Board, 30 January 1998. Web. March
2015.
Ontario. Ministry of Economic Development, Employment and Infrastructure. Mandate Letter.
Ministry of Economic Development, Employment and Infrastructure, 25 September 2014.
Web. March 2015.
Ontario. Ministry of Energy. Achieving Balance: Ontario’s Long-Term Energy Plan. Toronto: Ministry
of Energy, 2013. Web. March 2015.
Ontario Federation of Agriculture. “Turning up the Heat for Natural Gas Expansion in Rural Ontario.”
News. Guelph: Ontario Federation of Agriculture, 2013. Web. March 2015.
Ontario Federation of Agriculture. “Natural Gas Infrastructure.” Issues. Guelph: Ontario Federation of
Agriculture, 2015. Web. March 2015.
Parnell, Sean. 2013 State of the State Address. Juneau: State of Alaska, 16 January 2013. Web.
March 2015.
Popowsky, Sonny. “Going the Next Mile: Bringing Natural Gas to Unserved and Underserved
Communities.” Presentation to National Association of Regulatory Utility Commissioners
Summer Committee Meetings. [Harrisburg, PA]: Pennsylvania Office of Consumer Advocate,
22 July 2012. Web. March 2015.
Reyes, Jesse S. “LDC Infrastructure Replacement and Expansion: Rate Issues.” Presentation.
Boston: Massachusetts Attorney General’s Office, 17 June 2014. Web. March 2015.
Rodger, Mark J. Expansion of Natural Gas Distribution in Southern Bruce County: The Business
Case. Toronto: Borden Ladner Gervais, 6 October 2014. (Report prepared with contributions
from Henley International Inc., Innovative Research Inc., Elenchus Inc. and DR Quinn &
Associates Inc.) Web. March 2015.
Confidential
50
Rogers, Kyle. “Expanding the Reach of Natural Gas Infrastructure.” Testimony Before the House
Committee on Energy & Technology. Hearing held in Lansing, Michigan, 29 October 2013.
Web. March 2015.
Saskatchewan Association of Rural Municipalities. “Resolutions: Rural Gas Program.” Advocacy.
Regina: Saskatchewan Association of Rural Municipalities, 2014. Web. March 2015.
Saskatchewan. Legislative Assembly. Standing Committee on Crown and Central Agencies.
“Hansard Verbatim Report.” No. 40. Twenty-Seventh Legislature. Regina: Legislative
Assembly, 1 December 2014. Web. March 2015.
Summit Natural Gas of Maine. Response to Towns of Cumberland, Falmouth and Yarmouth: Natural
Gas Pipeline and Utility Service Request for Proposals. Augusta: Summit Natural Gas of
Maine, 25 January 2013. Web. March 2015.
Summit Natural Gas of Maine. “Summit Natural Gas of Maine Announces 2015 Construction Plan.”
PR Newswire. Augusta: Summit Natural Gas of Maine, 25 February 2015. Web. March 2015.
Summit Natural Gas of Maine. Presentation: Kennebec Valley Expansion. Augusta: Summit Natural
Gas of Maine, 9 October 2013. Web. March 2015.
Summit Natural Gas of Maine. City of Augusta – Proposal For Natural Gas Distribution. Augusta:
Summit Natural Gas of Maine, 2013. Web. March 2015.
Summit Natural Gas of Maine. Docket No. 2012-258. Petition for Authority to Furnish Service
as a Gas Utility. Maine Public Utilities Commission, 1 June 2012. Web. March 2015.
Sussex Economic Advisors, LLC. Presentation to the Maine Public Utilities Commission Review of
Natural Gas Capacity Options. [Framingham, MA]: Sussex Economic Advisors, LLC., 26
February 2014. Web. March 2015.
Synapse Energy Economics Inc. “Massachusetts Low Gas Demand Analysis.” Final Report Prepared
for the Massachusetts Department of Energy Resources. Cambridge: Synapse Energy
Economics Inc., 7 January 2015.
Turkel, Tux. “For Summit Natural Gas, the path hasn’t been easy.” Portland Press Herald. 19 March
2015. Web. March 2015.
Union Gas. Ontario’s Economic Renaissance Fuelled By Natural Gas. Chatham: Union Gas, 2013.
Web. March 2015.
U.S. Department of Energy. Quadrennial Energy Review Task Force Secretariat and Energy Policy
and Systems Analysis Staff, U.S. Department of Energy. Stakeholder Meeting on Natural Gas
Transmission, Storage and Distribution. Washington: Department of Energy, 17 July 2014.
Web. March 2015.
U.S. Energy Information Agency. “Residential Energy Consumption Survey: Household Energy Use in
New York.” Factsheet. Thirteenth edition. Washington: U.S. Department of Energy, 2009.
Web. March 2015.
U.S. Energy Information Administration. “Profile Analysis.” State Profile and Energy Estimates:
Alaska. Washington: U.S. Department of Energy, 19 June 2014. Web. March 2015.
U.S. Energy Information Administration. “Profile Analysis.” State Profile and Energy Estimates:
Connecticut. Washington: U.S. Department of Energy, 18 December 2013. Web. March
2015.
Confidential
51
U.S. Energy Information Administration. “Profile Analysis.” State Profile and Energy Estimates:
Delaware. Washington: U.S. Department of Energy, 18 December 2013. Web. March 2015.
U.S. Energy Information Administration, “Profile Analysis.” State Profile and Energy Estimates:
Hawaii. Washington: U.S. Department of Energy, 19 June 2014. Web. March 2015.
U.S. Energy Information Administration. “Profile Analysis.” State Profile and Energy Estimates:
Indiana. Washington: U.S. Department of Energy, 19 March 2015. Web. March 2015.
U.S. Energy Information Administration. “Profile Analysis.” State Profile and Energy Estimates:
Maine. Washington: U.S. Department of Energy, 18 December 2013. Web. March 2015.
U.S. Energy Information Administration. “Profile Analysis.” State Profile and Energy Estimates:
Michigan. Washington: U.S. Department of Energy, 19 March 2015. Web. March 2015.
U.S. Energy Information Administration. “Profile Analysis.” State Profile and Energy Estimates:
Minnesota. Washington: U.S. Department of Energy, 19 February 2015. Web. March 2015.
U.S. Energy Information Administration. “Profile Analysis.” State Profile and Energy Estimates:
Mississippi. Washington: U.S. Department of Energy, 18 December 2013. Web. March 2015.
U.S. Energy Information Administration. “Profile Analysis.” State Profile and Energy Estimates:
Nebraska. Washington: U.S. Department of Energy, 15 January 2015. Web. March 2015.
U.S. Energy Information Administration. “Profile Analysis.” State Profile and Energy Estimates: New
Jersey. Washington: U.S. Department of Energy, 18 December 2013. Web. March 2015.
U.S. Energy Information Administration. “Profile Analysis.” State Profile and Energy Estimates: New
York. Washington: U.S. Department of Energy, 18 December 2013. Web. March 2015.
U.S. Energy Information Administration. “Profile Analysis.” State Profile and Energy Estimates: North
Carolina. Washington: U.S. Department of Energy, 18 December 2013. Web. March 2015.
U.S. Energy Information Administration. “Profile Analysis.” State Profile and Energy Estimates: Ohio.
Washington: U.S. Department of Energy, 19 March 2015. Web. March 2015.
U.S. Energy Information Administration. “Profile Analysis.” State Profile and Energy Estimates:
Pennsylvania. Washington: U.S. Department of Energy, 18 December 2013. Web. March
2015.
U.S. Energy Information Administration. “Profile Analysis.” State Profile and Energy Estimates:
Texas. Washington: U.S. Department of Energy, 20 November 2014. Web. March 2015.
U.S. Energy Information Administration. “Profile Analysis.” State Profile and Energy Estimates: Utah.
Washington: U.S. Department of Energy, 21 August 2014. Web. March 2015.
U.S. Energy Information Administration. “Profile Analysis.” State Profile and Energy Estimates:
Virginia. Washington: U.S. Department of Energy, 18 December 2013. Web. March 2015.
U.S. Energy Information Administration. Office of Oil and Gas. Distribution of Natural Gas: The Final
Step in the Transmission Process. Washington: U.S. Department of Energy, June 2008.
Valigra, Lori. “Will natural gas alleviate Maine's energy woes?” Mainebiz, 2 September 2013. Web.
March 2015.
White, Bill. “Guide to Alaska natural gas projects.” Alaska Natural Gas Transportation Projects. Office
of the Federal Coordinator, 21 January 2015. Web. March 2015.
Confidential
52
Appendix 1 Other Jurisdictions
This section provides an overview of policies in other jurisdictions with respect to the expansion of
natural gas distribution systems. Some of these policies are already in place, while others are under
consideration.
Canada
Alberta
There are more than 50 rural gas co-ops in Alberta. These co-ops formed throughout the 1960s and
1970s in response to the lack of distribution services in rural areas.124
In 1973, the provincial
government created the Rural Gas Program, which allowed rural gas co-ops to form exclusive
franchise areas. The program also included government assistance in the form of grants for
extending gas lines to rural farms and households. This assistance, which continues today as the
Rural Gas Grant Program, is intended to partially offset the costs of construction for extending new
service. Eligible rural utilities – co-ops, municipal or First Nations – can apply for funding under a
formula. As of 2013, 75 percent of costs above the threshold of $6,000 per residence or farm is
eligible for support. Where costs exceed $20,000, anything above that threshold is ineligible for the
grant. Today, the Federation of Alberta Gas Co-ops Ltd. is responsible for administering the Rural
Gas Grant Program, while the provincial government remains the source of funding.
Saskatchewan
From 1982 to 1991, Saskatchewan extended natural gas distribution services to rural communities
under the Rural Gas Distribution Program, which provided government assistance for the installation
of gas lines. The Saskatchewan Association of Rural Municipalities is currently lobbying the provincial
government to reintroduce the program. 125
Today, SaskEnergy -- the province’s gas LDC, a provincial
Crown corporation – reaches 93 percent of Saskatchewan residential, farm, commercial and industrial
customers. Service reaches all but the most northern and remote communities.126
While
SaskEnergy management has explored future expansion to some of these communities using LNG,
these plans are still in the preliminary stages.127
United States
Delaware
Delaware’s 2009-14 Energy Plan included the policy goal of facilitating the expansion of natural gas
transmission and distribution. However, given Delaware’s small geographic size, state policies are
primarily aimed at infilling underserved areas, as opposed to reaching remote, rural or sparsely-
populated unserved areas.
Indiana
In Indiana, utility extension projects into rural areas are eligible for rate adjustments, or trackers,
called Transmission, Distribution and Storage System Improvement Charges (“TDSIC”). The Indiana
Utility Regulatory Commission reviews 7-year infrastructure improvement plans filed by utilities
124 Background information in this section is primarily derived from the Federation of Alberta Gas Co-ops Ltd. Source:
Federation of Alberta Gas Co-ops Ltd. “Federation History.” Who We Are. Federation of Alberta Gas Co-ops Ltd., 2015. Web.
March 2015; and Federation of Alberta Gas Co-ops Ltd. “Rural Gas Grant Program.” Public Info. Federation of Alberta Gas Co-
ops Ltd., 2015. Web. March 2015.
125 Saskatchewan Association of Rural Municipalities. “Resolutions: Rural Gas Program.” Advocacy. SARM, 2014. Web. March
2015.
126 SaskEnergy. About SaskEnergy. Web. March 2015.
127 Saskatchewan. Legislative Assembly. Standing Committee on Crown and Central Agencies. “Hansard Verbatim Report.”
No. 40. Twenty-Seventh Legislature. Legislative Assembly, 1 December 2014. Web. March 2015.
Confidential
53
seeking to use this rate mechanism. If approved, TDSICs may be used to finance rural expansion
projects subject to a variety of conditions, such as (i) rate increases limited to once every 6 months;
(ii) rate increases limited to no more than 2 percent of total annual retail revenues; and (iii) utilities can
recover 80 percent of costs as incurred, with the remainder deferred until the next base rate case.
Michigan
Michigan has well-developed production, transmission and distribution infrastructure that reaches
most of the state population, including the Upper Peninsula, through 10 LDCs. While new legislation
was before the Michigan legislature in 2014 to encourage additional residential propane-to-gas
conversions – and estimates are as high as 200,000 potential new gas customers – state initiatives
are primarily related to in-filling underserved areas as opposed to reaching remote, rural or sparsely-
populated unserved areas.
Minnesota
Instead of requiring upfront payment for the uneconomic portions of expansion projects, Minnesota
allows utilities to apply “New Area Surcharges” to all customer bills within the expansion area.
These surcharges last for a flexible, project-specific period of time (e.g., until all uneconomic costs
are recovered) and/ or for a fixed period of time (e.g., as long as 20 years in some cases).
Mississippi
Mississippi is a significant regional hub for natural gas infrastructure and is seeking to leverage its gas
distribution system to encourage economic growth. One LDC (Atmos Energy Corp.) has been
granted approval to charge all of its existing customers a “Supplemental Growth Rider” to finance
the uneconomic portions of extensions to industrial anchor loads.
Nebraska
Nebraska passed legislation in 2012 allowing utilities to apply a “Rural Infrastructure Surcharge” to
customers within an expansion area and, if necessary, apply the surcharge to a broader set of utility
customers.
New Jersey
The 2011 New Jersey Energy Master Plan included the policy goal of expanding natural gas
distribution services to unserved areas – primarily in Southern New Jersey. However, interstate
transmission pipelines and the role of natural gas in electricity generation are bigger priorities for
state policymakers. New Jersey already has one of the highest concentrations of natural gas use in
the U.S., according to the plan, with 70 percent of residents using natural gas for home heating.
Ohio
In 2014, Ohio lawmakers passed a bill permitting natural gas companies to apply infrastructure
development riders to recover costs of extending gas distribution services to economic development
projects. Eligible economic development projects included commercial, industrial and manufacturing
facilities, as well as projects in areas where adequate natural gas infrastructure was not available.
These riders can be applied to all customers of the natural gas utility, as approved by the Public
Utilities Commission of Ohio.
Confidential
54
Appendix 2 New York Public Service Commission Discussion
Questions
In advance of its January 9, 2013, technical conference on natural gas expansion, the New York State
Public Service Commission issued the following list of questions to participants for further
discussion. These questions originally appeared as an appendix to the order instituting the
proceeding, dated November 30, 2012, and are presented here in the same way.
ISSUES TO BE CONSIDERED AT THE TECHNICAL CONFERENCE
Barriers to Extension and Expansion of Natural Gas Facilities
1. Please explain your understanding (and for utilities, your implementation) of Commission
regulations and the Natural Gas Expansion Policy including your views on whether they encourage or
deter expansion of the natural gas delivery system in New York State. Do you feel that the
Commission regulations and Policy should be modified and if so, how?
2. Regarding the Commission’s regulations of the natural gas delivery system and the system itself,
do you believe that the interests of utility shareholders, ratepayers, and the State as a whole are
aligned? Please explain.
3. Are there provisions of current policies or regulations that appropriately incentivize the expansion
of the natural gas delivery system in New York State? Are these sufficient? If not, please suggest
alternatives.
4. Identify current barriers inhibiting conversion to natural gas usage from other heating fuels – other
than the cost of replacing heating equipment. Please explain how the barrier inhibits conversion and
provide suggestions for reducing or eliminating the barrier – including the cost of replacing heating
equipment.
5. Please identify the outreach and education efforts currently employed by the utility for the
purposes of gauging interest in natural gas service and/ or soliciting new customers in areas where
interest in the possibility of obtaining service has been expressed. Are the efforts sufficient? How
can they be improved? Would expanded or improved outreach and education programs increase
conversion to natural gas by customers who reside within the 100 feet zone of existing utility
infrastructure (and, accordingly would not pay for the extension)? How can the utility identify,
communicate and engage with such customers? When an individual customer requests service,
please describe the utility’s efforts to communicate with or solicit other customers in the
neighborhood/ area.
6. Please identify the typical flow of communication and information between the utility and a
customer requesting service that would require extension of a gas main sufficient to require a
surcharge. Please provide any examples of written communication.
7. What issues should be given consideration prior to expansion of the natural gas delivery system?
Should such considerations include protections for a group or groups of customers? If so, what
should be and what types of protections should be considered?
8. Are there existing utility specific pilot programs focused on new approaches to line extensions or
new franchise expansions of the natural gas delivery system? If so, please describe the pilot
program. If not, could such a pilot program be beneficial and, how would it be designed?
Confidential
55
Rate and Ratepayer Considerations
9. The Commission’s regulations (§230.2[f]) provide that “each corporation may, in its tariff
schedules, extend such obligation [to provide certain main and service line extensions without cost to
the customer], to the extent the provision of additional facilities without charge is cost-justified.”
Identify whether the utility ever provides residential customers with more than 100 feet of gas main
or service line without surcharge. Please explain why and under what circumstances or, if never,
why not. Is the utility aware of any geographic areas in its service territory where potential cost
justified extensions of greater than 100 feet are currently un-served? If not, has the utility ever
attempted to ascertain or develop such information? What should be the appropriate length of main
and/or service provided without surcharge? Please explain.
10. Does the utility provide programs that could assist low income customers or those on a fixed
income to overcome the barriers to conversion to natural gas?
11. Are there potential funding mechanisms for expansion of the natural gas delivery system other
than through utility rates or direct customer payments (surcharges, CIACs or other)?
12. Are existing natural gas efficiency programs adequate and optimal to serve the expansion of
customers within 100 feet of existing utility infrastructure? If not, what changes, including possibly
the level of funding, could be made to improve the existing efficiency programs? Would efficiency
programs targeted to conversion customers result in increased energy savings, and if so, how?
13. Do Revenue Decoupling Mechanisms (RDMs) impact expansion of the natural gas delivery
system?
Economic Development
14. Does the utility have any information or estimates concerning the existence of commercial or
industrial customers who may add and/ or retain jobs if they could switch their process or heating
fuel to natural gas? If so, how many jobs might be added or retained?
15. Are there specific industries in the State that would benefit from an expanded natural gas delivery
system? Please describe.
Public/ Private Partnerships
16. Are there potential partnerships between various entities involved in the energy and heating
markets in New York State that could facilitate expansion of the natural gas delivery system? If so,
please provide examples and whether your organization would be willing to take part in such a
partnership. Who would be best suited for encouraging and developing such partnerships? What
role should the public sector play?
17. Are there programs currently administered by utilities or federal, state or local agencies that assist
customers with heating fuel conversions? Are there roles that other agencies, such as the New York
State Energy Research and Development Authority (NYSERDA), should play in expansion of the
natural gas delivery system? Should the Energy Efficiency Portfolio Standard (EEPS) programs be
expanded or modified to encourage conversions to natural gas before end-of-life replacements?
18. Are there opportunities to coordinate natural gas delivery system expansion projects with other
available resources, such as economic development, energy efficiency, or environmental protection?
Please provide specific examples, if possible.

Confidential
56
Environmental Impact
19. Are there changes that could be made to the environmental impact review process involved in
granting or expanding gas franchise areas that could improve or streamline the process?
20. Please identify, if any, areas of the State where provision of natural gas delivery service is
unrealistic because of environmental constraints, construction permitting requirements or other
factors and explain why service to such areas is believed to be unrealistic. Are there any areas of the
State that require special consideration regarding expansion of the natural gas system?
Planning
21. Please explain your utility’s natural gas delivery system expansion planning process including any
large-scale and or long-term plans that are in place or are being considered.
Confidential
57
Appendix 3 National Regulatory Research Institute Discussion
Questions
Ken Costello’s 2013 policy paper for the National Regulatory Research Institute entitled “Line
Extensions for Natural Gas: Regulatory Considerations” was one of the most widely-cited sources
during the course of our research. The paper concludes with a list of questions state utility
commissions can ask about gas-line extensions. That list is presented here for further consideration.
QUESTIONS STATE UTILITY COMMISSIONS CAN ASK ABOUT GAS-LINE EXTENSIONS
1. What are the benefits and costs of line extensions from the perspectives of (a) the utility, (b)
existing customers, (c) new customers, and (d) society at large (e.g., local economy, accounting for
environmental benefits)? If they differ, what implication does this have for policy?
2. When should a utility extend its lines? What are the necessary conditions? What is efficient and
economical service expansion?
■ When prospective customers indicate their commitments to immediate demand?
■ Before or ahead of known (i.e., firm, committed) demand but in potentially high-growth areas?
■ If the latter, how should the utility recover any current or future revenue deficiencies?
3. What is the proper balance of risk and reward for the utility and its customers?
4. Should regulators distinguish between main lines in underdeveloped and undeveloped (e.g., rural
locations without previous gas service) areas? If so, what are the implications for policy?
5. Who should pay for lines?
■ How much should new customers pay?
■ Existing customers?
■ Utility shareholders, government taxpayers?
■ What is a fair sharing of the costs?
6. How can a commission ensure a utility that it will recover all of its prudent costs for investments in
line extensions?
7. Can subsidization of new customers ever be justified?
■ What do we mean by subsidization in this context?
■ Is this situation similar to the federal government subsidizing rural electric co-ops to expand
electric service to areas that otherwise would not be served because of the unprofitability to
investor-owned utilities?
8. How should the utility recover their costs from new customers?
■ Through an existing ratemaking mechanism?
■ Through some other mechanism (e.g., special surcharge)?
9. Should the utility recover any incremental costs from existing customers?
■ Should existing customers be always held harmless when a utility extends service to new
customers?
■ If not, under what conditions?
Confidential
58
10. Over what period should a utility recover the costs for line extensions that pass an economic
test?
11. Should utilities offer “no cost” extension lines to new customers? If so, who should pay for
them?
12. How should utilities structure customer contributions?
■ What is their rationale?
■ How large should they be?
■ Over what timeframe should utilities recover them (e.g., one-time up-front, amortized over five
years)?
■ Should they include refunds? If so, what are the criteria for refunds?
■ How can utilities design up-front customer contributions so as not to discourage fuel switching to
gas that is economical?
■ Could customer contributions place utilities at a competitive disadvantage with other fuels?
■ Under what conditions, if any, should regulators include facilities paid for by customer
contributions in rate base?
13. Should regulators approve line-extension projects that may not be economically feasible using
traditional criteria, like NPV and IRR?
14. What incentives and disincentives does a utility have to invest in new lines?
■ What explains any distorted incentives?
■ What can regulators do to eliminate them?
15. What are the line-extension policies of different gas utilities in your state?
■ Do utilities have similar policies, or do they differ?
■ What are the positive and negative features of each?
The information contained herein is of a general nature and is not intended to address the
circumstances of any particular individual or entity. Although we endeavour to provide
accurate and timely information, there can be no guarantee that such information is
accurate as of the date it is received or that it will continue to be accurate in the future. No
one should act on such information without appropriate professional advice after a thorough
examination of the particular situation.
© 2015 KPMG LLP, a Canadian limited liability partnership and a member firm of the KPMG
network of independent member firms affiliated with KPMG International Cooperative
(“KPMG International”), a Swiss entity. All rights reserved.
The KPMG name, logo and “cutting through complexity” are registered trademarks or
trademarks of KPMG International Cooperative (“KPMG International”).
Contact us
Jonathan Erling
Global Infrastructure Advisory
T +1 416 777 3206
kpmg.ca


![CONFIDENTIAL ONTARIO REGULATION EMERGENCY … · 2020-04-03 · CONFIDENTIAL Until made ONTARIO REGULATION made under the [Bilingual] REG2020.0227.e 16 EMERGENCY MANAGEMENT AND CIVIL](https://img.pdfslide.us/doc/110x75/5ed099bce2e54a5410126266/confidential-ontario-regulation-emergency-2020-04-03-confidential-until-made-ontario.jpg)