Embed Size (px)
Citation preview
Prepared by
The Howard T. Odum Florida Springs Institute
Volusia Blue Spring Restoration Plan
April 2018
Prepared by
The Howard T. Odum Florida Springs Institute
Report Cover Photograph Copyright © Travis Marques Photography
Volusia Blue Spring Restoration Plan
i
Table of Contents
Figures ............................................................................. iv
Tables ............................................................................... vi
Acknowledgments ........................................................ viii
Executive Summary ......................................................... 1
Section 1.0 Regional Perspective .............................. 1-1
1.1 Blue Spring and the Middle St. Johns River ........................................................................ 1-1
1.2 Summary of Impairments at Blue Spring ............................................................................ 1-1
1.3 Purpose and Scope of this Restoration Plan ........................................................................ 1-2
Section 2.0 Environmental Conditions in the Volusia Blue Springshed ........................................................... 2-1
2.1 General ...................................................................................................................................... 2-1
2.2 Physical Description ............................................................................................................... 2-1
2.3 Climate ...................................................................................................................................... 2-5
2.4 Topography .............................................................................................................................. 2-8
2.5 Geology ..................................................................................................................................... 2-8
2.6 Hydrogeology .......................................................................................................................... 2-9
2.6.1 Springshed ....................................................................................................................... 2-9
2.6.2 Aquifer Recharge .......................................................................................................... 2-12
2.6.3 Spring Discharge ........................................................................................................... 2-14
2.6.4 Groundwater Quality ................................................................................................... 2-17
2.7 Springshed Land Use and Human Population ................................................................. 2-17
2.8 Ecology ................................................................................................................................... 2-21
2.8.1 Blue Spring/Blue Spring Run Conceptual Ecosystem Model ................................ 2-21
2.8.2 Physical Environment ................................................................................................... 2-24
2.8.2.1 Bottom Temperature Profile .................................................................................... 2-24
2.8.2.2 Light Attenuation ...................................................................................................... 2-24
2.8.3 Water Quality ................................................................................................................ 2-28
2.8.4 Blue Spring and Blue Spring Run Biology ................................................................. 2-32

Volusia Blue Spring Restoration Plan
ii
2.8.4.1 Periphyton and Algae ............................................................................................... 2-32
2.8.4.2 Aquatic Plants ............................................................................................................ 2-36
2.8.4.3 Macroinvertebrate Community and Habitat Assessment ................................... 2-38
2.8.4.4 Snails ........................................................................................................................... 2-42
2.8.4.5 Fish .............................................................................................................................. 2-43
2.8.4.6 Turtles ......................................................................................................................... 2-47
2.8.4.7 Manatees ..................................................................................................................... 2-50
2.8.5 Ecosystem Function ...................................................................................................... 2-52
2.8.5.1 Community Metabolism .......................................................................................... 2-52
2.8.5.2 Particulate Export ...................................................................................................... 2-55
2.8.5.3 Nutrient Assimilation ............................................................................................... 2-59
Section 3.0 Summary of Existing Impairments at Volusia Blue Spring ...................................................... 3-1
3.1 Groundwater Withdrawals and Declining Spring Flows ................................................. 3-1
3.2 Nitrogen Loading .................................................................................................................... 3-6
3.3 Recreation ............................................................................................................................... 3-15
Section 4.0 Regulatory Programs for Comprehensive Protection and Restoration of Volusia Blue Spring .. 4-1
4.1 Introduction ............................................................................................................................. 4-1
4.2 Federal and State Water Quality Regulations ..................................................................... 4-1
4.2.1 Designated Uses and Water Quality Standards ......................................................... 4-1
4.2.2 Antidegradation Policy .................................................................................................. 4-2
4.2.3 National Pollutant Discharge Elimination System (NPDES) .................................... 4-2
4.2.4 Groundwater Regulations ............................................................................................. 4-2
4.2.5 Impaired Waters, TMDLs and BMAPs ........................................................................ 4-2
4.2.5.1 Florida Impaired Waters and TMDLs ...................................................................... 4-2
4.2.5.2 Basin Management Action Plan (BMAP) ................................................................. 4-3
4.3 Water Withdrawals ................................................................................................................. 4-7
4.3.1 General Water Use Permit ............................................................................................. 4-8
4.3.2 Individual Water Use Permit ......................................................................................... 4-8
4.3.3 Obtaining a Water Use Permit ...................................................................................... 4-8
Volusia Blue Spring Restoration Plan
iii
4.3.4 Minimum Flows and Levels (MFLs) and Permitting ................................................. 4-8
Section 5.0 Restoration Goals
and Recommendations…………………………………..5-1
5.1 Visioning the Future for the Volusia Blue Spring .............................................................. 5-1
5.2 Key Stakeholders ..................................................................................................................... 5-2
5.2.1 Private Landowners ........................................................................................................ 5-2
5.2.2 Federal, State, Local Governments, and Non-Governmental Organizations ......... 5-2
5.2.3 Agricultural and Forestry Operations and Industrial, Commercial, and Development Operations .............................................................................................................. 5-2
5.3 Developing a Restoration Roadmap .................................................................................... 5-2
5.4 Specific Goals for Restoration and Practical Steps to Achieve Those Goals ................... 5-3
5.4.1 Water Quantity Restoration ........................................................................................... 5-3
5.4.2 Water Quality Restoration ............................................................................................. 5-4
5.5 Holistic Ecological Restoration ............................................................................................. 5-5
5.5.1 Education Initiatives ....................................................................................................... 5-5
5.5.2 Regulatory Assistance .................................................................................................... 5-5
5.6 Closing Statement ................................................................................................................... 5-6
Section 6.0 References ............................................... 6-1
Volusia Blue Spring Restoration Plan
iv
Table of Exhibits
Figures Figure 1. Volusia Blue Spring general location map (FDEP, 2005). ................................................. 1-3
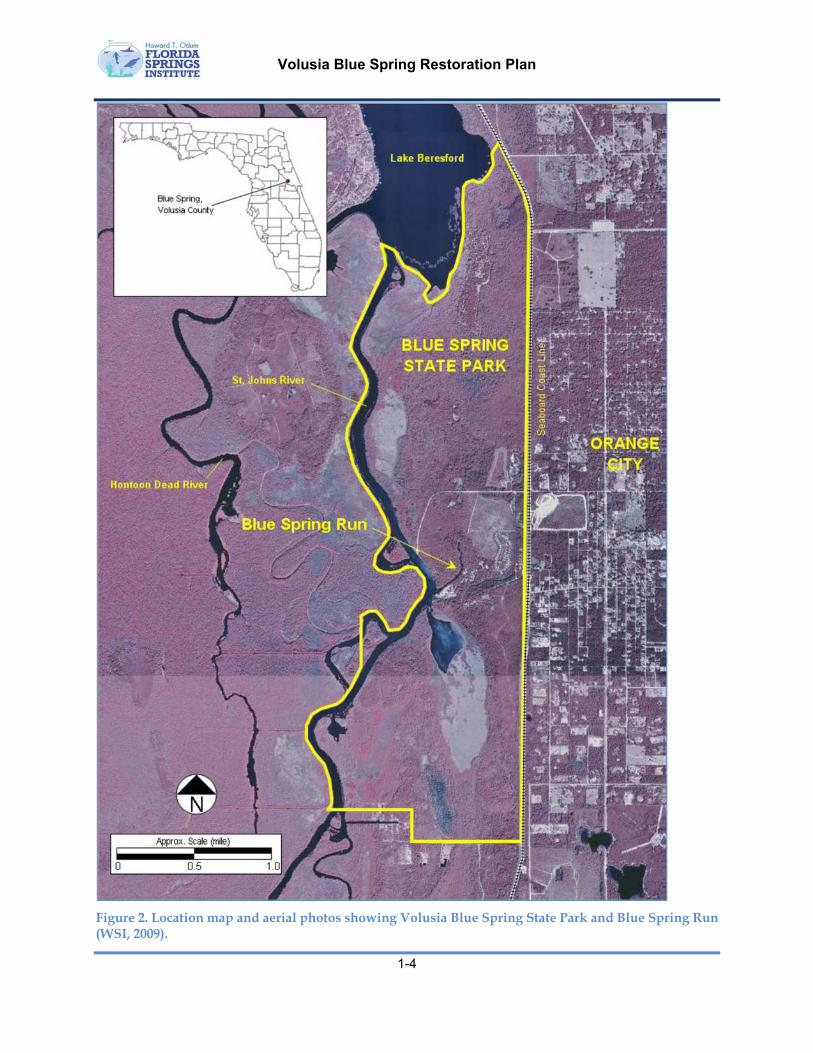
Figure 2. Location map and aerial photos showing Volusia Blue Spring State Park and Blue Spring Run (WSI, 2009). ...................................................................................................................................... 1-4
Figure 3. Volusia Blue Spring and spring run, showing FDEP verified impaired status for nitrate-nitrogen (Holland & Bridger, 2014). ..................................................................................................... 1-5
Figure 4. Profile of the Blue Spring cave system as surveyed and drawn by J. Odom in 1984. .. 2-2
Figure 5. Map of Blue Spring and Blue Spring Run showing principal geographical features (WSI, 2009). ......................................................................................................................................................... 2-3
Figure 6. Aerial view of Blue Spring Run showing principal geographical features, standardized sampling station locations, and corresponding latitude and longitude coordinates marked at 10-m intervals. (WSI, 2009).......................................................................................................................... 2-4
Figure 7. Rainfall trends at ten rainfall stations near Volusia Blue Spring from 1909 to 2017. .... 2-6
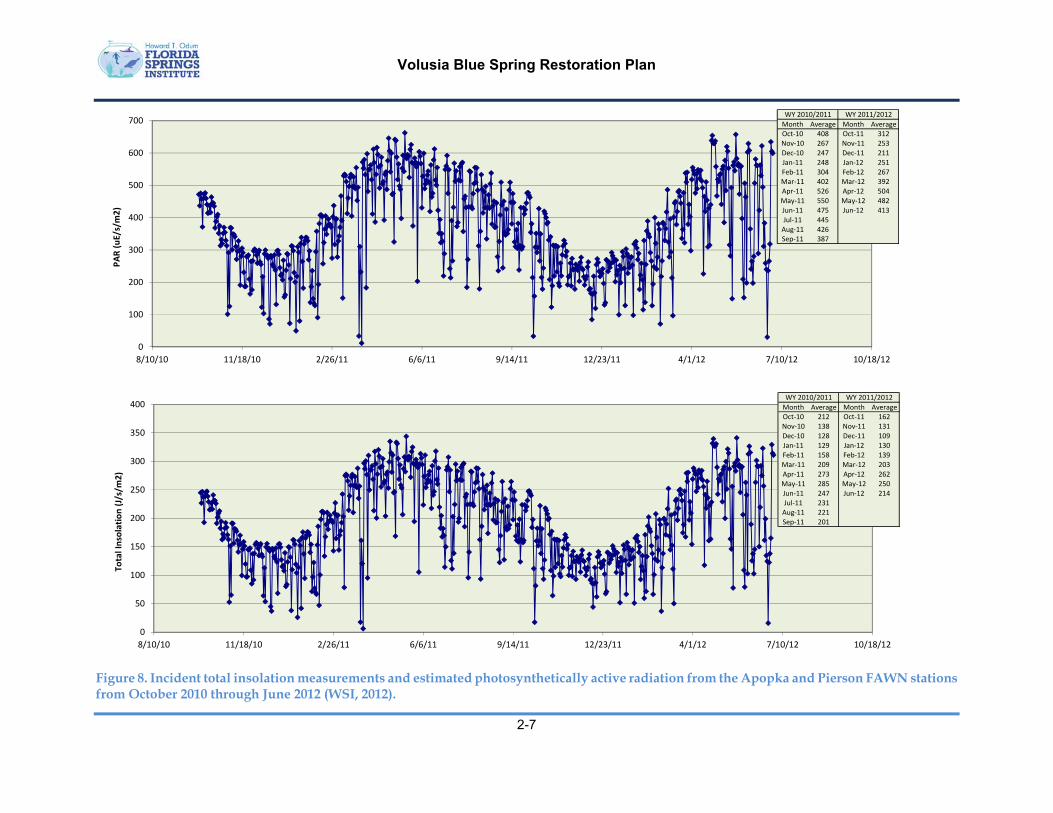
Figure 8. Incident total insolation measurements and estimated photosynthetically active radiation from the Apopka and Pierson FAWN stations from October 2010 through June 2012 (WSI, 2012). .............................................................................................................................................. 2-7
Figure 9. Generalized cross-section west-to-east at Volusia Blue Spring. (Scale is approximate, landform details are generalized, underground details are conceptual. Arrows indicate direction of ground water flow within the springshed, from German, 2008) ................................................. 2-9
Figure 10. Mapped springshed for Volusia Blue Springs (German, 2008). ................................... 2-10
Figure 11. Historic and recent springshed delineations for Volusia Blue Spring and estimated maximum extent springshed for Volusia Blue Spring (187 mi2). ................................................... 2-11
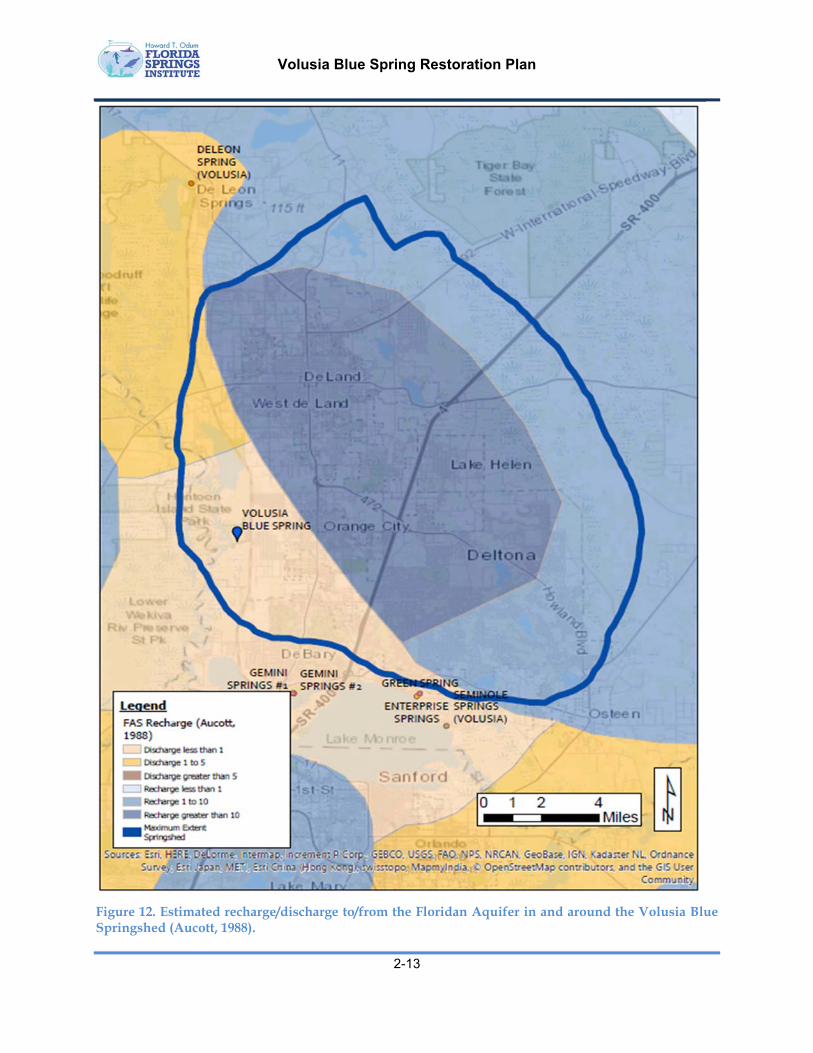
Figure 12. Estimated recharge/discharge to/from the Floridan Aquifer in and around the Volusia Blue Springshed (Aucott, 1988). .......................................................................................................... 2-13
Figure 13. Reported annual average discharge at Blue Spring near Orange City in Volusia County, Florida (USGS Station 02235500). ....................................................................................................... 2-15
Figure 14. Blue Spring annual (calendar year) average discharge and stage readings (USGS 02235500) for the period from 1932 through 2010 with LOESS Curve Fit (alpha = 0.33) (WSI, 2012). ................................................................................................................................................................. 2-16
Figure 15. Land use in the 187 mi2 maximum extent Volusia Blue Springshed for 2013 – 2016 (FDEP data). ........................................................................................................................................... 2-18
Figure 16. Energy Symbols in the “Energese” Model Language (Odum, 1983). ......................... 2-21
Figure 17. Conceptual ecological model for Blue Spring and Blue Spring Run illustrating the Ecological and Human Use Water Resource Values (WRVs) described in this report (WSI, 2006). ................................................................................................................................................................. 2-23
Volusia Blue Spring Restoration Plan
v
Figure 18. Monthly average bottom water temperature measurements at Blue Spring for the period-of-record from 2000 through 2012 (USGS data). .................................................................. 2-25
Figure 19. Blue Spring horizontal Secchi disk measurements during Water Year 2007 / 2008 (WSI, 2009). ....................................................................................................................................................... 2-27
Figure 20. Nitrate-nitrogen concentrations in Blue Spring and Blue Spring Run for the period-of-record from 1974 through 2013 (Holland & Bridger, 2014). ............................................................ 2-29
Figure 21. Blue Spring benthic algal thickness by site and sampling date (from FDEP, 2009) .. 2-34
Figure 22. Correlation between mean algal thickness and sediment total Kjeldahl nitrogen concentrations (top figure), sediment total phosphorus concentrations (middle figure), and riparian canopy cover. (FDEP, 2009) .................................................................................................. 2-35
Figure 23. Volusia Blue Spring manatee counts by year for the period-of-record (Blue Spring State Park data). .............................................................................................................................................. 2-51
Figure 24. Observed seasonality of manatee use at Volusia Blue Spring from 1979 to 2006 (WSI, 2009) ........................................................................................................................................................ 2-52
Figure 25. Gross primary production on an area basis as a function of visible light intensity reaching the level of submersed aquatic vegetation (Odum, 1957). The ratio between ecosystem productivity and light intensity is a measure of photosynthetic efficiency. ................................ 2-54
Figure 26. Blue Spring time series of ecosystem gross primary production (GPP, g O2/m2/d) estimates with LOESS Curve Fit (alpha = 0.33) (WSI, 2012). .......................................................... 2-55
Figure 27. Existing active consumptive use permits within the Volusia Blue Spring maximum extent springshed (St. Johns River WMD data). ................................................................................. 3-2
Figure 28. Reported monthly average discharge at Volusia Blue Spring and regulatory minimum flows established by the St. Johns River WMD (USGS data). ........................................................... 3-4
Figure 29. Average discharge versus average photosynthetic efficiency at Gum Slough and 12 previously studied spring ecosystems (WSI, 2010). ........................................................................... 3-5
Figure 30. Record of declining current velocities and flows in the Silver River near its confluence with the Ocklawaha River. Flows are 8-year averages around the given date. Dashed lines refer to critical algal and macrophyte shear velocities in springs measured by King (2014) and Hoyer (2004). Average current velocities were declining by 1985 and went below critical levels beginning around 2002, about the same time that populations of filamentous algae and invasive hydrilla exploded in the Silver River (base drawing from St. Johns River WMD 2017). ............................. 3-6
Figure 31. Groundwater nitrate concentrations measured near Volusia Blue Spring, 2000-2004. 3-7
Figure 32. Prevalence of human wastewater treatment and disposal systems in the Volusia Blue Maximum Extent Springshed. There are an estimated 52,407 properties utilizing on-site treatment and disposal systems (septic systems) in the springshed (Florida Department of Health data)... 3-10
Figure 33. Domestic and industrial wastewater facilities in the Volusia Blue Springshed (Holland & Bridger, 2014) ..................................................................................................................................... 3-11
Volusia Blue Spring Restoration Plan
vi
Figure 34. Recorded septic systems in the Volusia Blue Springshed by high, medium, and low groundwater recharge conditions (FDEP, 2017). .............................................................................. 3-12
Figure 35. Relative percentage nitrogen inputs to the land surface in the Volusia Blue Springs BMAP area (FDEP, 2017). .................................................................................................................... 3-13
Figure 36. Summary of estimated nitrogen load to the Floridan Aquifer within the Volusia Blue Springshed (FDEP, 2017). ..................................................................................................................... 3-14
Figure 37. Monthly time series of overnight and day visitors utilizing Blue Spring State Park, Volusia County (FDEP data) with LOESS Curve Fit (alpha = 0.33). ............................................. 3-16
Figure 38. Average Number of Overnight and Daily Visitors to Blue Spring Park, Volusia County (January 1, 1990 - September 4, 2006) ................................................................................................. 3-17
Figure 39. Blue Spring State Park human use and recreational counts conducted on May 23, 2008 (WSI, 2009). ............................................................................................................................................ 3-20
Figure 40. Blue Spring State Park human use and recreational counts conducted on June 24, 2008 (WSI, 2009). ............................................................................................................................................ 3-21
Figure 41. Comparison of Blue Spring State Park recreational activity (by person hours) for May 23 and June 24, 2008 (WSI, 2009). ........................................................................................................ 3-22
Figure 42. Volusia Blue Spring BMAP and PFA boundaries (FDEP, 2017). ................................... 4-6
Figure 43. Cumulative frequency curves for stage and flow in Blue Spring and Blue Spring Run based on the District's recommended minimum flows and levels (WSI, 2009). ............................ 4-9
Tables Table 1. Summary of land use in the 187 mi2 maximum extent Volusia Blue Springshed 2013-16 (FDEP 2016 data). .................................................................................................................................. 2-19
Table 2. Estimated human population in Volusia and Lake counties, Florida for 2017. An estimated 855,129 people live in the counties that include the Volusia Blue Springshed. Average population growth during the past seven years was 7.4%. ............................................................ 2-20
Table 3. Volusia Blue Spring Run light attenuation measurements during water year 2007/2008 (WSI, (2009). ........................................................................................................................................... 2-26
Table 4. Water quality summary for Blue Spring, Volusia County, Florida from surface grab samples collected between October 2010 and June 2012 (USGS, FDEP). ...................................... 2-30
Table 5. Periphytic algae summary statistics for Volusia Blue spring by sampling date (from FDEP, 2009). ........................................................................................................................................... 2-33
Table 6. Vascular aquatic vegetation sampling results for Blue Spring by sampling event (value is number of transects on which the species was encountered, and “D” means dominant species (FDEP, 2009) ........................................................................................................................................... 2-37
Table 7. EcoSummary for Volusia Blue Spring and Run (WSI, 2009) ............................................ 2-39
Table 8. Habitat assessment scores for Blue Spring (FDEP, 2009) ................................................. 2-40

Volusia Blue Spring Restoration Plan
vii
Table 9. Benthic invertebrate summary statistics by sampling event for Blue Spring (FDEP, 2009) ................................................................................................................................................................. 2-41
Table 10. The density (#/m2) of snails by taxon and sampling event for Blue Spring (FDEP, 2009) ................................................................................................................................................................. 2-42
Table 11. Volusia Blue Spring Run fish densities (#/m2) by face mask and snorkel counts (Work, 2006) ........................................................................................................................................................ 2-44
Table 12. Volusia Blue Spring Run fish densities (#/m2) by seine sampling (Work, 2006)........ 2-45
Table 13. Annual density, biomass, and diversity of fish in Blue Spring Run in 2000-2004, and 2007-2008 (Work & Gibbs, 2008) ......................................................................................................... 2-46
Table 14. Turtles captured and marked in Volusia Blue Springs and run in 2007 and 2008 (Farrell, Munscher, & Work, 2009). Does not include four red-eared sliders, Trachemys scripta, that were not returned to the run. ........................................................................................................................ 2-48
Table 15. Metrics for turtles captured in Volusia Blue Spring Run between October 2007 and October 2008. Standard deviations in parentheses and CL indicates carapace length (Farrell et al., 2009) ........................................................................................................................................................ 2-48
Table 16. Turtle density estimates (#/ha) for Volusia Blue Spring Run (Farrell et al., 2009) ..... 2-49
Table 17. Turtle biomass estimates (kg/ha) for Volusia Blue Spring Run (Farrell et al., 2009) . 2-50
Table 18. Volusia Blue Spring estimated daily average ecosystem metabolism parameters (WSI, 2012) ........................................................................................................................................................ 2-53
Table 19. Blue Spring particulate export measurements during Water Year 2007 / 2008 (WSI, 2009). ....................................................................................................................................................... 2-57
Table 20. Relative dominance of material collected during particulate export sampling at Blue Spring during 2007 / 2008 Water Year (WSI, 2009). ........................................................................ 2-58
Table 21. Summary of estimated nutrient mass removals in Volusia Blue Spring by parameter from October 2010 through June 2012 (WSI, 2012). .......................................................................... 2-59
Table 22. Estimated groundwater extraction from the Floridan Aquifer in Volusia and Lake counties and from the Volusia Blue Springshed from 1960 to 2012 (data from USGS). ............... 3-3
Table 23. Annual nitrogen fertilizer sales in Volusia and Lake counties (in tons of nitrogen) in 2015-2016 and estimated for the Volusia Springshed (FDACS data). ............................................. 3-8
Table 24. Volusia Blue Spring Priority Focus Area estimated total nitrogen load to the Upper Floridan Aquifer by source (FDEP, 2017). ......................................................................................... 3-15
Table 25. Monthly statistics of the numbers of overnight, day, and total visitors utilizing Blue Spring State Park, Volusia County (FDEP data). .............................................................................. 3-15
Table 26. Volusia Blue Springs and Spring Run nitrate-nitrogen Total Maximum Daily Load (Holland and Bridger, 2014). ................................................................................................................. 4-3

Volusia Blue Spring Restoration Plan
viii
Acknowledgments The Howard T. Odum Florida Springs Institute gratefully acknowledges the financial support of the Fish and Wildlife Foundation of Florida (Springs License Tag Grant #1617-01) and numerous private donors for preparation of this report. Shih-Hsiung Liang and Clay Henderson of the Stetson Institute for Water and Environmental Resilience, and Stephen Kintner with the Volusia Blue Spring Alliance worked closely with FSI to complete this report.
A work that attempts to encompass the entirety of a subject is always reliant on the accomplishments of others. This Restoration Action Plan incorporates the work of professionals from virtually every environmental research institution and agency in Florida, including the St. Johns River Water Management District (WMD), the U.S. Geological Survey (USGS), the U.S. Fish and Wildlife Service (USFWS), the Florida Department of Environmental Protection (FDEP), the Florida Fish and Wildlife Conservation Commission (FWC), the University of Florida (UF), and engineering and environmental consultants.
Technical information relevant to this study was extracted from the FDEP Blue Springs Total Maximum Daily Load (TMDL) and Basin Management Action Plan (BMAP) reports, and from work conducted and summarized by Wetland Solutions, Inc. and Stetson University researchers.
Although some findings and conclusions in this report may not agree with all aspects of every prior report reviewed, continuing scientific studies by these organizations and institutions provide a valuable current and historical record that were used to develop this Volusia Blue Spring restoration strategy.
The Florida Springs Institute accepts full responsibility for any errors or omissions in this report.
Volusia Blue Spring Restoration Plan
1
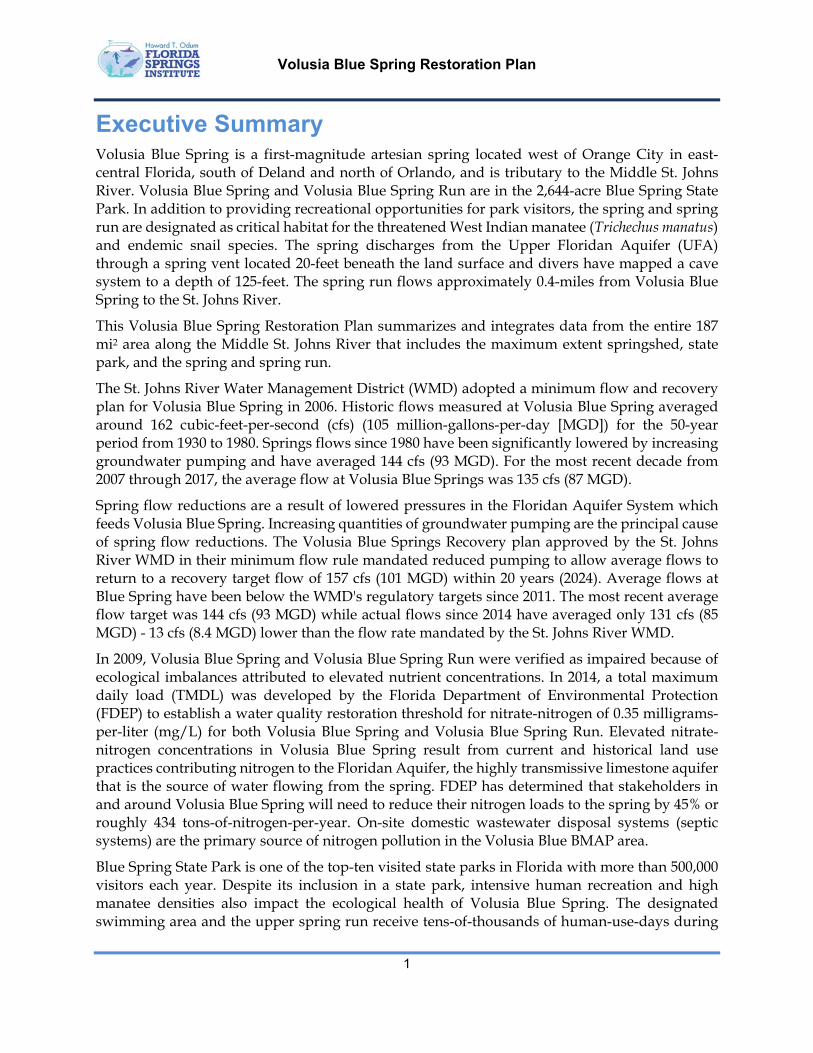
Executive Summary Volusia Blue Spring is a first-magnitude artesian spring located west of Orange City in east-central Florida, south of Deland and north of Orlando, and is tributary to the Middle St. Johns River. Volusia Blue Spring and Volusia Blue Spring Run are in the 2,644-acre Blue Spring State Park. In addition to providing recreational opportunities for park visitors, the spring and spring run are designated as critical habitat for the threatened West Indian manatee (Trichechus manatus) and endemic snail species. The spring discharges from the Upper Floridan Aquifer (UFA) through a spring vent located 20-feet beneath the land surface and divers have mapped a cave system to a depth of 125-feet. The spring run flows approximately 0.4-miles from Volusia Blue Spring to the St. Johns River.
This Volusia Blue Spring Restoration Plan summarizes and integrates data from the entire 187 mi2 area along the Middle St. Johns River that includes the maximum extent springshed, state park, and the spring and spring run.
The St. Johns River Water Management District (WMD) adopted a minimum flow and recovery plan for Volusia Blue Spring in 2006. Historic flows measured at Volusia Blue Spring averaged around 162 cubic-feet-per-second (cfs) (105 million-gallons-per-day [MGD]) for the 50-year period from 1930 to 1980. Springs flows since 1980 have been significantly lowered by increasing groundwater pumping and have averaged 144 cfs (93 MGD). For the most recent decade from 2007 through 2017, the average flow at Volusia Blue Springs was 135 cfs (87 MGD).
Spring flow reductions are a result of lowered pressures in the Floridan Aquifer System which feeds Volusia Blue Spring. Increasing quantities of groundwater pumping are the principal cause of spring flow reductions. The Volusia Blue Springs Recovery plan approved by the St. Johns River WMD in their minimum flow rule mandated reduced pumping to allow average flows to return to a recovery target flow of 157 cfs (101 MGD) within 20 years (2024). Average flows at Blue Spring have been below the WMD's regulatory targets since 2011. The most recent average flow target was 144 cfs (93 MGD) while actual flows since 2014 have averaged only 131 cfs (85 MGD) - 13 cfs (8.4 MGD) lower than the flow rate mandated by the St. Johns River WMD.
In 2009, Volusia Blue Spring and Volusia Blue Spring Run were verified as impaired because of ecological imbalances attributed to elevated nutrient concentrations. In 2014, a total maximum daily load (TMDL) was developed by the Florida Department of Environmental Protection (FDEP) to establish a water quality restoration threshold for nitrate-nitrogen of 0.35 milligrams-per-liter (mg/L) for both Volusia Blue Spring and Volusia Blue Spring Run. Elevated nitrate-nitrogen concentrations in Volusia Blue Spring result from current and historical land use practices contributing nitrogen to the Floridan Aquifer, the highly transmissive limestone aquifer that is the source of water flowing from the spring. FDEP has determined that stakeholders in and around Volusia Blue Spring will need to reduce their nitrogen loads to the spring by 45% or roughly 434 tons-of-nitrogen-per-year. On-site domestic wastewater disposal systems (septic systems) are the primary source of nitrogen pollution in the Volusia Blue BMAP area.
Blue Spring State Park is one of the top-ten visited state parks in Florida with more than 500,000 visitors each year. Despite its inclusion in a state park, intensive human recreation and high manatee densities also impact the ecological health of Volusia Blue Spring. The designated swimming area and the upper spring run receive tens-of-thousands of human-use-days during
Volusia Blue Spring Restoration Plan
2
the non-manatee season. Record manatee numbers are recorded most years since this spring is the principal winter warm-water refuge for the expanding Middle St. Johns River manatee population. High human and manatee use also likely contribute to depauperate populations of submerged aquatic vegetation and proliferation of filamentous algae in the spring run.
Based on data collected and summarized by state and federal agencies, university research teams, consultants hired by the various Florida water management districts, and FSI, most of the artesian springs in Florida are impaired due to human activities, especially agricultural, industrial, and urban development, and due to population pressure related to outdoor recreation. Existing data from Volusia Blue Spring conclusively demonstrate that decreasing spring flows are largely due to competing human groundwater uses and increasing aquifer pollution by nitrate-nitrogen is due to anthropogenic nitrogen loads. Depleted and polluted groundwater at Volusia Blue Spring is resulting in significant changes in the type, nature, and function of spring and spring run ecosystems. Changes in spring ecology are manifested as declining water clarity, loss of native vegetation and aquatic wildlife, and increasing dominance by filamentous algae.
Restoration and protection of Volusia Blue Spring will only be successful by a multi-faceted, integrated effort by multiple stakeholders to identify all external stressors and to deal with them as needed to return this endangered spring ecosystem to health.
Volusia Blue Spring Restoration Plan
1-1
Section 1.0 Regional Perspective
1.1 Blue Spring and the Middle St. Johns River Volusia Blue Spring is located west of Orange City in east-central Florida, south of Deland and north of Orlando, and is tributary to the Middle St. Johns River (Figure 1 and Figure 2). Volusia Blue Spring and Volusia Blue Spring Run are in the 2,644-acre Blue Spring State Park. In addition to providing recreational opportunities for park visitors, the spring and spring run provide critical habitat for the threatened West Indian manatee (Trichechus manatus) and endemic snail species. The spring discharges from the Upper Floridan Aquifer (UFA) through a spring vent located 20-feet beneath the land surface and divers have mapped a cave system to a depth of 125-feet. The spring run flows approximately 0.4-miles from Volusia Blue Spring to the St. Johns River (Figure 3) and ranges from 70- to 100-feet in width with steep, sandy banks and steeply wooded slopes (Holland & Bridger, 2014).
1.2 Summary of Impairments at Blue Spring The St. Johns River Water Management District (WMD) adopted a minimum flow and recovery plan for Volusia Blue Spring in 2006. Historic flows measured at Volusia Blue Spring averaged around 162 cubic-feet-per-second (cfs) (105 million-gallons-per-day [MGD]) for the 50-year period from 1930 to 1980. Springs flows since 1980 have been significantly lowered by increasing groundwater pumping and have averaged 144 cfs (93 MGD). For the most recent decade from 2007 through 2017, the average flow at Volusia Blue Springs was 135 cfs (87 MGD).
Spring flow reductions are a result of lowered pressures in the Floridan Aquifer System that feeds Volusia Blue Spring. Increasing quantities of groundwater pumping are the principal cause of spring flow reductions. The Volusia Blue Springs Recovery plan approved by the St. Johns River WMD in their minimum flow rule mandated reduced pumping to allow average flows to return to a recovery target flow of 157 cfs (101 MGD) within 20 years (2024). Blue Spring flows have been below the WMD's regulatory target since 2011. The most recent target average flow was 144 cfs (93 MGD) while actual flows since 2014 have averaged only 131 cfs (85 MGD) - 13 cfs (8.4 MGD) lower than the target mandated by the St. Johns River WMD.
In 2009, Volusia Blue Spring and Volusia Blue Spring Run were verified as impaired because of ecological imbalances attributed to elevated nutrient concentrations (Figure 3). In 2014, a total maximum daily load (TMDL) was developed by the Florida Department of Environmental Protection (FDEP) to establish a water quality restoration threshold for nitrate-nitrogen of 0.35 milligrams-per-liter (mg/L) for both Volusia Blue Spring and Volusia Blue Spring Run (Holland & Bridger, 2014).
Elevated nitrate concentrations in Volusia Blue Spring result from current and historical land use practices contributing nitrogen to the Floridan Aquifer, the highly transmissive limestone aquifer that is the source of water flowing from the spring. FDEP has developed a Nitrogen Source Inventory Loading Tool (NSILT) to estimate sources of nitrogen to the UFA in the vicinity of Volusia Blue Spring (Escribano, Eller, Lyon, & Katz, 2017). The NSILT is being used to provide stakeholders with current information on the sources of nitrogen in the Volusia Blue Spring contributing area and the relative nitrogen contributions of each source to the aquifer. More importantly, the NSILT is being used as a planning tool for the development and implementation
Volusia Blue Spring Restoration Plan
1-2
of the Basin Management Action Plan (BMAP) to achieve the regulatory TMDL in Volusia County to address the spring’s water quality impairment.
Despite its inclusion in a state park, intensive human recreation and high manatee densities also impact the ecological health of Volusia Blue Spring. The designated swimming area and the upper spring run receive tens-of-thousands of human-use-days during the non-manatee season. Record manatee numbers are recorded most years since this spring is the principal winter warm-water refuge for the expanding Middle St. Johns River manatee population. High human and manatee use also likely contribute to depauperate populations of submerged aquatic vegetation and proliferation of filamentous algae in the spring run.
1.3 Purpose and Scope of this Restoration Plan The Howard T. Odum Florida Springs Institute (FSI) is a private, non-profit corporation funded by grants and donations. The mission of FSI is to provide technically-sound information about Florida’s 1,000+ artesian springs needed for their protection and wise management. Since 2011, FSI has prepared holistic restoration plans for many of the major springs in Florida including the springs that feed the Santa Fe, Ichetucknee, Suwannee, and Wekiva rivers; Silver Springs, Rainbow Springs, the Kings Bay/Crystal River springs; and Wakulla Springs. The Volusia Blue Spring Restoration Plan is the final volume in this series of individual spring-group restoration plans.
Based on data collected and summarized by state and federal agencies, university research teams, consultants hired by the various Florida water management districts, and FSI, most of the artesian springs in Florida are impaired due to human activities, especially agricultural, industrial, and urban development, and due to population pressure related to outdoor recreation. These data conclusively demonstrate that decreasing spring flows due to competing human groundwater uses and increasing aquifer pollution by nitrate-nitrogen are resulting in significant changes in the type, nature, and function of spring and spring run ecosystems. Changes in spring ecology are manifested as declining water clarity, loss of native vegetation and aquatic wildlife, and increasing dominance by filamentous algae. Only a multi-faceted integrated effort by multiple stakeholders will be able to turn this declining spring’s health around. FSI is committed to being part of this important effort.
This Volusia Blue Spring Restoration Plan summarizes and integrates data from the 187 mi2 that includes the maximum extent springshed, state park, and the spring and spring run. Restoration and protection of Volusia Blue Spring will only be successful by a holistic approach to identify all external stressors and to deal with them as needed to return this endangered spring ecosystem to health.

Volusia Blue Spring Restoration Plan
1-3
Figure 1. Volusia Blue Spring general location map (FDEP, 2005).
Volusia Blue Spring Restoration Plan
1-4
Figure 2. Location map and aerial photos showing Volusia Blue Spring State Park and Blue Spring Run (WSI, 2009).

Volusia Blue Spring Restoration Plan
1-5
Figure 3. Volusia Blue Spring and spring run, showing FDEP verified impaired status for nitrate-nitrogen (Holland & Bridger, 2014).
Volusia Blue Spring Restoration Plan
2-1
Section 2.0 Environmental Conditions in the Volusia Blue Springshed
2.1 General The scope of this restoration plan includes the spring and the approximately 187 mi2 groundwater contributing basin or springshed. Volusia Blue Spring is a first-magnitude artesian spring, discharging groundwater from the Upper Floridan Aquifer. A single spring vent feeds the 2,200-foot long spring run, ending in the St. Johns River at Mile 119, near Hontoon Island and about three miles upstream from Lake Beresford and about 30-miles upstream from DeLeon Springs. Volusia Blue Spring has a long cultural history including a major Amerindian temple mound, a 19th century plantation house, and was historically an important center of commerce throughout the Middle St. Johns River area.
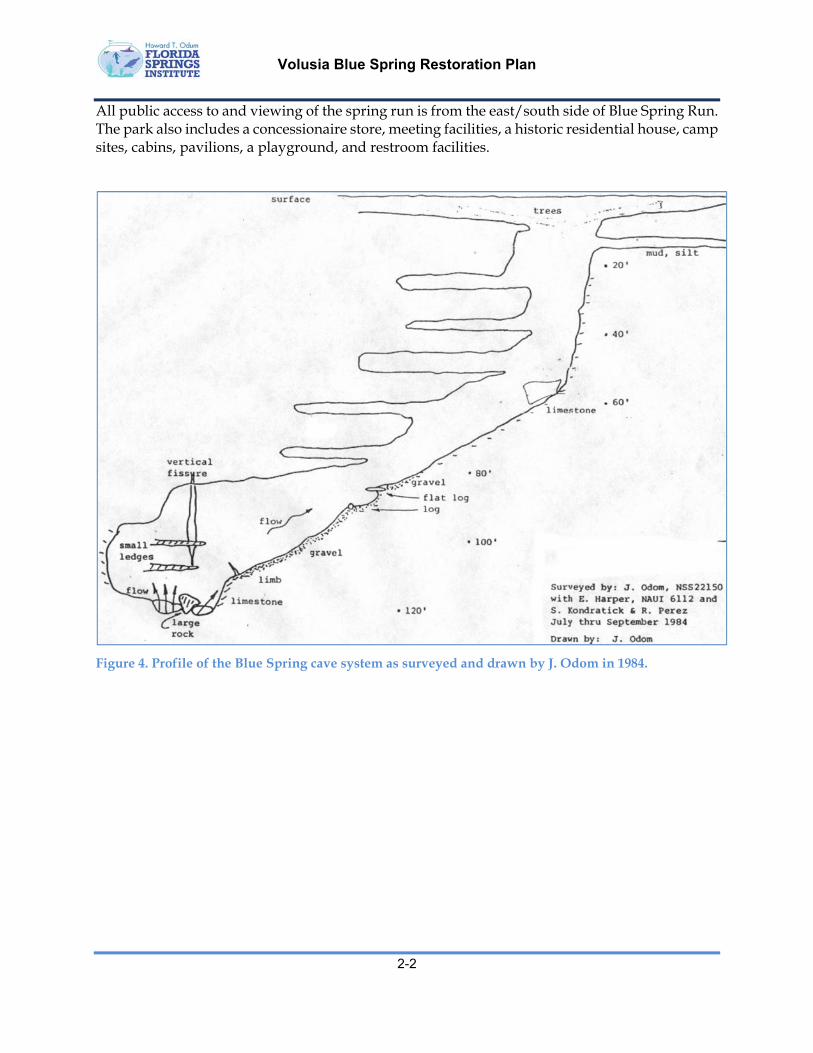
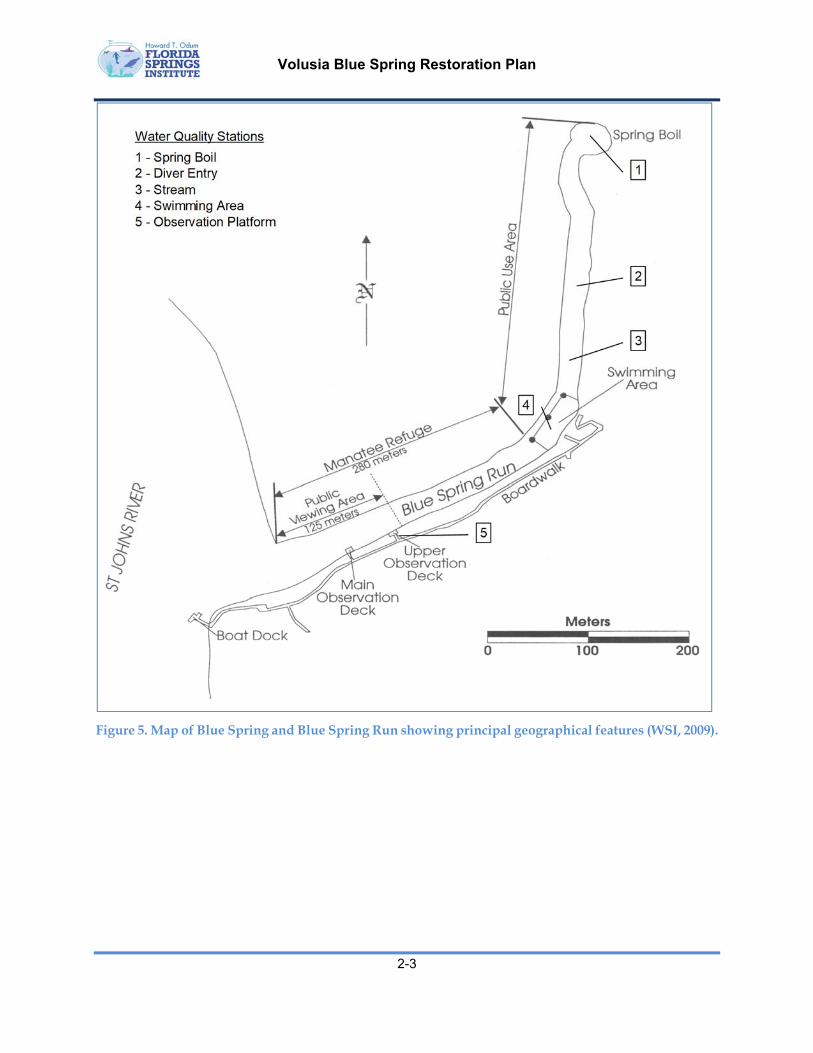
2.2 Physical Description Blue Spring has a semi-circular spring pool in a conical depression with a notable boil in the center. The spring pool measures 135-feet north to south and 105-feet east to west. Water depth over the vent is approximately 18-feet during average water levels. The bottom of the spring pool and upper portions of the spring run is composed of limestone. The spring vent is an elongated fissure in the limestone which approaches 120-feet in depth (Figure 4). The water is clear and blue with a greenish tinge. The banks surrounding the spring pool are steep and sandy and rise to about 15- to 20-feet above the water level (data from Scott, Means, Means, & Meegan, 2002). Figure 5 shows the spring run with major features.
The aquatic cave opening at Blue Spring covers less than one acre. The cave acts as a discharge point for the Floridan aquifer. The cave is a vertical shaft that angles into a room at a depth of 80- to 90-feet. At 120- to 125-feet, the cave constricts. Because of size limitations as well as high water pressure, divers cannot venture past this constriction, so the total depth or extent of the cave is unknown. The walls and edges of the cave are covered with algae. The bend in the shaft makes the deeper portions devoid of light. The bottom is covered with gravel and dead tree limbs. The cave is in fair condition, although some divers have defaced the cave with graffiti. With the help of the Cambrian Foundation, a detailed map of the cave is available. This map is distributed to aid divers who have either cave or cavern certifications.
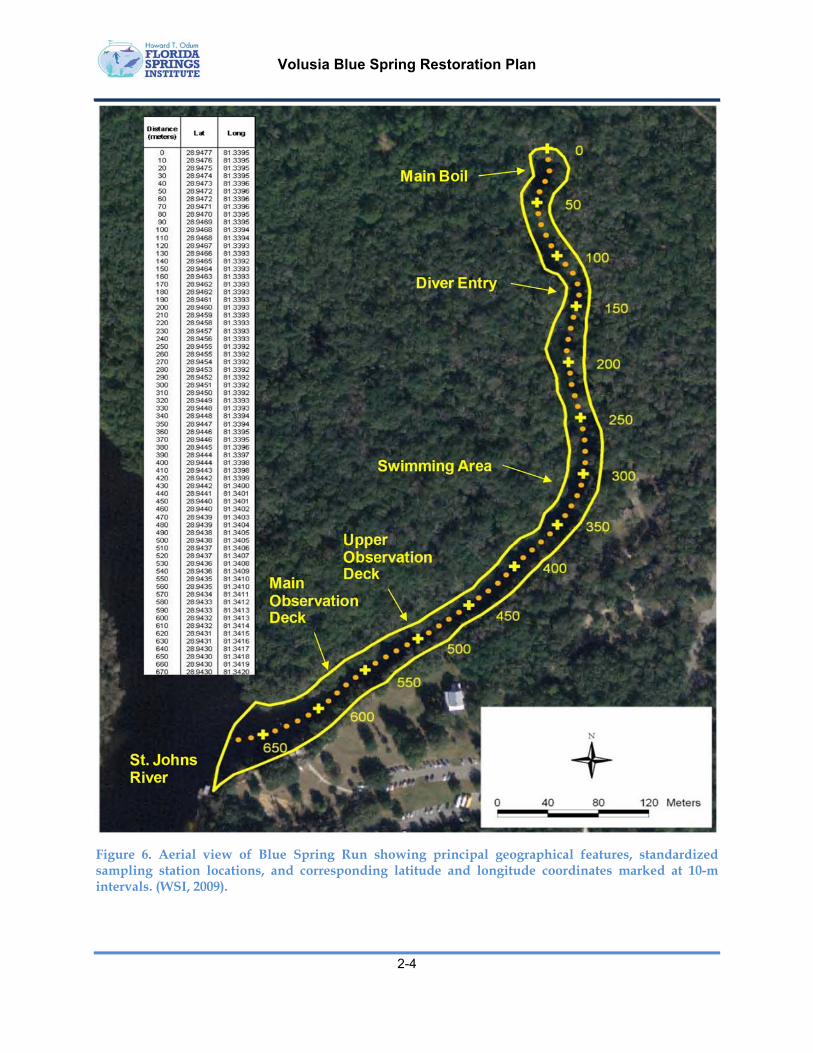
The bottom profile of the spring and spring run was surveyed in 2007 by the St. Johns River WMD. The calculated wetted surface-area of the spring and spring run is 4.1-acres. The calculated length of the spring pool and spring run starting at the upper edge of the spring basin to the point of confluence with the St. Johns River is 2,198-feet. As illustrated in Figure 5 and Figure 6, the spring run is divided into three designated reaches with previously estimated lengths as follows:
The Public Use Area (1,280 ft.) extending from the Spring Boil downstream to the Swimming Area and including the Diver Entry dock;
A Manatee Refuge with limited public access or viewing opportunities (508 ft.) extending from the Swimming Area down to the Upper Observation Deck; and
Manatee Refuge with Public Viewing (410 ft.) extending downstream from the Upper Observation Deck down to the mouth of Blue Spring Run.
Volusia Blue Spring Restoration Plan
2-2
All public access to and viewing of the spring run is from the east/south side of Blue Spring Run. The park also includes a concessionaire store, meeting facilities, a historic residential house, camp sites, cabins, pavilions, a playground, and restroom facilities.
Figure 4. Profile of the Blue Spring cave system as surveyed and drawn by J. Odom in 1984.
Volusia Blue Spring Restoration Plan
2-3
Figure 5. Map of Blue Spring and Blue Spring Run showing principal geographical features (WSI, 2009).
Volusia Blue Spring Restoration Plan
2-4
Figure 6. Aerial view of Blue Spring Run showing principal geographical features, standardized sampling station locations, and corresponding latitude and longitude coordinates marked at 10-m intervals. (WSI, 2009).

Volusia Blue Spring Restoration Plan
2-5
2.3 Climate Volusia Blue Spring lies at approximately 29 degrees north latitude in a transitional area between the warm, temperate climate of the southeastern U.S. and the subtropical climate of peninsular Florida. Mean monthly temperatures for Deland range from approximately 56°F in January to 81°F in July. Mean monthly temperatures exhibit the greatest year-to-year variability in fall and winter (November to March) and the least variability in the summer (June to September).
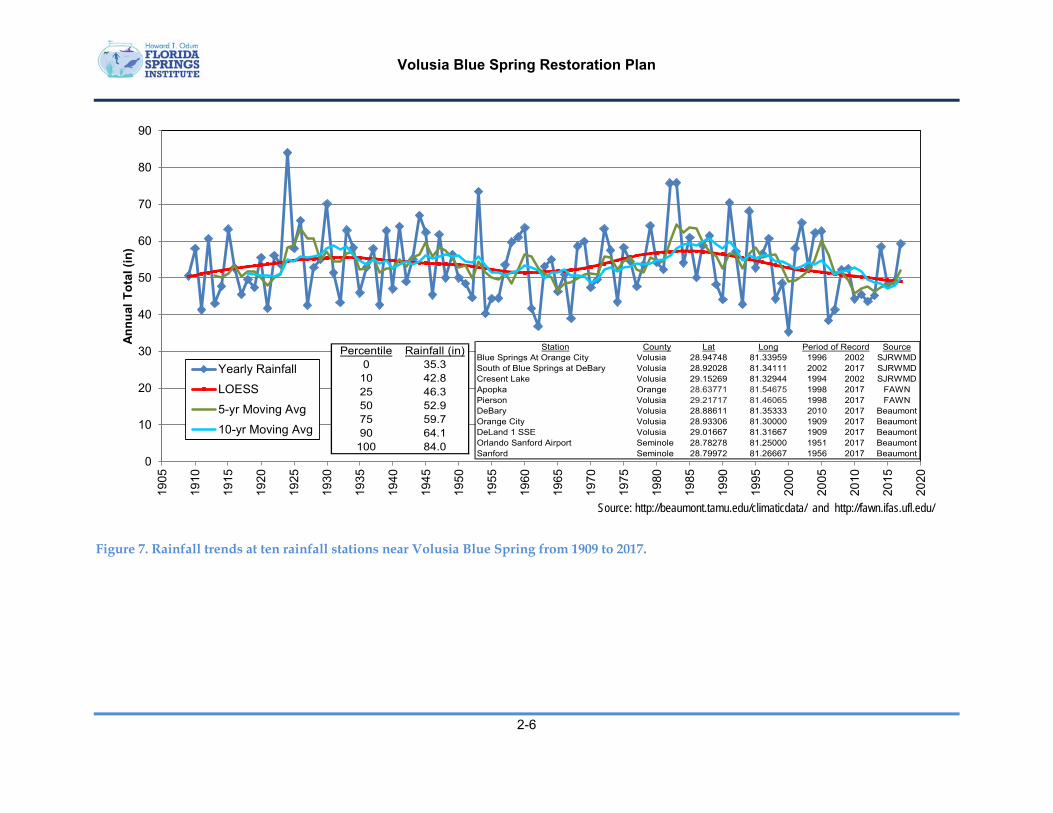
The long-term average rainfall near Blue Spring is about 53 inches (based on 15 stations from 1909 through 2017, Figure 7). Maximum recorded annual rainfall was 84 inches and the minimum recorded annual rainfall total was 35 inches. Other than a repeating 50-year variation of about 5 to 7 inches per year, there is no long-term trend in rainfall totals apparent at Blue Spring. The period from June through September is normally considerably wetter than the dry season from October through May.
Inputs of total solar energy (insolation) and photosynthetically active radiation (PAR) were estimated from October 2010 through June 2012 at Blue Spring State Park using insolation data reported from two Florida Automated Weather Network (FAWN) stations (Apopka and Pierson) (Figure 8). PAR was estimated from the insolation measurements using the relationship between hourly PAR and insolation for data collected at Blue Spring State Park from 11/13/2007 to 5/23/2008 (R2 = 0.99). These data were used to allow normalization of rates of primary productivity measured in the spring and spring run, during the same period (WSI, 2012). During this period, the average insolation recorded or estimated was 192.2 J/s/m2 and the average PAR was 370.3 µE/s/m2. The range of estimated daily average values for insolation at Blue Spring was from 6 to 344 J/s/m2 and for PAR was 11 to 662 µE/s/m2. There was a general seasonal pattern of lower sunlight energy availability during the winter and higher availability during the late spring and early summer months.
Volusia Blue Spring Restoration Plan
2-6
Figure 7. Rainfall trends at ten rainfall stations near Volusia Blue Spring from 1909 to 2017.
Source: http://beaumont.tamu.edu/climaticdata/ and http://fawn.ifas.ufl.edu/
0
10
20
30
40
50
60
70
80
90
1905
1910
1915
1920
1925
1930
1935
1940
1945
1950
1955
1960
1965
1970
1975
1980
1985
1990
1995
2000
2005
2010
2015
2020
An
nu
al T
ota
l (in
)
Yearly Rainfall
LOESS
5-yr Moving Avg
10-yr Moving Avg
Station County Lat Long SourceBlue Springs At Orange City Volusia 28.94748 81.33959 1996 2002 SJRWMDSouth of Blue Springs at DeBary Volusia 28.92028 81.34111 2002 2017 SJRWMDCresent Lake Volusia 29.15269 81.32944 1994 2002 SJRWMDApopka Orange 28.63771 81.54675 1998 2017 FAWNPierson Volusia 29.21717 81.46065 1998 2017 FAWNDeBary Volusia 28.88611 81.35333 2010 2017 BeaumontOrange City Volusia 28.93306 81.30000 1909 2017 BeaumontDeLand 1 SSE Volusia 29.01667 81.31667 1909 2017 BeaumontOrlando Sanford Airport Seminole 28.78278 81.25000 1951 2017 BeaumontSanford Seminole 28.79972 81.26667 1956 2017 Beaumont
Period of RecordPercentile Rainfall (in)0 35.3
10 42.825 46.350 52.975 59.790 64.1
100 84.0
Volusia Blue Spring Restoration Plan
2-7
Figure 8. Incident total insolation measurements and estimated photosynthetically active radiation from the Apopka and Pierson FAWN stations from October 2010 through June 2012 (WSI, 2012).
0
100
200
300
400
500
600
700
8/10/10 11/18/10 2/26/11 6/6/11 9/14/11 12/23/11 4/1/12 7/10/12 10/18/12
PAR (uE/s/m2)
Month Average Month AverageOct‐10 408 Oct‐11 312Nov‐10 267 Nov‐11 253Dec‐10 247 Dec‐11 211Jan‐11 248 Jan‐12 251Feb‐11 304 Feb‐12 267Mar‐11 402 Mar‐12 392Apr‐11 526 Apr‐12 504May‐11 550 May‐12 482Jun‐11 475 Jun‐12 413Jul‐11 445Aug‐11 426Sep‐11 387
WY 2010/2011 WY 2011/2012
0
50
100
150
200
250
300
350
400
8/10/10 11/18/10 2/26/11 6/6/11 9/14/11 12/23/11 4/1/12 7/10/12 10/18/12
Total Insolation (J/s/m2)
Month Average Month AverageOct‐10 212 Oct‐11 162Nov‐10 138 Nov‐11 131Dec‐10 128 Dec‐11 109Jan‐11 129 Jan‐12 130Feb‐11 158 Feb‐12 139Mar‐11 209 Mar‐12 203Apr‐11 273 Apr‐12 262May‐11 285 May‐12 250Jun‐11 247 Jun‐12 214Jul‐11 231Aug‐11 221Sep‐11 201
WY 2010/2011 WY 2011/2012
Volusia Blue Spring Restoration Plan
2-8
2.4 Topography Blue Spring State Park is located within the Atlantic Coastal Lowlands physiographic zone, consisting of mainly level marine terraces (FDEP, 2005). The topography is either leveled terraces or karst with the karst occurring only on the highest terraces. Blue Spring State Park can also be divided into two distinct physiographic subzones, the DeLand Ridge and the St. Johns River Valley (Brooks, 1982). The north, northeast, and east sections of Blue Spring State Park are either located within or adjacent to the higher elevations of the DeLand Ridge. The DeLand Ridge area consists mainly of deep, well-drained sands that are important for aquifer recharge. The highest elevation within Blue Spring State Park is 80 ft. above mean sea level. From higher elevations along the DeLand Ridge, the land slopes gently westward towards the St. Johns River floodplain, where the ground elevation at the river’s edge is less than 5 ft. above mean sea level.
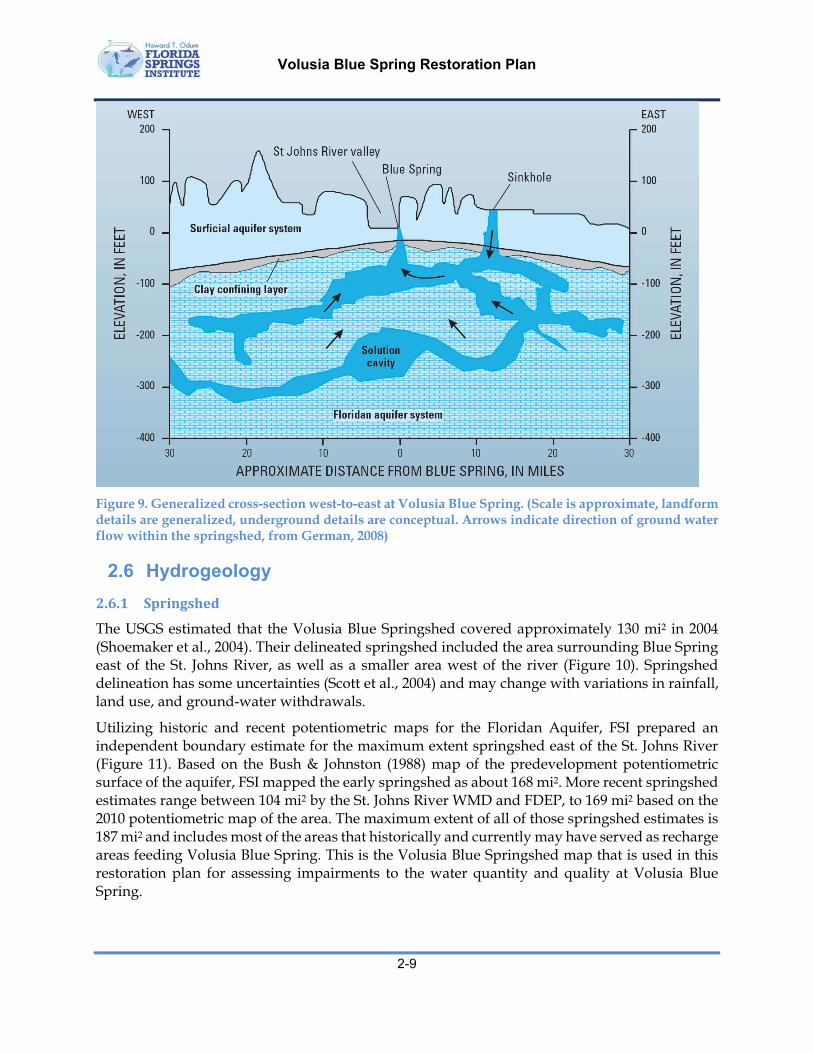
2.5 Geology Figure 9 provides a generalized geological cross-section near Volusia Blue Spring. The ground surface at Blue Spring State Park is covered with sandy marine sediments of Pleistocene to recent age (FDEP, 2005). The broad, nearly level marine terraces, relic shorelines and karst ridges, which characterize the landscape, are of Pleistocene age. The areas adjacent to the St. Johns River are more recent in geologic origin.
The geologic material can be divided into an upper sequence of unconsolidated or poorly consolidated deposits and a lower sequence of carbonate rocks. The depth to rock on the eastern edge of the DeLand Ridge is about 65 ft. The thickness of the clastic deposits varies from 50 to 100 ft. under the DeLand Ridge because of differences in local relief. The material is mostly sand, especially at the surface, but it contains discontinuous and interfingering lenses and beds of clay and shell. The carbonate rocks of the lower sequence are limestone and dolomite of middle and upper Eocene age. These rocks comprise the Floridan Aquifer.
The DeLand Ridge is a karst ridge that once formed a shoreline during interglacial periods when the sea level was much higher than it is today. Evidence of this inundation by seawater can be found within the spring-run at Blue Spring. The spring-run contains multitudes of seashells as well as prehistoric oyster beds that were laid down under higher sea levels.
Volusia Blue Spring Restoration Plan
2-9
Figure 9. Generalized cross-section west-to-east at Volusia Blue Spring. (Scale is approximate, landform details are generalized, underground details are conceptual. Arrows indicate direction of ground water flow within the springshed, from German, 2008)
2.6 Hydrogeology
2.6.1 Springshed
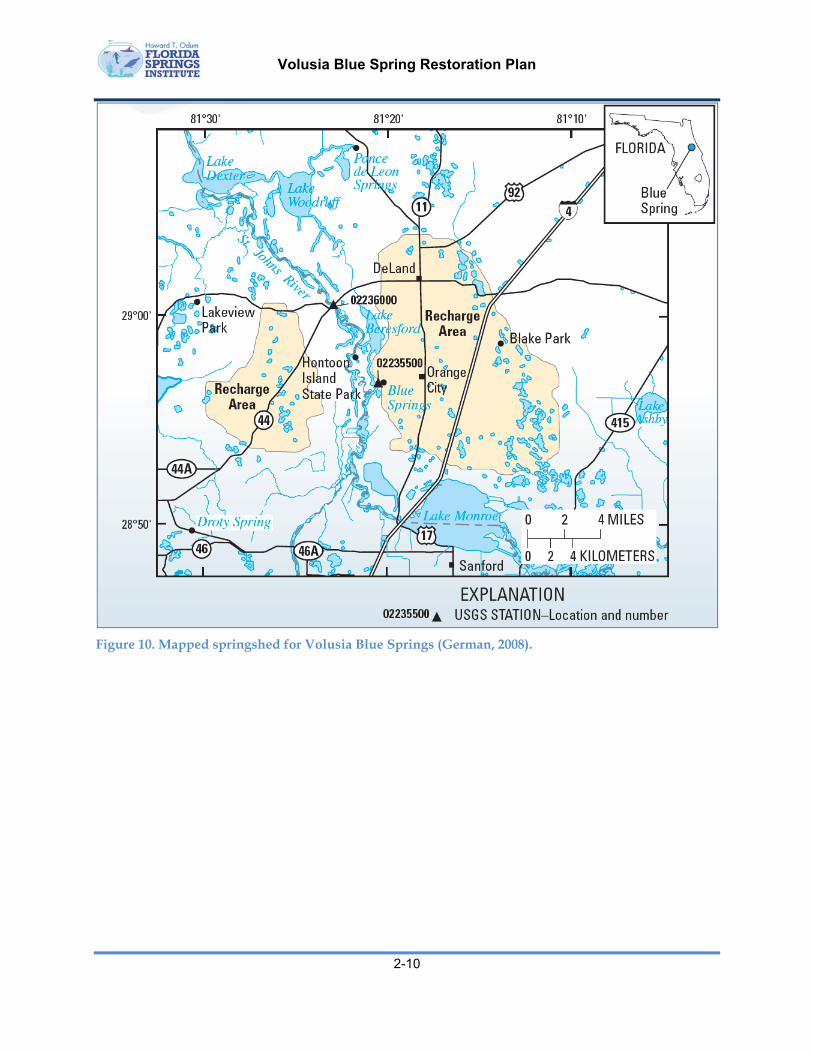
The USGS estimated that the Volusia Blue Springshed covered approximately 130 mi2 in 2004 (Shoemaker et al., 2004). Their delineated springshed included the area surrounding Blue Spring east of the St. Johns River, as well as a smaller area west of the river (Figure 10). Springshed delineation has some uncertainties (Scott et al., 2004) and may change with variations in rainfall, land use, and ground-water withdrawals.
Utilizing historic and recent potentiometric maps for the Floridan Aquifer, FSI prepared an independent boundary estimate for the maximum extent springshed east of the St. Johns River (Figure 11). Based on the Bush & Johnston (1988) map of the predevelopment potentiometric surface of the aquifer, FSI mapped the early springshed as about 168 mi2. More recent springshed estimates range between 104 mi2 by the St. Johns River WMD and FDEP, to 169 mi2 based on the 2010 potentiometric map of the area. The maximum extent of all of those springshed estimates is 187 mi2 and includes most of the areas that historically and currently may have served as recharge areas feeding Volusia Blue Spring. This is the Volusia Blue Springshed map that is used in this restoration plan for assessing impairments to the water quantity and quality at Volusia Blue Spring.
Volusia Blue Spring Restoration Plan
2-10
Figure 10. Mapped springshed for Volusia Blue Springs (German, 2008).

Volusia Blue Spring Restoration Plan
2-11
Figure 11. Historic and recent springshed delineations for Volusia Blue Spring and estimated maximum extent springshed for Volusia Blue Spring (187 mi2).
Volusia Blue Spring Restoration Plan
2-12
2.6.2 AquiferRecharge
Most of the water discharging from Blue Spring is from rain that falls on the land area within the springshed. Aucott (1988) estimated groundwater recharge and discharge for Florida (Figure 12). Mapped recharge to the Floridan Aquifer in the Volusia Blue Springshed ranges from about 1 to 10 inches per year over a springshed area of 151 mi2. The southwest portion of the springshed was mapped as a zone of groundwater discharge, namely as flow to Volusia Blue spring.
Assuming the historic flow of 162 cfs (105 MGD) at Volusia Blue Spring and this estimated recharge area, the average rate of recharge is estimated to be 14.5 inches per year. Based on an average of 53 inches of annual precipitation, this 14.5 inches is equivalent to about 27% of the annual rainfall, and, assuming negligible surface runoff, on average about 73% of annual rainfall or 38.7 inches per year is presumed to go to evapotranspiration.
Volusia Blue Spring Restoration Plan
2-13
Figure 12. Estimated recharge/discharge to/from the Floridan Aquifer in and around the Volusia Blue Springshed (Aucott, 1988).
Volusia Blue Spring Restoration Plan
2-14
2.6.3 SpringDischarge
Blue Spring is a natural breach in a clay layer that separates the surface sands of the surficial aquifer system from the limestone and dolomite rocks of the FAS. The principal features of a spring system include an upland area where rainfall seeps into the surficial aquifer system. There also must be sinkholes or gaps in the clay layer where water can flow downward into the FAS. Interconnected solution cavities and cracks in the rocks of the FAS conduct large quantities of water to the spring vent. Large springs, such as Blue Spring, are at the end of a complex drainage system in an aquifer that underlies the land surface. An aquifer is any layer of rock, sand, or other material through which water can flow.
A springshed occupies areas within ground- and surface-water basins that contribute to the discharge of the spring. The boundary of the ground-water basin varies because of changes in water pressure in the FAS. The water pressure changes in response to the seasonal pattern of rainfall, and in response to long-term factors such as drought and the amount of groundwater withdrawn from the FAS.
Water flows upward from a spring vent because the water level of the spring pool is lower than the water level in the aquifers in higher parts of the springshed. Thus, the spring system is analogous to a water-distribution system in which a standpipe, or large water tank, stores water at a higher elevation than homes. Water flows “downhill” from the water tank through the distribution plumbing to the homes and through natural voids in the limestone to Blue Spring.
Computerized ground-water models have indicated that the travel-time of raindrops, from land surface to the spring discharge, is a journey that ranges from a few years to thousands of years, depending on where the raindrop enters the surficial aquifer system (German, 2008). In general, the greater the distance from the rainfall to the spring vent, the longer the travel-time. Speed of water movement in the FAS is not the same everywhere in the springshed. Large systems of interconnected cavities can transport water rapidly through the aquifer system.
Ground water that discharges from the spring is a mixture of water from different parts of the springshed and of various ages. Additionally, some of this water from rainfall mixes with ancient seawater still present in deep layers of rock. Groundwater flow models indicate that about half of the water discharged from Blue Spring is between about 40 and 110 years old. Age dating of spring water by isotopes, conducted in 1996 and 2001 by the St. Johns River WMD, indicates that spring flow is dominated by ground water that is less than 43 years old (Osburn, Toth, & Boniol, 2006). These age estimates indicate that present-day spring water quality is likely affected by both decades-old and more recent land-use practices.
Figure 13 provides the entire period of discharge measurements for Volusia Blue Spring beginning in 1932. Average discharge for years 1932 - 1974 measured by the USGS was 105 MGD (162 cfs) and is classified as “historic flow.” The mean annual flow for Volusia Blue Spring for the entire period-of-record was 155 cfs (100 MGD), with a range of annual averages between 121 and 184 cfs (78 to 119 MGD).

Volusia Blue Spring Restoration Plan
2-15
Figure 13. Reported annual average discharge at Blue Spring near Orange City in Volusia County, Florida (USGS Station 02235500).
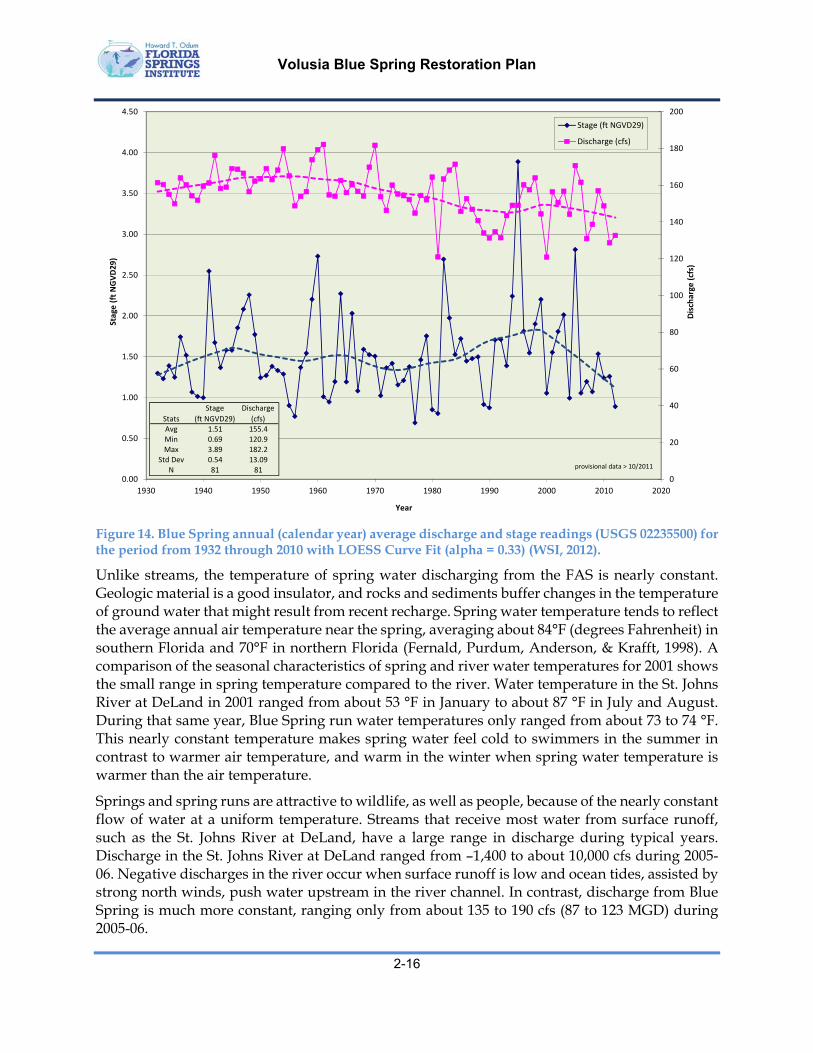
Figure 14 provides a time series of annual average discharge and stage readings at Volusia Blue Spring for the period from 1932 through 2010 as summarized by WSI (2012) (average 155.4 cfs and 1.51 ft. NGVD29, respectively). These data show a long-term decline in discharge with no comparable long-term decline in stage over the period-of-record. Flow in Blue Spring and Blue Spring Run is largely controlled by the difference in stage between the Floridan aquifer and the level of water in the St. Johns River (Rouhani, Sucsy, Hall, Osburn, & Wild, 2006). Water levels in Blue Spring Run are primarily controlled by the level of water in the St. Johns River and not by the spring discharge rate (Sucsy, 2005).
100
110
120
130
140
150
160
170
180
190
200
1930 1940 1950 1960 1970 1980 1990 2000 2010 2020
Discharge
(cfs)
Year
Stats Discharge (cfs)
Average 155
Median 157
Maximum 184
Minimum 121
Std Dev 15.2
N 84
POR 1932
2017
Volusia Blue Spring Restoration Plan
2-16
Figure 14. Blue Spring annual (calendar year) average discharge and stage readings (USGS 02235500) for the period from 1932 through 2010 with LOESS Curve Fit (alpha = 0.33) (WSI, 2012).
Unlike streams, the temperature of spring water discharging from the FAS is nearly constant. Geologic material is a good insulator, and rocks and sediments buffer changes in the temperature of ground water that might result from recent recharge. Spring water temperature tends to reflect the average annual air temperature near the spring, averaging about 84°F (degrees Fahrenheit) in southern Florida and 70°F in northern Florida (Fernald, Purdum, Anderson, & Krafft, 1998). A comparison of the seasonal characteristics of spring and river water temperatures for 2001 shows the small range in spring temperature compared to the river. Water temperature in the St. Johns River at DeLand in 2001 ranged from about 53 °F in January to about 87 °F in July and August. During that same year, Blue Spring run water temperatures only ranged from about 73 to 74 °F. This nearly constant temperature makes spring water feel cold to swimmers in the summer in contrast to warmer air temperature, and warm in the winter when spring water temperature is warmer than the air temperature.
Springs and spring runs are attractive to wildlife, as well as people, because of the nearly constant flow of water at a uniform temperature. Streams that receive most water from surface runoff, such as the St. Johns River at DeLand, have a large range in discharge during typical years. Discharge in the St. Johns River at DeLand ranged from –1,400 to about 10,000 cfs during 2005-06. Negative discharges in the river occur when surface runoff is low and ocean tides, assisted by strong north winds, push water upstream in the river channel. In contrast, discharge from Blue Spring is much more constant, ranging only from about 135 to 190 cfs (87 to 123 MGD) during 2005-06.
0
20
40
60
80
100
120
140
160
180
200
0.00
0.50
1.00
1.50
2.00
2.50
3.00
3.50
4.00
4.50
1930 1940 1950 1960 1970 1980 1990 2000 2010 2020
Discharge (cfs)
Stage (ft NGVD29)
Year
Stage (ft NGVD29)
Discharge (cfs)
provisional data > 10/2011
Stats
Stage
(ft NGVD29)
Discharge
(cfs)Avg 1.51 155.4Min 0.69 120.9Max 3.89 182.2
Std Dev 0.54 13.09N 81 81

Volusia Blue Spring Restoration Plan
2-17
2.6.4 GroundwaterQuality
The dissolution of limestone and dolomite rock creates the caves and solution cavities that are characteristic of the FAS. This dissolution occurs when rain, which becomes acidic due to the inclusion of atmospheric carbon dioxide, percolates through the surficial aquifer sediments and reacts with the limestone and dolomite. The dissolving process also affects the chemistry of water discharged by a spring, adding calcium, magnesium, bicarbonate, and sulfate ions to the water. Most springs in Florida discharge water that contains a predominately calcium-magnesium bicarbonate mixture of ions (Slack & Rosenau, 1979). Another major factor affecting water quality is the occurrence of seawater that borders the Florida peninsula, and underlies the entire state at various depths. Seawater is chemically complex but is predominately a sodium-chloride type of water. At some locations, including along the St. Johns River, ancient seawater can move upward from deep layers of rock and become part of the water discharged by springs. Such is the case for Blue Spring, which discharges water of a predominately sodium-chloride type, although it also contains calcium, magnesium, potassium, bicarbonate, and sulfate in concentrations exceeding 1 mg/L (milligram per liter).
Water from Blue Spring generally is not suitable for drinking, because the chloride concentration at times exceeds the recommended secondary drinking water level of 250 mg/L (U.S. Environmental Protection Agency (USEPA), 2006). Chloride concentrations exceeding 250 mg/L may have an objectionable salty taste for many people. The chloride originates from deep within the FAS and probably comes from inflow of old seawater into the spring flow system. The concentration of chloride is rising over time and has ranged from 110 to 700 mg/L since 1960.
2.7 Springshed Land Use and Human Population Figure 15 provides a map of land use categories within the Volusia Blue Springshed for the period from 2013-16. As summarized in Table 1, urban and built-up land uses occupy the highest percentage of the springshed at 41.6%, followed by wetlands at 21.4%, and upland forest at 20.1%. Intensive agriculture makes up 6.2% of the springshed, followed by rangeland at 4%. Remaining categories include transportation at 2.8% and barren lands at 0.2%.

Volusia Blue Spring Restoration Plan
2-18
Figure 15. Land use in the 187 mi2 maximum extent Volusia Blue Springshed for 2013 – 2016 (FDEP data).

Volusia Blue Spring Restoration Plan
2-19
Table 1. Summary of land use in the 187 mi2 maximum extent Volusia Blue Springshed 2013-16 (FDEP 2016 data).
Area
Land Use (Sq. Mi.) of LEVEL 1 of Total
Urban (1000) 77.8 100 41.6
Commercial and Services 5.88 7.56 3.14
Extractive 0.17 0.22 0.09
Industrial 0.66 0.85 0.35
Institutional 3.34 4.30 1.79
Open Land 0.52 0.67 0.28
Recreational 2.51 3.22 1.34
Residential High Density 3.18 4.09 1.70
Residential Low Density 25.29 32.51 13.53
Residential Medium Density 36.26 46.60 19.39
Agriculture (2000) 11.5 100 6.15
Cropland and Pastureland 8.83 76.8 4.72
Feeding Operations 0.02 0.14 0.01
Nurseries and Vineyards 1.52 13.2 0.81
Other Open Lands <Rural> 0.13 1.10 0.07
Specialty Farms 0.58 5.04 0.31
Tree Crops 0.48 4.14 0.25
Rangeland (3000) 7.39 100 3.95
Herbaceous 1.34 18.1 0.71
Mixed Rangeland 1.42 19.2 0.76
Shrub and Brushland 4.64 62.8 2.48
Upland Forest (4000) 37.6 100 20.1
Tree Plantations 6.92 18.4 3.70
Upland Coniferous Forests 15.6 41.4 8.33
Upland Hardwood Forests 1.89 5.02 1.01
Upland Mixed Forests 13.2 35.2 7.08
Water (5000) 6.82 100 3.65
Lakes 5.37 78.8 2.87
Major Springs 0.01 0.08 0.00
Reservoirs 0.82 12.1 0.44
Streams and Waterways 0.62 9.13 0.33
Wetlands (6000) 40.0 100 21.4
Non‐Vegetated 0.01 0.02 0.01
Vegetated Non‐Forested Wetlands 13.3 33.2 7.11
Wetland Coniferous Forests 7.60 19.0 4.07
Wetland Forested Mixed 7.68 19.2 4.11
Wetland Hardwood Forests 11.4 28.5 6.10
Barren Land (7000) 0.34 100 0.18
Disturbed Lands 0.34 101 0.18
Transportation (8000) 5.29 100 2.83
Communications 0.04 0.71 0.02
Transportation 2.85 53.9 1.53
Utilities 2.39 45.3 1.28
Total 187 ‐‐‐ 100
Percent
Volusia Blue Spring Restoration Plan
2-20
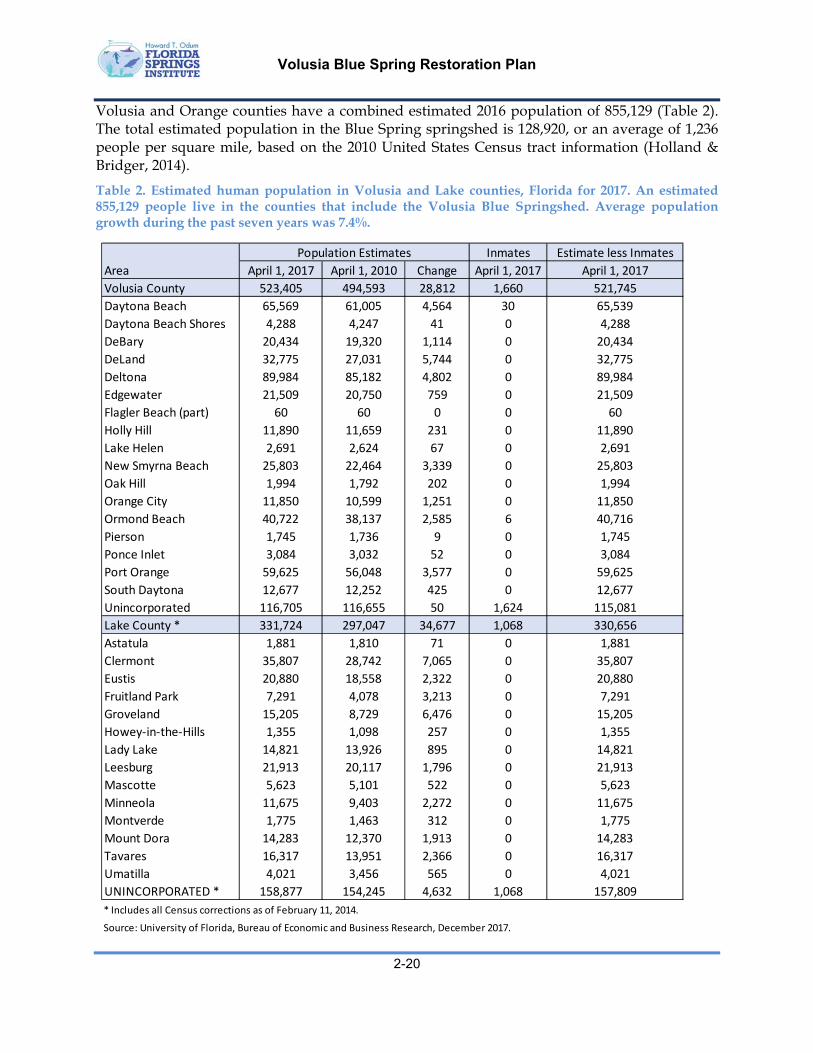
Volusia and Orange counties have a combined estimated 2016 population of 855,129 (Table 2). The total estimated population in the Blue Spring springshed is 128,920, or an average of 1,236 people per square mile, based on the 2010 United States Census tract information (Holland & Bridger, 2014).
Table 2. Estimated human population in Volusia and Lake counties, Florida for 2017. An estimated 855,129 people live in the counties that include the Volusia Blue Springshed. Average population growth during the past seven years was 7.4%.
Inmates Estimate less Inmates
Area April 1, 2017 April 1, 2010 Change April 1, 2017 April 1, 2017
Volusia County 523,405 494,593 28,812 1,660 521,745
Daytona Beach 65,569 61,005 4,564 30 65,539
Daytona Beach Shores 4,288 4,247 41 0 4,288
DeBary 20,434 19,320 1,114 0 20,434
DeLand 32,775 27,031 5,744 0 32,775
Deltona 89,984 85,182 4,802 0 89,984
Edgewater 21,509 20,750 759 0 21,509
Flagler Beach (part) 60 60 0 0 60
Holly Hill 11,890 11,659 231 0 11,890
Lake Helen 2,691 2,624 67 0 2,691
New Smyrna Beach 25,803 22,464 3,339 0 25,803
Oak Hill 1,994 1,792 202 0 1,994
Orange City 11,850 10,599 1,251 0 11,850
Ormond Beach 40,722 38,137 2,585 6 40,716
Pierson 1,745 1,736 9 0 1,745
Ponce Inlet 3,084 3,032 52 0 3,084
Port Orange 59,625 56,048 3,577 0 59,625
South Daytona 12,677 12,252 425 0 12,677
Unincorporated 116,705 116,655 50 1,624 115,081
Lake County * 331,724 297,047 34,677 1,068 330,656
Astatula 1,881 1,810 71 0 1,881
Clermont 35,807 28,742 7,065 0 35,807
Eustis 20,880 18,558 2,322 0 20,880
Fruitland Park 7,291 4,078 3,213 0 7,291
Groveland 15,205 8,729 6,476 0 15,205
Howey‐in‐the‐Hills 1,355 1,098 257 0 1,355
Lady Lake 14,821 13,926 895 0 14,821
Leesburg 21,913 20,117 1,796 0 21,913
Mascotte 5,623 5,101 522 0 5,623
Minneola 11,675 9,403 2,272 0 11,675
Montverde 1,775 1,463 312 0 1,775
Mount Dora 14,283 12,370 1,913 0 14,283
Tavares 16,317 13,951 2,366 0 16,317
Umatilla 4,021 3,456 565 0 4,021
UNINCORPORATED * 158,877 154,245 4,632 1,068 157,809
* Includes all Census corrections as of February 11, 2014.
Source: University of Florida, Bureau of Economic and Business Research, December 2017.
Population Estimates

Volusia Blue Spring Restoration Plan
2-21
2.8 Ecology
2.8.1 BlueSpring/BlueSpringRunConceptualEcosystemModel
A conceptual model provides a tool for summarizing the most important components of the Blue Spring ecosystem (energy and matter storages) and their inter-relationships. Preparation of a conceptual ecosystem model allows definition of boundaries with external influences clearly identified, as well as quantification of the internal energy and matter flows and their hypothesized interactions. A model can also be used to aggregate or expand the view of the system to help focus attention on an optimal level of detail to best answer a given question.
The Volusia Blue Spring Conceptual Ecosystem Model is presented below in the “Energese” model language of Odum (see Figure 16 and Odum (1983) for a description of symbols used in these models).
Figure 16. Energy Symbols in the “Energese” Model Language (Odum, 1983).
Volusia Blue Spring Restoration Plan
2-22
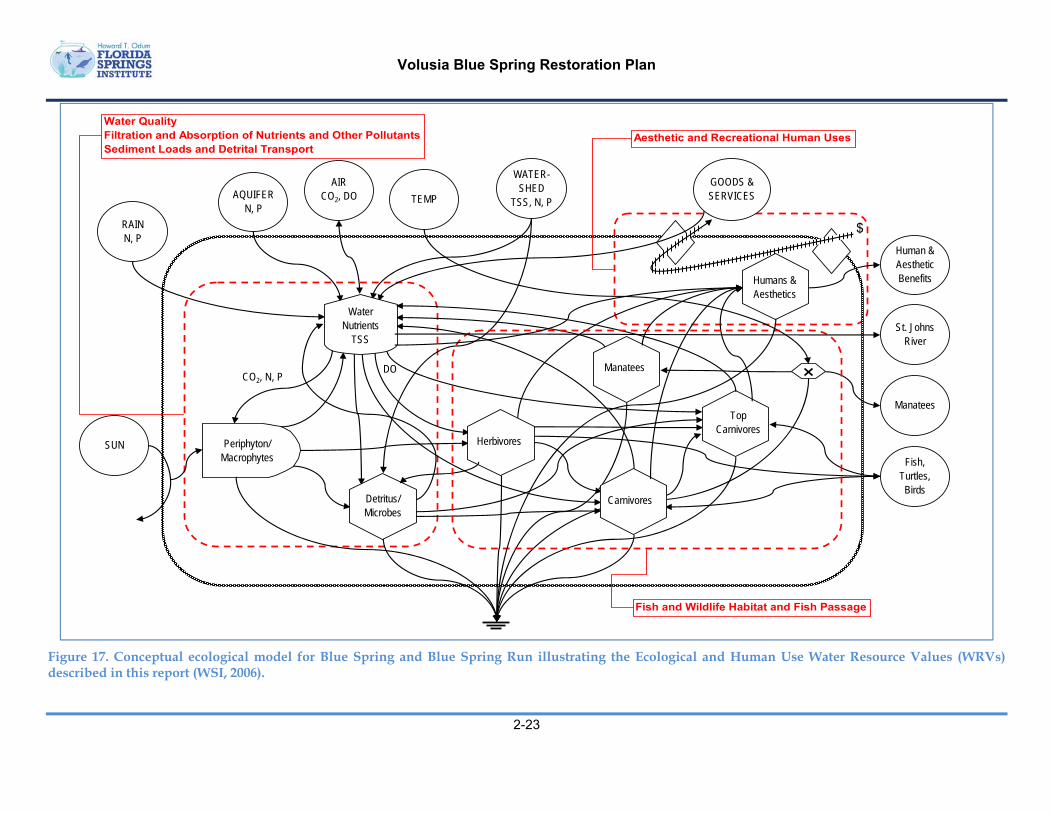
Figure 17 presents a conceptual ecological model for Volusia Blue Spring. The conceptual spring model was used to illustrate the most likely linkages between each Ecological and Human Water Resource Value (WRV) evaluated by WSI (2006) for the Volusia Blue Spring minimum flow evaluation.
The Volusia Blue Spring Run Conceptual Ecosystem Model includes the following components: External Forcing Functions
o Sunlight o Rainfall with dissolved and particulate nutrients o Groundwater inputs of water and dissolved nutrients o Atmospheric gas connections o Temperature o Watershed/springshed interactions o St. Johns River o Human goods and services
Downstream Exchanges o Manatees moving in and out from the St. Johns River o Fish, amphibians, reptiles, birds moving in and out from the St. Johns River and
surrounding uplands o Aesthetic and economic benefits to humans both within and outside the aquatic
environment Internal State Variables (Storages)
o Water o Nutrients and suspended solids o Detritus/microbes o Periphytic algae/aquatic macrophytes o Aquatic herbivores (other than manatees, such as mullet, tilapia, turtles, aquatic
insects, etc.) o Manatees o Aquatic carnivores (catfish, bream, bass, aquatic insects, etc.) o Aquatic top carnivores (e.g., alligators and otters) o Humans and aesthetics
Groups of state variables and energy flows representing each of the WRVs discussed in WSI (2006) are circled with dashed lines. Temperature is shown as an important influence on manatee movements between the spring run and the St. Johns River, and has been described in detail by others (Rouhani et al., 2006). This conceptual model also shows the importance of the interaction between humans and manatees, and other wildlife in the spring run. The presence of the wildlife and the beauty of the spring and spring run (aesthetics) attract people to the park. These people spend money at the park (by convention shown flowing opposite to energy flows) that is used for a variety of activities that influence the ecology of the spring run (e.g., trails, boardwalks, picnic areas, parking lots, cabins, office staff, water, and sewer systems, etc.).
Volusia Blue Spring Restoration Plan
2-23
Figure 17. Conceptual ecological model for Blue Spring and Blue Spring Run illustrating the Ecological and Human Use Water Resource Values (WRVs) described in this report (WSI, 2006).
SUN
RAINN, P
AQUIFERN, P
AIRCO2, DO TEMP
WATER-SHED
TSS, N, P
GOODS & SERVICES
$
CO2, N, PDO
Fish, Turtles, Birds
Manatees
Human & Aesthetic Benefits
WaterNutrients
TSS
Periphyton/ Macrophytes
Detritus/Microbes
Carnivores
TopCarnivores
Manatees
Herbivores
Water QualityFiltration and Absorption of Nutrients and Other Pollutants Sediment Loads and Detrital Transport
Aesthetic and Recreational Human Uses
Fish and Wildlife Habitat and Fish Passage
Humans & Aesthetics
St. JohnsRiver
Volusia Blue Spring Restoration Plan
2-24
2.8.2 PhysicalEnvironment
2.8.2.1 BottomTemperatureProfile
Volusia Blue Spring Run bottom water temperatures were reported for the period from 2000 to 2012 (WSI, 2012). Beginning at approximately VBS 530, and going downstream 150 meters, the bottom temperature of the spring run was monitored at 10-m intervals. Over the period of record (November 2000 through June 2012), the average bottom water temperatures ranged from 70.3 °F (21.3°C) at VBS-670 (St. Johns River) to 73.4 °F (23.0°C) at VBS-370 (streamflow gaging station). Figure 17 illustrates the observed upstream extent of the colder St. Johns River water into Blue Spring Run during the winter months. The lowest bottom temperatures near the confluence between Blue Spring Run and the St. Johns River typically occurred in the months from November through February.
2.8.2.2 LightAttenuation
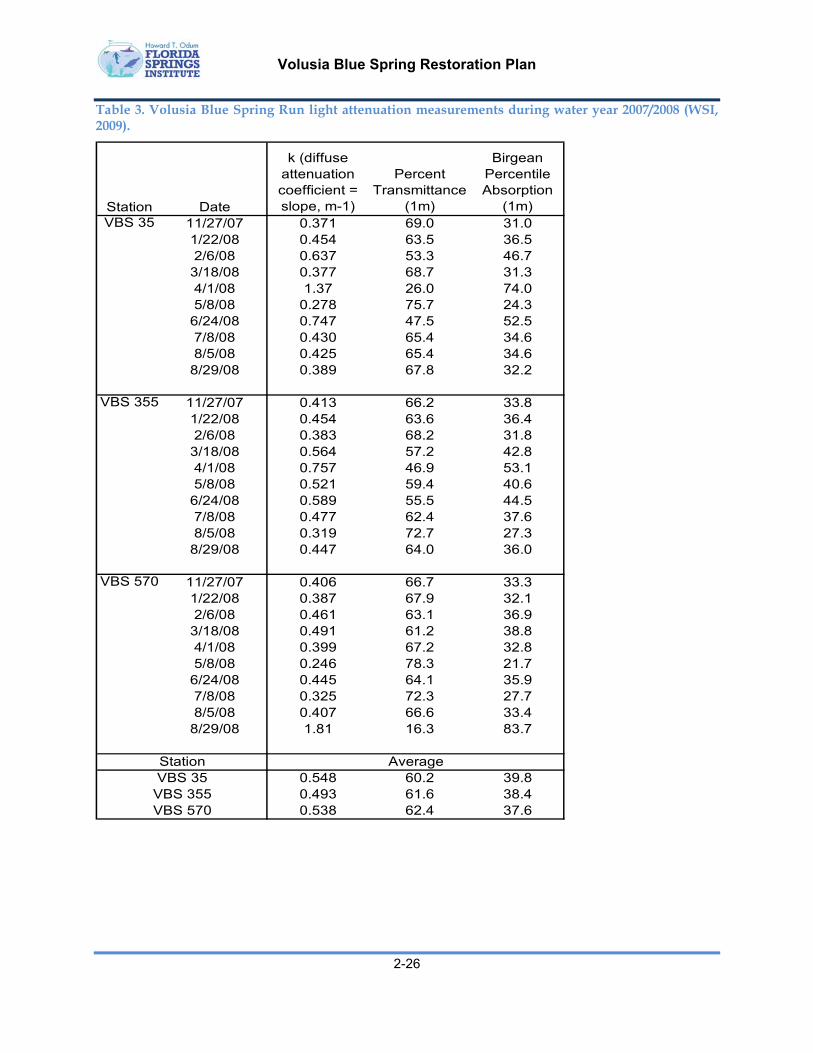
Attenuation of photosynthetically active radiation (PAR) in Blue Spring Run was reported by WSI (2009) for 2007 and 2008. PAR attenuation or water clarity was generally similar along the entire length of the spring run (Table 3), with average extinction estimates between 0.49 to 0.55 m-1. Estimated percent transmission of PAR in the spring run water was about 60% (at 1 m water depth) at all three stations. Undisturbed conditions at all three stations resulted in lower measured light extinction values between 0.25 and 0.32 m-1. Recreational swimming in the upper portion of the spring run, manatee activity, and intrusion of dark water from the St. Johns River were all observed to contribute to seasonal lowering of light transmission (greater turbidity and/or color) in Blue Spring and Blue Spring Run (WSI, 2009).
Horizontal Secchi disk readings are summarized in Figure 19. At the upstream station the readings averaged about 49 feet with a range of observed values between 28 to 76 feet. Average Secchi disk readings declined with distance down the spring run with averages of about 26 feet at the mid-point (VBS-355) and 19 feet at VBS-570. Horizontal Secchi disk visibility was dramatically reduced in the lower spring run during a period of St. Johns River inundation.

Volusia Blue Spring Restoration Plan
2-25
Figure 18. Monthly average bottom water temperature measurements at Blue Spring for the period-of-record from 2000 through 2012 (USGS data).
16.0
17.0
18.0
19.0
20.0
21.0
22.0
23.0
24.0
Jan Feb Mar Apr May Jun Jul Aug Sep Oct Nov Dec
Water Te
mperature (C)
Month
680m
670m
660m
650m
640m
630m
620m
610m
600m
590m
580m
570m
560m
550m
540m
530m
370m
Station Avg Max Min Std Dev N Min Date Max Date680 21.68 26.35 11.20 2.86 1,315 11/10/00 1/10/05670 21.34 23.45 9.10 3.02 1,638 11/10/00 10/16/11660 21.93 24.10 11.35 2.56 2,176 11/10/00 10/16/11650 21.87 25.30 8.60 2.69 2,154 11/10/00 10/16/11640 22.14 24.00 8.60 2.33 2,560 11/10/00 10/16/11630 21.95 23.50 2.10 2.71 2,173 11/10/00 7/12/10620 22.21 24.00 6.40 2.05 2,174 11/10/00 7/12/10610 22.46 24.35 10.30 1.81 2,199 11/10/00 7/12/10600 22.42 24.70 12.05 1.71 2,080 11/10/00 7/12/10590 22.66 24.95 12.30 1.42 2,158 11/10/00 7/12/10580 22.62 24.05 12.30 1.25 2,106 11/10/00 10/16/11570 22.53 23.35 12.15 1.12 2,159 11/10/00 7/12/10560 22.73 24.05 12.30 1.01 2,122 11/10/00 9/30/11550 22.76 23.55 14.40 0.88 1,836 11/10/00 7/12/10540 22.85 24.15 15.00 0.62 1,908 11/10/00 7/12/10530 22.77 24.70 17.00 0.47 1,892 11/10/00 10/16/11370 23.04 23.45 22.40 0.18 3,658 11/10/00 6/30/12
Provisional data >10/1/09
Perod of Record
Volusia Blue Spring Restoration Plan
2-26
Table 3. Volusia Blue Spring Run light attenuation measurements during water year 2007/2008 (WSI, 2009).
Station Date
k (diffuse attenuation coefficient = slope, m-1)
PercentTransmittance
(1m)
BirgeanPercentileAbsorption
(1m)VBS 35 11/27/07 0.371 69.0 31.0
1/22/08 0.454 63.5 36.52/6/08 0.637 53.3 46.73/18/08 0.377 68.7 31.34/1/08 1.37 26.0 74.05/8/08 0.278 75.7 24.36/24/08 0.747 47.5 52.57/8/08 0.430 65.4 34.68/5/08 0.425 65.4 34.68/29/08 0.389 67.8 32.2
VBS 355 11/27/07 0.413 66.2 33.81/22/08 0.454 63.6 36.42/6/08 0.383 68.2 31.83/18/08 0.564 57.2 42.84/1/08 0.757 46.9 53.15/8/08 0.521 59.4 40.66/24/08 0.589 55.5 44.57/8/08 0.477 62.4 37.68/5/08 0.319 72.7 27.38/29/08 0.447 64.0 36.0
VBS 570 11/27/07 0.406 66.7 33.31/22/08 0.387 67.9 32.12/6/08 0.461 63.1 36.93/18/08 0.491 61.2 38.84/1/08 0.399 67.2 32.85/8/08 0.246 78.3 21.76/24/08 0.445 64.1 35.97/8/08 0.325 72.3 27.78/5/08 0.407 66.6 33.48/29/08 1.81 16.3 83.7
0.548 60.2 39.80.493 61.6 38.40.538 62.4 37.6
VBS 35VBS 355VBS 570
AverageStation

Volusia Blue Spring Restoration Plan
2-27
Figure 19. Blue Spring horizontal Secchi disk measurements during Water Year 2007 / 2008 (WSI, 2009).
0
5
10
15
20
25
0 100 200 300 400 500 600 700 800
Distance Downstream from vent (m)
Ho
rizo
nta
l Se
cc
hi V
isib
ility
(m
)
2/6/08 3/18/08 4/1/08 5/23/08 6/24/08 8/29/08
-5
0
5
10
15
20
25
Feb-08 Mar-08 Apr-08 May-08 Jun-08 Jul-08 Aug-08
Ho
rizo
nta
l Se
cc
hi V
isib
ility
(m
)
Average (± sd. dev.)

Volusia Blue Spring Restoration Plan
2-28
2.8.3 WaterQuality
Table 4 provides a summary of the water quality data collected by the USGS and FDEP Florida Springs Initiative in Blue Spring and Blue Spring Run from October 2010 through June 2012.
Water quality in Blue Spring and Blue Spring Run is characteristic of the Floridan Aquifer, with high clarity, high dissolved solids, and generally low pollutant concentrations. The mean temperature of the spring is 73.4 °F and the recorded temperature range is only from 70.7 to 76.1 °F at the downstream water quality station. Dissolved oxygen is typically quite low in Blue Spring (average 0.6 mg/L) and increases downstream in the run to an average of 1.4 mg/L. The average specific conductance at VBS-370 was 1,976 µS/cm with an observed range from 1,210 to 2,420 µS/cm. Color in the spring run is very low and averages 3.2 platinum cobalt units (PCU).
Where Blue Spring Run mixes with the St. Johns River, water clarity drops due to relatively high dissolved color in the river. Temperature and salinity gradients occur at the confluence of the spring run and the river. Mean temperature in the St. Johns River near Deland is more variable than in the spring run, with an average of 74.8 °F and a recorded range from 52.9 to 88.2 °F. Average dissolved oxygen levels are higher in the St. Johns River (5.7 mg/L) than in the spring run. Specific conductance is typically lower in the St. Johns River, with an average of 950 μS/cm at DeLand. Average color in the St. Johns River at Deland is 133 PCU with a range from 95 to 500 PCU.
Between 2010 and 2012, total nitrogen (TN) average concentrations in Blue Spring Run ranged from 0.56 to 0.67 mg/L. On average, approximately 74% of this nitrogen was in the nitrate form with average concentrations between 0.39 and 0.55 mg/L. Ammonia nitrogen averages ranged from 0.05 to 0.09 mg/L (about 12% of TN) and organic nitrogen ranged from 0.06 to 0.12 mg/L (14% of TN). Sources of nitrate-nitrogen in the Floridan Aquifer may include atmospheric deposition (rainfall and dry fallout), fertilizers, and animal and human wastes. Nitrate-nitrogen concentration levels less than 0.02 mg/L are natural background levels in ground water in peninsular Florida (Harrington, Maddox, & Hicks, 2010). Nitrate concentrations in Volusia Blue Spring since 1975 have ranged from below natural background levels to 1.2 mg/L. Although concentrations of nitrate have shown considerable fluctuation, an overall increasing trend in concentrations appears to have occurred between 1975 and 2013 (Holland and Bridger 2014; Figure 19). The long-term annual mean concentration is 0.49 mg/L, with annual-average concentrations ranging from 0.01 mg/L in May 1975, to 0.72 mg/L in 2009. Nitrate concentrations in Blue Spring and in many of Florida’s other springs are higher than the numeric standard of 0.35 mg/L (Knight 2015).
Total phosphorus (TP) average concentrations in Blue Spring Run ranged from 0.070 to 0.082 mg/L, primarily in the form of dissolved ortho-phosphate. There is no apparent increasing trend in TP concentrations in Volusia Blue Spring.
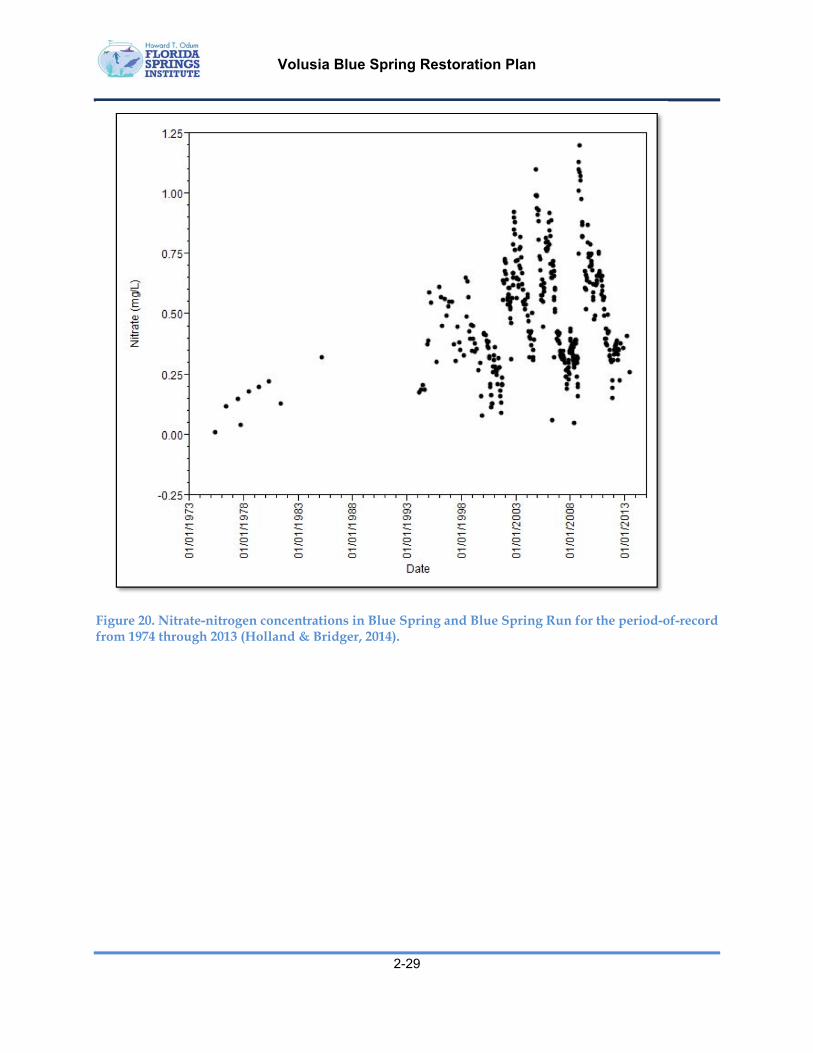
Volusia Blue Spring Restoration Plan
2-29
Figure 20. Nitrate-nitrogen concentrations in Blue Spring and Blue Spring Run for the period-of-record from 1974 through 2013 (Holland & Bridger, 2014).
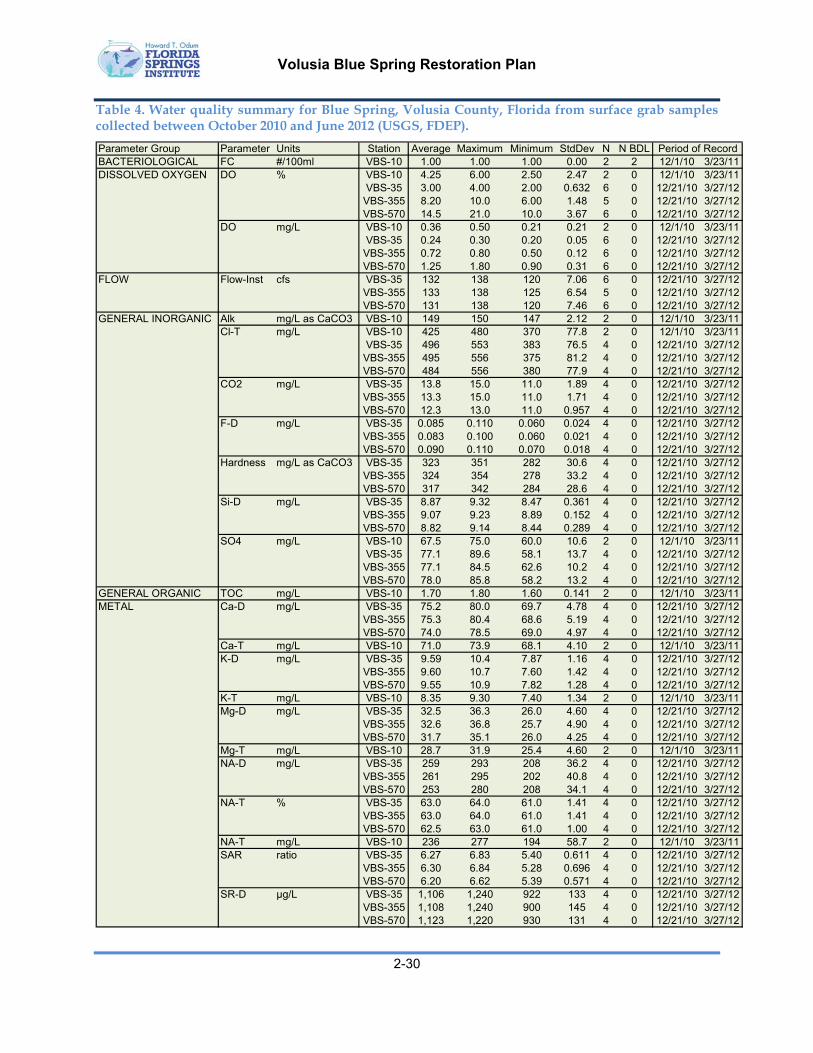
Volusia Blue Spring Restoration Plan
2-30
Table 4. Water quality summary for Blue Spring, Volusia County, Florida from surface grab samples collected between October 2010 and June 2012 (USGS, FDEP).
Parameter Group Parameter Units Station Average Maximum Minimum StdDev N N BDLBACTERIOLOGICAL FC #/100ml VBS-10 1.00 1.00 1.00 0.00 2 2 12/1/10 3/23/11DISSOLVED OXYGEN DO % VBS-10 4.25 6.00 2.50 2.47 2 0 12/1/10 3/23/11
VBS-35 3.00 4.00 2.00 0.632 6 0 12/21/10 3/27/12VBS-355 8.20 10.0 6.00 1.48 5 0 12/21/10 3/27/12VBS-570 14.5 21.0 10.0 3.67 6 0 12/21/10 3/27/12
DO mg/L VBS-10 0.36 0.50 0.21 0.21 2 0 12/1/10 3/23/11VBS-35 0.24 0.30 0.20 0.05 6 0 12/21/10 3/27/12
VBS-355 0.72 0.80 0.50 0.12 6 0 12/21/10 3/27/12VBS-570 1.25 1.80 0.90 0.31 6 0 12/21/10 3/27/12
FLOW Flow-Inst cfs VBS-35 132 138 120 7.06 6 0 12/21/10 3/27/12VBS-355 133 138 125 6.54 5 0 12/21/10 3/27/12VBS-570 131 138 120 7.46 6 0 12/21/10 3/27/12
GENERAL INORGANIC Alk mg/L as CaCO3 VBS-10 149 150 147 2.12 2 0 12/1/10 3/23/11Cl-T mg/L VBS-10 425 480 370 77.8 2 0 12/1/10 3/23/11
VBS-35 496 553 383 76.5 4 0 12/21/10 3/27/12VBS-355 495 556 375 81.2 4 0 12/21/10 3/27/12VBS-570 484 556 380 77.9 4 0 12/21/10 3/27/12
CO2 mg/L VBS-35 13.8 15.0 11.0 1.89 4 0 12/21/10 3/27/12VBS-355 13.3 15.0 11.0 1.71 4 0 12/21/10 3/27/12VBS-570 12.3 13.0 11.0 0.957 4 0 12/21/10 3/27/12
F-D mg/L VBS-35 0.085 0.110 0.060 0.024 4 0 12/21/10 3/27/12VBS-355 0.083 0.100 0.060 0.021 4 0 12/21/10 3/27/12VBS-570 0.090 0.110 0.070 0.018 4 0 12/21/10 3/27/12
Hardness mg/L as CaCO3 VBS-35 323 351 282 30.6 4 0 12/21/10 3/27/12VBS-355 324 354 278 33.2 4 0 12/21/10 3/27/12VBS-570 317 342 284 28.6 4 0 12/21/10 3/27/12
Si-D mg/L VBS-35 8.87 9.32 8.47 0.361 4 0 12/21/10 3/27/12VBS-355 9.07 9.23 8.89 0.152 4 0 12/21/10 3/27/12VBS-570 8.82 9.14 8.44 0.289 4 0 12/21/10 3/27/12
SO4 mg/L VBS-10 67.5 75.0 60.0 10.6 2 0 12/1/10 3/23/11VBS-35 77.1 89.6 58.1 13.7 4 0 12/21/10 3/27/12
VBS-355 77.1 84.5 62.6 10.2 4 0 12/21/10 3/27/12VBS-570 78.0 85.8 58.2 13.2 4 0 12/21/10 3/27/12
GENERAL ORGANIC TOC mg/L VBS-10 1.70 1.80 1.60 0.141 2 0 12/1/10 3/23/11METAL Ca-D mg/L VBS-35 75.2 80.0 69.7 4.78 4 0 12/21/10 3/27/12
VBS-355 75.3 80.4 68.6 5.19 4 0 12/21/10 3/27/12VBS-570 74.0 78.5 69.0 4.97 4 0 12/21/10 3/27/12
Ca-T mg/L VBS-10 71.0 73.9 68.1 4.10 2 0 12/1/10 3/23/11K-D mg/L VBS-35 9.59 10.4 7.87 1.16 4 0 12/21/10 3/27/12
VBS-355 9.60 10.7 7.60 1.42 4 0 12/21/10 3/27/12VBS-570 9.55 10.9 7.82 1.28 4 0 12/21/10 3/27/12
K-T mg/L VBS-10 8.35 9.30 7.40 1.34 2 0 12/1/10 3/23/11Mg-D mg/L VBS-35 32.5 36.3 26.0 4.60 4 0 12/21/10 3/27/12
VBS-355 32.6 36.8 25.7 4.90 4 0 12/21/10 3/27/12VBS-570 31.7 35.1 26.0 4.25 4 0 12/21/10 3/27/12
Mg-T mg/L VBS-10 28.7 31.9 25.4 4.60 2 0 12/1/10 3/23/11NA-D mg/L VBS-35 259 293 208 36.2 4 0 12/21/10 3/27/12
VBS-355 261 295 202 40.8 4 0 12/21/10 3/27/12VBS-570 253 280 208 34.1 4 0 12/21/10 3/27/12
NA-T % VBS-35 63.0 64.0 61.0 1.41 4 0 12/21/10 3/27/12VBS-355 63.0 64.0 61.0 1.41 4 0 12/21/10 3/27/12VBS-570 62.5 63.0 61.0 1.00 4 0 12/21/10 3/27/12
NA-T mg/L VBS-10 236 277 194 58.7 2 0 12/1/10 3/23/11SAR ratio VBS-35 6.27 6.83 5.40 0.611 4 0 12/21/10 3/27/12
VBS-355 6.30 6.84 5.28 0.696 4 0 12/21/10 3/27/12VBS-570 6.20 6.62 5.39 0.571 4 0 12/21/10 3/27/12
SR-D µg/L VBS-35 1,106 1,240 922 133 4 0 12/21/10 3/27/12VBS-355 1,108 1,240 900 145 4 0 12/21/10 3/27/12VBS-570 1,123 1,220 930 131 4 0 12/21/10 3/27/12
Period of Record
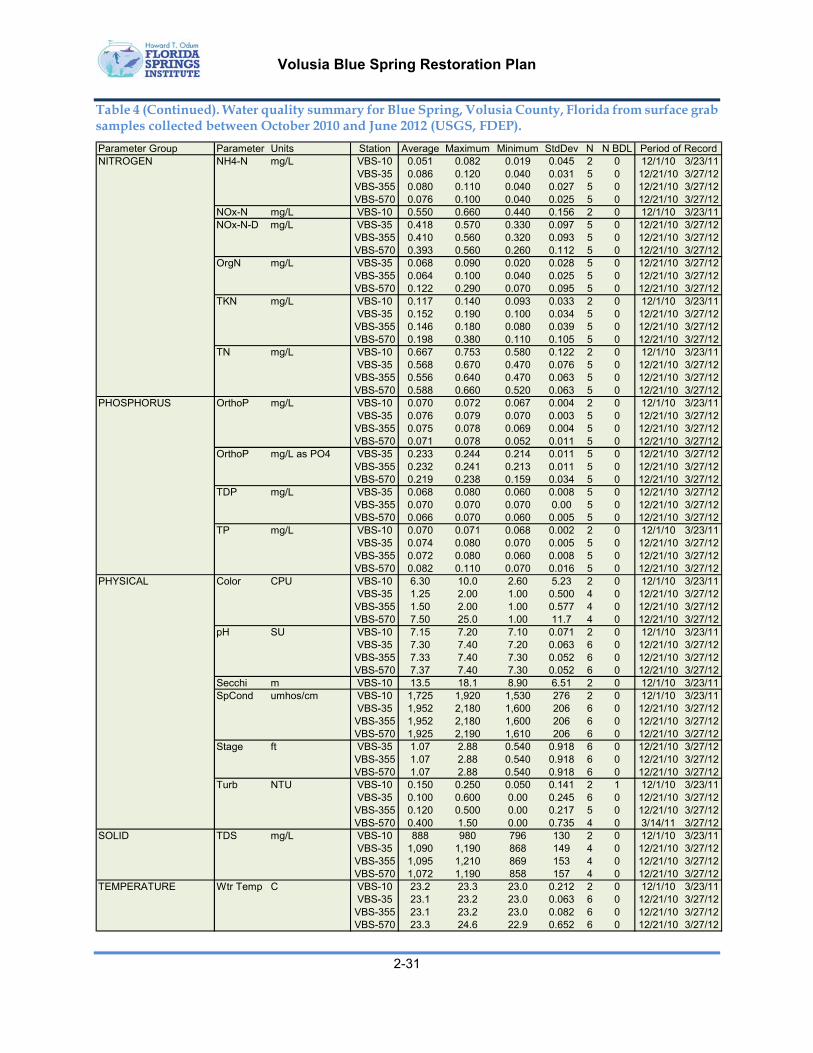
Volusia Blue Spring Restoration Plan
2-31
Table 4 (Continued). Water quality summary for Blue Spring, Volusia County, Florida from surface grab samples collected between October 2010 and June 2012 (USGS, FDEP).
Parameter Group Parameter Units Station Average Maximum Minimum StdDev N N BDLNITROGEN NH4-N mg/L VBS-10 0.051 0.082 0.019 0.045 2 0 12/1/10 3/23/11
VBS-35 0.086 0.120 0.040 0.031 5 0 12/21/10 3/27/12VBS-355 0.080 0.110 0.040 0.027 5 0 12/21/10 3/27/12VBS-570 0.076 0.100 0.040 0.025 5 0 12/21/10 3/27/12
NOx-N mg/L VBS-10 0.550 0.660 0.440 0.156 2 0 12/1/10 3/23/11NOx-N-D mg/L VBS-35 0.418 0.570 0.330 0.097 5 0 12/21/10 3/27/12
VBS-355 0.410 0.560 0.320 0.093 5 0 12/21/10 3/27/12VBS-570 0.393 0.560 0.260 0.112 5 0 12/21/10 3/27/12
OrgN mg/L VBS-35 0.068 0.090 0.020 0.028 5 0 12/21/10 3/27/12VBS-355 0.064 0.100 0.040 0.025 5 0 12/21/10 3/27/12VBS-570 0.122 0.290 0.070 0.095 5 0 12/21/10 3/27/12
TKN mg/L VBS-10 0.117 0.140 0.093 0.033 2 0 12/1/10 3/23/11VBS-35 0.152 0.190 0.100 0.034 5 0 12/21/10 3/27/12VBS-355 0.146 0.180 0.080 0.039 5 0 12/21/10 3/27/12VBS-570 0.198 0.380 0.110 0.105 5 0 12/21/10 3/27/12
TN mg/L VBS-10 0.667 0.753 0.580 0.122 2 0 12/1/10 3/23/11VBS-35 0.568 0.670 0.470 0.076 5 0 12/21/10 3/27/12VBS-355 0.556 0.640 0.470 0.063 5 0 12/21/10 3/27/12VBS-570 0.588 0.660 0.520 0.063 5 0 12/21/10 3/27/12
PHOSPHORUS OrthoP mg/L VBS-10 0.070 0.072 0.067 0.004 2 0 12/1/10 3/23/11VBS-35 0.076 0.079 0.070 0.003 5 0 12/21/10 3/27/12VBS-355 0.075 0.078 0.069 0.004 5 0 12/21/10 3/27/12VBS-570 0.071 0.078 0.052 0.011 5 0 12/21/10 3/27/12
OrthoP mg/L as PO4 VBS-35 0.233 0.244 0.214 0.011 5 0 12/21/10 3/27/12VBS-355 0.232 0.241 0.213 0.011 5 0 12/21/10 3/27/12VBS-570 0.219 0.238 0.159 0.034 5 0 12/21/10 3/27/12
TDP mg/L VBS-35 0.068 0.080 0.060 0.008 5 0 12/21/10 3/27/12VBS-355 0.070 0.070 0.070 0.00 5 0 12/21/10 3/27/12VBS-570 0.066 0.070 0.060 0.005 5 0 12/21/10 3/27/12
TP mg/L VBS-10 0.070 0.071 0.068 0.002 2 0 12/1/10 3/23/11VBS-35 0.074 0.080 0.070 0.005 5 0 12/21/10 3/27/12VBS-355 0.072 0.080 0.060 0.008 5 0 12/21/10 3/27/12VBS-570 0.082 0.110 0.070 0.016 5 0 12/21/10 3/27/12
PHYSICAL Color CPU VBS-10 6.30 10.0 2.60 5.23 2 0 12/1/10 3/23/11VBS-35 1.25 2.00 1.00 0.500 4 0 12/21/10 3/27/12VBS-355 1.50 2.00 1.00 0.577 4 0 12/21/10 3/27/12VBS-570 7.50 25.0 1.00 11.7 4 0 12/21/10 3/27/12
pH SU VBS-10 7.15 7.20 7.10 0.071 2 0 12/1/10 3/23/11VBS-35 7.30 7.40 7.20 0.063 6 0 12/21/10 3/27/12VBS-355 7.33 7.40 7.30 0.052 6 0 12/21/10 3/27/12VBS-570 7.37 7.40 7.30 0.052 6 0 12/21/10 3/27/12
Secchi m VBS-10 13.5 18.1 8.90 6.51 2 0 12/1/10 3/23/11SpCond umhos/cm VBS-10 1,725 1,920 1,530 276 2 0 12/1/10 3/23/11
VBS-35 1,952 2,180 1,600 206 6 0 12/21/10 3/27/12VBS-355 1,952 2,180 1,600 206 6 0 12/21/10 3/27/12VBS-570 1,925 2,190 1,610 206 6 0 12/21/10 3/27/12
Stage ft VBS-35 1.07 2.88 0.540 0.918 6 0 12/21/10 3/27/12VBS-355 1.07 2.88 0.540 0.918 6 0 12/21/10 3/27/12VBS-570 1.07 2.88 0.540 0.918 6 0 12/21/10 3/27/12
Turb NTU VBS-10 0.150 0.250 0.050 0.141 2 1 12/1/10 3/23/11VBS-35 0.100 0.600 0.00 0.245 6 0 12/21/10 3/27/12VBS-355 0.120 0.500 0.00 0.217 5 0 12/21/10 3/27/12VBS-570 0.400 1.50 0.00 0.735 4 0 3/14/11 3/27/12
SOLID TDS mg/L VBS-10 888 980 796 130 2 0 12/1/10 3/23/11VBS-35 1,090 1,190 868 149 4 0 12/21/10 3/27/12VBS-355 1,095 1,210 869 153 4 0 12/21/10 3/27/12VBS-570 1,072 1,190 858 157 4 0 12/21/10 3/27/12
TEMPERATURE Wtr Temp C VBS-10 23.2 23.3 23.0 0.212 2 0 12/1/10 3/23/11VBS-35 23.1 23.2 23.0 0.063 6 0 12/21/10 3/27/12VBS-355 23.1 23.2 23.0 0.082 6 0 12/21/10 3/27/12VBS-570 23.3 24.6 22.9 0.652 6 0 12/21/10 3/27/12
Period of Record
Volusia Blue Spring Restoration Plan
2-32
2.8.4 BlueSpringandBlueSpringRunBiology
2.8.4.1 PeriphytonandAlgae
Based on microscopic identification of material captured in plankton nets by WSI (2012), a variety of periphyton and macroalgae exist in Blue Spring. Individual and colonial diatoms were observed (e.g., Fragilaria, Tabellaria, Nitzschia, and Asterionella). Filamentous macroalgae observed included cyanobacteria (blue-green algae, Cyanophyta) which appeared to be Lyngbya sp., as well as green algal species (Chlorophyta e.g., Spirogyra and Cladophora).
FDEP results of biofilm sampling (epiphytic growths or periphyton) indicate the dominant algal group (63 to 93% of the samples) at each site and for all dates were Bacillariophyta (diatoms). The total number of diatom taxa identified from quarterly sampling events ranged from 26 to 52, with either Fragilaria sp. or Staurosira elliptica being the dominant diatom taxa. To a lesser degree, other algae including filamentous forms (“wet algae”), were also observed. Of these filamentous algae, the total number of taxa ranging from 8 to 17 with blue-green algae (Cyanophyta) being more abundant than green algae forms (Chlorophyta). Dominant filamentous algae included Jaaginema and Synechocystis. See Table 5 for summary statistics of the periphyton sampling conducted by FDEP during the October 2007 to November 2008 sampling period.
FDEP sampling suggests that filamentous algae covered many of the Upper and Middle sites for all dates, except for 11/6/2008; on this date the Middle Site was covered mostly by diatoms. In general, the Lower Site had lesser amounts of filamentous algae than the Upper and Middle sites. Filamentous algae were found at most of sampled points at the Lower Site on 10/10/2007 and 6/24/2008, and diatoms were found at over 80% of the sampled points on 11/6/2008. Results of benthic algal thickness monitoring are shown in Figure 21.
Mean benthic algal thickness ranks from each sampling zone and date were correlated against sediment total Kjeldahl nitrogen, total phosphorus concentrations, and riparian canopy cover (Figure 22). Algal thickness was positively correlated to sediment nitrogen concentrations and negatively correlated to sediment phosphorus concentrations and riparian canopy cover. However, none of the correlations were statistically significant at the 95% level (p < 0.05).
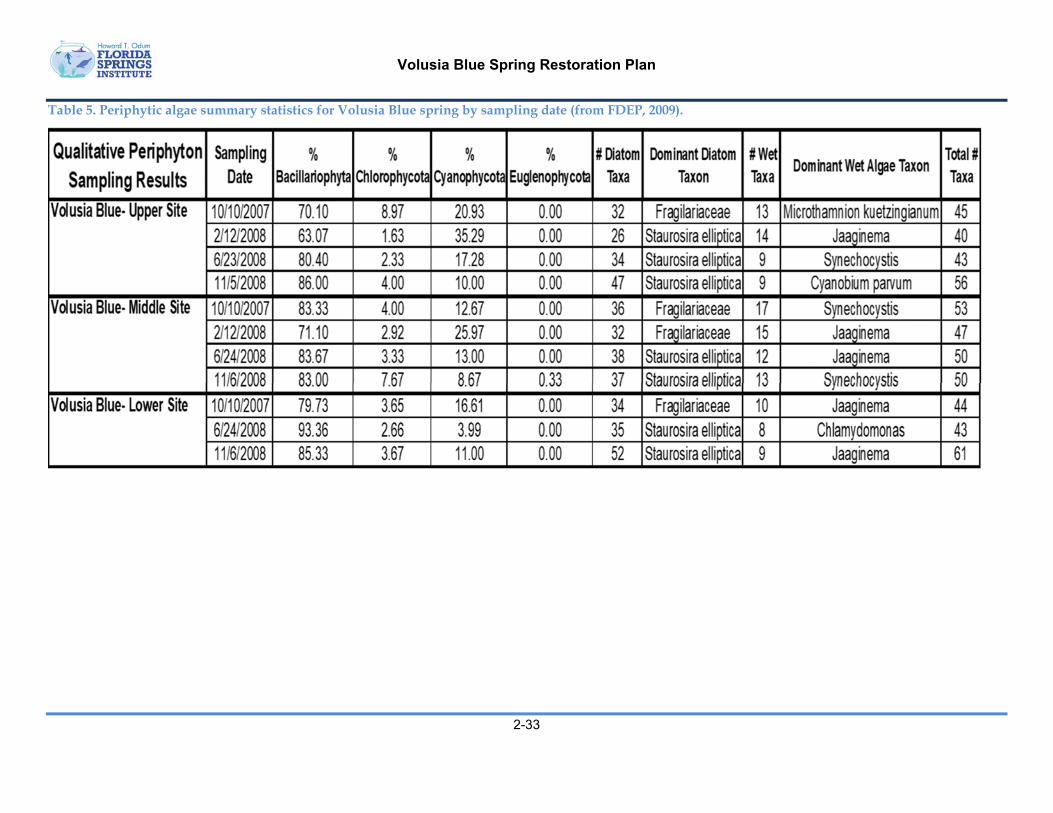
Volusia Blue Spring Restoration Plan
2-33
Table 5. Periphytic algae summary statistics for Volusia Blue spring by sampling date (from FDEP, 2009).
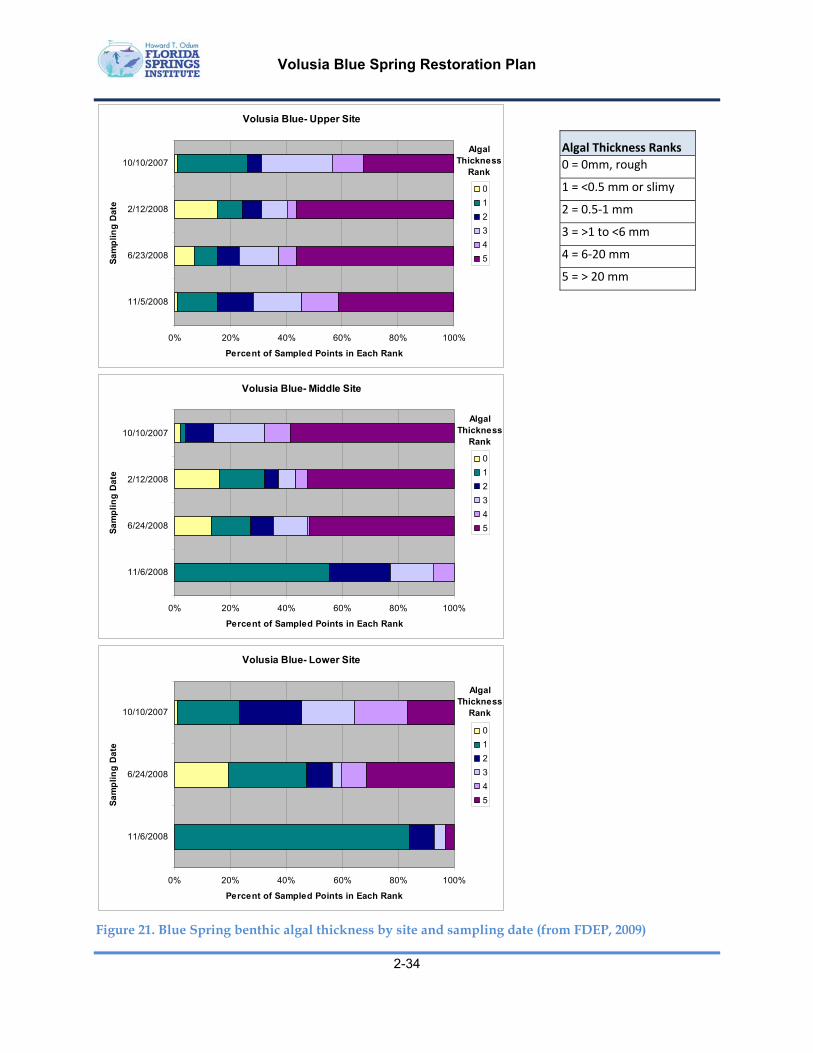
Volusia Blue Spring Restoration Plan
2-34
Figure 21. Blue Spring benthic algal thickness by site and sampling date (from FDEP, 2009)
Volusia Blue- Upper Site
0% 20% 40% 60% 80% 100%
11/5/2008
6/23/2008
2/12/2008
10/10/2007
Sa
mp
lin
g D
ate
Percent of Sampled Points in Each Rank
0
1
2
3
4
5
Algal Thickness
Rank
Volusia Blue- Middle Site
0% 20% 40% 60% 80% 100%
11/6/2008
6/24/2008
2/12/2008
10/10/2007
Sa
mp
lin
g D
ate
Percent of Sampled Points in Each Rank
0
1
2
3
4
5
Algal Thickness
Rank
Volusia Blue- Lower Site
0% 20% 40% 60% 80% 100%
11/6/2008
6/24/2008
10/10/2007
Sa
mp
lin
g D
ate
Percent of Sampled Points in Each Rank
0
1
2
3
4
5
Algal Thickness
Rank
Algal Thickness Ranks
0 = 0mm, rough
1 = <0.5 mm or slimy
2 = 0.5‐1 mm
3 = >1 to <6 mm
4 = 6‐20 mm
5 = > 20 mm
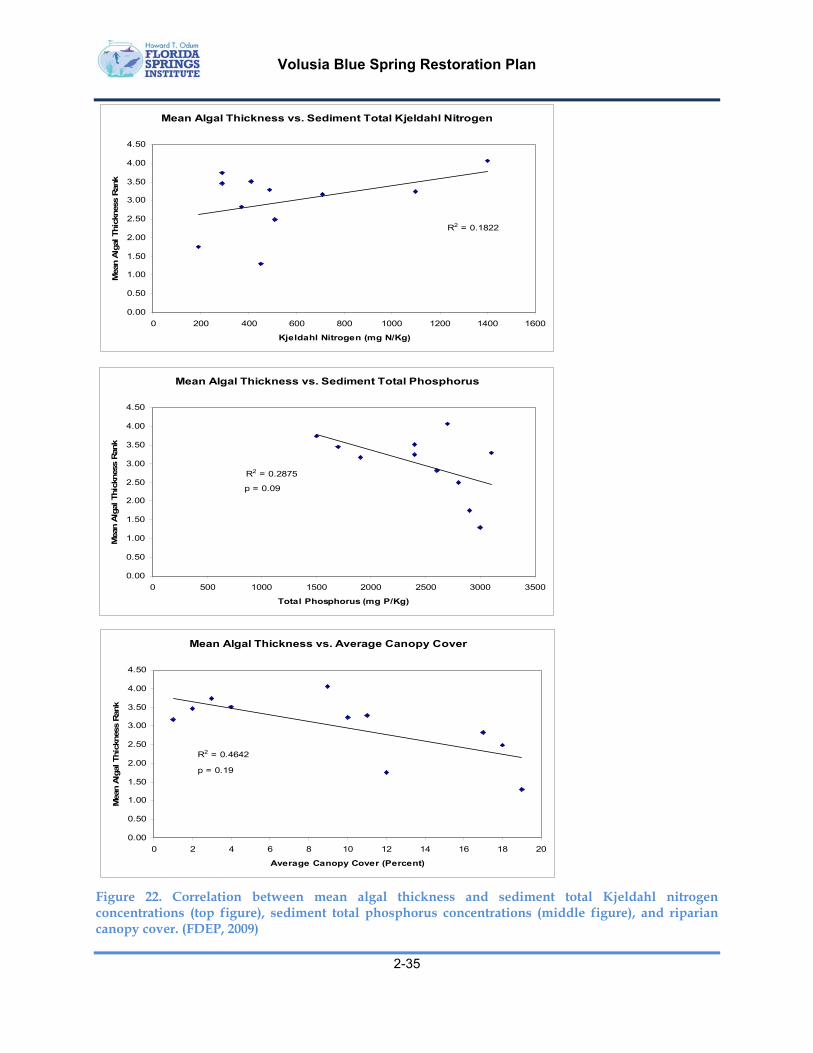
Volusia Blue Spring Restoration Plan
2-35
Figure 22. Correlation between mean algal thickness and sediment total Kjeldahl nitrogen concentrations (top figure), sediment total phosphorus concentrations (middle figure), and riparian canopy cover. (FDEP, 2009)
Mean Algal Thickness vs. Sediment Total Kjeldahl Nitrogen
R2 = 0.1822
0.00
0.50
1.00
1.50
2.00
2.50
3.00
3.50
4.00
4.50
0 200 400 600 800 1000 1200 1400 1600
Kjeldahl Nitrogen (mg N/Kg)
Mea
n A
lgal
Thic
knes
s R
ank
Mean Algal Thickness vs. Sediment Total Phosphorus
R2 = 0.2875
0.00
0.50
1.00
1.50
2.00
2.50
3.00
3.50
4.00
4.50
0 500 1000 1500 2000 2500 3000 3500
Total Phosphorus (mg P/Kg)
Mea
n A
lgal
Thic
knes
s R
ank
p = 0.09
Mean Algal Thickness vs. Average Canopy Cover
R2 = 0.4642
0.00
0.50
1.00
1.50
2.00
2.50
3.00
3.50
4.00
4.50
0 2 4 6 8 10 12 14 16 18 20
Average Canopy Cover (Percent)
Mea
n A
lgal
Thic
knes
s R
ank
p = 0.19
Volusia Blue Spring Restoration Plan
2-36
2.8.4.2 AquaticPlants
In a 2007/2008 study, the most common native macrophytic plants at Blue Spring were water pennywort (Hydrocotyle sp.), common duckweed (Lemna minor), southern naiad (Najas guadalupensis), buttonbush (Cephalanthus occidentalis), and water fern (Salvinia minima) at low densities and primarily along the edges of the spring run (Table 6). Alligator weed (Alternanthera philoxeroides) was the most common exotic species, but also at low density.
Based on observations by WSI staff, the only submersed vascular aquatic vegetation within the spring basin and run was southern naiad. This aquatic plant was observed in single strands and small clumps from approximately VBS 150 to VBS 400. Floating aquatic plants water hyacinth (Eichhornia crassipes), water lettuce (Pistia stratiotes), and water pennywort were observed in the lower spring run. Although these floating aquatic plants appeared to persist along the shoreline of the spring run, they were most abundant when the St. Johns River water and floating plants entered the lower spring run.
Low concentrations of dissolved oxygen may be inhibiting colonization of the spring run by submerged aquatic macrophytes. High recreational use and manatee grazing may also be contributing to the observed low diversity and abundance of submersed, floating, and emergent aquatic plants in Blue Spring.
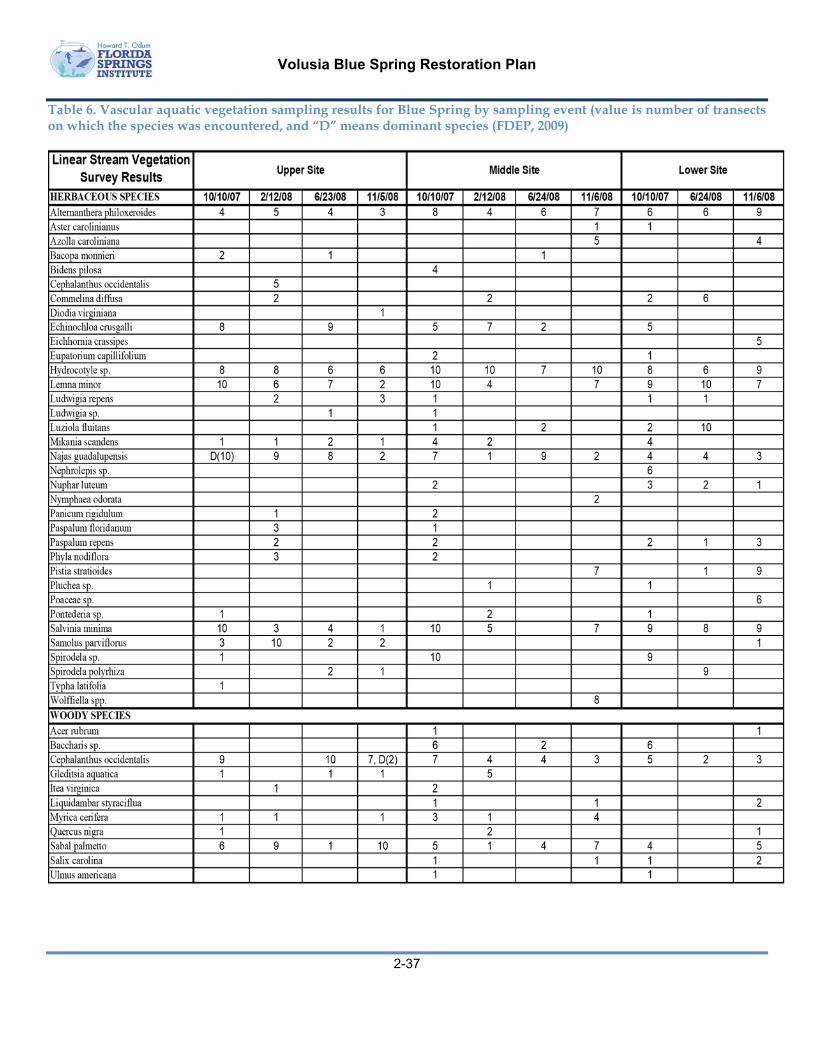
Volusia Blue Spring Restoration Plan
2-37
Table 6. Vascular aquatic vegetation sampling results for Blue Spring by sampling event (value is number of transects on which the species was encountered, and “D” means dominant species (FDEP, 2009)
Volusia Blue Spring Restoration Plan
2-38
2.8.4.3 MacroinvertebrateCommunityandHabitatAssessment
Table 7 summarizes results from an “EcoSummary” for Blue Spring prepared by FDEP (WSI, 2009). FDEP conducted field sampling on eleven dates from 2000 to 2005. Slightly different measurements were made on each sampling trip. The Stream Condition Index (SCI) ranged from 11 to 17. The SCI is a composite macroinvertebrate metric for use in Florida flowing streams (see Barbour, Gerritsen, & White, 1996 for a description of the components and development of the SCI). SCI values in this range are considered “Very Poor” to “Poor.” Low values of the SCI are typically found in aquatic systems with low dissolved oxygen concentrations. Therefore, if dissolved oxygen is low in Blue Spring due to natural conditions, the low SCI for this site is probably a natural condition and not related to human influences. Macroinvertebrate taxa numbers ranged from 9 to 22 during the events when measurements were made. A large portion of this macroinvertebrate population was comprised of organisms tolerant of low-dissolved oxygen concentrations (e.g., chironomids). From 28 to 29 algal taxa were recorded in the FDEP sampling and most of these species were diatoms.

Volusia Blue Spring Restoration Plan
2-39
Table 7. EcoSummary for Volusia Blue Spring and Run (WSI, 2009)
Oct-00 Mar-01 Oct-01 Nov-01 Apr-02 Oct-02 May-03 Oct-03 Apr-04 Nov-04 Apr-05
Stream Condition Index (SCI) 15 17 15 --- 17 15 17 11 11 --- 17SCI Evaluation poor poor poor --- poor poor poor very poor very poor --- very poorSCI Region peninsula peninsula peninsula --- peninsula peninsula peninsula peninsula peninsula --- ---Number of Individuals --- --- 104 --- --- --- --- --- --- --- ---Number of Taxa 18 18 18 --- 18 22 12 15 9 --- ---Number of Ephemeroptera 0 0 1 --- --- --- --- --- --- --- ---Number of Plecoptera 0 0 0 --- --- --- --- --- --- --- ---Number of Trichoptera 0 0 0 --- --- --- --- --- --- --- ---EPT Index 0 0 1 --- 1 2 1 0 0 --- ---
Dominant Taxon --- ---Pyrgophorusplatyrachis
--- --- --- --- --- --- --- ---
% Dominant Taxon 27.01 27.11 26.92 --- 26.67 70.41 43.4 69 29.5 --- ---Florida Index 1 4 0 --- 1 1 4 1 2 --- --- % Diptera 15.33 31.93 25.96 --- 45 12.24 17 4.3 6.7 --- ---Number of Chironomidae 1 1 --- --- --- --- --- --- --- --- ---Number of Orthocladiinae 3 4 --- --- --- --- --- --- --- --- ---Total Number of Chironomidae 4 5 3 --- 5 4 5 1 2 --- ---% Filter-Feeders 2.92 1.81 0 --- 13.33 2.55 6.6 0 4.3 --- ---
Number of Individuals --- --- 411 689 --- --- --- --- --- --- ---Number of Taxa 28 29 --- --- --- --- --- --- --- --- ---
Dominant Taxon --- --- Fragilariaceae Fragilariaceae FragilariaceaeDiatomaceae/Fragilariaceae
FragilariaceaeDiadesmis
confervacea--- --- ---
% Bacillariophyceae 94.16 93.38 63.5 74.17 83.44 68.09 84.7 57.3 92.3 --- ---% Chlorophyceae 0.94 0.92 34.31 25.25 1.95 2.43 0 0 0.6 --- ---% Cyanophyceae 4.9 5.7 2.19 0.58 11.69 29.48 3 2.2 7 --- ---% Dinophyceae 0 --- --- --- --- --- --- --- --- --- ---% Dominant Taxon 38.23 17.65 22.38 28.16 30.52 17.93 39.2 19.4 27.2 --- ---
Enterococci (col/100 mL) 26 20 --- 40 32 6 6 B 10 B 40 6 B ---Escherichia coli (col/100 mL) 2 4 --- 8 12 1 K 4 B 2 B 23 B 2 K ---Fecal Coliforms (col/100 mL) 10 1 --- 2 2 1 K 1 K 2 B 8 B 4 B ---Total Coliforms (col/100 mL) 40 10 --- 2 90 40 20 B 50 B 54 16 B ---
Habitat Assessment 111 89 --- --- 97 114 105 104 113 129 105Sample Depth (m) 0.8 0.4 --- --- --- --- --- --- --- --- ---Specific Conductivity (umho/cm) 198 2019 --- 1365 1381 878 878 1396 1705 861 1280Dissolved Oxygen (mg/L) 2.3 2.2 --- 1.5 2.6 1.43 1.43 3.3 3.33 1.9 2.5pH (SU) 7.6 7.5 --- 6.4 7.1 7.07 7.07 7.3 7.5 7.3 8Temperature (deg. C) 22.8 23 --- 22.9 23.2 23.2 23.2 23.1 23.4 22.9 23
Ammonia (mg/L) 0.093 --- --- 0.01 0.018 I 0.022 0.01 U 0.01 U 0.041 0.015 I 0.011 INitrate-Nitrite (mg/L) 0.11 --- --- 0.64 0.58 J 0.9 0.78 0.5 0.39 1.1 0.57TKN (mg/L) 0.3 --- --- 0.14 0.25 0.21 0.13 I 0.24 0.2 0.2 I 0.19 ITotal Phosphorus (mg/L) 0.093 --- --- 0.069 0.072 0.067 J 0.069 A 0.076 0.098 0.059 I 0.076Color (PCU) 5 --- --- --- 5 U 5 UQ 5 U 5 UQ 5 Q 5 UQ 5 QTurbidity (NTU) 0.15 --- --- 0.1 0.1 0.15 Q 0.35 A 0.2 Q 0.7 Q 0.1 Q 0.15 Q*Bacteria samples were all outside of holding time (October 2000; March, October 2001; April, October 2002; May, October 2003; April, November 2004; April 2005)A = Value reported is the mean of two or more determinationsB = Results based on colony counts outside the acceptable rangeU = Below Detection LimitI = Below Quantitation LimitK = Actual value is known to be less than value givenQ = Information OnlyJ = Estimated ValueSource: (Bennett 2002; http://www.dep.state.fl.us/labs/library/springs.htm)
Physical-Chemical Data
Chemistry Data
Macroinvertebrate Parameters
Periphyton Parameters
Bacteria Parameters*
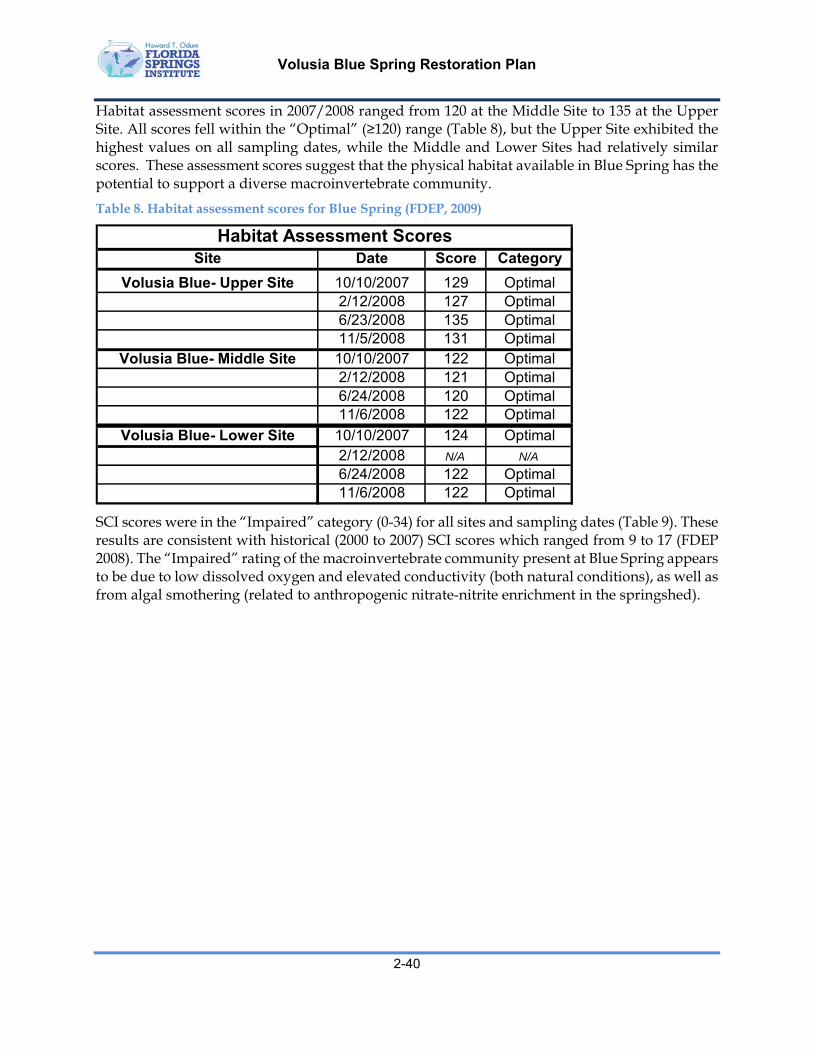
Volusia Blue Spring Restoration Plan
2-40
Habitat assessment scores in 2007/2008 ranged from 120 at the Middle Site to 135 at the Upper Site. All scores fell within the “Optimal” (≥120) range (Table 8), but the Upper Site exhibited the highest values on all sampling dates, while the Middle and Lower Sites had relatively similar scores. These assessment scores suggest that the physical habitat available in Blue Spring has the potential to support a diverse macroinvertebrate community.
Table 8. Habitat assessment scores for Blue Spring (FDEP, 2009)
SCI scores were in the “Impaired” category (0-34) for all sites and sampling dates (Table 9). These results are consistent with historical (2000 to 2007) SCI scores which ranged from 9 to 17 (FDEP 2008). The “Impaired” rating of the macroinvertebrate community present at Blue Spring appears to be due to low dissolved oxygen and elevated conductivity (both natural conditions), as well as from algal smothering (related to anthropogenic nitrate-nitrite enrichment in the springshed).
Site Date Score Category
Volusia Blue- Upper Site 10/10/2007 129 Optimal2/12/2008 127 Optimal6/23/2008 135 Optimal11/5/2008 131 Optimal
Volusia Blue- Middle Site 10/10/2007 122 Optimal2/12/2008 121 Optimal6/24/2008 120 Optimal11/6/2008 122 Optimal
Volusia Blue- Lower Site 10/10/2007 124 Optimal2/12/2008 N/A N/A
6/24/2008 122 Optimal11/6/2008 122 Optimal
Habitat Assessment Scores

Volusia Blue Spring Restoration Plan
2-41
Table 9. Benthic invertebrate summary statistics by sampling event for Blue Spring (FDEP, 2009)
Volusia Blue Springs
Stream Condition Index 2007 (value) 4 A 8 A 11 A 9 AStream Condition Index 2007 (category)
Stream Condition Index 2007 (value) 4 A 6 A 9 A 11 AStream Condition Index 2007 (category)
Stream Condition Index 2007 (value) 6 A 4 A 15 AStream Condition Index 2007 (category)
Volusia Blue- Upper SiteStream Condition Index Metrics Rep 1 Rep 2 Rep 1 Rep 2 Rep 1 Rep 2 Rep 1 Rep 2Number of Total Taxa 15 14 12 15 17 17 14 13Number of Ephemeroptera Taxa 0 0 0 0 0 0 0 0Number of Trichoptera Taxa 0 0 0 0 1 1 0 0Number of Clinger Taxa 0 0 0 0 0 0 0 0Number of Long-lived Taxa 0 0 0 0 0 0 0 0Number of Sensitive Taxa 1 1 1 1 1 1 1 1Percent of Dominant Taxon 67.6 45.3 34.5 22.2 33.1 43.1 30.2 42.6Percent Suspension Feeders and Filterers 1.0 0.0 0.0 0.3 2.8 1.6 1.7 4.2Percent of Tanytarsini Individuals 0.0 0.0 0.0 0.0 0.0 0.0 0.7 0.0Percent of Very Tolerant Individuals 17.9 40.9 61.4 56.4 20.4 16.3 37.6 37.4Total Number of Individuals 151 159 145 149 142 153 149 155
Volusia Blue- Middle SiteStream Condition Index Metrics Rep 1 Rep 2 Rep 1 Rep 2 Rep 1 Rep 2 Rep 1 Rep 2Number of Total Taxa 11 11 14 11 14 16 16 18Number of Ephemeroptera Taxa 0 0 0 0 0 0 0 1Number of Trichoptera Taxa 0 0 0 0 0 1 0 0Number of Clinger Taxa 0 0 0 0 0 0 0 0Number of Long-lived Taxa 0 0 0 0 0 0 0 0Number of Sensitive Taxa 0 0 0 0 0 0 1 1Percent of Dominant Taxon 48.3 42.8 24.1 36.0 23.4 40.6 31.3 45.6Percent Suspension Feeders and Filterers 1.0 0.7 1.6 1.7 1.0 2.1 5.0 4.7Percent of Tanytarsini Individuals 0.0 0.0 0.0 0.0 0.0 0.0 1.3 1.9Percent of Very Tolerant Individuals 24.8 27.6 74.7 64.0 19.6 21.0 75.6 75.0Total Number of Individuals 145 145 158 150 158 143 160 160
Volusia Blue- Lower Sites 11/6/2008
Stream Condition Index Metrics Rep 1 Rep 2 Rep 1 Rep 2 Rep 1 Rep 2Number of Total Taxa 9 11 10 10 20 24Number of Ephemeroptera Taxa 0 0 0 0 0 0Number of Trichoptera Taxa 0 0 0 0 0 0Number of Clinger Taxa 0 0 0 0 0 0Number of Long-lived Taxa 0 0 0 0 0 0Number of Sensitive Taxa 0 0 0 0 0 1Percent of Dominant Taxon 32.9 31.8 55.6 46.2 27.2 27.7Percent Suspension Feeders and Filterers 1.3 0.7 2.2 1.7 3.3 5.0Percent of Tanytarsini Individuals 0.0 0.0 0.0 0.0 1.3 2.5Percent of Very Tolerant Individuals 74.1 67.6 31.9 11.7 47.0 42.1Total Number of Individuals 158 148 160 145 151 159
Middle Site
Upper Site
Lower SiteNo Data
Impaired Impaired Impaired Impaired
Impaired Impaired
10/10/2007 2/12/2008 6/24/2008
ImpairedNo Data
11/5/2008
10/10/2007 2/12/2008 6/24/2008 11/6/2008
Impaired Impaired
10/10/2007 2/12/2008 6/23/2008
Impaired Impaired
10/10/2007 2/12/2008 6/23/2008 11/5/2008
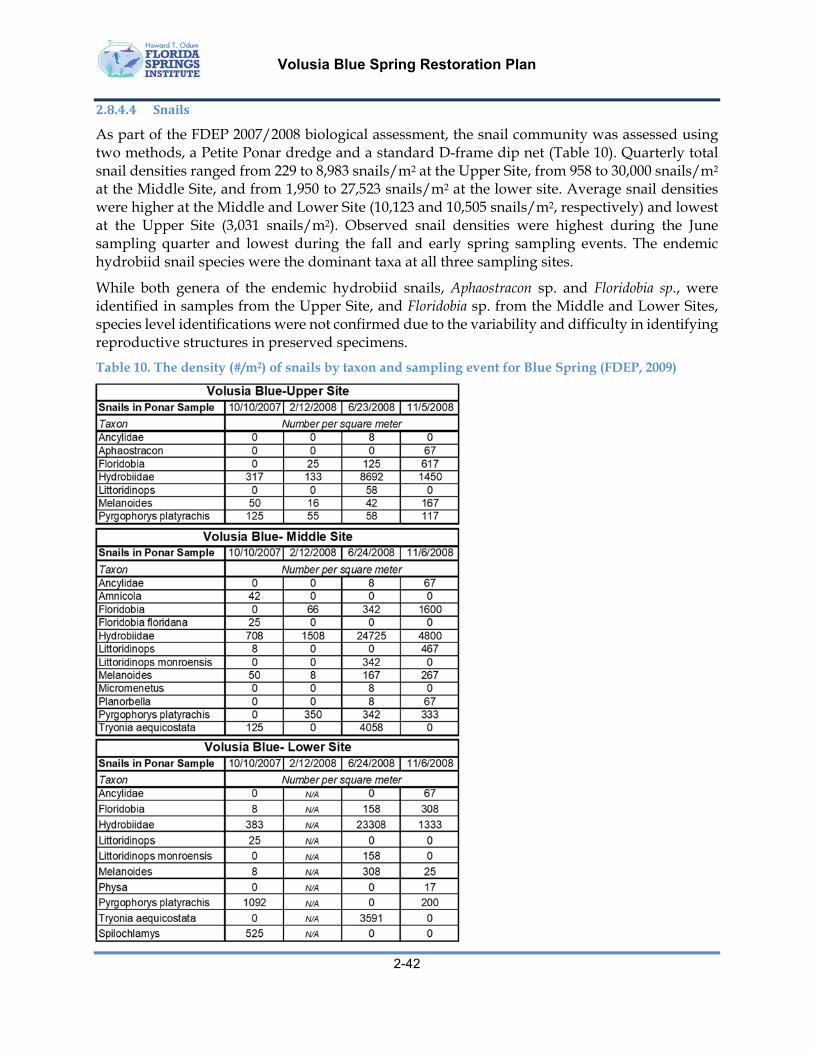
Volusia Blue Spring Restoration Plan
2-42
2.8.4.4 Snails
As part of the FDEP 2007/2008 biological assessment, the snail community was assessed using two methods, a Petite Ponar dredge and a standard D-frame dip net (Table 10). Quarterly total snail densities ranged from 229 to 8,983 snails/m2 at the Upper Site, from 958 to 30,000 snails/m2 at the Middle Site, and from 1,950 to 27,523 snails/m2 at the lower site. Average snail densities were higher at the Middle and Lower Site (10,123 and 10,505 snails/m2, respectively) and lowest at the Upper Site (3,031 snails/m2). Observed snail densities were highest during the June sampling quarter and lowest during the fall and early spring sampling events. The endemic hydrobiid snail species were the dominant taxa at all three sampling sites.
While both genera of the endemic hydrobiid snails, Aphaostracon sp. and Floridobia sp., were identified in samples from the Upper Site, and Floridobia sp. from the Middle and Lower Sites, species level identifications were not confirmed due to the variability and difficulty in identifying reproductive structures in preserved specimens.
Table 10. The density (#/m2) of snails by taxon and sampling event for Blue Spring (FDEP, 2009)
Volusia Blue Spring Restoration Plan
2-43
2.8.4.5 Fish
Fish populations in Blue Spring Run have been surveyed on multiple occasions by researchers from Stetson University (Work, 2006) and WSI (2009). Quantitative fish data from Blue Spring are provided in Table 11 and Table 12 (Work, 2006). A total of 32 fish species were observed in the spring run during a 4-year period. Snorkel counts observed 28 species and seine hauls captured 23 species. Fish counts were generally somewhat higher in the winter months than in the summer. Highest fish counts in the spring boil and in the upper portion of the spring run occurred in March 2004.
Dominant fish species in terms of numbers were: mosquitofish (Gambusia holbrooki), bluegill (Lepomis macrochirus), sailfin molly (Poecillia latipinna), rainwater killifish (Lucania parva), and least killifish (Heterandria formosa). These species are generally small fish and their total biomass may be relatively low; however, due to their relatively short life histories and high turnover rates, they may contribute significantly to secondary productivity in the spring run. Larger fish that were present at significant densities were warmouth (Lepomis gulosis), golden shiner (Notemigonis crysoleucas), suckermouth catfish (Pterygoplichthys disjunctivus), redear sunfish (Lepomis microlophis), spotted sunfish (Lepomis punctatus), striped mullet (Mugil cephalus), largemouth bass (Micropterus salmoides), longnose gar (Lepistosteus osseus), and tarpon (Megalops atlanticus). Some of these fish are very large (tarpon over 40 inches in length were observed during the February 26, 2002 field trip) and their biomass, if quantified, might be much larger than the smaller fish species. While these larger fish are generally not feeding in the spring run, their presence may be important as prey species for other carnivores (e.g., otters and piscivorous birds) or may be indicative of other life history needs (e.g., temperature refuge or osmotic regulation in the relatively salty spring water).
All the fish species listed for Blue Spring and Blue Spring Run are also known to occur in the St. Johns River. Thus, it may be concluded that they are all able to live in the spring run even without the spring flow. However, it can also be surmised that due to the combination of water quality, clarity, relatively constant temperature and higher salt content, the spring run habitat provides a different combination of life support functions for these fish species than the St. Johns River. Detailed life history studies for each fish species would probably be needed to fully understand the subtle dependence or independence of these fish species on spring flows.
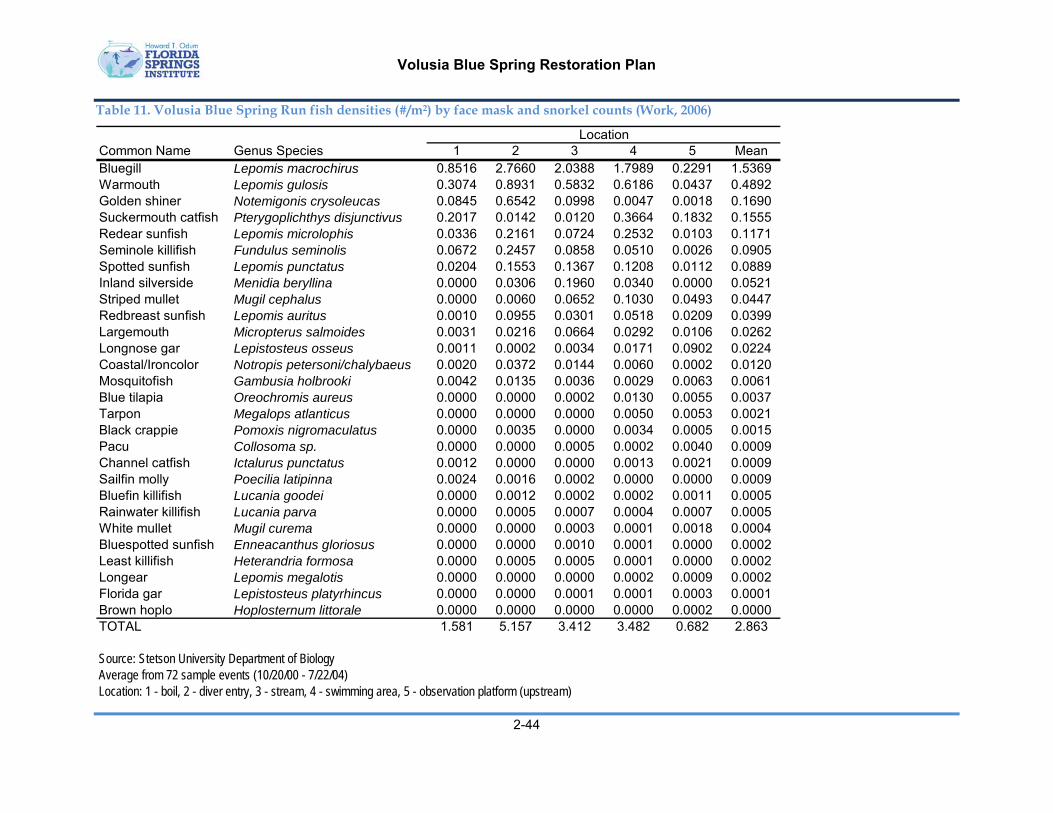
Volusia Blue Spring Restoration Plan
2-44
Table 11. Volusia Blue Spring Run fish densities (#/m2) by face mask and snorkel counts (Work, 2006)
Common Name Genus Species 1 2 3 4 5 MeanBluegill Lepomis macrochirus 0.8516 2.7660 2.0388 1.7989 0.2291 1.5369Warmouth Lepomis gulosis 0.3074 0.8931 0.5832 0.6186 0.0437 0.4892Golden shiner Notemigonis crysoleucas 0.0845 0.6542 0.0998 0.0047 0.0018 0.1690Suckermouth catfish Pterygoplichthys disjunctivus 0.2017 0.0142 0.0120 0.3664 0.1832 0.1555Redear sunfish Lepomis microlophis 0.0336 0.2161 0.0724 0.2532 0.0103 0.1171Seminole killifish Fundulus seminolis 0.0672 0.2457 0.0858 0.0510 0.0026 0.0905Spotted sunfish Lepomis punctatus 0.0204 0.1553 0.1367 0.1208 0.0112 0.0889Inland silverside Menidia beryllina 0.0000 0.0306 0.1960 0.0340 0.0000 0.0521Striped mullet Mugil cephalus 0.0000 0.0060 0.0652 0.1030 0.0493 0.0447Redbreast sunfish Lepomis auritus 0.0010 0.0955 0.0301 0.0518 0.0209 0.0399Largemouth Micropterus salmoides 0.0031 0.0216 0.0664 0.0292 0.0106 0.0262Longnose gar Lepistosteus osseus 0.0011 0.0002 0.0034 0.0171 0.0902 0.0224Coastal/Ironcolor Notropis petersoni/chalybaeus 0.0020 0.0372 0.0144 0.0060 0.0002 0.0120Mosquitofish Gambusia holbrooki 0.0042 0.0135 0.0036 0.0029 0.0063 0.0061Blue tilapia Oreochromis aureus 0.0000 0.0000 0.0002 0.0130 0.0055 0.0037Tarpon Megalops atlanticus 0.0000 0.0000 0.0000 0.0050 0.0053 0.0021Black crappie Pomoxis nigromaculatus 0.0000 0.0035 0.0000 0.0034 0.0005 0.0015Pacu Collosoma sp. 0.0000 0.0000 0.0005 0.0002 0.0040 0.0009Channel catfish Ictalurus punctatus 0.0012 0.0000 0.0000 0.0013 0.0021 0.0009Sailfin molly Poecilia latipinna 0.0024 0.0016 0.0002 0.0000 0.0000 0.0009Bluefin killifish Lucania goodei 0.0000 0.0012 0.0002 0.0002 0.0011 0.0005Rainwater killifish Lucania parva 0.0000 0.0005 0.0007 0.0004 0.0007 0.0005White mullet Mugil curema 0.0000 0.0000 0.0003 0.0001 0.0018 0.0004Bluespotted sunfish Enneacanthus gloriosus 0.0000 0.0000 0.0010 0.0001 0.0000 0.0002Least killifish Heterandria formosa 0.0000 0.0005 0.0005 0.0001 0.0000 0.0002Longear Lepomis megalotis 0.0000 0.0000 0.0000 0.0002 0.0009 0.0002Florida gar Lepistosteus platyrhincus 0.0000 0.0000 0.0001 0.0001 0.0003 0.0001Brown hoplo Hoplosternum littorale 0.0000 0.0000 0.0000 0.0000 0.0002 0.0000TOTAL 1.581 5.157 3.412 3.482 0.682 2.863
Source: Stetson University Department of BiologyAverage from 72 sample events (10/20/00 - 7/22/04)Location: 1 - boil, 2 - diver entry, 3 - stream, 4 - swimming area, 5 - observation platform (upstream)
Location
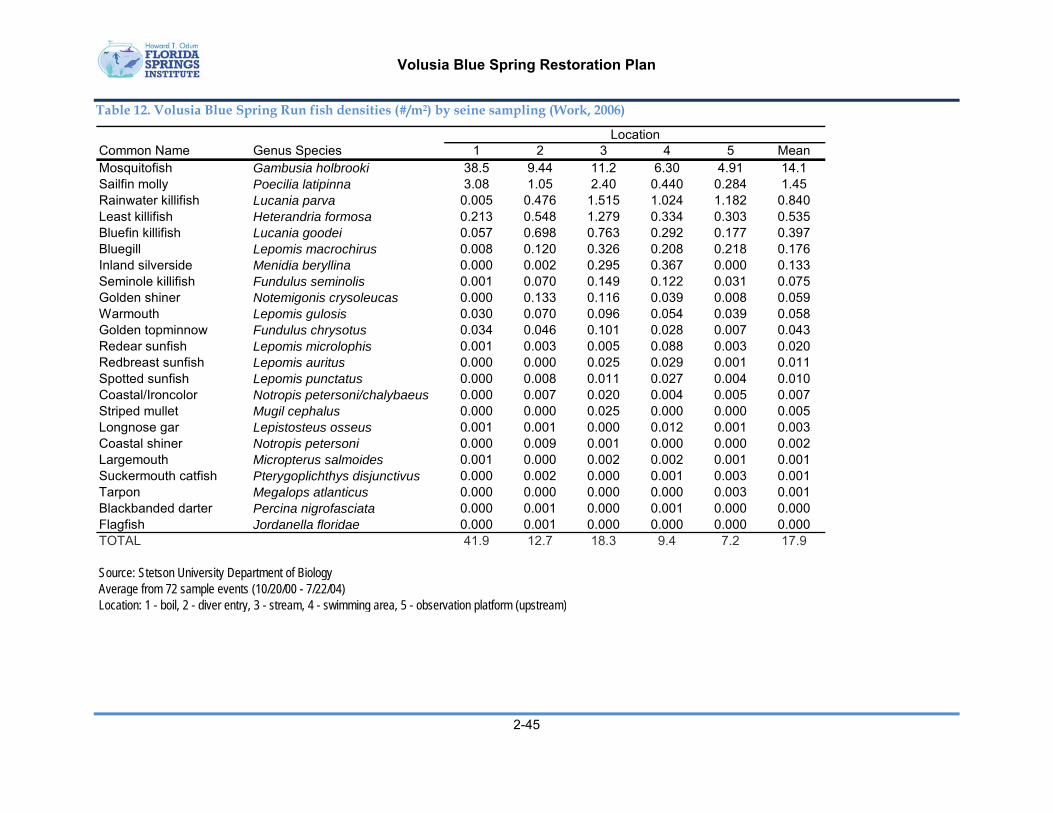
Volusia Blue Spring Restoration Plan
2-45
Table 12. Volusia Blue Spring Run fish densities (#/m2) by seine sampling (Work, 2006)
Common Name Genus Species 1 2 3 4 5 MeanMosquitofish Gambusia holbrooki 38.5 9.44 11.2 6.30 4.91 14.1Sailfin molly Poecilia latipinna 3.08 1.05 2.40 0.440 0.284 1.45Rainwater killifish Lucania parva 0.005 0.476 1.515 1.024 1.182 0.840Least killifish Heterandria formosa 0.213 0.548 1.279 0.334 0.303 0.535Bluefin killifish Lucania goodei 0.057 0.698 0.763 0.292 0.177 0.397Bluegill Lepomis macrochirus 0.008 0.120 0.326 0.208 0.218 0.176Inland silverside Menidia beryllina 0.000 0.002 0.295 0.367 0.000 0.133Seminole killifish Fundulus seminolis 0.001 0.070 0.149 0.122 0.031 0.075Golden shiner Notemigonis crysoleucas 0.000 0.133 0.116 0.039 0.008 0.059Warmouth Lepomis gulosis 0.030 0.070 0.096 0.054 0.039 0.058Golden topminnow Fundulus chrysotus 0.034 0.046 0.101 0.028 0.007 0.043Redear sunfish Lepomis microlophis 0.001 0.003 0.005 0.088 0.003 0.020Redbreast sunfish Lepomis auritus 0.000 0.000 0.025 0.029 0.001 0.011Spotted sunfish Lepomis punctatus 0.000 0.008 0.011 0.027 0.004 0.010Coastal/Ironcolor Notropis petersoni/chalybaeus 0.000 0.007 0.020 0.004 0.005 0.007Striped mullet Mugil cephalus 0.000 0.000 0.025 0.000 0.000 0.005Longnose gar Lepistosteus osseus 0.001 0.001 0.000 0.012 0.001 0.003Coastal shiner Notropis petersoni 0.000 0.009 0.001 0.000 0.000 0.002Largemouth Micropterus salmoides 0.001 0.000 0.002 0.002 0.001 0.001Suckermouth catfish Pterygoplichthys disjunctivus 0.000 0.002 0.000 0.001 0.003 0.001Tarpon Megalops atlanticus 0.000 0.000 0.000 0.000 0.003 0.001Blackbanded darter Percina nigrofasciata 0.000 0.001 0.000 0.001 0.000 0.000Flagfish Jordanella floridae 0.000 0.001 0.000 0.000 0.000 0.000TOTAL 41.9 12.7 18.3 9.4 7.2 17.9
Source: Stetson University Department of BiologyAverage from 72 sample events (10/20/00 - 7/22/04)Location: 1 - boil, 2 - diver entry, 3 - stream, 4 - swimming area, 5 - observation platform (upstream)
Location

Volusia Blue Spring Restoration Plan
2-46
The fish community of Blue Spring was re-assessed during four additional events: a winter sampling event on December 6, 2007; a spring sampling event on March 12, 2008; a summer sampling event on May 29, 2008; and a fall sampling event on September 25, 2008. Data from previous fish sampling events in 2000-2004, were also analyzed for comparison (Table 13 from (Work & Gibbs, 2008).
Over the course of these sampling events, 26 fish species were observed utilizing Blue Spring. An additional four species have been observed during prior annual surveys (2000 to 2004), each only once: flagfish (Jordanella floridae), bluespotted sunfish (Enneacanthus gloriosus), blackbanded darter (Percina nigrofasciata), and the non-indigenous brown hoplo (Hoplosternum littorale) and may be considered occasional inhabitants of Blue Spring. Analysis of the diversity (Shannon-Wiener index) of the fish community utilizing Blue Spring reveals higher diversity in 2007-2008 than in 2000-2004 time period; although the pattern between seasons and stations was similar for both time periods. In both periods, fish diversity was highest in spring/summer and lowest in fall/winter and diversity was much lower at station 1 than any of the other stations, all of which exhibited similar fish diversities.
Total fish assemblage density (based on seine samples) was comparable to previous years; as the average annual density for fish in 2007-2008 (25.0 ± 24.8 fish/m2) was within the range of abundances for the 2000-2004 time period (8.8-37.4 fish/m2. The average seasonal densities also did not differ from the seasonal densities of previous years; indicating that the seasonal pattern of change in abundance in 2007-2008 was similar to the seasonal pattern of change in 2000-2004. In general, fish abundance was higher in fall/winter and lower in spring/summer. Similarly, the spatial distribution of fish abundance in 2007-2008 was comparable to the period of 2000-2004. Fish abundance was highest at station 1 (VBS 0-110) and lowest at stations 4 (VBS 310 to 410) and 5 (VBS 460 to 560). Statistical comparison between the two sampling periods indicates that the spatial patterns of density variation in 2000-2004 were similar to the patterns observed in 2007-2008.
Table 13. Annual density, biomass, and diversity of fish in Blue Spring Run in 2000-2004, and 2007-2008 (Work & Gibbs, 2008)
The seasonal pattern of fish biomass was similar to the pattern for density, with maximum total fish biomass during the fall (283.3 ± 315.8 kg) and minimum total biomass during the summer (28.3 ± 26.0 kg). This pattern was due to the higher densities of both the most abundant species (mosquitofish) and some of the largest species such as tarpon (Megalops atlanticus), longnose gar (Lepisosteus osseus), and blue tilapia (Oreochromis aureus) in the fall.
Year Density (no. m-2) Biomass (kg) Diversity (H’)
2000 8.8 ± 6.2 --- 0.38 ± 0.20
2001 17.4 ± 14.8 --- 0.23 ± 0.13
2002 37.4 ± 47.2 --- 0.26 ± 0.13
2003 22.7 ± 22.6 --- 0.22 ± 0.12
2004 31.1 ± 42.5 --- 0.33 ± 0.12
2007-2008 25.0 ± 24.8 125.7 ± 113.0 0.41 ± 0.10

Volusia Blue Spring Restoration Plan
2-47
Total fish biomass was highest at station 5 (192.3 ± 6.2 kg) and was lowest at station 2 (24.9 ± 12.3 kg). The station 1 total biomass estimate was large (192.4 ± 369.5 kg), but this station also exhibited the greatest variability. Although mosquitofish density (and hence biomass) could be great in the seine locations, it was probably not accurate to extrapolate these densities over the entire area of station 1 (e.g., numerous small fish are observed along the edge, but not over the center boil portion of station 1).
The presence of non-indigenous (exotic) fish species can be quite dramatic in Blue Spring, as blue tilapia, Vermiculated sailfin catfish (Pterygoplichthys disjunctivus), grass carp (Ctenopharyngodon idella), and pacu (Collosoma sp.) can be routinely observed. However, these species were estimated to comprise a small proportion (1.6 ± 6.0 %) of the total fish assemblage density.
2.8.4.6 Turtles
Population surveys for aquatic turtles were conducted in the Blue Spring Run during four separate sampling periods: October 20-23, 2007; March 18-20, 2008; April 11-13, 2008; and October 3-6, 2008.
A total of seven aquatic turtle species were collected (Table 14 andTable 15) including one non-indigenous species to the St. Johns River Basin, the red-eared slider (Trachemys scripta). Red-eared sliders, a member of the family Emydidae, are a moderately large North American basking turtle that can be found in a variety of aquatic habitats. While not native to peninsular Florida, red-eared sliders have become naturalized throughout much of the state, possibly as released pet turtles (Thomas, 2006). A total of four red-eared sliders were captured and delivered to park staff for disposal.
The other six species captured were native to Florida. These species included two other members of the family Emydidae; most commonly the peninsula cooter (Pseudemys floridana peninsularis or P. peninsularis), an herbivorous basking turtle that is abundant throughout Florida. Research has found both male and female biased populations in Florida (Thomas & Jansen, 2006). The second native Pseudemys species was the Florida red-bellied turtle (P. nelsoni); a large basking turtle of which the females are known to place their eggs in alligators’ nests (Jackson & Meylan, 2006). All three of the Pseudemys species encountered at Blue Spring are omnivorous, although older individuals tend to consume more plant material when compared to younger individuals.
Two member of the family Kinosternidae were observed: one commonly, the loggerhead musk turtle (Sternotherus minor) and the other, the common musk turtle (Sternotherus odoratus) captured just once. Both species are relatively small, carnivorous, and can be observed actively foraging along the bottom of water bodies. Loggerhead musk turtles are most abundant in spring runs and appear to specialize in clam and snail prey items (Zappalorti & Iverson, 2006). The common musk turtle utilizes a range of aquatic habitats, is less common in spring ecosystems, and is a diverse carnivore with less dependence on mollusks than the loggerhead musk turtle (Iverson & Meshaka Jr, 2006).
The remaining two species of aquatic turtle were also rarely observed: the common snapping turtle (Chelydra serpentina) and the Florida softshell turtle (Apalone ferox). The common snapping turtle is a large species with omnivorous feeding habits. It rarely basks but typically lies or walks along the bottom of waterbodies (Aresco, Ewert, Gunzburger, Heinrich, & Meylan, 2006). The Florida softshell is another large species that is commonly found in many aquatic habitats in
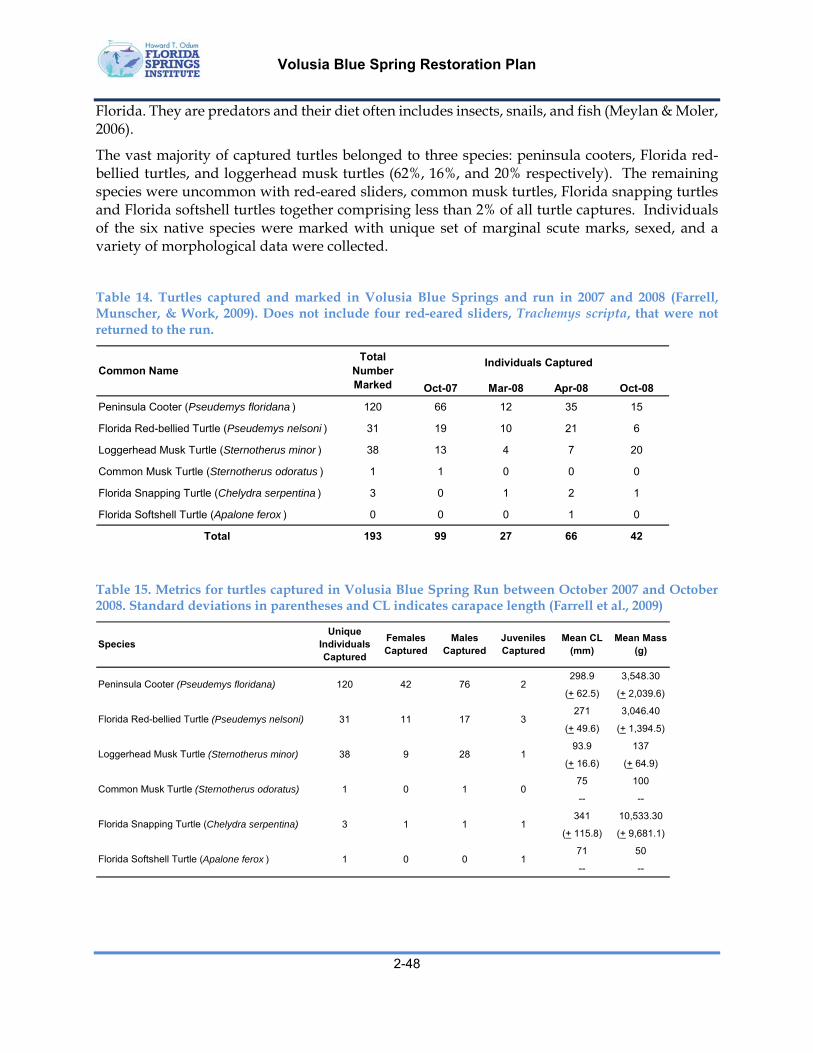
Volusia Blue Spring Restoration Plan
2-48
Florida. They are predators and their diet often includes insects, snails, and fish (Meylan & Moler, 2006).
The vast majority of captured turtles belonged to three species: peninsula cooters, Florida red-bellied turtles, and loggerhead musk turtles (62%, 16%, and 20% respectively). The remaining species were uncommon with red-eared sliders, common musk turtles, Florida snapping turtles and Florida softshell turtles together comprising less than 2% of all turtle captures. Individuals of the six native species were marked with unique set of marginal scute marks, sexed, and a variety of morphological data were collected.
Table 14. Turtles captured and marked in Volusia Blue Springs and run in 2007 and 2008 (Farrell, Munscher, & Work, 2009). Does not include four red-eared sliders, Trachemys scripta, that were not returned to the run.
Table 15. Metrics for turtles captured in Volusia Blue Spring Run between October 2007 and October 2008. Standard deviations in parentheses and CL indicates carapace length (Farrell et al., 2009)
Oct-07 Mar-08 Apr-08 Oct-08
Peninsula Cooter (Pseudemys floridana ) 120 66 12 35 15
Florida Red-bellied Turtle (Pseudemys nelsoni ) 31 19 10 21 6
Loggerhead Musk Turtle (Sternotherus minor ) 38 13 4 7 20
Common Musk Turtle (Sternotherus odoratus ) 1 1 0 0 0
Florida Snapping Turtle (Chelydra serpentina ) 3 0 1 2 1
Florida Softshell Turtle (Apalone ferox ) 0 0 0 1 0
Total 193 99 27 66 42
Total Number Marked
Individuals CapturedCommon Name
298.9 3,548.30
(+ 62.5) (+ 2,039.6)
271 3,046.40
(+ 49.6) (+ 1,394.5)
93.9 137
(+ 16.6) (+ 64.9)
75 100
-- --
341 10,533.30
(+ 115.8) (+ 9,681.1)
71 50
-- --Florida Softshell Turtle (Apalone ferox )
Juveniles Captured
0
Florida Snapping Turtle (Chelydra serpentina) 3 1 1 1
1 0
Mean CL (mm)
Mean Mass (g)
Peninsula Cooter (Pseudemys floridana) 120 42 76 2
0 1
38 9 28 1
Common Musk Turtle (Sternotherus odoratus) 1 0 1
Loggerhead Musk Turtle (Sternotherus minor)
31 11 17 3Florida Red-bellied Turtle (Pseudemys nelsoni)
SpeciesUnique
Individuals Captured
Females Captured
Males Captured
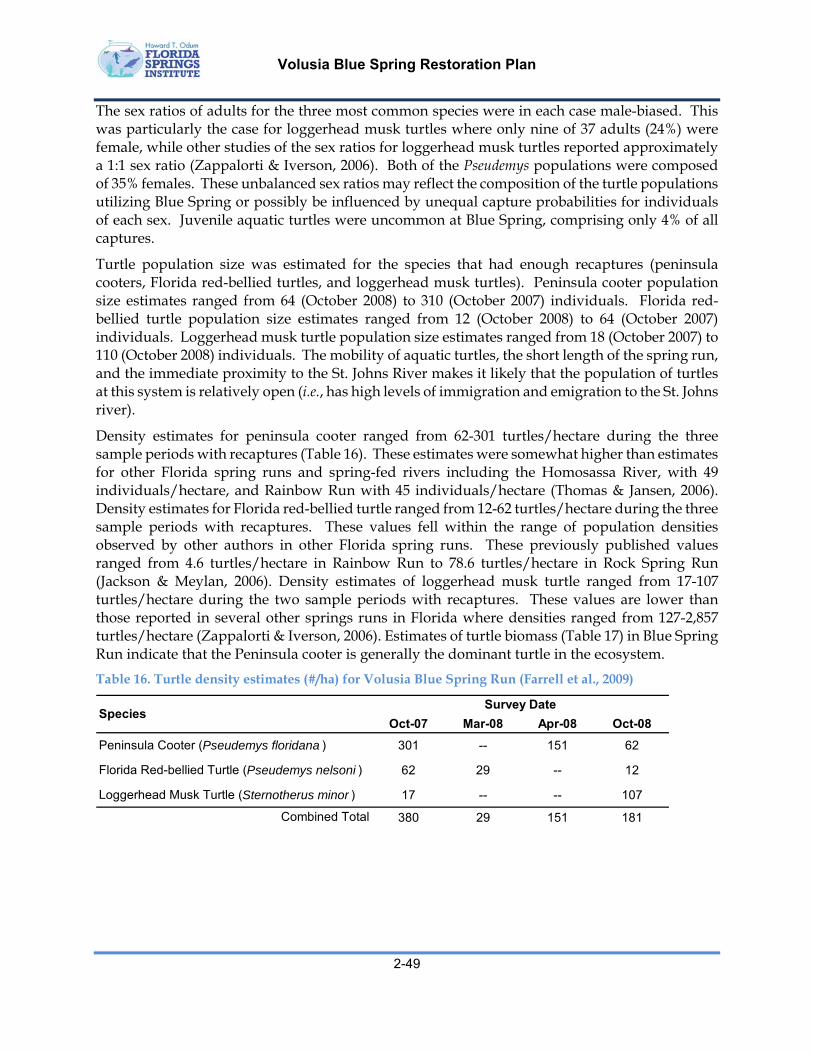
Volusia Blue Spring Restoration Plan
2-49
The sex ratios of adults for the three most common species were in each case male-biased. This was particularly the case for loggerhead musk turtles where only nine of 37 adults (24%) were female, while other studies of the sex ratios for loggerhead musk turtles reported approximately a 1:1 sex ratio (Zappalorti & Iverson, 2006). Both of the Pseudemys populations were composed of 35% females. These unbalanced sex ratios may reflect the composition of the turtle populations utilizing Blue Spring or possibly be influenced by unequal capture probabilities for individuals of each sex. Juvenile aquatic turtles were uncommon at Blue Spring, comprising only 4% of all captures.
Turtle population size was estimated for the species that had enough recaptures (peninsula cooters, Florida red-bellied turtles, and loggerhead musk turtles). Peninsula cooter population size estimates ranged from 64 (October 2008) to 310 (October 2007) individuals. Florida red-bellied turtle population size estimates ranged from 12 (October 2008) to 64 (October 2007) individuals. Loggerhead musk turtle population size estimates ranged from 18 (October 2007) to 110 (October 2008) individuals. The mobility of aquatic turtles, the short length of the spring run, and the immediate proximity to the St. Johns River makes it likely that the population of turtles at this system is relatively open (i.e., has high levels of immigration and emigration to the St. Johns river).
Density estimates for peninsula cooter ranged from 62-301 turtles/hectare during the three sample periods with recaptures (Table 16). These estimates were somewhat higher than estimates for other Florida spring runs and spring-fed rivers including the Homosassa River, with 49 individuals/hectare, and Rainbow Run with 45 individuals/hectare (Thomas & Jansen, 2006). Density estimates for Florida red-bellied turtle ranged from 12-62 turtles/hectare during the three sample periods with recaptures. These values fell within the range of population densities observed by other authors in other Florida spring runs. These previously published values ranged from 4.6 turtles/hectare in Rainbow Run to 78.6 turtles/hectare in Rock Spring Run (Jackson & Meylan, 2006). Density estimates of loggerhead musk turtle ranged from 17-107 turtles/hectare during the two sample periods with recaptures. These values are lower than those reported in several other springs runs in Florida where densities ranged from 127-2,857 turtles/hectare (Zappalorti & Iverson, 2006). Estimates of turtle biomass (Table 17) in Blue Spring Run indicate that the Peninsula cooter is generally the dominant turtle in the ecosystem.
Table 16. Turtle density estimates (#/ha) for Volusia Blue Spring Run (Farrell et al., 2009)
Oct-07 Mar-08 Apr-08 Oct-08
Peninsula Cooter (Pseudemys floridana ) 301 -- 151 62
Florida Red-bellied Turtle (Pseudemys nelsoni ) 62 29 -- 12
Loggerhead Musk Turtle (Sternotherus minor ) 17 -- -- 107
Combined Total 380 29 151 181
Survey DateSpecies
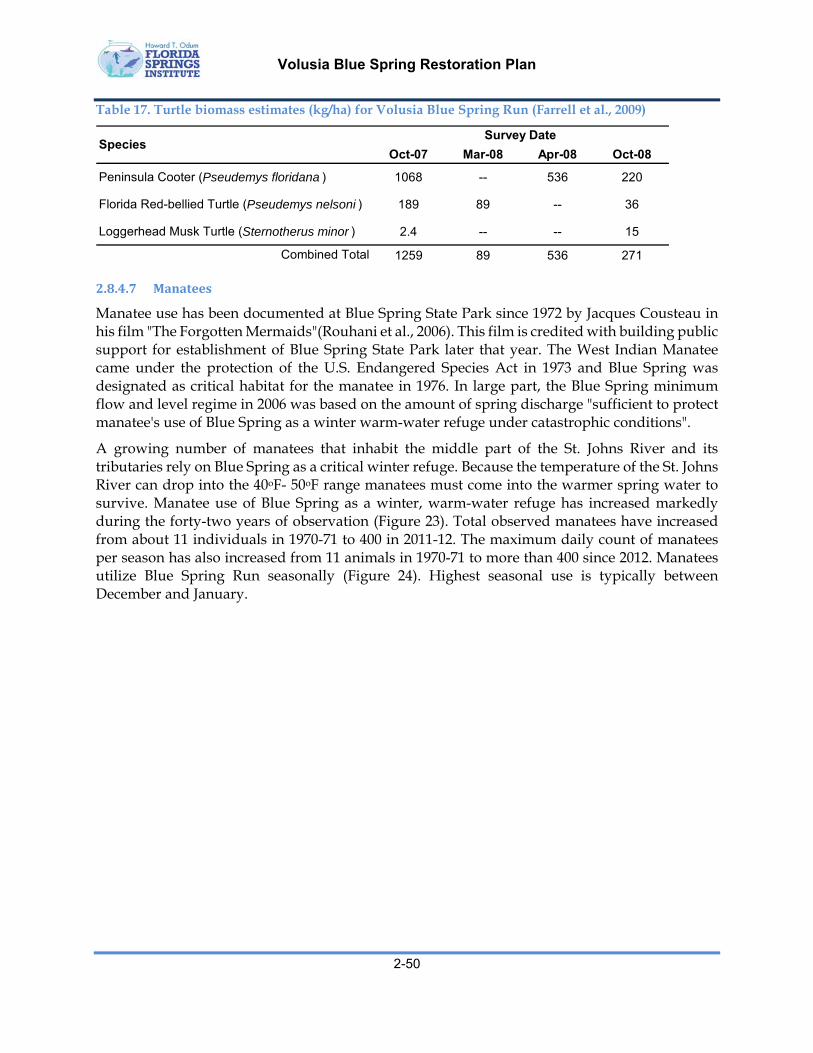
Volusia Blue Spring Restoration Plan
2-50
Table 17. Turtle biomass estimates (kg/ha) for Volusia Blue Spring Run (Farrell et al., 2009)
2.8.4.7 Manatees
Manatee use has been documented at Blue Spring State Park since 1972 by Jacques Cousteau in his film "The Forgotten Mermaids"(Rouhani et al., 2006). This film is credited with building public support for establishment of Blue Spring State Park later that year. The West Indian Manatee came under the protection of the U.S. Endangered Species Act in 1973 and Blue Spring was designated as critical habitat for the manatee in 1976. In large part, the Blue Spring minimum flow and level regime in 2006 was based on the amount of spring discharge "sufficient to protect manatee's use of Blue Spring as a winter warm-water refuge under catastrophic conditions".
A growing number of manatees that inhabit the middle part of the St. Johns River and its tributaries rely on Blue Spring as a critical winter refuge. Because the temperature of the St. Johns River can drop into the 40oF- 50oF range manatees must come into the warmer spring water to survive. Manatee use of Blue Spring as a winter, warm-water refuge has increased markedly during the forty-two years of observation (Figure 23). Total observed manatees have increased from about 11 individuals in 1970-71 to 400 in 2011-12. The maximum daily count of manatees per season has also increased from 11 animals in 1970-71 to more than 400 since 2012. Manatees utilize Blue Spring Run seasonally (Figure 24). Highest seasonal use is typically between December and January.
Oct-07 Mar-08 Apr-08 Oct-08
Peninsula Cooter (Pseudemys floridana ) 1068 -- 536 220
Florida Red-bellied Turtle (Pseudemys nelsoni ) 189 89 -- 36
Loggerhead Musk Turtle (Sternotherus minor ) 2.4 -- -- 15
Combined Total 1259 89 536 271
SpeciesSurvey Date
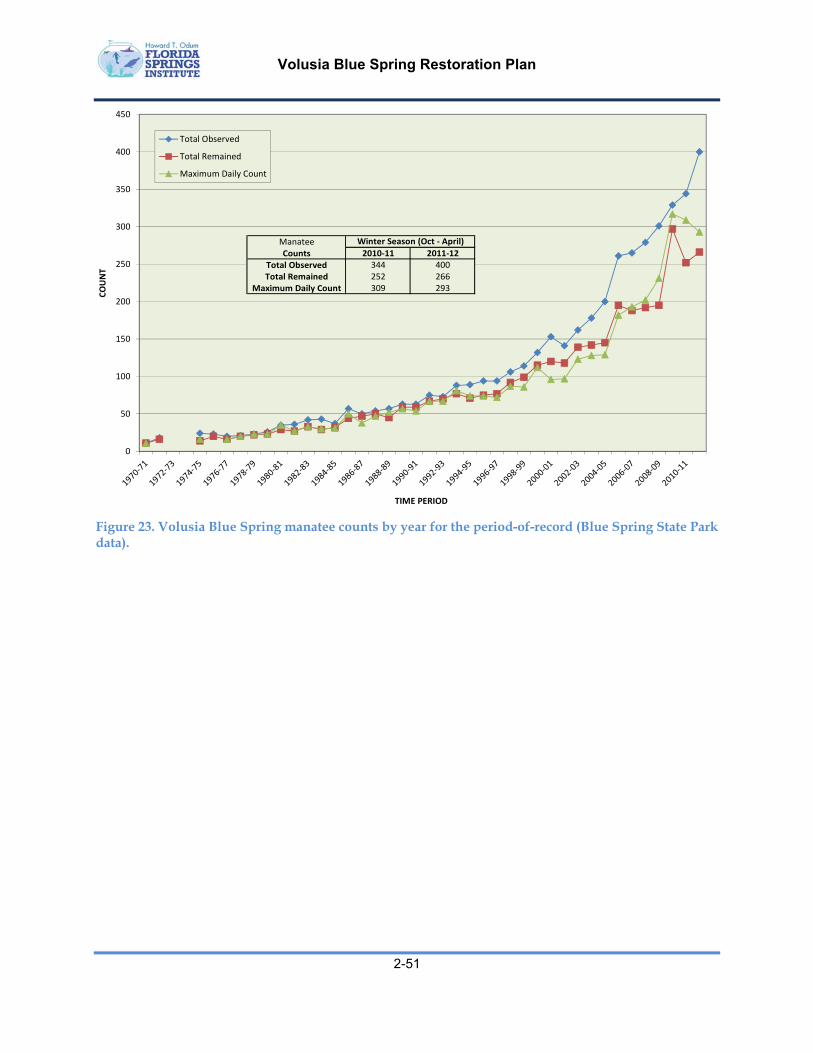
Volusia Blue Spring Restoration Plan
2-51
Figure 23. Volusia Blue Spring manatee counts by year for the period-of-record (Blue Spring State Park data).
0
50
100
150
200
250
300
350
400
450
COUNT
TIME PERIOD
Total Observed
Total Remained
Maximum Daily Count
ManateeCounts 2010‐11 2011‐12
Total Observed 344 400
Total Remained 252 266Maximum Daily Count 309 293
Winter Season (Oct ‐ April)

Volusia Blue Spring Restoration Plan
2-52
Figure 24. Observed seasonality of manatee use at Volusia Blue Spring from 1979 to 2006 (WSI, 2009)
2.8.5 EcosystemFunction
2.8.5.1 CommunityMetabolism
Ecosystem metabolism was estimated in Blue Spring Run using hourly dissolved oxygen data USGS 02235500 (VBS-370) collected with a recording water quality sonde data from October 2010 through June 2012 (WSI, 2012). Table 18 summarizes daily average ecosystem metabolism estimates for these time periods and the period-of-record for all segments. The constancy of the upstream dissolved oxygen conditions was based on historic monitoring at VBS-35 (November 2007 – August 2008).
During WY2010/11 and WY2011/12 (partial) for the Main Boil to VBS-370 segment, gross primary productivity (GPP) averaged 8.7 and 12.1 g O2/m2/d, respectively. Daily average community respiration (CR) was lower than GPP with averages of 6.8 and 7.3 g O2/m2/d. The average Net Primary Productivity (NPP) for days with paired GPP/CR estimates was 4.6 and 4.8 g O2/m2/d with a calculated average P/R ratio of 2.6 and 2.0. The estimated PAR efficiency for the entire spring run segment for both time periods was 0.51 and 0.61 g O2/mol, respectively.
0
10
20
30
40
50
60
70
Oct-15 Nov-4 Nov-24 Dec-14 Jan-3 Jan-23 Feb-12 Mar-4 Mar-24 Apr-13
Calendar Day
Ave
rag
e D
aily
To
tal
Nu
mb
er o
f M
anat
ees
Period of Record: Jan 79 - Mar 06
Y = 0.472 (1-75.29 * cos [(2 pi() / 365)(t-10.64)])
R2=0.71
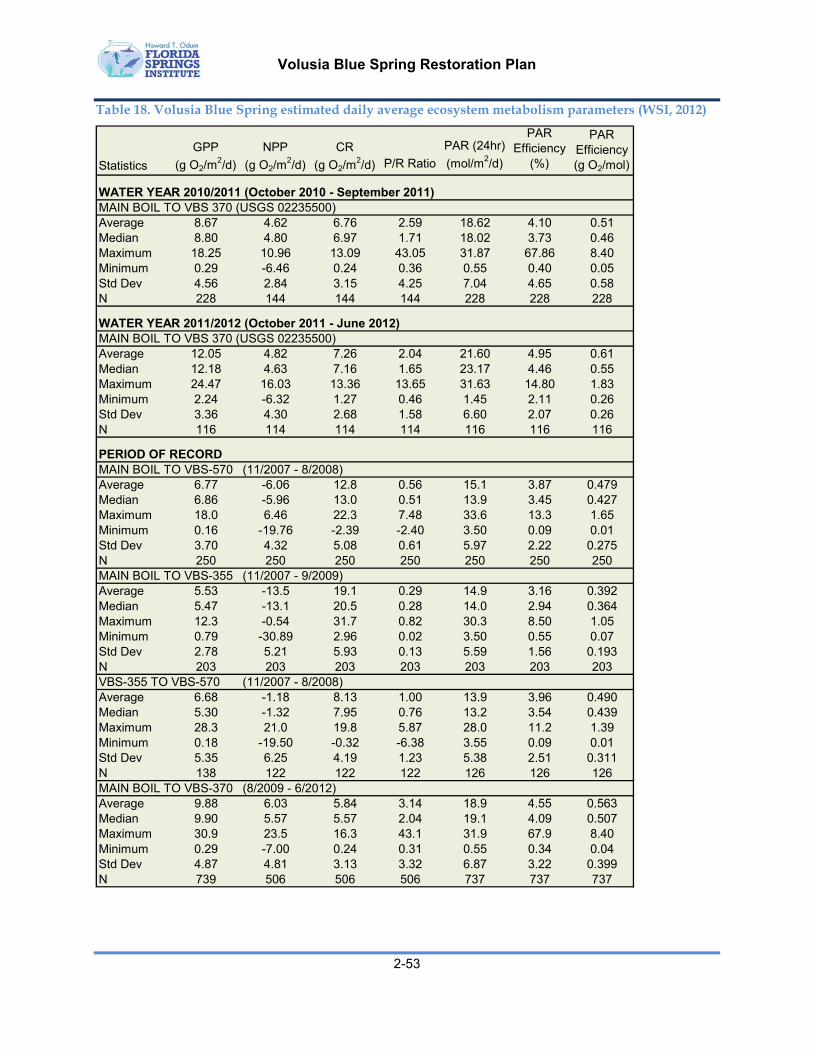
Volusia Blue Spring Restoration Plan
2-53
Table 18. Volusia Blue Spring estimated daily average ecosystem metabolism parameters (WSI, 2012)
Statistics
GPP
(g O2/m2/d)
NPP
(g O2/m2/d)
CR
(g O2/m2/d) P/R Ratio
PAR (24hr)
(mol/m2/d)
PAR Efficiency
(%)
PAR Efficiency(g O2/mol)
WATER YEAR 2010/2011 (October 2010 - September 2011)MAIN BOIL TO VBS 370 (USGS 02235500)Average 8.67 4.62 6.76 2.59 18.62 4.10 0.51Median 8.80 4.80 6.97 1.71 18.02 3.73 0.46Maximum 18.25 10.96 13.09 43.05 31.87 67.86 8.40Minimum 0.29 -6.46 0.24 0.36 0.55 0.40 0.05Std Dev 4.56 2.84 3.15 4.25 7.04 4.65 0.58N 228 144 144 144 228 228 228
WATER YEAR 2011/2012 (October 2011 - June 2012)MAIN BOIL TO VBS 370 (USGS 02235500)Average 12.05 4.82 7.26 2.04 21.60 4.95 0.61Median 12.18 4.63 7.16 1.65 23.17 4.46 0.55Maximum 24.47 16.03 13.36 13.65 31.63 14.80 1.83Minimum 2.24 -6.32 1.27 0.46 1.45 2.11 0.26Std Dev 3.36 4.30 2.68 1.58 6.60 2.07 0.26N 116 114 114 114 116 116 116
PERIOD OF RECORDMAIN BOIL TO VBS-570 (11/2007 - 8/2008)Average 6.77 -6.06 12.8 0.56 15.1 3.87 0.479Median 6.86 -5.96 13.0 0.51 13.9 3.45 0.427Maximum 18.0 6.46 22.3 7.48 33.6 13.3 1.65Minimum 0.16 -19.76 -2.39 -2.40 3.50 0.09 0.01Std Dev 3.70 4.32 5.08 0.61 5.97 2.22 0.275N 250 250 250 250 250 250 250MAIN BOIL TO VBS-355 (11/2007 - 9/2009)Average 5.53 -13.5 19.1 0.29 14.9 3.16 0.392Median 5.47 -13.1 20.5 0.28 14.0 2.94 0.364Maximum 12.3 -0.54 31.7 0.82 30.3 8.50 1.05Minimum 0.79 -30.89 2.96 0.02 3.50 0.55 0.07Std Dev 2.78 5.21 5.93 0.13 5.59 1.56 0.193N 203 203 203 203 203 203 203VBS-355 TO VBS-570 (11/2007 - 8/2008)Average 6.68 -1.18 8.13 1.00 13.9 3.96 0.490Median 5.30 -1.32 7.95 0.76 13.2 3.54 0.439Maximum 28.3 21.0 19.8 5.87 28.0 11.2 1.39Minimum 0.18 -19.50 -0.32 -6.38 3.55 0.09 0.01Std Dev 5.35 6.25 4.19 1.23 5.38 2.51 0.311N 138 122 122 122 126 126 126MAIN BOIL TO VBS-370 (8/2009 - 6/2012)Average 9.88 6.03 5.84 3.14 18.9 4.55 0.563Median 9.90 5.57 5.57 2.04 19.1 4.09 0.507Maximum 30.9 23.5 16.3 43.1 31.9 67.9 8.40Minimum 0.29 -7.00 0.24 0.31 0.55 0.34 0.04Std Dev 4.87 4.81 3.13 3.32 6.87 3.22 0.399N 739 506 506 506 737 737 737
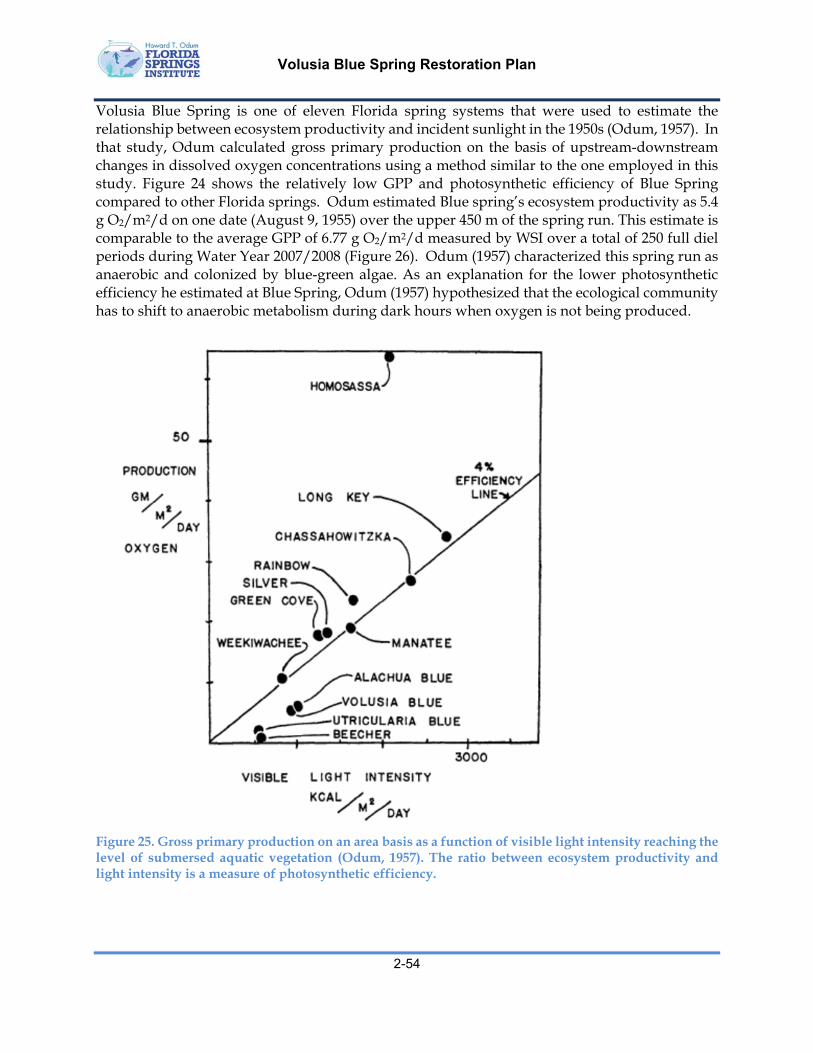
Volusia Blue Spring Restoration Plan
2-54
Volusia Blue Spring is one of eleven Florida spring systems that were used to estimate the relationship between ecosystem productivity and incident sunlight in the 1950s (Odum, 1957). In that study, Odum calculated gross primary production on the basis of upstream-downstream changes in dissolved oxygen concentrations using a method similar to the one employed in this study. Figure 24 shows the relatively low GPP and photosynthetic efficiency of Blue Spring compared to other Florida springs. Odum estimated Blue spring’s ecosystem productivity as 5.4 g O2/m2/d on one date (August 9, 1955) over the upper 450 m of the spring run. This estimate is comparable to the average GPP of 6.77 g O2/m2/d measured by WSI over a total of 250 full diel periods during Water Year 2007/2008 (Figure 26). Odum (1957) characterized this spring run as anaerobic and colonized by blue-green algae. As an explanation for the lower photosynthetic efficiency he estimated at Blue Spring, Odum (1957) hypothesized that the ecological community has to shift to anaerobic metabolism during dark hours when oxygen is not being produced.
Figure 25. Gross primary production on an area basis as a function of visible light intensity reaching the level of submersed aquatic vegetation (Odum, 1957). The ratio between ecosystem productivity and light intensity is a measure of photosynthetic efficiency.
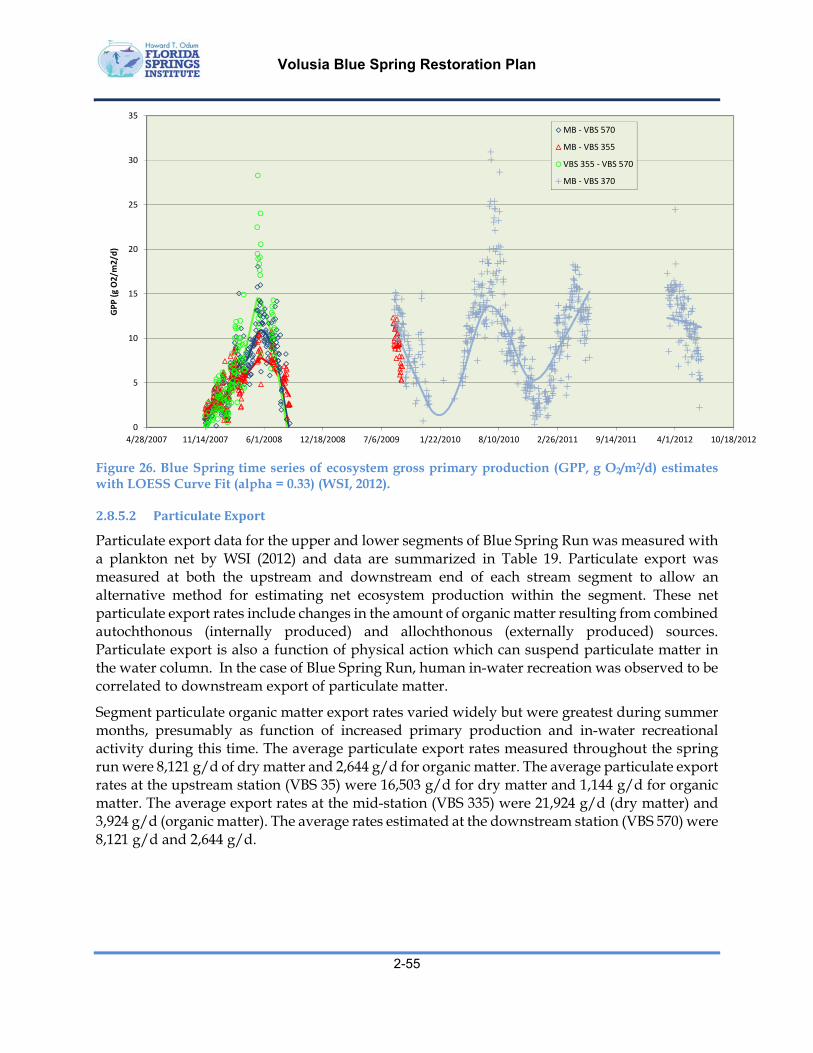
Volusia Blue Spring Restoration Plan
2-55
Figure 26. Blue Spring time series of ecosystem gross primary production (GPP, g O2/m2/d) estimates with LOESS Curve Fit (alpha = 0.33) (WSI, 2012).
2.8.5.2 ParticulateExport
Particulate export data for the upper and lower segments of Blue Spring Run was measured with a plankton net by WSI (2012) and data are summarized in Table 19. Particulate export was measured at both the upstream and downstream end of each stream segment to allow an alternative method for estimating net ecosystem production within the segment. These net particulate export rates include changes in the amount of organic matter resulting from combined autochthonous (internally produced) and allochthonous (externally produced) sources. Particulate export is also a function of physical action which can suspend particulate matter in the water column. In the case of Blue Spring Run, human in-water recreation was observed to be correlated to downstream export of particulate matter.
Segment particulate organic matter export rates varied widely but were greatest during summer months, presumably as function of increased primary production and in-water recreational activity during this time. The average particulate export rates measured throughout the spring run were 8,121 g/d of dry matter and 2,644 g/d for organic matter. The average particulate export rates at the upstream station (VBS 35) were 16,503 g/d for dry matter and 1,144 g/d for organic matter. The average export rates at the mid-station (VBS 335) were 21,924 g/d (dry matter) and 3,924 g/d (organic matter). The average rates estimated at the downstream station (VBS 570) were 8,121 g/d and 2,644 g/d.
0
5
10
15
20
25
30
35
4/28/2007 11/14/2007 6/1/2008 12/18/2008 7/6/2009 1/22/2010 8/10/2010 2/26/2011 9/14/2011 4/1/2012 10/18/2012
GPP (g O2/m
2/d)
MB ‐ VBS 570
MB ‐ VBS 355
VBS 355 ‐ VBS 570
MB ‐ VBS 370
Volusia Blue Spring Restoration Plan
2-56
The net particulate export rates for the entire spring run averaged 0.62 g/m2/d dry matter and 0.20 g/m2/d of organic matter. For the upstream segment (VBS 35 – VBS 335) the net particulate export rates were estimated as 3.14 g/m2/d dry matter and 0.55 g/m2/d of organic matter. For the lower segment these average export rates were estimated as 0.62 g/m2/d dry matter and 0.20 g/m2/d of organic matter. Within segments, no consistent pattern of particulate export or uptake was observed; depending on sampling date, a segment could export or capture particulate matter.
The material captured in the plankton net used to estimate particulate export varied between stations. At the uppermost sampling station (VBS 35), the dominant material collected was reddish-brown amorphous organic material and appeared to be bacterial in nature. This material appeared to be growing on the walls of the main spring cavern. Other material collected at VBS 35 included mineral sands (stirred up by in-water recreation) and a limited variety of filamentous algae (Lyngbya, Spirogyra, and Cladophora). At the VBS 355 and VBS 570 stations, algae diversity increased and became the dominant component of the exported material. Table 20 provides a qualitative description of the material collected in plankton net samples and further identifies the algae community present in Blue Spring.
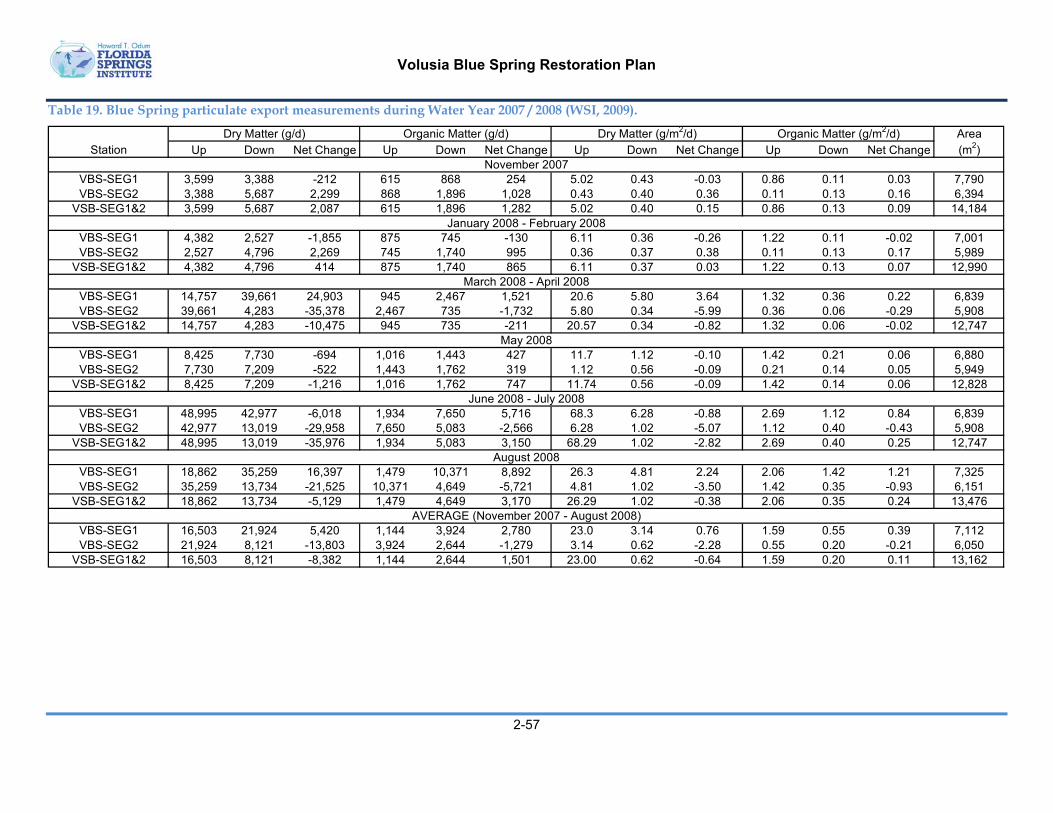
Volusia Blue Spring Restoration Plan
2-57
Table 19. Blue Spring particulate export measurements during Water Year 2007 / 2008 (WSI, 2009).
AreaStation Up Down Net Change Up Down Net Change Up Down Net Change Up Down Net Change (m2)
VBS-SEG1 3,599 3,388 -212 615 868 254 5.02 0.43 -0.03 0.86 0.11 0.03 7,790VBS-SEG2 3,388 5,687 2,299 868 1,896 1,028 0.43 0.40 0.36 0.11 0.13 0.16 6,394
VSB-SEG1&2 3,599 5,687 2,087 615 1,896 1,282 5.02 0.40 0.15 0.86 0.13 0.09 14,184
VBS-SEG1 4,382 2,527 -1,855 875 745 -130 6.11 0.36 -0.26 1.22 0.11 -0.02 7,001VBS-SEG2 2,527 4,796 2,269 745 1,740 995 0.36 0.37 0.38 0.11 0.13 0.17 5,989
VSB-SEG1&2 4,382 4,796 414 875 1,740 865 6.11 0.37 0.03 1.22 0.13 0.07 12,990
VBS-SEG1 14,757 39,661 24,903 945 2,467 1,521 20.6 5.80 3.64 1.32 0.36 0.22 6,839VBS-SEG2 39,661 4,283 -35,378 2,467 735 -1,732 5.80 0.34 -5.99 0.36 0.06 -0.29 5,908
VSB-SEG1&2 14,757 4,283 -10,475 945 735 -211 20.57 0.34 -0.82 1.32 0.06 -0.02 12,747
VBS-SEG1 8,425 7,730 -694 1,016 1,443 427 11.7 1.12 -0.10 1.42 0.21 0.06 6,880VBS-SEG2 7,730 7,209 -522 1,443 1,762 319 1.12 0.56 -0.09 0.21 0.14 0.05 5,949
VSB-SEG1&2 8,425 7,209 -1,216 1,016 1,762 747 11.74 0.56 -0.09 1.42 0.14 0.06 12,828
VBS-SEG1 48,995 42,977 -6,018 1,934 7,650 5,716 68.3 6.28 -0.88 2.69 1.12 0.84 6,839VBS-SEG2 42,977 13,019 -29,958 7,650 5,083 -2,566 6.28 1.02 -5.07 1.12 0.40 -0.43 5,908
VSB-SEG1&2 48,995 13,019 -35,976 1,934 5,083 3,150 68.29 1.02 -2.82 2.69 0.40 0.25 12,747
VBS-SEG1 18,862 35,259 16,397 1,479 10,371 8,892 26.3 4.81 2.24 2.06 1.42 1.21 7,325VBS-SEG2 35,259 13,734 -21,525 10,371 4,649 -5,721 4.81 1.02 -3.50 1.42 0.35 -0.93 6,151
VSB-SEG1&2 18,862 13,734 -5,129 1,479 4,649 3,170 26.29 1.02 -0.38 2.06 0.35 0.24 13,476
VBS-SEG1 16,503 21,924 5,420 1,144 3,924 2,780 23.0 3.14 0.76 1.59 0.55 0.39 7,112VBS-SEG2 21,924 8,121 -13,803 3,924 2,644 -1,279 3.14 0.62 -2.28 0.55 0.20 -0.21 6,050
VSB-SEG1&2 16,503 8,121 -8,382 1,144 2,644 1,501 23.00 0.62 -0.64 1.59 0.20 0.11 13,162
AVERAGE (November 2007 - August 2008)
Dry Matter (g/d) Organic Matter (g/d) Dry Matter (g/m2/d) Organic Matter (g/m2/d)
June 2008 - July 2008
August 2008
November 2007
January 2008 - February 2008
March 2008 - April 2008
May 2008
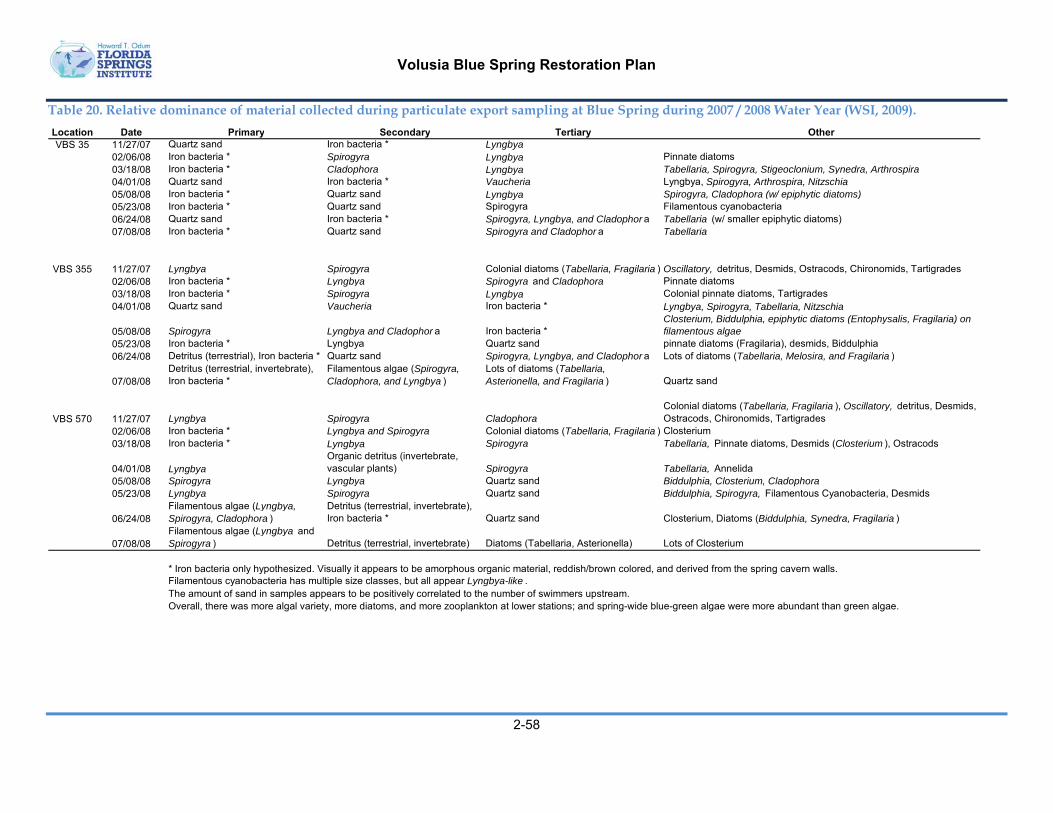
Volusia Blue Spring Restoration Plan
2-58
Table 20. Relative dominance of material collected during particulate export sampling at Blue Spring during 2007 / 2008 Water Year (WSI, 2009).
Location Date Primary Secondary Tertiary OtherVBS 35 11/27/07 Quartz sand Iron bacteria * Lyngbya
02/06/08 Iron bacteria * Spirogyra Lyngbya Pinnate diatoms03/18/08 Iron bacteria * Cladophora Lyngbya Tabellaria, Spirogyra, Stigeoclonium, Synedra, Arthrospira04/01/08 Quartz sand Iron bacteria * Vaucheria Lyngbya, Spirogyra, Arthrospira, Nitzschia05/08/08 Iron bacteria * Quartz sand Lyngbya Spirogyra, Cladophora (w/ epiphytic diatoms)05/23/08 Iron bacteria * Quartz sand Spirogyra Filamentous cyanobacteria06/24/08 Quartz sand Iron bacteria * Spirogyra, Lyngbya, and Cladophor a Tabellaria (w/ smaller epiphytic diatoms)07/08/08 Iron bacteria * Quartz sand Spirogyra and Cladophor a Tabellaria
VBS 355 11/27/07 Lyngbya Spirogyra Colonial diatoms (Tabellaria, Fragilaria ) Oscillatory, detritus, Desmids, Ostracods, Chironomids, Tartigrades02/06/08 Iron bacteria * Lyngbya Spirogyra and Cladophora Pinnate diatoms03/18/08 Iron bacteria * Spirogyra Lyngbya Colonial pinnate diatoms, Tartigrades04/01/08 Quartz sand Vaucheria Iron bacteria * Lyngbya, Spirogyra, Tabellaria, Nitzschia
05/08/08 Spirogyra Lyngbya and Cladophor a Iron bacteria *Closterium, Biddulphia, epiphytic diatoms (Entophysalis, Fragilaria) on filamentous algae
05/23/08 Iron bacteria * Lyngbya Quartz sand pinnate diatoms (Fragilaria), desmids, Biddulphia06/24/08 Detritus (terrestrial), Iron bacteria * Quartz sand Spirogyra, Lyngbya, and Cladophor a Lots of diatoms (Tabellaria, Melosira, and Fragilaria )
07/08/08Detritus (terrestrial, invertebrate), Iron bacteria *
Filamentous algae (Spirogyra, Cladophora, and Lyngbya )
Lots of diatoms (Tabellaria, Asterionella, and Fragilaria ) Quartz sand
VBS 570 11/27/07 Lyngbya Spirogyra CladophoraColonial diatoms (Tabellaria, Fragilaria ), Oscillatory, detritus, Desmids, Ostracods, Chironomids, Tartigrades
02/06/08 Iron bacteria * Lyngbya and Spirogyra Colonial diatoms (Tabellaria, Fragilaria ) Closterium03/18/08 Iron bacteria * Lyngbya Spirogyra Tabellaria, Pinnate diatoms, Desmids (Closterium ), Ostracods
04/01/08 LyngbyaOrganic detritus (invertebrate, vascular plants) Spirogyra Tabellaria, Annelida
05/08/08 Spirogyra Lyngbya Quartz sand Biddulphia, Closterium, Cladophora05/23/08 Lyngbya Spirogyra Quartz sand Biddulphia, Spirogyra, Filamentous Cyanobacteria, Desmids
06/24/08Filamentous algae (Lyngbya, Spirogyra, Cladophora )
Detritus (terrestrial, invertebrate), Iron bacteria * Quartz sand Closterium, Diatoms (Biddulphia, Synedra, Fragilaria )
07/08/08Filamentous algae (Lyngbya and Spirogyra ) Detritus (terrestrial, invertebrate) Diatoms (Tabellaria, Asterionella) Lots of Closterium
* Iron bacteria only hypothesized. Visually it appears to be amorphous organic material, reddish/brown colored, and derived from the spring cavern walls.Filamentous cyanobacteria has multiple size classes, but all appear Lyngbya-like .The amount of sand in samples appears to be positively correlated to the number of swimmers upstream.Overall, there was more algal variety, more diatoms, and more zooplankton at lower stations; and spring-wide blue-green algae were more abundant than green algae.

Volusia Blue Spring Restoration Plan
2-59
2.8.5.3 NutrientAssimilation
Estimated nutrient mass balances for each Blue Spring Run segment are presented in Table 21 by nutrient from October 2010 through June 2012 (WSI, 2012); Year 4 -WY2010/11 and Year 5 partial – WY2011/12).
Estimated mass removals for ammonia nitrogen were positive in the upper and lower segment, as well as the entire spring run (2.65, 2.05, and 2.37 kg/ha/d, respectively) for an overall decline of about 11.6%. Nitrate+nitrite nitrogen estimated mass removals were also positive in both segments and the entire spring run (3.72, 8.55, and 5.93 kg/ha/d, respectively) for an overall decline of about 5.8% (from 0.42 to 0.40 mg/L).
Estimated mass removals for total nitrogen (TN), total Kjeldahl nitrogen (TKN), and organic nitrogen (organic N) were positive in the upper segment (5.29, 2.50, and 1.25 kg/ha/d, respectively) and negative in the lower segment and entire spring run (TN: -16.2 and -4.55 kg/ha/d; TKN: -26.5 and -10.8 kg/ha/d; organic N: -29.6, and -12.6 kg/ha/d, respectively). These data indicate that there is a source of organic N that is entering the spring run. This source may be allochthonous organic matter (leaves) from the bordering canopy and/or from surface runoff.
The estimated mass removal for ortho-phosphorus was positive in the upper and lower segments, as well as for the entire spring run (0.26, 2.08, and 1.09 kg/ha/d, respectively), for an overall average decline of about 6% (average concentration reduction from 0.076 and 0.072 mg/L). Estimated removals for total phosphorus (TP) were also positive in the upper segment (0.95 kg/ha/d) but were negative in the lower segment and for the entire spring run (-5.59 and -2.05 kg/ha/d, respectively). This is additional evidence of the input of allochthonous organic matter along the length of the spring run.
Table 21. Summary of estimated nutrient mass removals in Volusia Blue Spring by parameter from October 2010 through June 2012 (WSI, 2012).
Conc Flow Mass Mass Conc Flow Mass Mass
Units (mg/L) (m3/d) (kg/d) (kg/ha/d) (mg/L) (m3/d) (kg/d) (kg/ha/d) (mg/L) (%) (kg/d) (kg/ha/d) (%)
NH4-N mg/L VBS 35 - 355 0.085 319,141 27.1 37.9 0.079 319,141 25.2 35.2 0.006 7.00 1.90 2.65 7.00
VBS 355 - 570 0.079 319,141 25.2 41.5 0.075 319,141 24.0 39.5 0.004 4.93 1.24 2.05 4.93VBS 35 - 570 0.085 319,141 27.1 20.5 0.075 319,141 24.0 18.1 0.010 11.6 3.14 2.37 11.6
NOx-N mg/L VBS 35 - 355 0.420 319,141 134 187 0.412 319,141 131 184 0.008 1.99 2.66 3.72 1.99VBS 355 - 570 0.412 319,141 131 217 0.396 319,141 126 208 0.016 3.95 5.19 8.55 3.95VBS 35 - 570 0.420 319,141 134 101 0.396 319,141 126 95 0.025 5.85 7.85 5.93 5.85
Org N mg/L VBS 35 - 355 0.068 319,141 21.7 30.4 0.064 319,141 20.5 28.6 0.004 5.73 1.25 1.74 5.73VBS 355 - 570 0.064 319,141 20.5 33.8 0.121 319,141 38.5 63.4 -0.056 -87.7 -18.0 -29.6 -87.7VBS 35 - 570 0.068 319,141 21.7 16.4 0.121 319,141 38.5 29.1 -0.052 -77.0 -16.7 -12.6 -77.0
TKN mg/L VBS 35 - 355 0.151 319,141 48.2 67.3 0.145 319,141 46.4 64.8 0.006 3.72 1.79 2.50 3.72VBS 355 - 570 0.145 319,141 46.4 76.4 0.196 319,141 62.5 103.0 -0.050 -34.7 -16.1 -26.5 -34.7VBS 35 - 570 0.151 319,141 48.2 36.4 0.196 319,141 62.5 47.2 -0.045 -29.7 -14.3 -10.8 -29.7
TN mg/L VBS 35 - 355 0.569 319,141 182 254 0.558 319,141 178 248 0.012 2.09 3.79 5.29 2.09VBS 355 - 570 0.558 319,141 178 293 0.588 319,141 188 309 -0.031 -5.51 -9.81 -16.2 -5.51VBS 35 - 570 0.569 319,141 182 137 0.588 319,141 188 142 -0.019 -3.31 -6.02 -4.55 -3.31
Ortho P mg/L VBS 35 - 355 0.076 319,141 24.3 33.9 0.075 319,141 24.1 33.6 0.0006 0.753 0.183 0.255 0.753VBS 355 - 570 0.075 319,141 24.1 39.7 0.072 319,141 22.8 37.6 0.004 5.25 1.26 2.08 5.25VBS 35 - 570 0.076 319,141 24.3 18.3 0.072 319,141 22.8 17.2 0.005 5.96 1.45 1.09 5.96
TP mg/L VBS 35 - 355 0.074 319,141 23.6 32.9 0.072 319,141 22.9 31.9 0.002 2.89 0.681 0.951 2.89VBS 355 - 570 0.072 319,141 22.9 37.7 0.082 319,141 26.3 43.3 -0.011 -14.8 -3.39 -5.59 -14.8VBS 35 - 570 0.074 319,141 23.6 17.8 0.082 319,141 26.3 19.9 -0.009 -11.5 -2.71 -2.05 -11.5
Parameter Segment
Inflow OutflowRemovalSegment ‐ Up Segment ‐ Down
Conc Mass

Volusia Blue Spring Restoration Plan
3-1
Section 3.0 Summary of Existing Impairments at Volusia Blue Spring
3.1 Groundwater Withdrawals and Declining Spring Flows As of 2017 there where a total of 242 groundwater consumptive use permits (CUPs) within the Volusia Blue Springshed (Figure 27). The permitted average groundwater extraction from the Floridan Aquifer for these CUPs is 30.6 million gallons per day (MGD). Estimated groundwater pumping in Volusia and Lake counties in 2010 was about 185 MGD and the estimated pumping in the Volusia Blue Springshed was 12.1 MGD (Table 22).
Knight and Clarke (2016) prepared an empirical water balance for the Floridan Aquifer System utilizing estimated groundwater recharge data from the U.S. Geological Survey’s Mega Model (Bush & Johnston, 1988) and from recorded discharge data from about 350 of Florida’s 1,000+ springs. That water balance documented a continuing trend of spring flow reductions since the higher rainfall period in the 1960s, resulting in an average spring flow reduction of 32% by 2010 across the Springs Region of North and Central Florida. The estimated average spring flow reduction in the St. Johns River WMD springs was about 22% or 276 MGD. The estimated average recharge to the Floridan Aquifer System in the St. Johns River WMD is about 1,530 MGD. Total estimated groundwater extraction from the Floridan Aquifer System in the St. Johns River WMD in 2010 was 979 MGD or 64% of estimated average recharge. These estimates indicate that a large fraction of the groundwater extracted in the St. Johns River WMD recharges the Floridan Aquifer in neighboring WMDs, and especially the Suwannee River WMD where estimated gross groundwater pumping is about 7% of the estimated recharge but spring flows have declined on average by 48% (Knight & Clarke, 2016).
This analysis demonstrates that groundwater is relatively mobile between areas of high recharge and areas of high pumping with aquifer drawdowns. Pumping effects on spring flows are regional. Increasing groundwater use for irrigating agricultural, residential, and golf course lands in the Volusia Blue Spring groundwater basin has led to declining spring flows. Over time, groundwater withdrawals may lower aquifer water levels to the point where there is no longer sufficient pressure gradient to cause a spring to discharge (Harrington, Maddox, & Hicks, 2010).
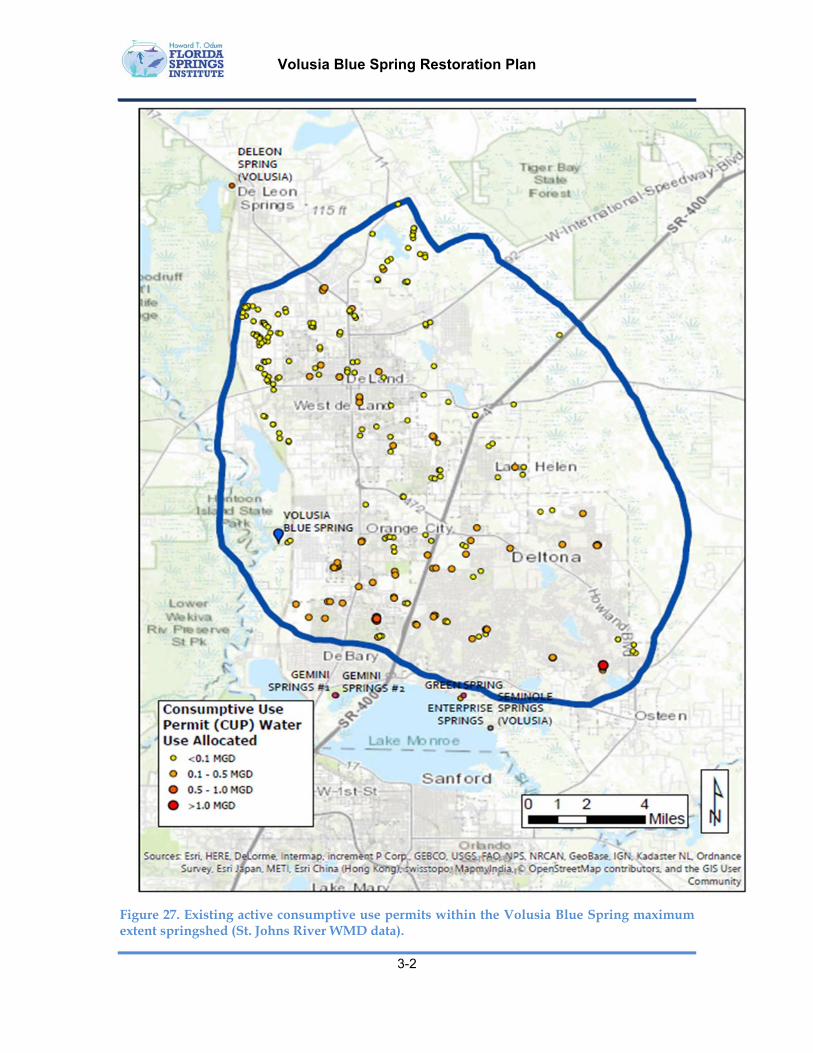
Volusia Blue Spring Restoration Plan
3-2
Figure 27. Existing active consumptive use permits within the Volusia Blue Spring maximum extent springshed (St. Johns River WMD data).
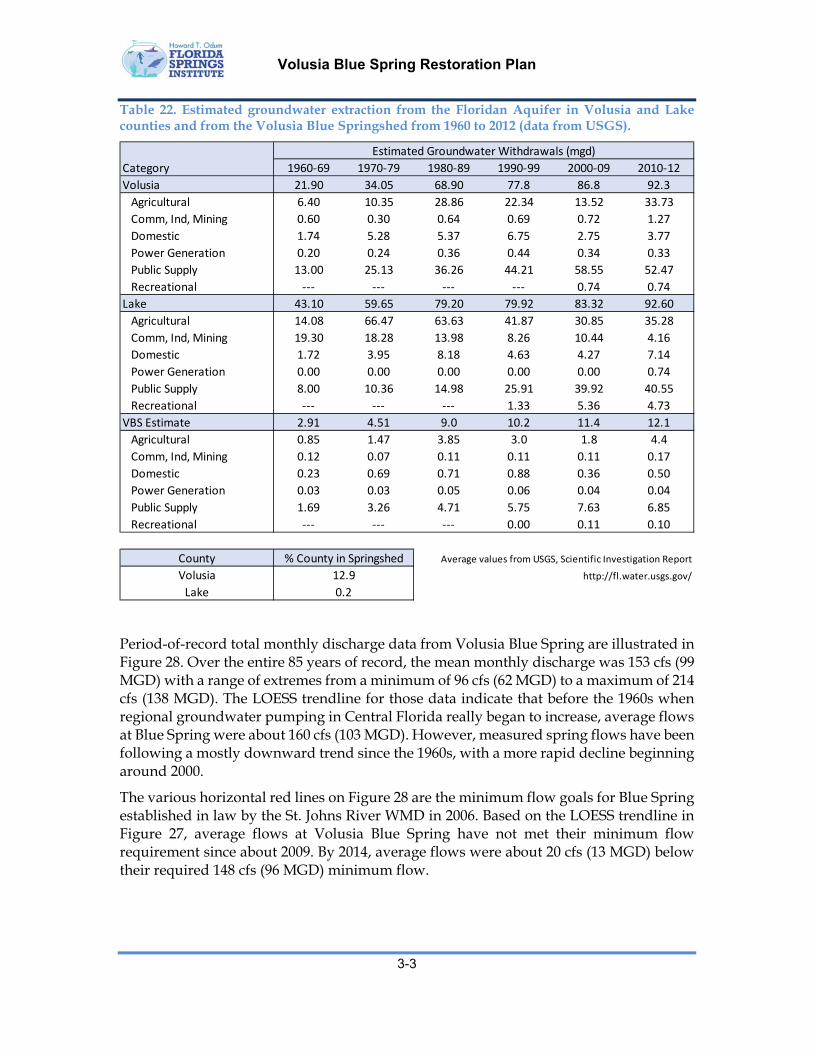
Volusia Blue Spring Restoration Plan
3-3
Table 22. Estimated groundwater extraction from the Floridan Aquifer in Volusia and Lake counties and from the Volusia Blue Springshed from 1960 to 2012 (data from USGS).
Period-of-record total monthly discharge data from Volusia Blue Spring are illustrated in Figure 28. Over the entire 85 years of record, the mean monthly discharge was 153 cfs (99 MGD) with a range of extremes from a minimum of 96 cfs (62 MGD) to a maximum of 214 cfs (138 MGD). The LOESS trendline for those data indicate that before the 1960s when regional groundwater pumping in Central Florida really began to increase, average flows at Blue Spring were about 160 cfs (103 MGD). However, measured spring flows have been following a mostly downward trend since the 1960s, with a more rapid decline beginning around 2000.
The various horizontal red lines on Figure 28 are the minimum flow goals for Blue Spring established in law by the St. Johns River WMD in 2006. Based on the LOESS trendline in Figure 27, average flows at Volusia Blue Spring have not met their minimum flow requirement since about 2009. By 2014, average flows were about 20 cfs (13 MGD) below their required 148 cfs (96 MGD) minimum flow.
Category 1960‐69 1970‐79 1980‐89 1990‐99 2000‐09 2010‐12
Volusia 21.90 34.05 68.90 77.8 86.8 92.3
Agricultural 6.40 10.35 28.86 22.34 13.52 33.73
Comm, Ind, Mining 0.60 0.30 0.64 0.69 0.72 1.27
Domestic 1.74 5.28 5.37 6.75 2.75 3.77
Power Generation 0.20 0.24 0.36 0.44 0.34 0.33
Public Supply 13.00 25.13 36.26 44.21 58.55 52.47
Recreational ‐‐‐ ‐‐‐ ‐‐‐ ‐‐‐ 0.74 0.74
Lake 43.10 59.65 79.20 79.92 83.32 92.60
Agricultural 14.08 66.47 63.63 41.87 30.85 35.28
Comm, Ind, Mining 19.30 18.28 13.98 8.26 10.44 4.16
Domestic 1.72 3.95 8.18 4.63 4.27 7.14
Power Generation 0.00 0.00 0.00 0.00 0.00 0.74
Public Supply 8.00 10.36 14.98 25.91 39.92 40.55
Recreational ‐‐‐ ‐‐‐ ‐‐‐ 1.33 5.36 4.73
VBS Estimate 2.91 4.51 9.0 10.2 11.4 12.1
Agricultural 0.85 1.47 3.85 3.0 1.8 4.4
Comm, Ind, Mining 0.12 0.07 0.11 0.11 0.11 0.17
Domestic 0.23 0.69 0.71 0.88 0.36 0.50
Power Generation 0.03 0.03 0.05 0.06 0.04 0.04
Public Supply 1.69 3.26 4.71 5.75 7.63 6.85
Recreational ‐‐‐ ‐‐‐ ‐‐‐ 0.00 0.11 0.10
County Average values from USGS, Scientific Investigation Report
Volusia http://fl.water.usgs.gov/
Lake
Estimated Groundwater Withdrawals (mgd)
% County in Springshed
12.9
0.2

Volusia Blue Spring Restoration Plan
3-4
Figure 28. Reported monthly average discharge at Volusia Blue Spring and regulatory minimum flows established by the St. Johns River WMD (USGS data).
Spring discharge and resulting current velocities have been shown to be one of the most important factors affecting springs ecological health (Knight, 2015). Figure 29 shows the measured relationship between spring discharge and the efficiency of ecosystem gross productivity. Spring ecosystems are more productive when they have higher flows, and inversely, they have lower productivity and food-chain support when flows decline. This finding illustrates one critical measure of ecological harm caused by any reduction in average spring flows.
Current velocity is also part of the springs hydraulic regime. Recent research conducted at several springs in Florida has shown that colonization of springs by harmful filamentous algae is accelerated by declining current velocities (King, 2014; Reddy et al., 2017). Threshold velocities strip away attached algae. Artificially manipulating current velocity in Silver Springs resulted in a rapid proliferation of filamentous algae similar to what has been observed in the Silver River since flow declines became very noticeable by the 1990s (Figure 30). A second observed effect of reduced current velocities in some spring runs is a proliferation of certain submerged aquatic plant species, including Sagittaria kurtziana (tapegrass) and Hydrilla verticillata (hydrilla). Higher, mid-channel water velocities actively strip SAV from the middle of spring runs (Reddy et al., 2017).

Volusia Blue Spring Restoration Plan
3-5
Figure 29. Average discharge versus average photosynthetic efficiency at Gum Slough and 12 previously studied spring ecosystems (WSI, 2010).
Anecdotal reports indicate that Volusia Blue Spring Run was once colonized by submerged aquatic vegetation. Possible reasons for replacement of this vegetation by filamentous algae have not been evaluated. WSI (2012) speculated that the very low dissolved oxygen levels would not allow rooted macrophytes to survive. High manatee density and excessive human recreation (wading) are other possible reasons for plant community changes at Volusia Blue Spring.
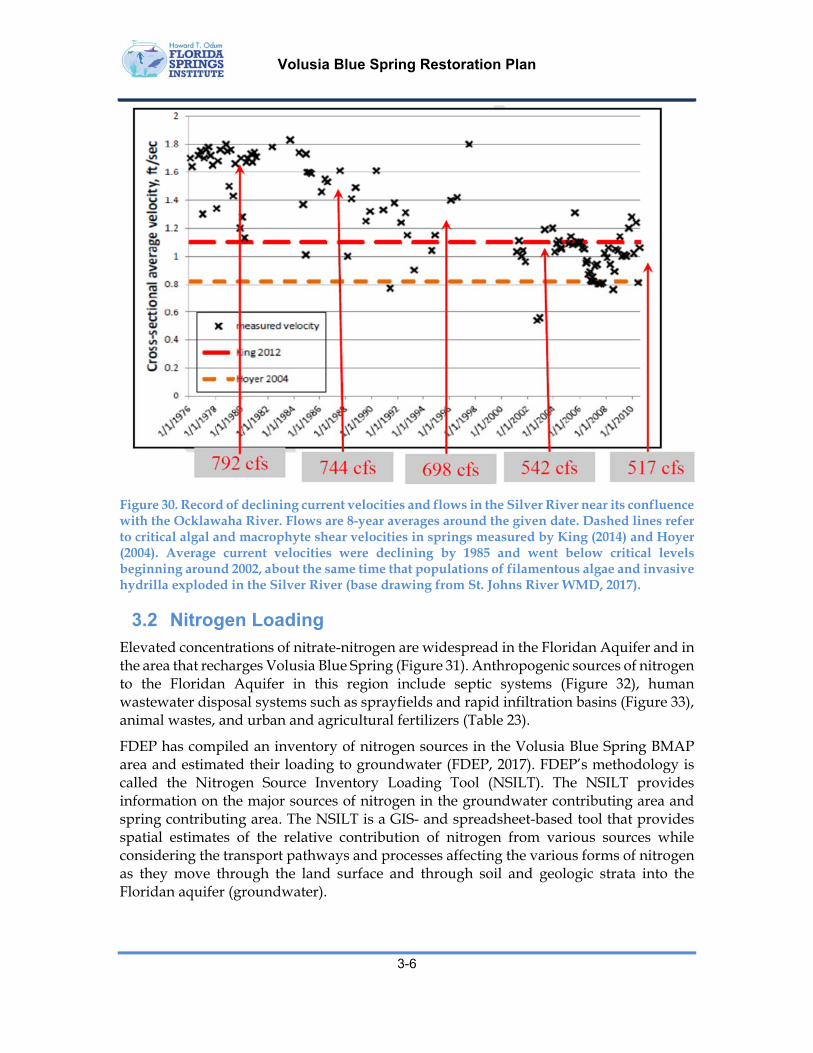
Volusia Blue Spring Restoration Plan
3-6
Figure 30. Record of declining current velocities and flows in the Silver River near its confluence with the Ocklawaha River. Flows are 8-year averages around the given date. Dashed lines refer to critical algal and macrophyte shear velocities in springs measured by King (2014) and Hoyer (2004). Average current velocities were declining by 1985 and went below critical levels beginning around 2002, about the same time that populations of filamentous algae and invasive hydrilla exploded in the Silver River (base drawing from St. Johns River WMD, 2017).
3.2 Nitrogen Loading Elevated concentrations of nitrate-nitrogen are widespread in the Floridan Aquifer and in the area that recharges Volusia Blue Spring (Figure 31). Anthropogenic sources of nitrogen to the Floridan Aquifer in this region include septic systems (Figure 32), human wastewater disposal systems such as sprayfields and rapid infiltration basins (Figure 33), animal wastes, and urban and agricultural fertilizers (Table 23).
FDEP has compiled an inventory of nitrogen sources in the Volusia Blue Spring BMAP area and estimated their loading to groundwater (FDEP, 2017). FDEP’s methodology is called the Nitrogen Source Inventory Loading Tool (NSILT). The NSILT provides information on the major sources of nitrogen in the groundwater contributing area and spring contributing area. The NSILT is a GIS- and spreadsheet-based tool that provides spatial estimates of the relative contribution of nitrogen from various sources while considering the transport pathways and processes affecting the various forms of nitrogen as they move through the land surface and through soil and geologic strata into the Floridan aquifer (groundwater).

Volusia Blue Spring Restoration Plan
3-7
One of the major factors that affects nitrogen loads from the land surface to the groundwater is the recharge rate. Water movement between the shallow groundwater (surficial aquifer) and the deeper aquifer (the UFA) is slowed by a low-permeability layer of clay, silt, and fine sand that forms an intermediate confining unit that is perforated by sinkholes. The rocky layers that partially contain the UFA are prone to dissolving, and over geologic time, the layers develop numerous karst features (sinkholes, caves, and conduits). These features allow water from the land surface to move directly and relatively rapidly into the aquifer.
Figure 31. Groundwater nitrate concentrations measured near Volusia Blue Spring, 2000-2004.

Volusia Blue Spring Restoration Plan
3-8
Table 23. Annual nitrogen fertilizer sales in Volusia and Lake counties (in tons of nitrogen) in 2015-2016 and estimated for the Volusia Springshed (FDACS data).
Recharge rates from the land surface to the Upper Floridan Aquifer are affected by variations in the structure of the surficial aquifer layers, karst features, and average annual rainfall. The St. Johns River WMD estimated the recharge rate ranges and grouped them into four recharge rate categories, which DEP then applied in the NSILT (Escribano et al., 2017):
• Areas of groundwater discharge;
• Low recharge (1 to 5 inches per year [in/yr]);
• Medium recharge (5 to 15 in/yr); and
• High recharge (15 in/yr or greater).
The discharge category includes areas where groundwater from the UFA discharges through springs, seepage into lakes, streams, or wetlands.
A second factor considered in estimating the loading to groundwater in the NSILT is the attenuation of nitrogen as it moves from its source through the environment, before it reaches the UFA. The movement of nitrogen from the land surface to groundwater is controlled by biological and chemical processes that occur as part of the nitrogen cycle, as well as hydrogeological processes (Reddy et al., 2017). Many of these processes attenuate (impede or remove) the amount of nitrogen transported to groundwater. An understanding of how water moves through the subsurface and the processes that transform the different forms of nitrogen is essential for estimating nitrogen loading to groundwater from various sources.
In the NSILT, FDEP applied different attenuation factors to different types of sources, so that various biological, chemical, and hydrogeological effects could be estimated. The attenuation that was applied means that the amount of nitrogen that left a source (such as a livestock operation or a yard that was just fertilized) reduces the amount of nitrogen predicted to reach the aquifer. In the NSILT, the attenuation rates range from 85% (for atmospheric deposition), to 10% (for wastewater disposal in a rapid infiltration basin).
County
Fertilizer Use
w/in County
% County in
Springshed
Est. Fertilizer
Use w/in
Springshed
% of Fertilizer
Load
Volusia 19,791 12.9 2,553.0 97.9
Lake 26,865 0.2 53.7 2.06
Total 46,656 2,607 100
Source: Florida Department of Agriculture and Consumer Services
Period: Fiscal Year 2015‐2016
Fertilizer sold in the county was assumed to be applied in the county based on the proportion
of the county in the Springshed
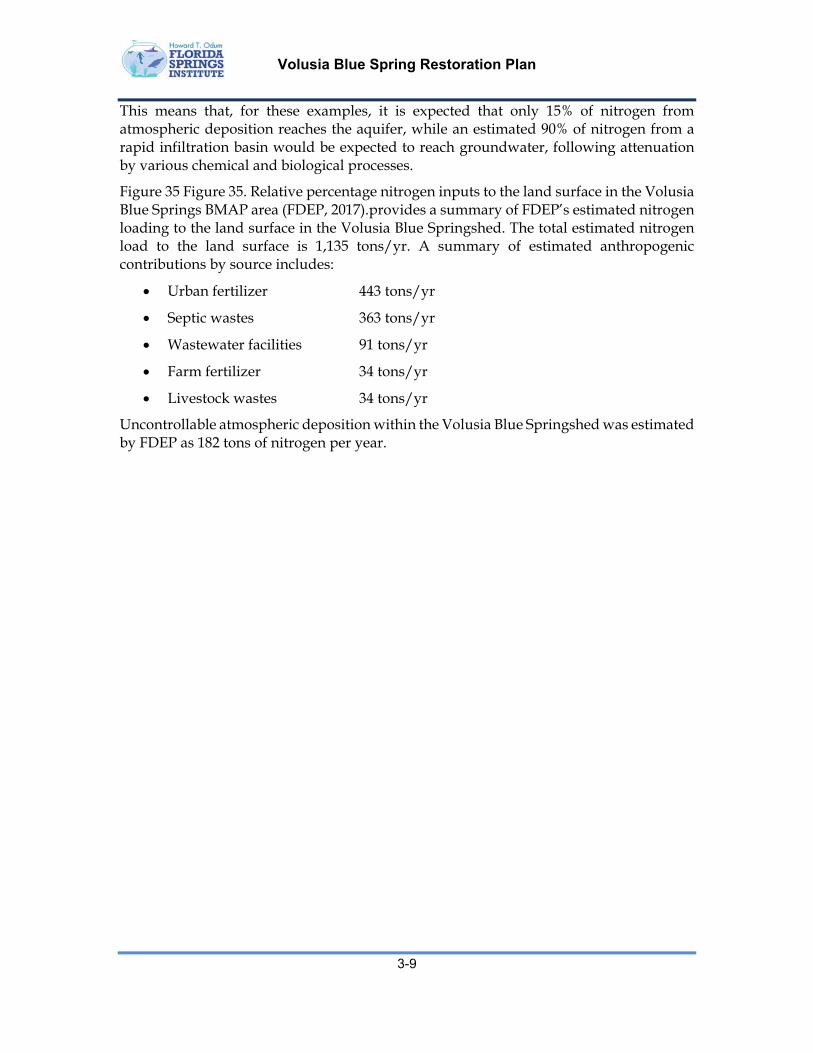
Volusia Blue Spring Restoration Plan
3-9
This means that, for these examples, it is expected that only 15% of nitrogen from atmospheric deposition reaches the aquifer, while an estimated 90% of nitrogen from a rapid infiltration basin would be expected to reach groundwater, following attenuation by various chemical and biological processes.
Figure 35 Figure 35. Relative percentage nitrogen inputs to the land surface in the Volusia Blue Springs BMAP area (FDEP, 2017).provides a summary of FDEP’s estimated nitrogen loading to the land surface in the Volusia Blue Springshed. The total estimated nitrogen load to the land surface is 1,135 tons/yr. A summary of estimated anthropogenic contributions by source includes:
Urban fertilizer 443 tons/yr
Septic wastes 363 tons/yr
Wastewater facilities 91 tons/yr
Farm fertilizer 34 tons/yr
Livestock wastes 34 tons/yr
Uncontrollable atmospheric deposition within the Volusia Blue Springshed was estimated by FDEP as 182 tons of nitrogen per year.
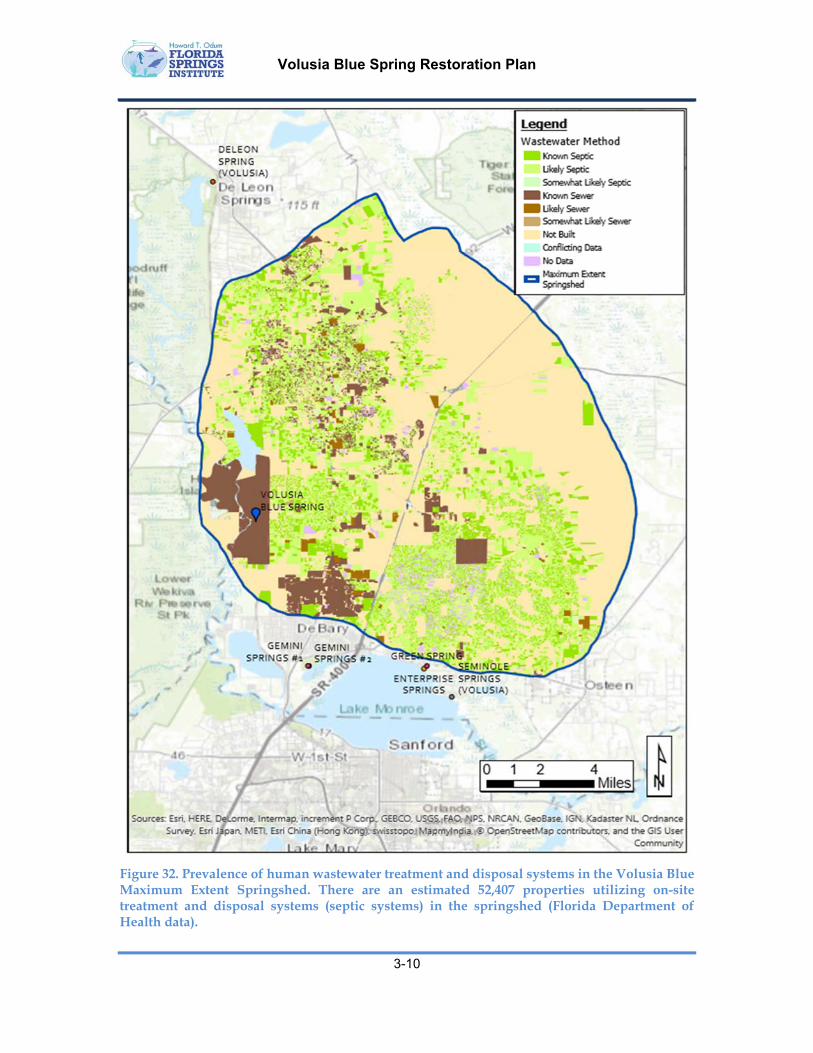
Volusia Blue Spring Restoration Plan
3-10
Figure 32. Prevalence of human wastewater treatment and disposal systems in the Volusia Blue Maximum Extent Springshed. There are an estimated 52,407 properties utilizing on-site treatment and disposal systems (septic systems) in the springshed (Florida Department of Health data).
Volusia Blue Spring Restoration Plan
3-11
Figure 33. Domestic and industrial wastewater facilities in the Volusia Blue Springshed (Holland & Bridger, 2014)
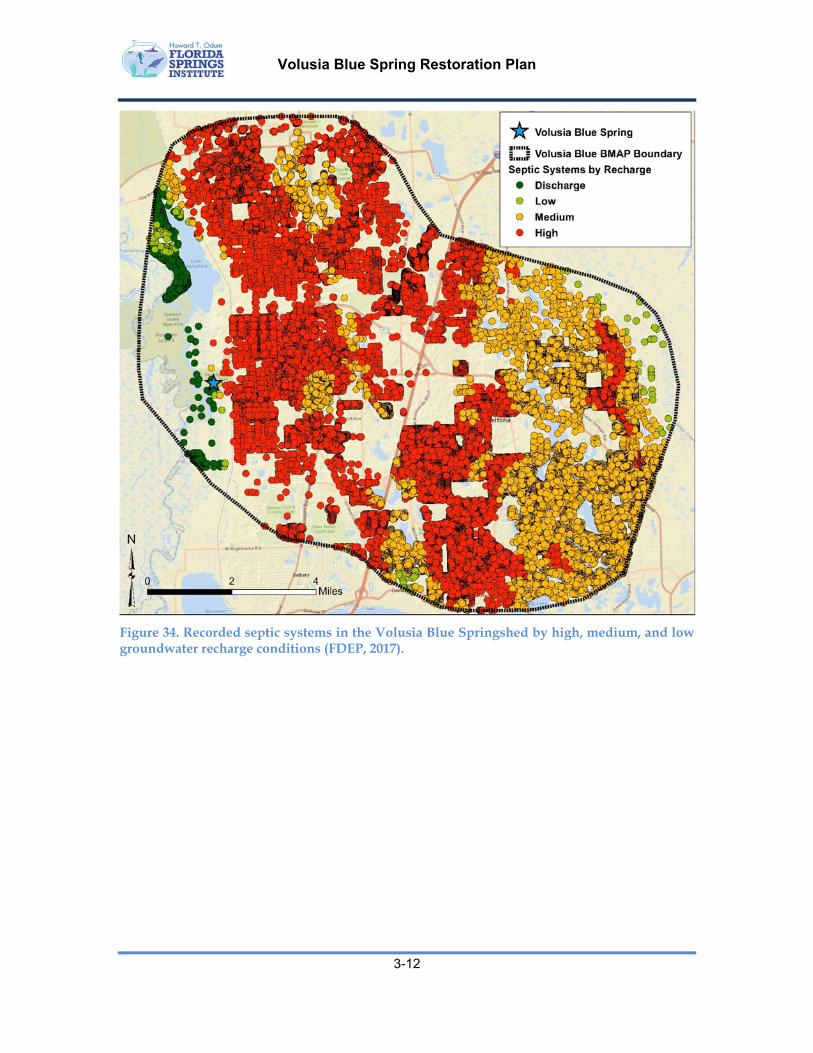
Volusia Blue Spring Restoration Plan
3-12
Figure 34. Recorded septic systems in the Volusia Blue Springshed by high, medium, and low groundwater recharge conditions (FDEP, 2017).
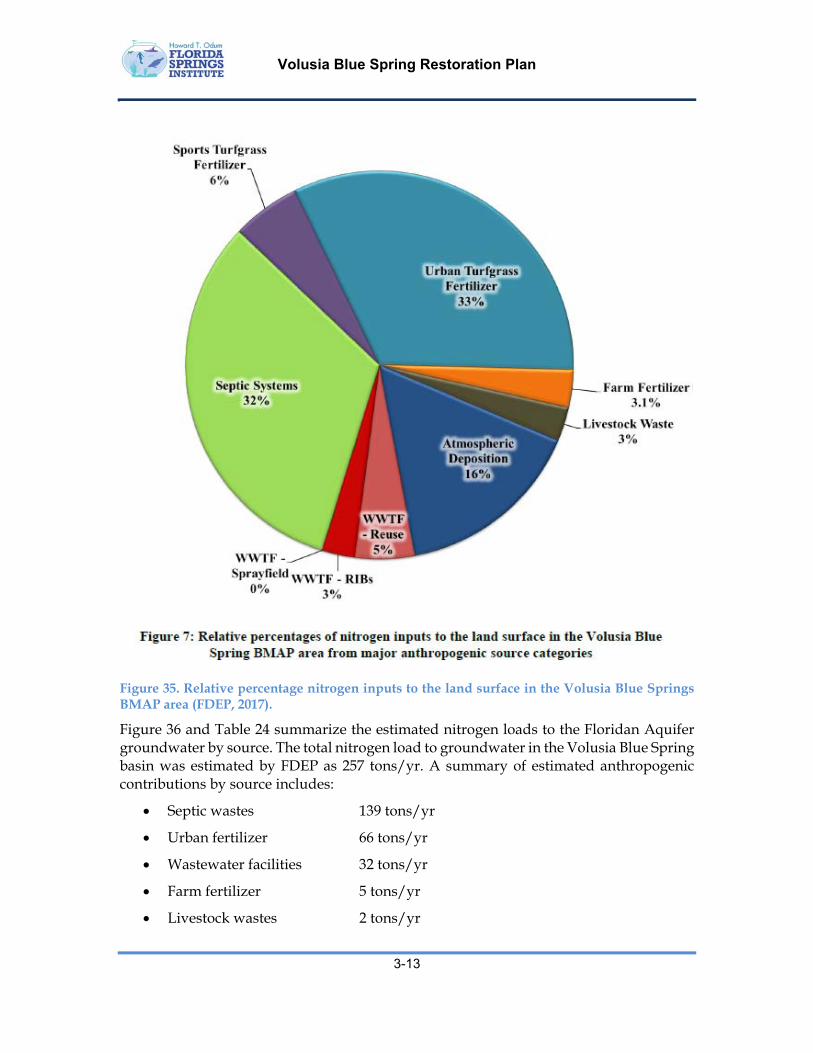
Volusia Blue Spring Restoration Plan
3-13
Figure 35. Relative percentage nitrogen inputs to the land surface in the Volusia Blue Springs BMAP area (FDEP, 2017).
Figure 36 and Table 24 summarize the estimated nitrogen loads to the Floridan Aquifer groundwater by source. The total nitrogen load to groundwater in the Volusia Blue Spring basin was estimated by FDEP as 257 tons/yr. A summary of estimated anthropogenic contributions by source includes:
Septic wastes 139 tons/yr
Urban fertilizer 66 tons/yr
Wastewater facilities 32 tons/yr
Farm fertilizer 5 tons/yr
Livestock wastes 2 tons/yr

Volusia Blue Spring Restoration Plan
3-14
Uncontrollable atmospheric deposition was estimated by FDEP to contribute about 13 tons of nitrogen per year to the Floridan Aquifer under the springshed. FDEP included urban stormwater nitrogen loads in urban turfgrass fertilizer estimates and agricultural stormwater loads in farm fertilizer and livestock loading estimates.
For comparison, the average of annual discharge measurements at Volusia Blue Spring for the period from 2004 to 2013 was 143.2 cfs (92.5 MGD). During this same period the average of annual average nitrate-nitrogen concentrations measured at Volusia Blue Spring was 0.50 mg/L (FDEP, 2014). Based on these data, the estimated average nitrate -nitrogen load discharged from Blue Spring for this period was 70 tons/yr or about 95 tons/yr for total nitrogen. Comparing these values to FDEP’s estimated 257 tons/yr of total nitrogen to the groundwater from all sources indicates that either FDEP overestimated nitrogen loading to the groundwater and/or additional nitrogen attenuation may be occurring within the Floridan Aquifer flow system. This attenuation includes nitrogen removed with groundwater from pumping the aquifer.
In summary, the nitrate-nitrogen concentrations discharging from Volusia Blue Spring are well above the Florida numeric nutrient standard of 0.35 mg/L. FDEP has adopted a nitrate-nitrogen Total Maximum Daily Load (TMDL) requirement of 45% reduction to seasonally achieve the numeric nutrient criterion for nitrate.
Figure 36. Summary of estimated nitrogen load to the Floridan Aquifer within the Volusia Blue Springshed (FDEP, 2017).
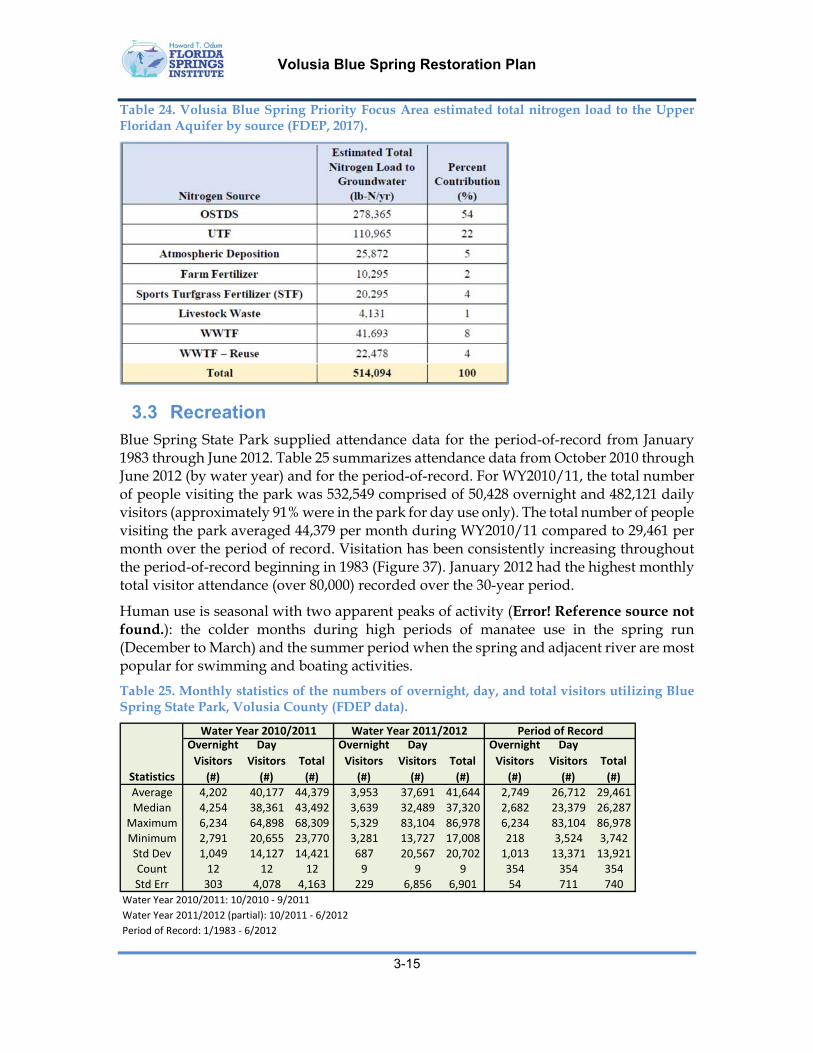
Volusia Blue Spring Restoration Plan
3-15
Table 24. Volusia Blue Spring Priority Focus Area estimated total nitrogen load to the Upper Floridan Aquifer by source (FDEP, 2017).
3.3 Recreation Blue Spring State Park supplied attendance data for the period-of-record from January 1983 through June 2012. Table 25 summarizes attendance data from October 2010 through June 2012 (by water year) and for the period-of-record. For WY2010/11, the total number of people visiting the park was 532,549 comprised of 50,428 overnight and 482,121 daily visitors (approximately 91% were in the park for day use only). The total number of people visiting the park averaged 44,379 per month during WY2010/11 compared to 29,461 per month over the period of record. Visitation has been consistently increasing throughout the period-of-record beginning in 1983 (Figure 37). January 2012 had the highest monthly total visitor attendance (over 80,000) recorded over the 30-year period.
Human use is seasonal with two apparent peaks of activity (Error! Reference source not found.): the colder months during high periods of manatee use in the spring run (December to March) and the summer period when the spring and adjacent river are most popular for swimming and boating activities.
Table 25. Monthly statistics of the numbers of overnight, day, and total visitors utilizing Blue Spring State Park, Volusia County (FDEP data).
Overnight
Visitors
(#)
Day
Visitors
(#)
Total
(#)
Overnight
Visitors
(#)
Day
Visitors
(#)
Total
(#)
Overnight
Visitors
(#)
Day
Visitors
(#)
Total
(#)Average 4,202 40,177 44,379 3,953 37,691 41,644 2,749 26,712 29,461Median 4,254 38,361 43,492 3,639 32,489 37,320 2,682 23,379 26,287
Maximum 6,234 64,898 68,309 5,329 83,104 86,978 6,234 83,104 86,978Minimum 2,791 20,655 23,770 3,281 13,727 17,008 218 3,524 3,742Std Dev 1,049 14,127 14,421 687 20,567 20,702 1,013 13,371 13,921Count 12 12 12 9 9 9 354 354 354Std Err 303 4,078 4,163 229 6,856 6,901 54 711 740
Water Year 2010/2011: 10/2010 ‐ 9/2011
Water Year 2011/2012 (partial): 10/2011 ‐ 6/2012
Period of Record: 1/1983 ‐ 6/2012
Water Year 2010/2011 Period of Record
Statistics
Water Year 2011/2012
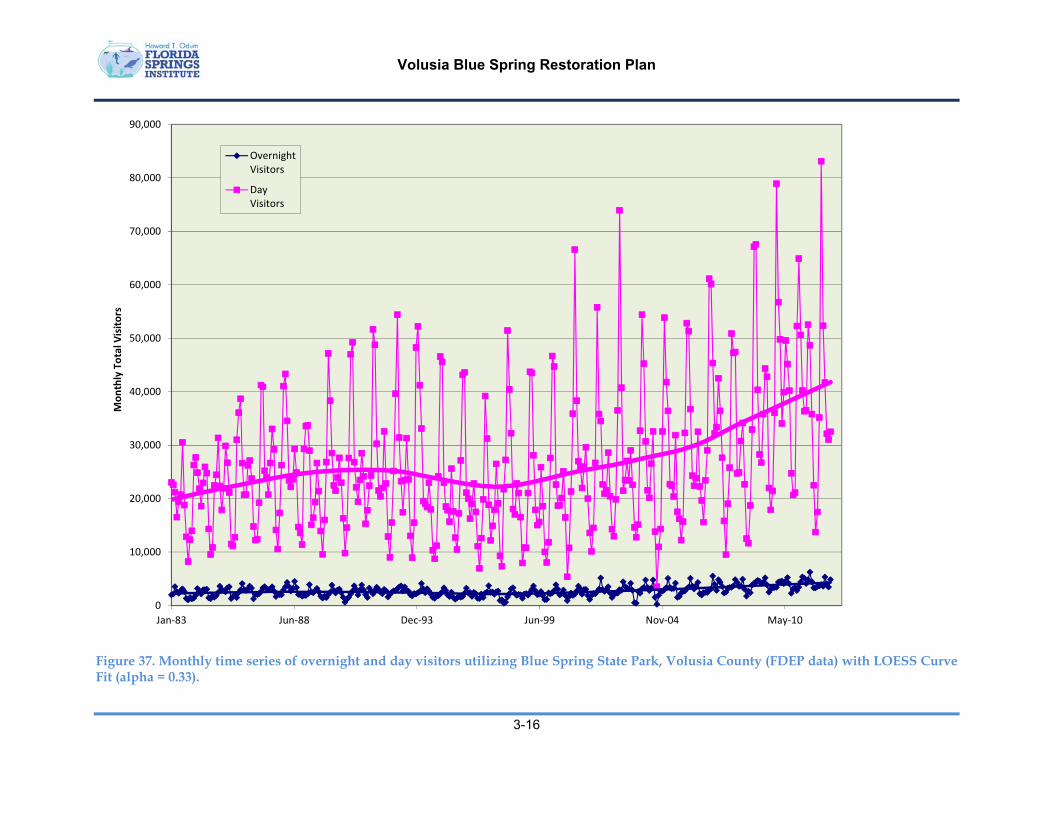
Volusia Blue Spring Restoration Plan
3-16
Figure 37. Monthly time series of overnight and day visitors utilizing Blue Spring State Park, Volusia County (FDEP data) with LOESS Curve Fit (alpha = 0.33).
0
10,000
20,000
30,000
40,000
50,000
60,000
70,000
80,000
90,000
Jan‐83 Jun‐88 Dec‐93 Jun‐99 Nov‐04 May‐10
Monthly Total V
isitors
OvernightVisitors
DayVisitors

Volusia Blue Spring Restoration Plan
3-17
Figure 38. Average Number of Overnight and Daily Visitors to Blue Spring Park, Volusia County (January 1, 1990 - September 4, 2006)
0
500
1000
1500
2000
2500
3000
Jan-1 Feb-20 Apr-11 May-31 Jul-20 Sep-8 Oct-28 Dec-17
Julian Day
Ave
rag
e N
um
ber
of
Vis
ito
rs (
#/d
ay)
Overnight Visitors
Daily Visitors
Volusia Blue Spring Restoration Plan
3-18
Bonn and Bell (2003) prepared a detailed economic assessment of four Florida state parks with major artesian springs. Volusia Blue Spring was one of the systems evaluated by user surveys in late 2002. In fiscal year 2002, there were 337,356 visitors to the park. About 65% of these individuals were estimated to be from outside of Volusia County. These tourists injected money into the local economy in the form of day use fees and food costs as well as in money spent for overnight accommodations. Average daily spending at Blue Spring State Park was $19/person for a total estimated annual spending rate of about $10 million. This level of spending generated an estimated $2.4 million in wages and 174 local jobs. The authors made no quantitative estimates of the relationship between economic impact and spring flows. However, they did conclude that flows have been declining in Blue Spring since the mid-1980’s and that this flow reduction “threatens the future of Blue Spring as a manatee refuge and recreation area” (Bonn and Bell 2003, p. 70). The authors also hypothesized that increased nitrates in the spring discharge “… increase the growth of algae and lead to ecological decline” and stated that recreational visitors to Blue Spring will be deterred due to diminished water quality and appearance of the ecosystem.
Mark Bonn conducted a follow up survey during 2008 at Blue Spring (Bonn & Harrington, 2008). Results from 400 participants substantiate that Blue Spring State Park is a prime destination for people seeking to observe wild manatees. Based upon those comparable questions from the 2003 study, several interesting observations were found. First, average party size increased from 3.3 persons per party in 2003 to 4.0 persons per party during 2008. Also, the categories, “first time visitors” (50.8% in 2008 vs. 38.9% in 2003) and “plan to return” (65.3% in 2008 vs. 35.6% in 2003) both saw increases between 2003 and 2008. Over 31% of all visitors indicated they planned to return within six months, up from 10% in 2003. Another 29% indicated they would return within 12 months, up from 20.6% in 2003. When asked about the main purpose of the visit, “viewing manatees” dropped from 64.8% to 32.3%, although 93% of all visitors indicated they participated in “watching manatees”. Most respondents (58.9%) in 2008 heard about the park from family or friends which represented a large increase from 2003 numbers (18.9%).
A series of questions were asked about the result of increased groundwater pumping in the area and the reduction of flow from Blue Spring. Slight differences in the responses from 2003 and 2008 were observed, but overall the support for protection of flows remained high. A question addressed: “Do you believe it is in the public interest to reduce spring flow in state parks to meet public water supply need?” It was documented that 75.3% answered “no” in 2008, down slightly from 82.4% in 2003. Respondents were also willing to support local government in the development of alternative water sources to protect spring flow at 86.5% in 2008, down slightly from 97% in 2003. When asked if they would be willing to pay more on their monthly utility bill to support alternative water sources rather than reduce flow, 73.5% answered “yes” in 2008, down slightly from 79.5% in 2003.
A series of new questions were added to the 2008 survey designed to gain visitor opinions pertaining to reduced water flow levels and their impact upon the aesthetics, activities, and overall on-site park experience. Because these questions were new, visitor responses to these questions asked in 2008 were not able to be compared to the 2003 study. The first set of questions addressed flow loss. Specifically, visitors indicated as a group average, that a loss of about 10.3% of water flow would be considered significant harm to the aesthetics of the spring. Visitors also similarly indicated that a flow loss of 10.4% would be considered significant harm to swimming

Volusia Blue Spring Restoration Plan
3-19
and diving-related activities. Finally, visitors indicated that an 11.9% loss of water flow would be significant harm to their positive experience visiting the park.
One newly developed category of questions included in the 2008 study asked if responding visitors had been to the park prior to 2003. Most (71.3%) indicated they had not. The study found that 27% of responding visitors had indeed visited the park prior to 2003. Of this 27% of respondents that had visited the park prior to 2003, a series of questions were developed to measure responses of swimmers, divers and walkers to their perceived change in park water quality and water depth.
Of these repeat visitors, when swimmers were asked if water clarity was “better”, “about the same”, or “worse”; equal percentages replied water clarity was either “about the same” or “worse” (40.7%). Among SCUBA divers, the majority (53.8%) indicated that water clarity was “about the same”; while among walkers the majority (41.1%) indicated the water clarity was “worse”. With respect to water depth, 50% of all responding swimmers that had visited the park prior to 2003 indicated that water depth had gotten “worse”. Most SCUBA divers (46.2%) thought water depth was “about the same”, and the majority of walkers (64.8%) indicated water depth had gotten “worse”.
A final question related to “satisfaction with the overall visit to the spring”. Compared with 2003 respondents, overall satisfaction increased to 4.6 in 2008, up from 4.3 in 2003, using a scale of 1-5 with 5 being highest. This indicates that despite critical issues related to the environment, visitors are increasingly more pleased with their on-site experience.
Detailed human-use activity counts were conducted by WSI (2009) on two weekdays at Blue Spring State Park during the warmer season during 2008. Figure 39 and Figure 40 illustrate the observed distribution of human uses on May 23 and June 24, 2008, including water-contact and water-view activities observed in the vicinity of the swimming area. Total human use was observed to be lowest in the morning hours and increased throughout the day, with an apparent maximum between 12:45 and 14:15 on the two days. Water contact activities were generally higher during mid-day. The highest number of people recorded in the swimming area at one time on these two days was 44 individuals. The highest number of people observed during these counts was 147. The predominant water contact activities observed at Blue Spring were: bathing, floating, swimming, and snorkeling. On both occasions water was too deep in the swimming area for wading. The water-viewing activities that had the highest recorded uses on these dates were: standing on the dock, sunbathing, picnicking, and walking on the boardwalks (Figure 41).
Unlike most other spring-themed Florida state parks, Volusia Blue has seasonal and spatial limits on in-water recreational uses. Vegetation trampling and resulting increases in turbidity and reductions in water clarity are evident from the swim dock upstream to the spring boil during the summer, non-manatee season when in-water activities are allowed.

Volusia Blue Spring Restoration Plan
3-20
Figure 39. Blue Spring State Park human use and recreational counts conducted on May 23, 2008 (WSI, 2009).
In the Water Counts
0
5
10
15
20
25
30
35
10:30
11:00
11:30
12:00
12:30
13:00
13:30
14:00
14:30Time of Day
Num
ber of
Peo
ple
Floating
Sw imming
Snorkeling
BathingChest DeepWadingW i t D
Out of the Water Counts
0
10
20
30
40
50
60
10:30
11:00
11:30
12:00
12:30
13:00
13:30
14:00
14:30
Time of Day
Num
ber of
Peo
ple
Under PicnicShelterSunbathing
Walking onBoardw alkStanding onDock
Activity Counts at the Blue Spring State Park Swimming Area on May 23, 2008
0
10
20
30
40
50
60
70
80
90
10:30 10:45 11:00 11:15 11:30 11:45 12:00 12:15 12:30 12:45 13:00 13:15 13:30 13:45 14:00 14:15 14:30
Time of Day
Num
ber of
Peo
ple
Total in the Water Total Out of the Water
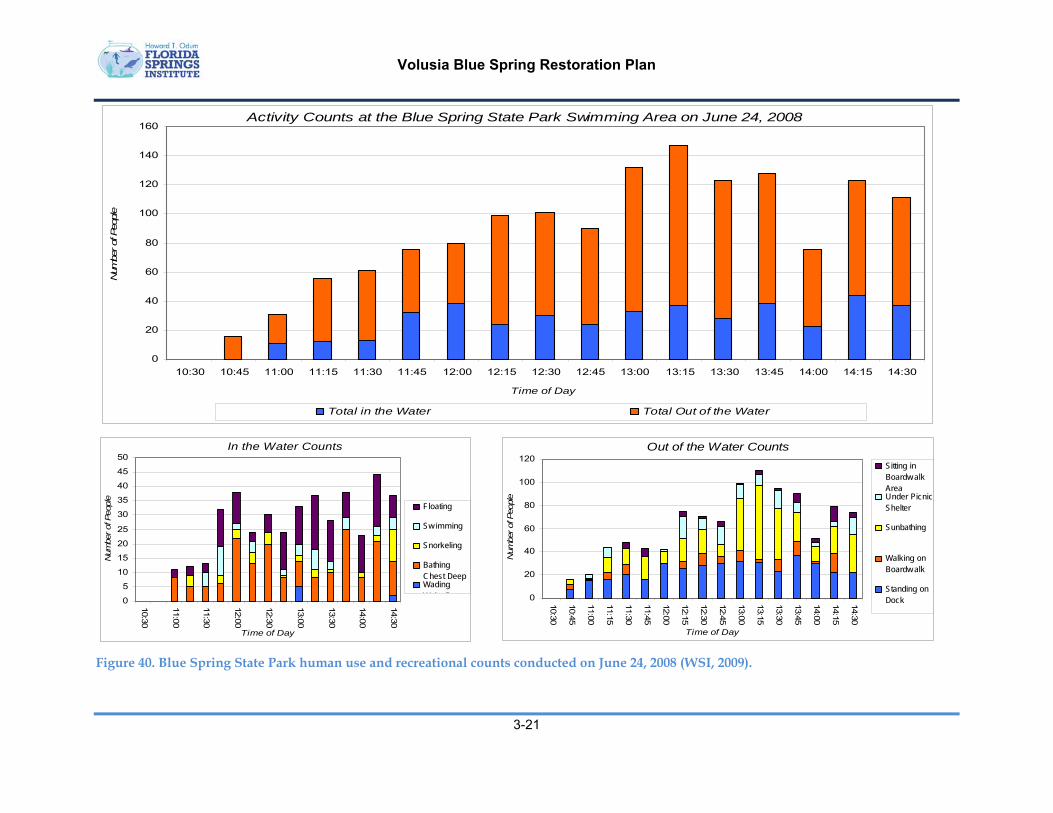
Volusia Blue Spring Restoration Plan
3-21
Figure 40. Blue Spring State Park human use and recreational counts conducted on June 24, 2008 (WSI, 2009).
In the Water Counts
0
5
10
15
20
25
30
35
40
45
50
10:30
11:00
11:30
12:00
12:30
13:00
13:30
14:00
14:30
Time of Day
Num
ber of
Peo
ple
Floating
Sw imming
Snorkeling
BathingChest DeepWadingW i t D
Out of the Water Counts
0
20
40
60
80
100
120
10:30
10:45
11:00
11:15
11:30
11:45
12:00
12:15
12:30
12:45
13:00
13:15
13:30
13:45
14:00
14:15
14:30
Time of Day
Num
ber of
Peo
ple
Sitting inBoardw alkAreaUnder PicnicShelter
Sunbathing
Walking onBoardw alk
Standing onDock
Activity Counts at the Blue Spring State Park Swimming Area on June 24, 2008
0
20
40
60
80
100
120
140
160
10:30 10:45 11:00 11:15 11:30 11:45 12:00 12:15 12:30 12:45 13:00 13:15 13:30 13:45 14:00 14:15 14:30
Time of Day
Num
ber of
Peo
ple
Total in the Water Total Out of the Water
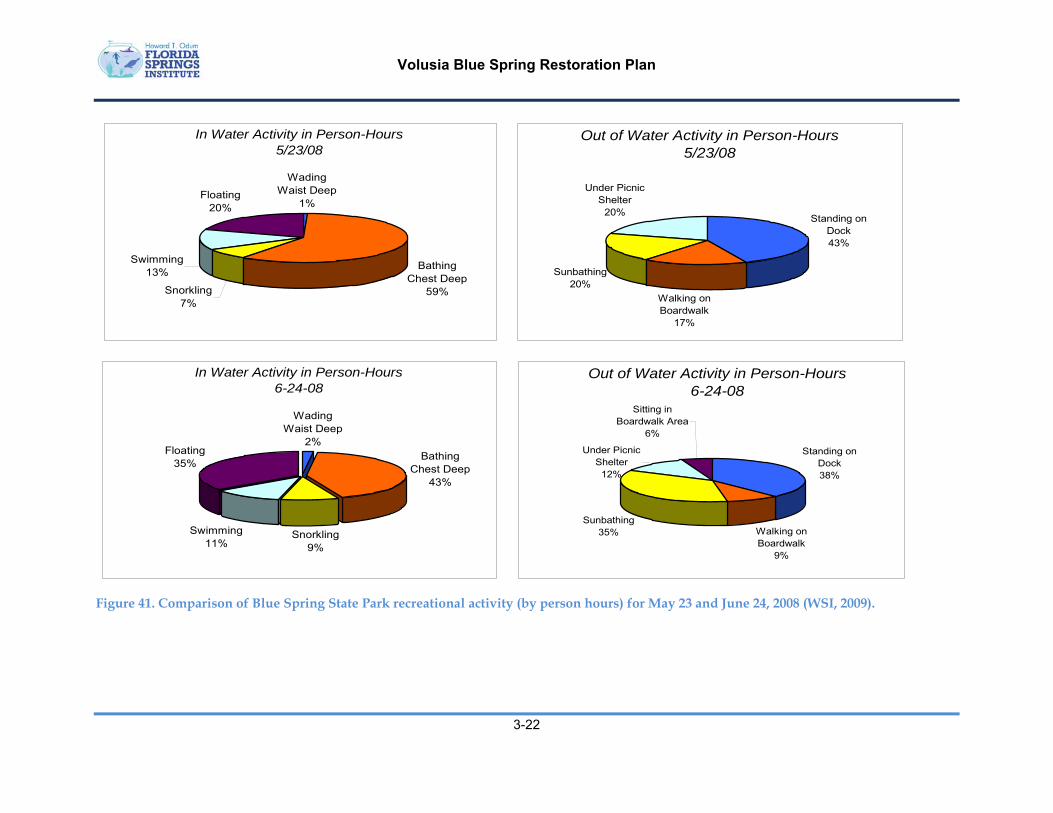
Volusia Blue Spring Restoration Plan
3-22
Figure 41. Comparison of Blue Spring State Park recreational activity (by person hours) for May 23 and June 24, 2008 (WSI, 2009).
In Water Activity in Person-Hours5/23/08
WadingWaist Deep
1%
BathingChest Deep
59%Snorkling7%
Swimming13%
Floating20%
Out of Water Activity in Person-Hours5/23/08
Standing on Dock43%
Walking on Boardwalk
17%
Sunbathing20%
Under Picnic Shelter
20%
In Water Activity in Person-Hours6-24-08
WadingWaist Deep
2%Bathing
Chest Deep43%
Snorkling9%
Swimming11%
Floating35%
Out of Water Activity in Person-Hours6-24-08
Standing on Dock38%
Walking on Boardwalk
9%
Sunbathing35%
Under Picnic Shelter
12%
Sitting in Boardwalk Area
6%

Volusia Blue Spring Restoration Plan
4-1
Section 4.0 Regulatory Programs for Comprehensive Protection and Restoration of Volusia Blue Spring
4.1 Introduction Volusia Blue Spring is protected through existing federal, state, and local ordinances, and designations that are intended to limit or totally prevent ecological impairment. However, as documented by the environmental information collected for this report, piecemeal or lax enforcement of existing regulations has not been successful at halting the continuing decline in the health of Volusia Blue Spring or the Floridan Aquifer it depends on for nourishment. Examination of existing policies, and elimination of their inadequacies and/or lax enforcement of existing laws is necessary to reverse the ongoing decline of ecological health in Volusia Blue Spring.
4.2 Federal and State Water Quality Regulations
4.2.1 DesignatedUsesandWaterQualityStandards
Blue Spring and Hontoon Island State Parks are not within an Area of Critical State Concern as defined in section 380.05, Florida Statutes (FDEP, 2005). Currently they are not under study for such designation. The parks are a component of the Florida Greenways and Trails System. All waters within the units have been designated as Outstanding Florida Waters, pursuant to Chapter 62-302 Florida Administrative Code. Surface waters in Blue Spring State Park are also classified as Class III waters by FDEP with the following designated uses: “recreation, propagation and maintenance of a healthy, well-balanced population of fish and wildlife.” Blue Spring State Park is within the Wekiva River Aquatic Preserve as designated under the Florida Aquatic Preserve Act of 1975 (Section 258.35, Florida Statutes).
Florida surface water quality standards and criteria are described in Chapter 62-302 of the Florida Administrative Register and Administrative Code. In 1998, the EPA issued a strategy requesting each state to develop a plan for adopting Numeric Nutrient Criteria (NNC), in addition to already established numeric criteria for other parameters (e.g., dissolved oxygen, pH, temperature, bacteria, metals, pesticides, and other organic chemicals). Florida also adopted statewide numeric nitrogen and phosphorus criteria for springs and rivers. (F.A.C. Rules 62-302.531 and 62-302.532). In addition to numeric criteria, there are also narrative criteria such as the prohibition of discharging toxic materials in toxic amounts.
Under Section 303(d) of the Clean Water Act, states are required to compile a list of impaired waters and submit that list to EPA for approval. Impaired waters do not meet applicable state water quality standards, i.e., do not support their designated use(s). The Florida Watershed Restoration Act (FWRA; Section 403.067(4), Florida Statutes) requires the listing of all impaired waters. These waters are scheduled for development of a Total Maximum Daily Load (TMDL) for each regulated pollutant that exceeds standards. The TMDL provides a regulatory pollutant reduction goal that can be implemented to restore the designated use of the water.
Volusia Blue Spring Restoration Plan
4-2
4.2.2 AntidegradationPolicy
Florida’s Antidegradation Policy, effective July 17, 2013, is found in F.A.C. Rule 62-302.300. Antidegradation policies protect the level of water quality necessary to maintain the existing uses.
4.2.3 NationalPollutantDischargeEliminationSystem(NPDES)
As authorized by the Clean Water Act, the NPDES permit program regulates point sources that discharge pollutants into waters of the United States. NPDES permits are required for operation and sometimes construction associated with domestic or industrial wastewater facilities or activities (e.g., wastewater treatment facilities, mines, etc.). Florida has delegated administration authority of the NPDES permit program.
4.2.4 GroundwaterRegulations
Existing laws at both the federal and state levels protect groundwater quantity and quality. The U.S. Environmental Protection Agency (EPA) is responsible for groundwater protection through the Safe Drinking Water Act, which requires maximum contaminant level standards for drinking water. The Safe Drinking Water Act established the Underground Injection Control, Wellhead Protection, and Source Water Protection Programs, which are administered by FDEP (Aquifer Protection Program) in Florida. The Federal Insecticide, Fungicide, and Rodenticide Act (FIFRA) authorizes EPA to control the availability of potentially harmful pesticides. The Toxic Substances Control Act (TSCA) authorizes EPA to control toxic chemicals that could pose a threat to the public and contaminate groundwater. The Surface Mining Control and Reclamation Act (SMCRA), regulates mining activities, some of which can negatively impact groundwater.
In addition to the Aquifer Protection Program, FDEP has a Ground Water Management Program that is responsible for evaluating and addressing groundwater resources that adversely affect surface water quality as part of Florida’s Watershed Restoration Program. This program conducts groundwater – surface water interaction assessments, restoration of springs and implementation of best management practices for agrichemical effects on water quality.
4.2.5 ImpairedWaters,TMDLsandBMAPs
4.2.5.1 FloridaImpairedWatersandTMDLs
To meet Clean Water Act and FWRA requirements, Florida’s watersheds, as defined by FDEP, have been divided into five groups based on geography. Each group undergoes a cycle of five phases on a rotating schedule. Phases 1 and 2 entail preliminary water quality assessments and strategic monitoring to verify detected impairments. Phase 3 addresses the development and adoption of TMDLs for waters verified as impaired in Phase 2. In Phases 4 and 5, a Basin Management Action Plan (BMAP) is developed and implemented to achieve the TMDL. Each phase is scheduled to take about a year (FDEP, 2017).
For assessment purposes, FDEP has divided the Middle St Johns River Basin into water assessment polygons with a unique waterbody identification (WBID) number for each watershed or stream reach. Blue Spring and Blue Spring Run are WBIDs 28933 and 28933A, respectively. FDEP verified Volusia Blue Spring and Blue Spring Run as impaired for nutrients (algal mats) and included Blue Spring and Blue Spring Run on the Verified List of impaired waters for the Middle St. Johns River Basin adopted by Secretarial Order on May 19, 2009. Algal mats can
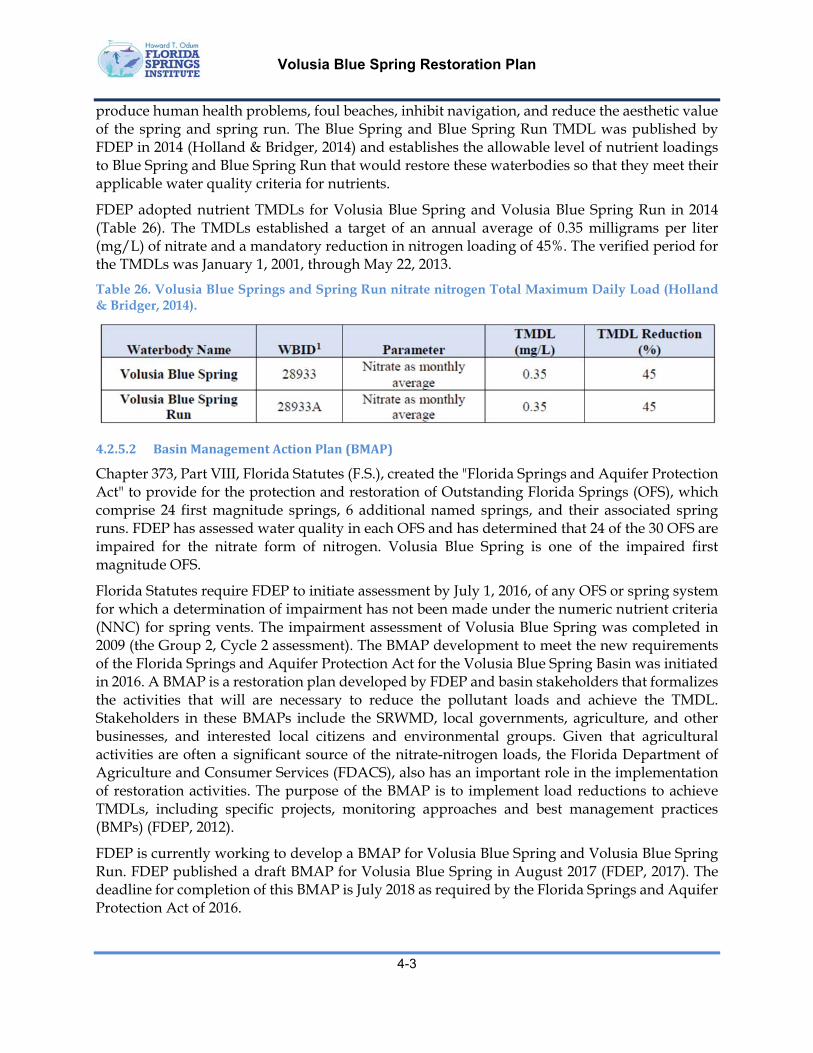
Volusia Blue Spring Restoration Plan
4-3
produce human health problems, foul beaches, inhibit navigation, and reduce the aesthetic value of the spring and spring run. The Blue Spring and Blue Spring Run TMDL was published by FDEP in 2014 (Holland & Bridger, 2014) and establishes the allowable level of nutrient loadings to Blue Spring and Blue Spring Run that would restore these waterbodies so that they meet their applicable water quality criteria for nutrients.
FDEP adopted nutrient TMDLs for Volusia Blue Spring and Volusia Blue Spring Run in 2014 (Table 26). The TMDLs established a target of an annual average of 0.35 milligrams per liter (mg/L) of nitrate and a mandatory reduction in nitrogen loading of 45%. The verified period for the TMDLs was January 1, 2001, through May 22, 2013.
Table 26. Volusia Blue Springs and Spring Run nitrate nitrogen Total Maximum Daily Load (Holland & Bridger, 2014).
4.2.5.2 BasinManagementActionPlan(BMAP)
Chapter 373, Part VIII, Florida Statutes (F.S.), created the "Florida Springs and Aquifer Protection Act" to provide for the protection and restoration of Outstanding Florida Springs (OFS), which comprise 24 first magnitude springs, 6 additional named springs, and their associated spring runs. FDEP has assessed water quality in each OFS and has determined that 24 of the 30 OFS are impaired for the nitrate form of nitrogen. Volusia Blue Spring is one of the impaired first magnitude OFS.
Florida Statutes require FDEP to initiate assessment by July 1, 2016, of any OFS or spring system for which a determination of impairment has not been made under the numeric nutrient criteria (NNC) for spring vents. The impairment assessment of Volusia Blue Spring was completed in 2009 (the Group 2, Cycle 2 assessment). The BMAP development to meet the new requirements of the Florida Springs and Aquifer Protection Act for the Volusia Blue Spring Basin was initiated in 2016. A BMAP is a restoration plan developed by FDEP and basin stakeholders that formalizes the activities that will are necessary to reduce the pollutant loads and achieve the TMDL. Stakeholders in these BMAPs include the SRWMD, local governments, agriculture, and other businesses, and interested local citizens and environmental groups. Given that agricultural activities are often a significant source of the nitrate-nitrogen loads, the Florida Department of Agriculture and Consumer Services (FDACS), also has an important role in the implementation of restoration activities. The purpose of the BMAP is to implement load reductions to achieve TMDLs, including specific projects, monitoring approaches and best management practices (BMPs) (FDEP, 2012).
FDEP is currently working to develop a BMAP for Volusia Blue Spring and Volusia Blue Spring Run. FDEP published a draft BMAP for Volusia Blue Spring in August 2017 (FDEP, 2017). The deadline for completion of this BMAP is July 2018 as required by the Florida Springs and Aquifer Protection Act of 2016.

Volusia Blue Spring Restoration Plan
4-4
The draft Volusia Blue Spring BMAP (FDEP, 2017) provides for a phased implementation schedule (5-, 10-, and 15-year targets) designed to achieve incremental reductions within the first 15 years, while simultaneously monitoring and conducting studies to better understand the water quality dynamics in the basin. Among other provisions, Section 403.067(7), F.S., specifies that a BMAP must include numerous components. Examples include the following:
• Integrate appropriate management strategies through existing water quality protection programs to achieve TMDLs;
• Provide phased implementation of the management strategies to promote timely, cost-effective actions;
• Establish a schedule implementing the management strategies;
• Establish a basis for evaluating the plan's effectiveness;
• Identify feasible funding strategies for implementing the management strategies; and
• Equitably allocate pollutant reductions to individual basins, as a whole to all basins, or to each identified point source or category of nonpoint sources, as appropriate.
The Florida Springs and Aquifer Protection Act further specifies that a BMAP for an OFS must include the following provisions:
• Identification and estimated pollutant load within the PFA of each point source or category of nonpoint sources, including but not limited to, urban turf fertilizer, sports turf fertilizer, agricultural fertilizer, onsite sewage treatment and disposal systems (OSTDS) (also referred to as "septic systems"; the terms are used interchangeably throughout this document), wastewater treatment facilities (WWTFs), animal wastes, and stormwater facilities;
• A list of all specific projects and programs identified to implement a nutrient TMDL;
• The delineation of priority focus areas (PFAs);
• An OSTDS remediation plan if DEP identifies OSTDS as contributors of at least 20 % of the nonpoint source nitrogen pollution within a PFA, or if DEP determines remediation is necessary to achieve a TMDL;
• A list of all specific projects identified in an OSTDS remediation plan;
• A priority rank, planning-level cost estimate, estimated completion date, and estimated nutrient load reduction for each listed project;
• The source and amount of financial assistance to be made available by DEP, a water management district (WMD), or other entity for each listed project; and
• A description of best management practices (BMPs) adopted by rule.
FDEP’s proposed Volusia Blue Spring BMAP area (Figure 42) is 107.9 square miles in size and encompasses portions of five cities in Volusia County (City of Debary, City of DeLand, City of Deltona, City of Lake Helen, and City of Orange City). The BMAP area is also FDEP’s approximation of the Volusia Blue Spring groundwater contributing area (or springshed). The springshed, an area of land that contributes water to a spring or group of springs mainly via
Volusia Blue Spring Restoration Plan
4-5
groundwater flow, was delineated by the St. Johns River WMD based on USGS potentiometric surface contour maps.
In compliance with the Florida Springs and Aquifer Protection Act, the draft Volusia Blue Spring BMAP delineates a PFA. A PFA is defined in the Florida Springs and Aquifer Protection Act as the area(s) of a basin where the Floridan aquifer is generally most vulnerable to pollutant inputs and where there is a known connectivity between groundwater pathways and an OFS. The PFA provides a guide for focusing strategies where science suggests these efforts will best benefit the spring.
Nitrogen sources are more likely to travel to a groundwater system under certain conditions. For example, where soils are sandy and well drained, less nitrogen is converted to gas and released into the atmosphere or taken up by plants, compared with other soil types. Therefore, local soil types play a role in how much nitrogen travels from the land surface to groundwater in a specific springshed. Also, geologic features such as a porous limestone layer (also called a "karst feature") allow surface water to more easily travel into deeper aquifers, compared with areas where geologic features create a thick barrier to water movement downward. These types of features, and others, were considered in the delineation of the Volusia Blue Spring PFA.
The FDEP PFA boundary shown in Figure 42 was developed by overlaying geographic information system (GIS) coverages of groundwater recharge rates, aquifer vulnerability, soil types, conservation lands, and potential nitrogen source information. The PFA boundary includes the City of Orange City and portions of Volusia County, the City of DeLand, City of Debary, and City of Deltona.
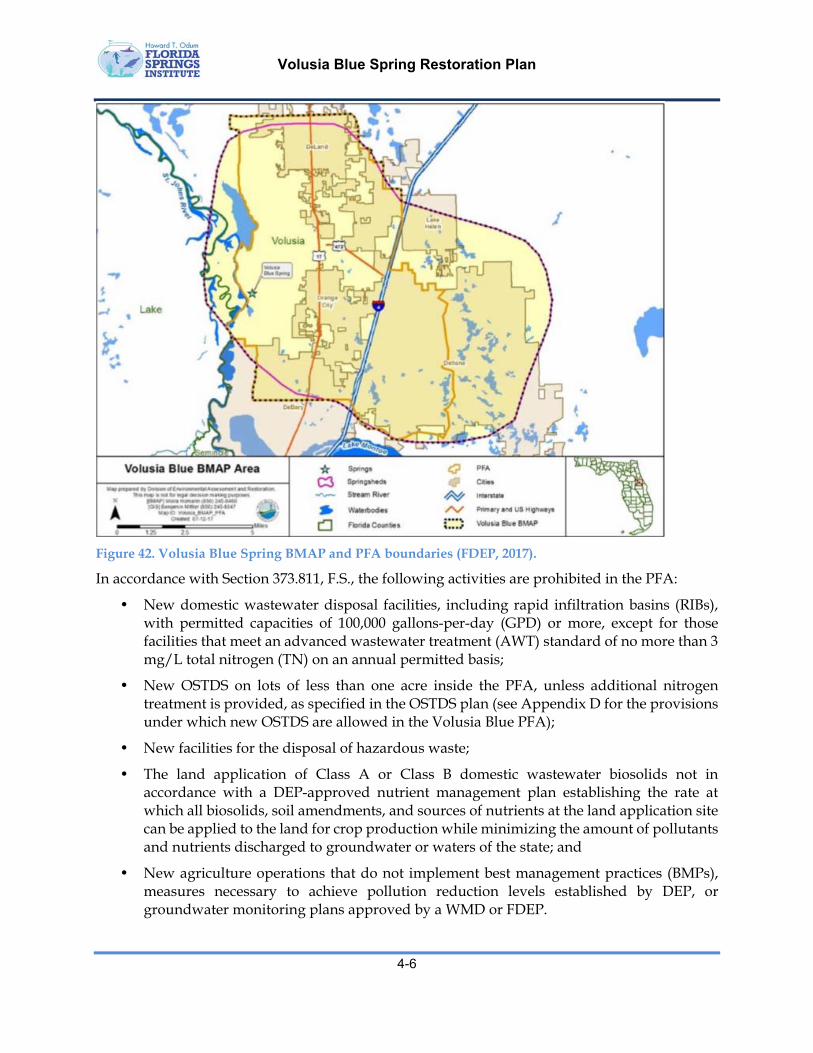
Volusia Blue Spring Restoration Plan
4-6
Figure 42. Volusia Blue Spring BMAP and PFA boundaries (FDEP, 2017).
In accordance with Section 373.811, F.S., the following activities are prohibited in the PFA:
• New domestic wastewater disposal facilities, including rapid infiltration basins (RIBs), with permitted capacities of 100,000 gallons-per-day (GPD) or more, except for those facilities that meet an advanced wastewater treatment (AWT) standard of no more than 3 mg/L total nitrogen (TN) on an annual permitted basis;
• New OSTDS on lots of less than one acre inside the PFA, unless additional nitrogen treatment is provided, as specified in the OSTDS plan (see Appendix D for the provisions under which new OSTDS are allowed in the Volusia Blue PFA);
• New facilities for the disposal of hazardous waste;
• The land application of Class A or Class B domestic wastewater biosolids not in accordance with a DEP-approved nutrient management plan establishing the rate at which all biosolids, soil amendments, and sources of nutrients at the land application site can be applied to the land for crop production while minimizing the amount of pollutants and nutrients discharged to groundwater or waters of the state; and
• New agriculture operations that do not implement best management practices (BMPs), measures necessary to achieve pollution reduction levels established by DEP, or groundwater monitoring plans approved by a WMD or FDEP.
Volusia Blue Spring Restoration Plan
4-7
In addition, to meet the TMDL in accordance with Section 303.807, F.S., the draft Volusia Blue Spring BMAP provides the following additional limitations for OSTDS:
• Issuance of repair or modification permits for OSTDS on lots of less than one acre inside the PFA, unless enhancement features are added to meet or exceed Florida Department of Health (FDOH) NSF245 nitrogen treatment levels, or if a sewer hook-up will occur within five years.
FDEP determined that septic systems represent 54 % of the estimated nitrogen loading to groundwater, urban turfgrass fertilizer (UTF) 22 %, and wastewater treatment facilities (WWTFs) 12 % of the total loading based on the NSILT. The total nitrogen load reduction to the Floridan Aquifer required to meet the TMDL is 48,743 pounds of nitrogen per year (lbs-N/yr). To measure progress towards achieving the necessary load reductions, FDEP has established the following milestones:
• 14,623 lbs-N/yr (30 %) within 5 years;
• 24,371 lbs-N/yr (50 %) within 10 years;
• 9,749 lbs-N/yr (20 %) within 15 years; and
• Total of 48,743 lbs-N/yr within 20 years.
It should be noted that these required reductions are at the aquifer and are much lower than what is required at the land surface. The draft BMAP as currently written does not recognize this disconnect and all project nitrogen load reduction estimates are calculated for the land surface and not at the point of entry to the aquifer.
For example, the draft BMAP includes 37 stakeholder projects to improve water quality, of which 17 projects have estimated load reductions. Included are wastewater facility upgrades and projects to reduce urban turfgrass fertilizer application. The 37 projects are estimated to achieve a reduction of 47,745 lbs-N/yr. FDEP estimates the balance needed for compliance at only 997 lbs-N/yr to be achieved. In fact, based on the NSILT evaluation of nitrogen loads to the land surface of 2,270,000 lbs-N/yr, the required load reduction of 45% is equal to 1,021,500 lbs-N/yr, leaving a balance of 973,755 lbs-N/yr required for compliance.
The draft BMAP does not comply with the letter of the law and is inadequate to achieve the Blue Spring TMDL in a timely fashion. In spite of the fact that FDEP estimated that 55% of the nitrogen load is from septic systems, there are no projects listed in the BMAP that address this issue.
4.3 Water Withdrawals The St. Johns River WMD regulates all water uses within its boundaries pursuant to the provisions of Chapter 373, F.S. and consistent with Chapter 62-40, F.A.C. A consumptive use permit (CUP) is required prior to the withdrawal or diversion of water (typically more than 100,000 gallons per day) for any water use except those expressly exempted by law or District rule. Individual residential water wells, exempted from the permitting process, are required to be permitted during installation, tested for contamination, and permitted for abandonment. Reporting requirements and withdrawal capacities for each permit type are outlined below and in Chapter 40C-2, F.A.C.
Volusia Blue Spring Restoration Plan
4-8
4.3.1 GeneralWaterUsePermit
A general water use permit is needed in the St. Johns River WMD to use, withdraw, or divert water to irrigate agricultural crops, nursery plants, cemeteries, golf courses and recreational areas such as playgrounds, football, baseball, and soccer fields, provided the irrigation does not occur between the hours of 10:00 a.m. and 4:00 p.m. daily, and provided the amount of water used is limited to only that necessary for efficient utilization. Such water use shall be subject to several exceptions as detailed in Chapter 40C-2.042, F.A.C.
4.3.2 IndividualWaterUsePermit
An individual water use permit is required for most withdrawals exceeding 100,000 GPD and any well greater than six inches in diameter as per Chapter 40C-2.041, F.A.C.
4.3.3 ObtainingaWaterUsePermit
A permit applicant must meet three conditions to receive a consumptive use permit, as per Section 373.223, F.S. The use must be a reasonable-beneficial use, which is defined as "the use of water in such quantity as is necessary for economic and efficient utilization for a purpose and in a manner which is both reasonable and consistent with the public interest”. Second, the use must not cause harm to other users. Finally, the use must be consistent with the public interest. Fla. Stat. § 373.223(1) (1995). The Florida Water Resources Act of 1972 specifies that FDEP create a state water use plan which includes policies related to water supply, water quality, flood protection, and regional supply plans. Fla. Stat. § 373.036(1). The St. Johns River WMD is required by Chapter 373, F.S., to assess water supplies every five years to determine if natural systems will be able to maintain a healthy condition and supply demands for water.
Exemptions from the water permitting process include domestic uses as defined in Section 373.019(6), F.S., water used strictly for firefighting, withdrawals made for dewatering activities for a total period not to exceed 180 consecutive days, withdrawal from artificial retention structures for structure repair, and groundwater remediation authorized by FDEP.
4.3.4 MinimumFlowsandLevels(MFLs)andPermitting
The St. Johns River WMD establishes Minimum Flows and Levels (MFLs) for lakes, wetlands, streams, and springs. The minimum flow for a surface water course defines the limit at which further water withdrawals would be significantly harmful to the water resources or ecology of the area. MFLs shall be determined using the best available information and shall also consider non-consumptive uses of water. Fla. Stat. § 373.042.
The St. Johns River WMD adopted a MFL for Volusia Blue Spring in 2006, following many years of analyses. Data analysis indicated that Blue Spring flows were below the point of significant harm to critical water and human use values, and the resulting MFL includes a recovery strategy to restore average flows to protective levels.
Figure 43 summarizes the existing and restored flow and stage data for Blue Spring and Blue Spring Run in the form of probability distributions. Use of this figure allows estimation of flow and stage at any probability based on the existing period-of-record (about 74 years). The initial recommended Blue Spring minimum flow distribution (middle curve, Figure 43) was 24 cfs less than the existing flow (top curve, Figure 43). This was an assumed probability distribution of flows under the recommended Blue Spring MFL allowed through March 2009 and illustrates
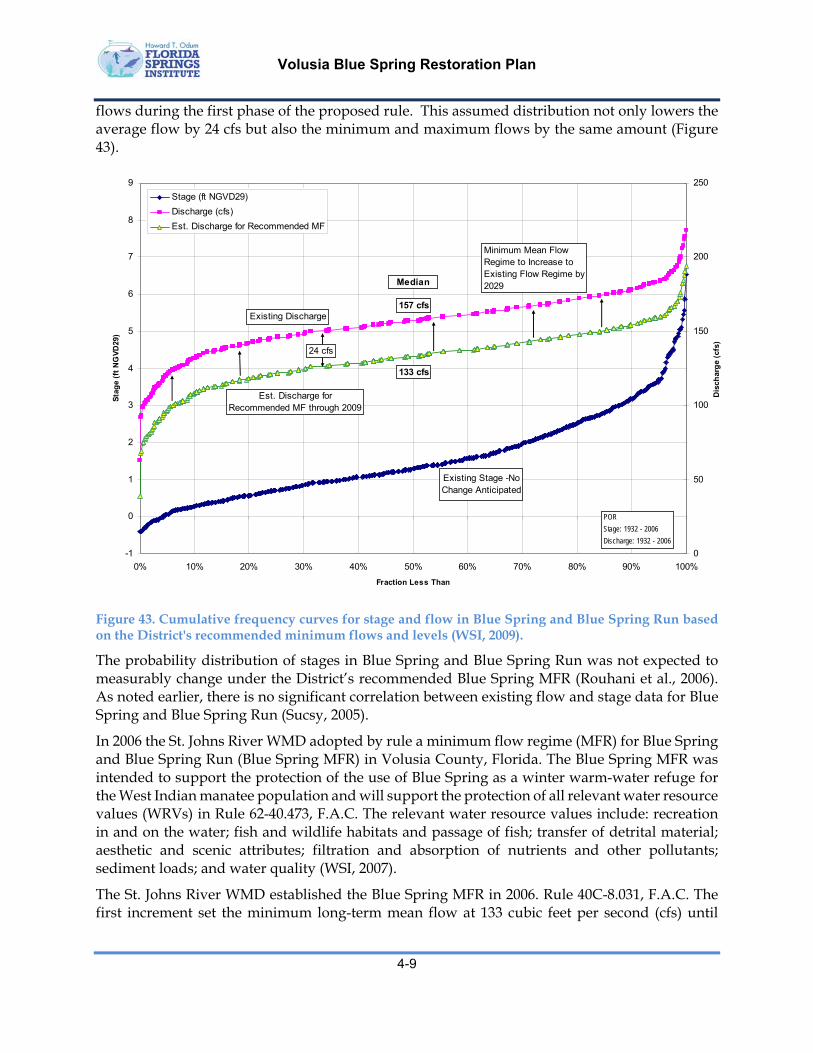
Volusia Blue Spring Restoration Plan
4-9
flows during the first phase of the proposed rule. This assumed distribution not only lowers the average flow by 24 cfs but also the minimum and maximum flows by the same amount (Figure 43).
Figure 43. Cumulative frequency curves for stage and flow in Blue Spring and Blue Spring Run based on the District's recommended minimum flows and levels (WSI, 2009).
The probability distribution of stages in Blue Spring and Blue Spring Run was not expected to measurably change under the District’s recommended Blue Spring MFR (Rouhani et al., 2006). As noted earlier, there is no significant correlation between existing flow and stage data for Blue Spring and Blue Spring Run (Sucsy, 2005).
In 2006 the St. Johns River WMD adopted by rule a minimum flow regime (MFR) for Blue Spring and Blue Spring Run (Blue Spring MFR) in Volusia County, Florida. The Blue Spring MFR was intended to support the protection of the use of Blue Spring as a winter warm-water refuge for the West Indian manatee population and will support the protection of all relevant water resource values (WRVs) in Rule 62-40.473, F.A.C. The relevant water resource values include: recreation in and on the water; fish and wildlife habitats and passage of fish; transfer of detrital material; aesthetic and scenic attributes; filtration and absorption of nutrients and other pollutants; sediment loads; and water quality (WSI, 2007).
The St. Johns River WMD established the Blue Spring MFR in 2006. Rule 40C-8.031, F.A.C. The first increment set the minimum long-term mean flow at 133 cubic feet per second (cfs) until
-1
0
1
2
3
4
5
6
7
8
9
0% 10% 20% 30% 40% 50% 60% 70% 80% 90% 100%
Fraction Less Than
Sta
ge
(ft
NG
VD
29)
0
50
100
150
200
250
Dis
char
ge
(cfs
)
Stage (ft NGVD29)
Discharge (cfs)
Est. Discharge for Recommended MF
PORStage: 1932 - 2006Discharge: 1932 - 2006
Existing Discharge
Est. Discharge forRecommended MF through 2009
24 cfs
Existing Stage -No Change Anticipated
Minimum Mean Flow Regime to Increase to Existing Flow Regime by 2029Median
157 cfs
133 cfs
Volusia Blue Spring Restoration Plan
4-10
March 31, 2009. This minimum long-term mean flow then increases during each of four subsequent 5-year intervals to the following:
• April 1, 2009 through March 31, 2014 – 137 cfs;
• April 1, 2014 through March 31, 2019 – 142 cfs;
• April 1, 2019 through March 31, 2024 – 148 cfs; and
• After March 31, 2024 – 157 cfs.
The Blue Spring Minimum Flow Regime Action Plan (Action Plan) was designed to adaptively manage the implementation of the Blue Spring MFR in combination with environmental monitoring to ensure that the Blue Spring MFR protects the springs WRVs and unique flora and fauna. The Action Plan directed that a detailed Monitoring Plan be developed that encompasses all phases of the physical, chemical, and ecological data monitoring and analysis required for the periodic evaluation of the Blue Spring MFR. Descriptions of the monitoring components, including sampling methods, standard operating procedures, sampling stations, sampling frequency, responsible parties, and database management, were previously described in the Blue Spring MFR Monitoring Plan (WSI, 2007).
The approved Blue Spring Monitoring Plan included a detailed program of environmental and ecological data collection at Blue Spring over a period of 18 years, corresponding to the Year 2024 compliance schedule. This plan included a repeating cycle of one year of intensive sampling followed by four years with reduced monitoring activities. A consolidated report was required at the end of each five-year monitoring interval (SJRWMD, 2010). The first year (Year 1) of intensive Blue Spring WRV Monitoring occurred during Water Year (WY) 2007/08 (SJRWMD, 2010) followed by two years of reduced monitoring, WY 2008/09 - Year 2 (WSI, 2010) and WY 2009/10 – Year 3 (WSI, 2012). The St. Johns River WMD diverged from the Action Plan in 2013 (SJRWMD, 2012) and has conducted limited monitoring of Blue Springs recovery since that time
Volusia Blue Spring Restoration Plan
5-1
Section 5.0 Restoration Goals and Recommendations
5.1 Visioning the Future for the Volusia Blue Spring American Indians occupied the lands along the St. Johns River and springs for thousands of years before European conquest. While they left no written history, archaeological explorations have documented stable human populations, a large shellfish industry, and construction of temple mounds, numerous human burials, and extravagant grave goods, including artistic and practical works of stone, bone, and wood.
The famous travel/writer and botanist, John Bartram visited the area in 1765 and in 1774 his son and noted naturalist William Bartram followed in his footsteps. European habitation is documented from as early as 1856, with a citrus plantation centered at the Louis Thursby Family House, located immediately adjacent to Blue Spring and constructed on a former American Indian mound. With development of steamboat traffic on the St. Johns River and the Florida East Coast Railroad through Orange City, the spring became a travel destination for northern tourists. The State of Florida purchased the land around Blue Spring and developed the Blue Spring State Park beginning in 1972.
These early records present a vision of a recovering wild Florida along the St. Johns River. The original inhabitants had been exterminated or removed from the area during Spanish rule through the early 18th century. Northern American Indian tribes, principally the Creeks from South Carolina, colonized Florida during the 1700’s. The new inhabitants, named the Seminoles, lived as agriculturalists and hunters up through the time of expanding U.S. colonization in the late 1700’s and early 1800’s, and were largely removed after the Second Seminole Water in the 1830s. During these periods of relatively remote conditions and low human populations, it can be surmised that Blue Spring either regained or maintained its natural flows and ecology. While the American Indians and early settlers hunted manatees for food, they did not pump groundwater for irrigation or place excessive amounts of nitrogen on the ground. Extraction of water from the Floridan Aquifer was through free-flowing, artesian wells in the late 19th century, into the early 20th century. Mechanical extractions of groundwater from the Floridan Aquifer in Florida were estimated as less than 500 MGD up until at least the 1950s (Bush & Johnston, 1988; Knight, 2015).
The vision of Volusia Blue Spring, relatively untouched by the developed human world, is a spring boil with a strong flow of crystal-clear, unpolluted water, and a spring run colonized by waving submerged grasses and supporting a high density of fish and other wildlife, including a stable manatee population. Anecdotal reports indicate Blue Spring matching this description as late as the 1970s. In quantitative terms, this vision for a restored Volusia Blue Spring will only be achieved if the following general recommendations are followed:
Reduce regional groundwater extractions by 50 percent or more as needed to restore average spring flows to 95 percent of their historic levels;
Reduce nitrogen loadings to the springshed from fertilizer and human/animal wastewater disposal by 45 percent or more as needed to achieve the springs nitrate numerical standard of 0.35 mg/L; and

Volusia Blue Spring Restoration Plan
5-2
Place a carrying capacity on recreational activities negatively affecting the spring cave/vent and the upper spring run area.
5.2 Key Stakeholders This section briefly lists the key stakeholder groups that will need to come together as partners to support the recommendations outlined in this report.
5.2.1 PrivateLandowners
There are tens of thousands of private landowners who will be affected by any comprehensive restoration of the Volusia Blue Spring because the majority of the springshed is in private ownership. Based on our current understanding of the actions that will need to be taken to achieve the desired spring restoration goals, many of these private landowners will be affected by groundwater and fertilizer use restrictions and possibly increased fees for water and wastewater management - either through local utility rate increases or by possible upgrades to on-site sewage disposal systems.
5.2.2 Federal,State,LocalGovernments,andNon‐GovernmentalOrganizations
Key public stakeholders identified during this restoration planning effort include U.S. government agencies (e.g., U.S. Environmental Protection Agency, U.S. Forest Service, U.S. Geological Survey, U.S. Fish and Wildlife Service, U.S. Department of Agriculture and Natural Resource Conservation Service). Florida government agencies, including the Department of Environmental Protection, the St. Johns River Water Management District, the Florida Department of Forestry, the Florida Fish and Wildlife Conservation Commission, the Department of Economic Opportunity, the Florida Department of Health, and the Florida Department of Agriculture & Consumer Services. Local governments, including counties and cities are also stakeholders in restoring Volusia Blue Spring.
Non-Governmental Organizations who are focused on restoring the Volusia Blue Spring include the Florida Springs Council, a federation of over 45 individual organizations, the Florida Springs Institute, the Volusia Blue Springs Alliance, the Friends of Blue Spring State Park, the Institute for Water and Environmental Resilience at Stetson University, the St. Johns Riverkeeper, the Florida Sierra Club, the Florida Defenders of the Environment, Environment Florida, 1000 Friends of Florida, the Nature Conservancy, Audubon Florida, and many other groups.
5.2.3 Agricultural,Forestry,Industrial,Commercial,andDevelopmentOperations
The list of Volusia Blue Spring restoration stakeholders also includes the numerous private agricultural, industrial, manufacturing, and retail businesses located in the groundwater basin
5.3 Developing a Restoration Roadmap A holistic restoration roadmap for the Volusia Blue Spring must include the following components:
Restoration Plan (this report) o Summary of existing conditions o Impairments that can be restored o Specific goals for restoration

Volusia Blue Spring Restoration Plan
5-3
o Practical steps needed to achieve those goals o Responsible parties
Implementation Plan (future report) o A timeline for implementing the restoration plan o Approximate costs and funding sources o Monitoring of progress with continuing adaptive management in response to
measured improvements
5.4 Specific Goals for Restoration and Practical Steps to Achieve Those Goals
5.4.1 WaterQuantityRestoration
The preliminary water quantity restoration goal for Volusia Blue Spring is to restore the current average flow of about 125 cfs to the MFL target of 157 cfs. This goal can be achieved by replacing at least half of the estimated clear groundwater flow that has been lost due to pumping through wells in the Volusia Blue Springshed or about 6 MGD. In addition, the water balance presented above indicates that an additional pumping reduction of about than 15 MGD will need to occur regionally for a total combined reduction in groundwater pumping of at least 21 MGD. These reductions should be based on a springshed-wide assessment of groundwater use priorities.
Reductions in groundwater pumping need to be prioritized based on their regional economic importance and can be made through a combination of the following proactive measures:
Increased water use efficiency;
Increased water conservation; and
Increased reliance on alternative surface water supplies to reduce dependence on groundwater uses.
Until a detailed economic evaluation is conducted, it is reasonable to assume that all existing groundwater users in the Volusia Blue Springshed need to reduce their groundwater consumption by an equal percentage. Public and domestic self-supplies could reasonably achieve this water use goal by reducing, or eliminating, landscape and lawn irrigation with groundwater. Rainfall could be stored locally in ponds, cisterns, or rain barrels too provide for limited outdoor water use activities.
Agricultural production in Florida has relatively recently developed a dependency on crop irrigation using groundwater. This use cannot be sustained at current rates if restoring spring flows and river health is a priority. One most practical first step is to stop issuance of any new groundwater use permits for crop irrigation in Florida. The next step is to revise existing agricultural permits to restrict water uses to the most necessary and efficient cropping methods, to meter all uses, and to charge a groundwater use fee to discourage excessive use. Local and regional groundwater pumping will need to be reduced by more than 21 MGD to restore adequate spring flows at Volusia Blue Spring.
Conversion of a large percentage of crops being grown on over-drained, highly vulnerable lands, to non-irrigated crops such as long-leaf pine plantations or in some cases unimproved pasture will be necessary to attain the ultimate water quantity restoration goal. Springs protection zones

Volusia Blue Spring Restoration Plan
5-4
should be developed based on the aquifer vulnerability maps reproduced in this report. No new high-intensity agricultural operations should be permitted on vulnerable lands unless they can rely totally on rainfall and surface water storage. Subsidies and tax incentives may need to be developed to lessen the impact of these types of restrictions on existing agricultural producers located in vulnerable areas.
Other significant water uses, including commercial/industrial and recreational, will also need to meter their flows, pay a fee, and reduce their reliance on groundwater supplies.
5.4.2 WaterQualityRestoration
The preliminary target for average nitrate-nitrogen concentrations at Volusia Blue Spring is 0.35 mg/L as determined by FDEP in the nutrient TMDL developed by FDEP (Holland & Bridger, 2014). This goal will require an estimated 45% reduction in all nitrogen loads to the vulnerable portions of the springshed. This report estimates that there is approximately 477 tons per year of total nitrogen introduced into the Volusia Blue Springshed in the form of nitrogen fertilizer. The second largest controllable source of nitrogen is from on-site septic systems at about 363 tons per year. Other important nitrogen sources include municipal wastewater disposal of about 91 tons per year and concentrated animal-feeding operations (CAFOs), with an estimated 34 tons per year. Rainfall contributes on average about 182 tons per year of nitrogen to the springshed area.
The estimated combined load of total nitrogen in the Volusia Blue Springshed from these sources is about 1,135 tons per year. An estimated 45% of the controllable nitrogen load or 434 tons of nitrogen per year needs to be eliminated. Reducing nitrogen fertilizer loads by 45% or 217 tons per year can accomplish 50% of the reduction goal. The nitrogen load in municipal wastewaters, septic tank effluents, and from CAFOs will also need to be reduced by 45% or 217 tons per year through septic tank connections and upgrades to advanced nitrogen removal processes such as oxidation ditches and constructed wetlands to meet FDEP’s TMDL goal of 0.35 mg/L.
To achieve this goal, it may be necessary to discontinue many uses of nitrogen fertilizer in the Volusia Blue Springshed, to collect and treat confined animal wastewaters in pond-wetland systems, and to connect many on-site sewage systems to central sewers with advanced levels of nitrogen reduction. A significant portion of this reduction could probably be accomplished in concert with reduced fertilizer utilization resulting from the water quantity restoration efforts described above. Nearly 100% of the springshed is considered vulnerable in terms of groundwater contamination by surface pollutants. Eliminating agricultural and residential fertilizer uses in these most vulnerable areas would provide the greatest reduction of nitrogen inputs to the Volusia Blue Spring. A more acceptable solution might be to phase in cuts to all nitrogen fertilizer use in the springshed at about 25% reduction in the first five years, followed by a second phased reduction of an additional 40% over the next five years, and consideration of additional phased reductions if found to be necessary based on the measured nitrate-nitrogen levels in the Volusia Blue Spring. A phased program to reduce fertilizer use would allow greater flexibility for agricultural producers to develop less polluting cropping strategies.
Nutrient loads originating from livestock will also need to be reduced by about 45% to achieve the TMDL nitrate limit for Volusia Blue Spring. One way to accomplish this goal is to eliminate or reduce all pasture fertilization and then to limit the density of grazing animals to what can be supported by unimproved pasture. A second alternative is to collect all animal manure and to recycle it as an alternative to using inorganic nitrogen fertilizers. A third method is to combine
Volusia Blue Spring Restoration Plan
5-5
several nitrogen waste streams as an effluent, and remove the nitrogen from this water through nitrification/denitrification treatment technologies. Ultimately, the number of large grazing animals in the springshed may need to be reduced significantly to achieve the nitrate TMDL goal.
Human wastewater nitrogen loads in the springshed can be reduced by implementing advanced nitrogen removal for all central wastewater facilities and by providing centralized collection and wastewater treatment for any high-density septic tank areas. A detailed analysis evaluating and comparing nitrogen removal measures using advanced nitrogen removal technologies such as constructed wetlands, biological nutrient removal processes, and nitrogen-removal on-site systems should be prepared as part of the Volusia Blue Spring BMAP process.
In summary, the anticipated final Volusia Blue Spring BMAP must provide realistic but stringent nitrogen reduction measures, regardless of whether they adversely affect agriculture or urban land use practices. Costs for these upgrades may be significant and should in turn be compared to costs to reduce other nitrogen inputs to the aquifer from fertilizers and animal/human wastes. The nitrate contamination at the Volusia Blue Spring will not be solved unless all options are on the table and evaluated for cost effectiveness ($ per pound of nitrogen that is prevented from reaching the aquifer).
5.5 Holistic Ecological Restoration The effects of reduced flows, increasing concentrations of nitrate-nitrogen, invasions by exotic plant and animal species, and increasing recreational uses have resulted in visible long-term changes to the natural flora and fauna of Volusia Blue Spring. Ecological restoration will require a comprehensive approach to dealing with all sources of impairment simultaneously, rather than a piecemeal approach of divided responsibilities by an array of state and local agencies.
5.5.1 EducationInitiatives
Ongoing public education about the threats facing the long-term health of Volusia Blue Spring will be essential for achieving ultimate restoration. This Volusia Blue Spring Restoration Plan provides a preliminary roadmap to fully accomplish restoration goals. However, getting this information out to the public and to the state officials and legislators who are most concerned with springs’ protection is an important part of this educational process. This will require public presentations, public meetings, newspaper and TV reporting, rallies at area springs, and many partnerships. The Howard T. Odum Florida Springs Institute can provide technical support and educational materials and will be joined with other springs advocacy and educational organizations throughout North Central Florida.
5.5.2 RegulatoryAssistance
In 2014, the FDEP formally adopted TMDL nitrate-nitrogen goals for Volusia Blue Spring (Holland & Bridger, 2014). Active participation in the ongoing BMAP development and implementation will be critical to reverse the increasing nitrate levels and declining flows. This Volusia Blue Spring Restoration Plan can serve as the “People’s BMAP” if the FDEP plan does not provide an efficient and timely roadmap to achieve success with restoration and protection of this spring system.
In 2006, the St. Johns River WMD developed Minimum Flows and Levels (MFLs) for Volusia Blue Spring that found that the ecosystem was already being significantly harmed by flow reductions
Volusia Blue Spring Restoration Plan
5-6
due to groundwater pumping. An ambitious 25-year plan for recovery was included in that rule development process. Unfortunately, by 2009 the WMD had begun to deviate from implementation of the Blue Spring Action plan, and relaxed requirements for public utilities to reduce their groundwater dependence. There needs to be renewed pressure for the WMD to abandon the ineffective Central Florida Water Initiative and to return to the original Volusia Blue Spring Action Plan.
The Florida Department of Agriculture and Community Services (FDACS) is the state agency responsible for regulating agricultural practices in Florida. A change in thinking is necessary at FDACS and in the development of agricultural Best Management Practices (BMPs). For example, existing BMPs are developed to maximize economic yield while minimizing environmental damage. This focus on prioritizing profit over clean water will not result in adequate springs’ protection. Agricultural BMPs must be re-designed to first achieve necessary environmental protections and secondly to provide reasonable economic returns. An effort to develop “Advanced BMPs” should result in zoning restrictions on certain intensive agricultural activities. In areas of high groundwater vulnerability, existing research indicates that the only agricultural crop that is consistently capable of maintaining an average groundwater nitrate concentration of less than 0.35 mg/L is probably long leaf pine forestry. Until a better “Advanced BMP” becomes available, an unfertilized, non-irrigated forestry crop should be mandated by FDACS for the vulnerable karst areas of the state.
5.6 Closing Statement
Implementation of the recommendations listed above will require significant will-power and changes to “business as usual.” Eventual restoration and long-term protection of Volusia Blue will require a shift from focusing on short-term needs of individuals and businesses, to taking a longer view for conservation and protection of clean and abundant groundwater for the public as a whole.
Groundwater is one of the most important natural resources in Florida. Currently, the groundwater that feeds Volusia Blue Spring is neither clean nor abundant. As evidenced so clearly by the deteriorating water quality and declining flows of Volusia Blue Spring, Florida’s groundwater resources are also on a declining trajectory. Fortunately, as long as it rains, groundwater is a renewable resource. Hope for the future health of the Volusia Blue Spring and for Florida’s springs in general is in the hands of the people who have learned to appreciate the unique value of these public resources.

Volusia Blue Spring Restoration Plan
6-1
Section 6.0 References Aresco, M. J., Ewert, M. A., Gunzburger, M. S., Heinrich, G. L., & Meylan, P. A. (2006). Chelydra
serpentina - snapping turtle. Biology and Conservation of Florida Turtles. Chelonian Research Monographs, Lunenberg, Massachusetts, 3.
Aucott, W. R. (1988). The Predevelopment Ground-Water Flow System and Hydrologic Characteristics of the Coastal Plain Aquifers of South Carolina. Water-Resources Investigations Report (USA).
Barbour, M. T., Gerritsen, J., & White, J. S. (1996). Development of the Stream Condition Index for Florida. Prepared for the Florida Department of Environmental Protection. Tallahassee, FL.
Bonn, M. A., & Bell, F. W. (2003). Economic Impact of Selected Florida Springs on Surrounding Local Areas. Florida Department of Environmental Protection, Tallahassee, Florida, USA.
Bonn, M. A., & Harrington, J. (2008). A Comparison of Three Economic Impact Models for Applied Hospitality and Tourism Research. Tourism Economics, 14(4), 769-789.
Brooks, H. K. 1982. Physiographic divisions of Florida. Center for Environmental and Natural Resources Programs, IFAS, University of Florida, Gainesville.
Bush, P. W., & Johnston, R. H. (1988). Ground-Water Hydraulics, Regional Flow, and Ground-Water Development of the Floridan Aquifer System in Florida and in Parts of Georgia, South Carolina, and Alabama.
Escribano, Y., Eller, K. T., Lyon, C., & Katz, B. G. (2017). Nitrogen Source Inventory and Loading Estimates for the Volusia Blue Spring and Volusia Blue Spring Run Contributing Area. Tallahassee, FL.
Farrell, T., Munscher, E., & Work, K. (2009). Blue Spring Biological Survey. 2007-2008 Aquatic Turtle Population Surveys. Prepared for Wetland Solutions, Inc. DeLand, FL.
Fernald, E. A., Patton, D. J., & Anderson, J. R. (1984). Water Resources Atlas of Florida. Institute of Science and Public Affairs, Florida State University.
Fernald, E. A., Purdum, E., Anderson, J. R., Jr., & Krafft, P. A. (1998). Water Resources Atlas of Florida Tallahassee, Fla. Institute of Science and Public Affairs, Florida State University, c1998.
Florida Department of Environmental Protection (FDEP). (2005). Blue Spring and Hontoon Island State Parks Unit Management Plan. Division of Recreation and Parks. October 14, 2005
Florida Department of Environmental Protection (FDEP). (2009). General Biological Structure of Volusia Blue Spring Run: Sampled October 2007 – November 2008. Bureau of Assessment and Restoration Support, Tallahassee, FL. 19 pp.
Florida Department of Environmental Protection (FDEP). (2017). Draft Report, Volusia Blue Spring Basin Management Action Plan, Draft Report, August 2017.

Volusia Blue Spring Restoration Plan
6-2
Florida Department of Environmental Protection, (FDEP). (2009). General Biological Structure of Volusia Blue Spring Run: Sampled October 2007 – November 2008. (). Tallahassee, FL: Bureau of Assessment and Restoration Support.
German, E. R. (2008). Volusia blue spring-A hydrological treasure. U.S. Geological Survey Fact Sheet 2008 -3035
Harrington, D., Maddox, G., & Hicks, R. (2010). Florida Springs Initiative Monitoring Network Report and Recognized Sources of Nitrate. Florida Department of Environmental Protection.
Holland, K., & Bridger, K. (2014). Nutrient TMDL for Blue Spring (Volusia County) and Blue Spring Run (Volusia County), WBIDs 28933 and 28933A. Florida Department of Environmental Protection, Tallahassee, FL. July 2014.
Hoyer, M., Frazer, T., & Notestein, S. (2004). Vegetative Characteristics of Three Low-Lying Florida Coastal Rivers in Relation to Flow, Light, Salinity and Nutrients. Hydrobiologia, 528(1-3), 31-43.
Iverson, J. B., & Meshaka Jr, W. E. (2006). Sternotherus odoratus–common musk turtle or stinkpot Biology and Conservation of Florida Turtles. Chelonian Research Monographs, Lunenberg, Massachusetts, 3, 207-223.
Jackson, D. R., & Meylan, P. (2006). Pseudemys nelsoni—Florida red-bellied turtle Biology and Conservation of Florida Turtles. Chelonian Research Monographs, Lunenberg, Massachusetts, 3, 313-324.
King, S. A. (2014). Hydrodynamic control of filamentous macroalgae in a sub-tropical spring-fed river in Florida, USA. Hydrobiologia, 734(1), 27-37.
Knight, R. L. (2015). Silenced Springs – Moving from Tragedy to Hope. High Springs, FL: Florida Springs Institute Press.
Knight, R. L., & Clarke, R. A. (2016). Florida Springs—A Water-Budget Approach to Estimating Water Availability. Journal of Earth Science and Engineering, 6, 59-72.
Marella, R. L. (2014). Water withdrawals, use, and trends in Florida, 2010.
Meylan, P. A., & Moler, P. E. (2006). Apalone ferox—Florida softshell turtle. Biology and Conservation of Florida Turtles. Chelonian Research Monographs, Lunenberg, Massachusetts, (3), 160-168.
Odum, H. T. (1957). Primary production measurements in eleven Florida springs and a marine Turtle‐Grass community. Limnology and Oceanography, 2(2), 85-97.
Odum, H. T. (1983). Systems ecology; an introduction. Whiley-Interscience, NY. 644.
Osburn, W., Toth, D., and Boniol, D., 2006, Springs of the St. Johns River Water Management District: Available on CD-ROM from St. Johns River Water Management District, Palatka, Fla.
Reddy, K. R., Dobberfuhl, D., Fitzgerald, C., Cohen, M., Frazer, T., Graham, W., . . . Sucsy, P. (2017). Collaborative Research Initiative on Springs Protection and Sustainability [CRISPS]. Final Report of a 3-Year Project by The University of Florida and St. John’s River Water
Volusia Blue Spring Restoration Plan
6-3
Management District, UF Contract #27789. Palatka, FL: St. John's River Water Management District.
Rouhani, S., Sucsy, P., Hall, G., Osburn, W., & Wild, M. (2006). Analysis of Blue Spring Discharge Data for Determining Minimum Flows to Protect Manatee Habitat. Report Prepared for St. Johns River Water Management District, Palatka, FL, , 32178-31429.
Scott, T. M., & Florida, G. S. (2004). Springs of Florida. Florida Dept. of Environmental Resources.
Scott, T. M., Means, G. H., Means, R. C., & Meegan, R. P. (2002). First magnitude springs of Florida. Florida Geological Survey Open File Report, 85
Shelton, J.M. (2005). Surface Water Quality-Assurance Plan for the Altamonte Springs Office of the Florida Integrated Science Center of the U.S. Geological Survey. Open-File Report. Denver, CO.
Shoemaker, W. B., O’Reilly, A. M., Sepúlveda, N., Williams, S. A., Motz, L. H., & Sun, Q. (2004). Comparison of estimated areas contributing recharge to selected springs in north-central Florida by using multiple ground-water flow models. Tallahassee, FL. U.S. Geological Survey Open-File Report 03-448, 31.
Slack, L. J., & Rosenau, J. C. (1979). Water quality of Florida springs. Florida Bureau of Geology Map Series 96 1979.1 Sheet, 3 Fig, 3 Tab, 7 Ref.
St. Johns River Water Management District (SJRWMD). (2006). Volusia Blue Spring Minimum Flow Regime Action Plan.
St. Johns River Water Management District (SJRWMD). (2010). Volusia Blue Spring Minimum Flow Regime First Consolidated Report.
St. Johns River Water Management District (SJRWMD). (2012). Volusia Blue Spring Minimum Flow Regime. 2013 Monitoring Plan. Unpublished report. Palatka, Fla.: St. Johns River Water Management District.
Sucsy, P. (2005). Unpublished memorandum dated August 30, 2005. Unpublished manuscript.
Sucsy, P., Hupalo, R., & Freeman, B. (1998). Minimum flow determination for blue spring, volusia county: The relationship between ground water discharge and winter refuge for manatees. Draft Technical Report. Unpublished Report (Draft 7), Department of Water Resources, St. Johns River Water Management District, Palatka, Fl,
Thomas, R. B. (2006). Trachemys scripta—slider or yellow-bellied slider. Biology and Conservation of Florida Turtles. Chelonian Research Monographs, Lunenberg, Massachusetts, 3, 298-312.
Thomas, R. B., & Jansen, K. P. (2006). Pseudemys Floridana. Florida cooter. Biology and Conservation of Florida Turtles.C helonian Research Monographs, Lunenberg, Massachusetts, 3, 338-347.
U.S. Environmental Protection Agency (USEPA). (2006). National drinking water regulations. U.S. Environmental Protection Agency, Office of Water.

Volusia Blue Spring Restoration Plan
6-4
Wetland Solutions, Inc (WSI). (2006). Human Use and Ecological Evaluation of the Recommended Minimum Flow Regime for Blue Spring and Blue Spring Run, Volusia County, Florida. Report prepared for the St. Johns River Water Management District, Palatka, FL. 93 pp.
Wetland Solutions, Inc (WSI). (2007). Blue Spring (Volusia Co.) Project Work Plan. Memorandum prepared for the St. Johns River Water Management District, Palatka, FL. 18 pp.
Wetland Solutions, Inc. (WSI). (2009). Water Resource Value Monitoring for Blue Spring and Blue Spring Run, Volusia County, Florida. Final Report. Special Publication SJ2010-SP5. Palatka, Fla.: St. Johns River Water Management District.
Wetland Solutions, Inc. (WSI). (2010a). Water Resource Value Monitoring for Blue Spring and Blue Spring Run, Volusia County, Florida - Water Year 2008/2009. Prepared for the St. Johns River Water Management District. September 2010.
Wetland Solutions, Inc. (WSI). (2010b). An Ecosystem-Level Study of Florida’s Springs. Prepared for the Florida Fish and Wildlife Conservation Commission, St. Johns River Water Management District, Southwest Florida Water Management District, Florida Park Service, Florida Springs Initiative, and Three Rivers Trust, Inc. Gainesville, FL.
Wetland Solutions, Inc. (WSI). (2011). Water Resource Value Monitoring for Blue Spring and Blue Spring Run, Volusia County, Florida - Water Year 2009/2010. Prepared for the St. Johns River Water Management District. September 2011.
Wetland Solutions, Inc. (WSI). (2012). Water Resource Value Monitoring for Blue Spring and Blue Spring Run, Volusia County, Florida – Water Years 2010/11 and 2011/12 (October 2010-June 2012). Technical Memorandum submitted to St. Johns River Water Management District. October 2012.
Wilson, L. T., Y. Yang, P. Lu, J. Wang, J. W. Nielsen-Gammon, N. Smith, and C. J. Fernandez. (2007). Integrated Agricultural Information and Management System (iAIMS): World Climatic Data. August 2007.
Work, K. (2006). Fish Survey Data from October 2000 to July 2004. Department of Biology, Stetson University, DeLand, FL.
Work, K., & Gibbs, M. (2008). Volusia Blue Spring Minimum Flow and Level Project: First Year Fish Assemblage Assessment. Department of Biology, Stetson University. DeLand, FL: Prepared for Wetland Solutions, Inc.
Work, K., Gibbs, M., Peters, B., & French, L. (2010). Fish assemblage variability in a Florida spring. Southeastern Naturalist, 9(4), 649-672.
Work, K. & Gibbs, M. (2015). Water Resource Value Monitoring for Volusia Blue Spring MFL 2014-2015: Algal, Snail, and Fish Assemblage Assessment. Report submitted to St. Johns River Water Management District. December 2015.

Volusia Blue Spring Restoration Plan
6-5
Yang, Y., L.T. Wilson, and J. Wang. (2010). Development of an Automated Climatic Data Scraping, Filtering and Display System. Computers and Electronics in Agriculture 71: 77–87. http://beaumont.tamu.edu/ClimaticData/
Zappalorti, R. T., & Iverson, J. B. (2006). Sternotherus minor–loggerhead musk turtle. Biology and Conservation of Florida Turtles. Chelonian Research Monographs, Lunenberg, Massachusetts, 3, 197-206.