Embed Size (px)
Citation preview
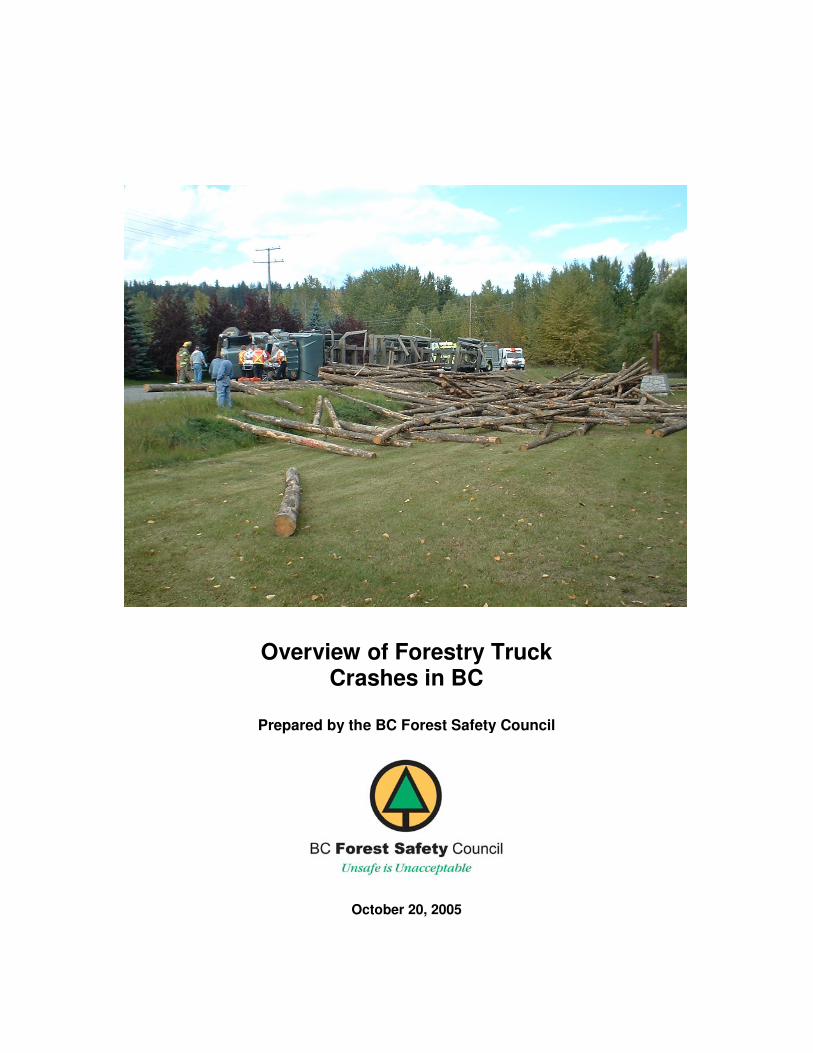
Overview of Forestry Truck Crashes in BC
Prepared by the BC Forest Safety Council
October 20, 2005
Introduction While evidence indicates an overall reduction in crashes involving commercial trucks in BC, the number of incidents involving forest hauling trucks, logging trucks in particular, is still alarming. With the uptake in harvesting volumes due to the mountain pine beetle devastation comes a corresponding increase in volumes of trucks hauling forestry products on BC roads, often interfacing with private vehicles on public highways. “We are facing the “Perfect Storm” The “interface” between the traveling public and the north’s major resource industries (forestry, oil & gas and mining) will continue to increase for the next decade as the circumstances of the mountain pine beetle infestation brings unprecedented volumes of traffic in the forest harvesting and transportation sector, coupled with tremendous increases in the oil & gas industry as well as a revitalization of northern BC’s mining activities due the world’s unrelenting demand for resources.
- Logs are being hauled farther and spending more time on highways, often criss-crossing to reach mills in both directions.
- The annual harvest of beetle killed timber in BC will increase by over 5 million m3. Each increase of a million cubic meters means 22,000 additional log loads, two extra contractors with 30 operators, fuel trucks and low-beds on an already taxed road system.
- Oil and gas exploration is increasing resource road use @ 80-120 loads per rig movement.
- The Winter Olympics in 2010 are fuelling a large push to increase tourism in the north half of BC.
- Resource roads were not designed for the current levels of use and highways were not designed for the increased weights. ( hence the “ruts” in heavily traveled areas)
- The seasons for hauling are compressed because of reduced winter ground in beetle killed areas and stumpage rate strategies.
- More money in oil and gas, and retirements is lowering the proportion of experienced driver numbers.
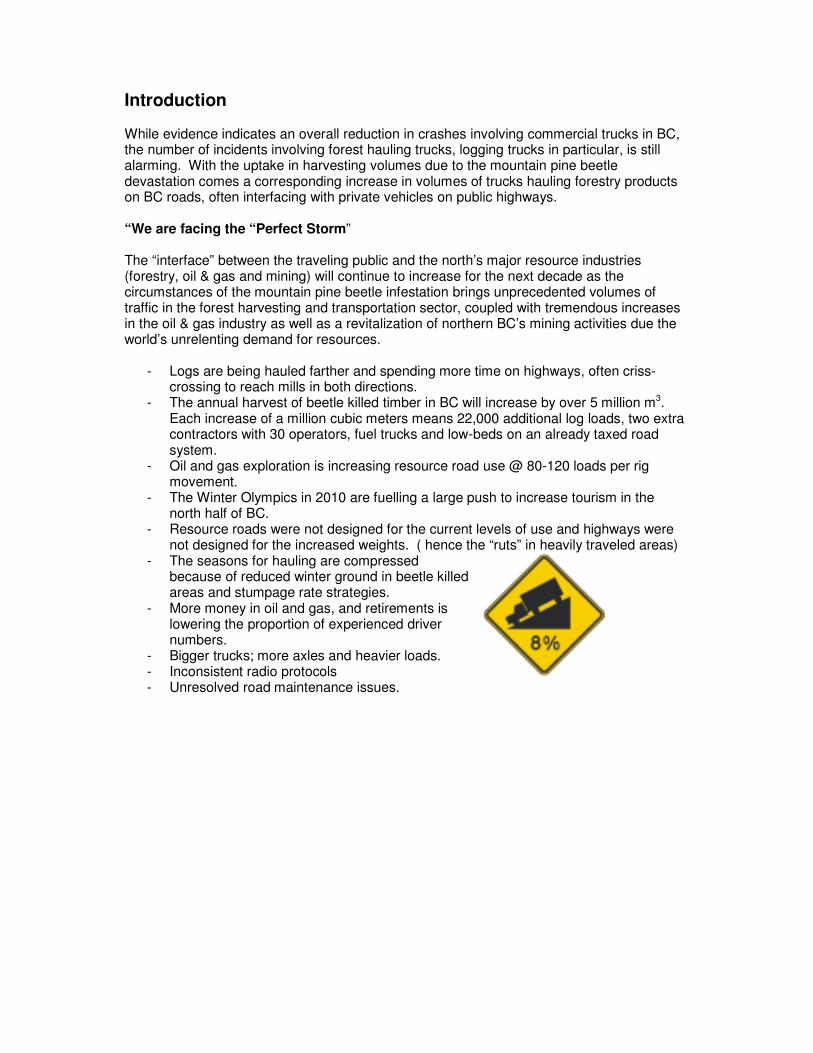
- Bigger trucks; more axles and heavier loads. - Inconsistent radio protocols - Unresolved road maintenance issues.
Did you know? Driving for 17 hours in a day produces the same level of impairment as a .05 blood alcohol reading. ~New England Journal of Medicine,
Sept, 1997
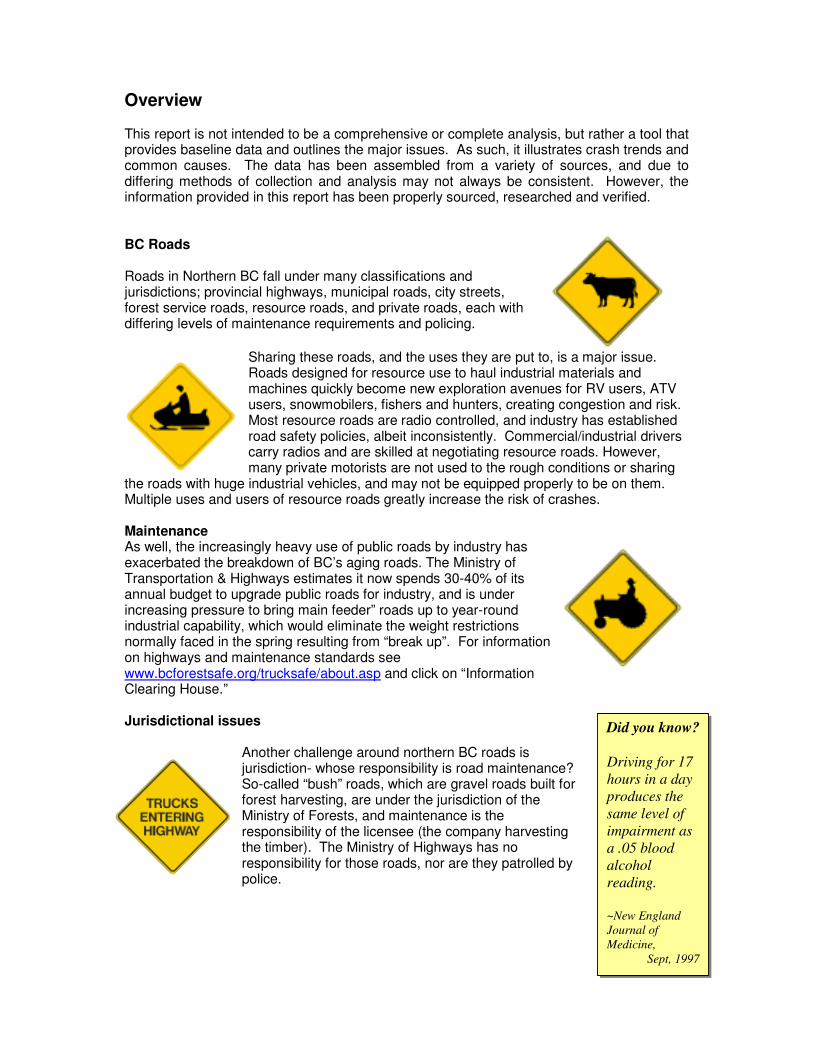
Overview This report is not intended to be a comprehensive or complete analysis, but rather a tool that provides baseline data and outlines the major issues. As such, it illustrates crash trends and common causes. The data has been assembled from a variety of sources, and due to differing methods of collection and analysis may not always be consistent. However, the information provided in this report has been properly sourced, researched and verified. BC Roads Roads in Northern BC fall under many classifications and jurisdictions; provincial highways, municipal roads, city streets, forest service roads, resource roads, and private roads, each with differing levels of maintenance requirements and policing.
Sharing these roads, and the uses they are put to, is a major issue. Roads designed for resource use to haul industrial materials and machines quickly become new exploration avenues for RV users, ATV users, snowmobilers, fishers and hunters, creating congestion and risk. Most resource roads are radio controlled, and industry has established road safety policies, albeit inconsistently. Commercial/industrial drivers carry radios and are skilled at negotiating resource roads. However, many private motorists are not used to the rough conditions or sharing
the roads with huge industrial vehicles, and may not be equipped properly to be on them. Multiple uses and users of resource roads greatly increase the risk of crashes. Maintenance As well, the increasingly heavy use of public roads by industry has exacerbated the breakdown of BC’s aging roads. The Ministry of Transportation & Highways estimates it now spends 30-40% of its annual budget to upgrade public roads for industry, and is under increasing pressure to bring main feeder” roads up to year-round industrial capability, which would eliminate the weight restrictions normally faced in the spring resulting from “break up”. For information on highways and maintenance standards see www.bcforestsafe.org/trucksafe/about.asp and click on “Information Clearing House.” Jurisdictional issues
Another challenge around northern BC roads is jurisdiction- whose responsibility is road maintenance? So-called “bush” roads, which are gravel roads built for forest harvesting, are under the jurisdiction of the Ministry of Forests, and maintenance is the responsibility of the licensee (the company harvesting the timber). The Ministry of Highways has no responsibility for those roads, nor are they patrolled by police.
4
There’s no such thing as an “accident”
For the purpose of this report, and Forestry TruckSafe, the word “crash” will be used, rather than “accident”. [Canadians] do not see the risk in their everyday lives. If they do not see the risk, they cannot take measures to navigate that risk in order to prevent potential injury. Why can't Canadians see the risk in their lives? The problem stems from a universal misunderstanding and misuse of the word 'accident.' Injuries sustained by falls or motor vehicle crashes are not seen as the result of predictable events but rather the result of
'accidents' or 'acts of fate'. Yet when someone suffers from heart disease or cancer, high cholesterol and smoking are identified as the predictable causes. It is time to acknowledge that injuries are predictable and preventable. Injuries are not accidents, and investing in injury prevention can save money and lives [italics mine].1 - SmartRisk Foundation, 2004
Other sources also discuss the psychological implications of using the word “accident” rather than “crash”: The opportunities to reduce harm will increase if we keep uppermost in our thinking that “the fault is not in our stars, but in ourselves”.2 -British Medical Journal Crashes are preventable. Many factors contribute to crashes occurring, but they, too, are largely preventable by making good behavioral choices
– observing the rules of the road, driving at a safe speed, not consuming drugs or alcohol prior to driving, getting enough rest, having proper tires, etc. The risk from those factors over which a driver has no control, such as inclement weather, poor road conditions, unexpected appearance of wildlife, or dangers presented by other drivers can also be reduced with due care & attention
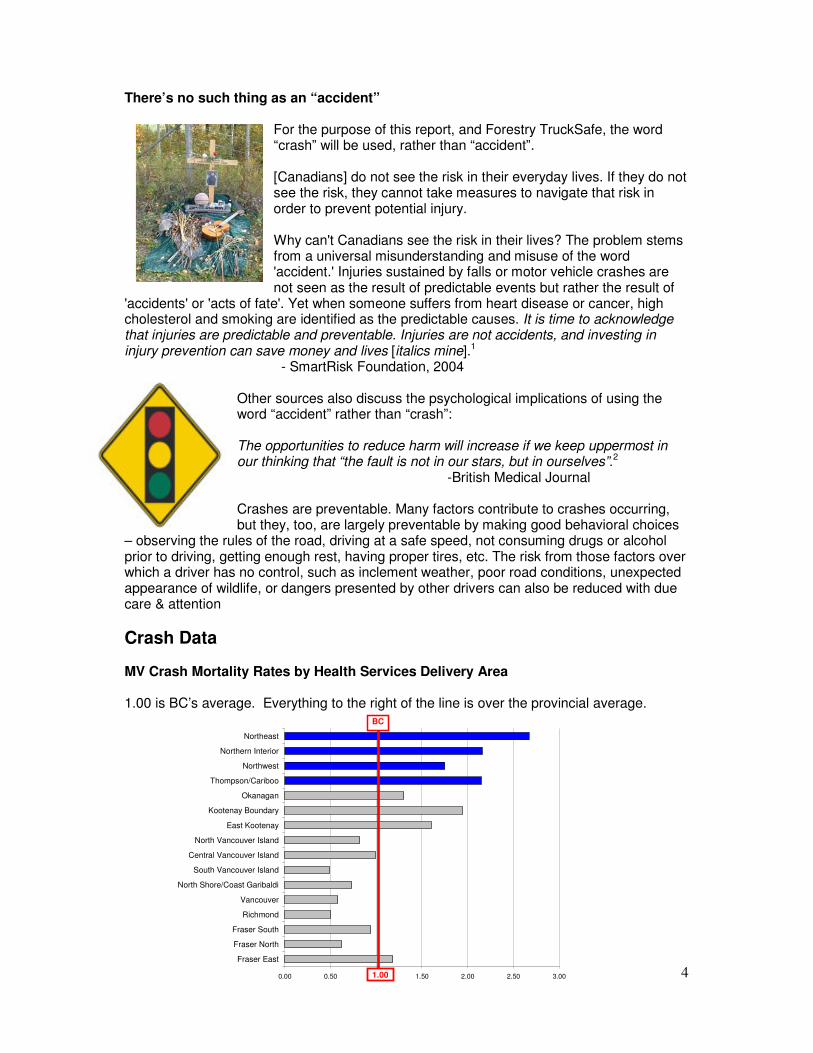
Crash Data MV Crash Mortality Rates by Health Services Delivery Area 1.00 is BC’s average. Everything to the right of the line is over the provincial average.
0.00 0.50 1.00 1.50 2.00 2.50 3.00
Fraser East
Fraser North
Fraser South
Richmond
Vancouver
North Shore/Coast Garibaldi
South Vancouver Island
Central Vancouver Island
North Vancouver Island
East Kootenay
Kootenay Boundary
Okanagan
Thompson/Cariboo
Northwest
Northern Interior
Northeast
BC
1.00
5
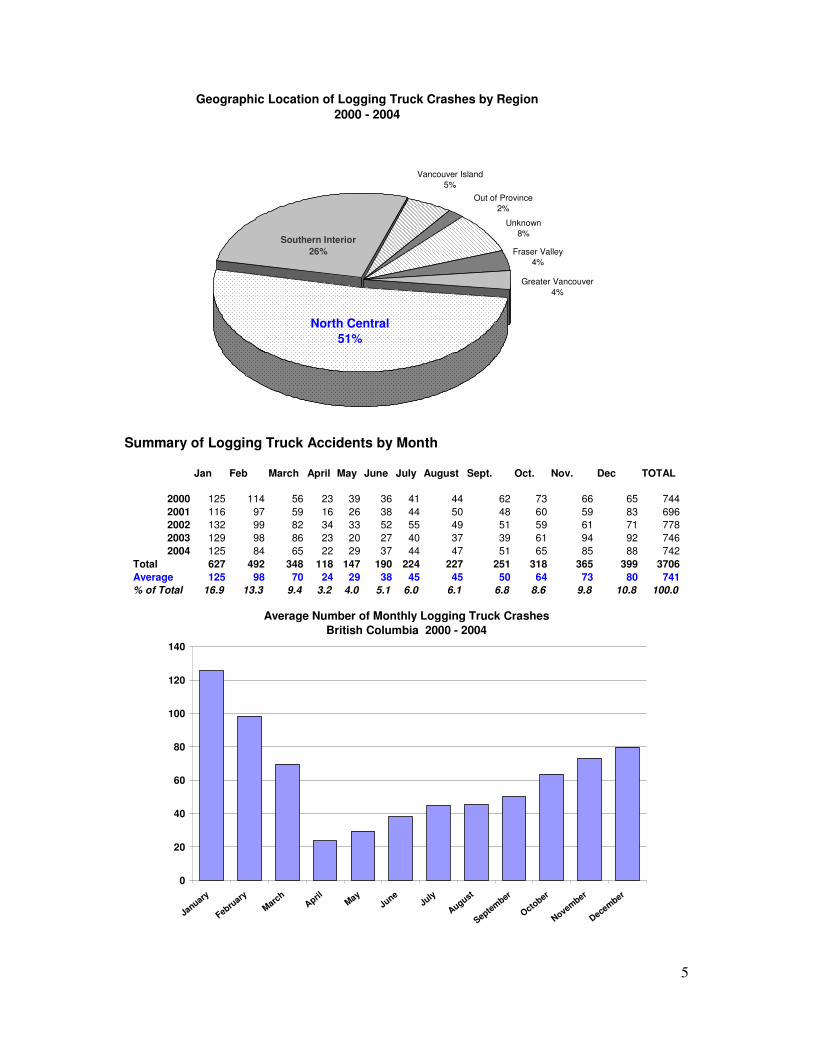
Geographic Location of Logging Truck Crashes by Region 2000 - 2004
Southern Interior26%
Out of Province2%
Unknown8%
Fraser Valley4%
Greater Vancouver4%
Vancouver Island5%
North Central51%
Summary of Logging Truck Accidents by Month
Jan Feb March April May June July August Sept. Oct. Nov. Dec TOTAL
2000 125 114 56 23 39 36 41 44 62 73 66 65 7442001 116 97 59 16 26 38 44 50 48 60 59 83 6962002 132 99 82 34 33 52 55 49 51 59 61 71 7782003 129 98 86 23 20 27 40 37 39 61 94 92 7462004 125 84 65 22 29 37 44 47 51 65 85 88 742
Total 627 492 348 118 147 190 224 227 251 318 365 399 3706Average 125 98 70 24 29 38 45 45 50 64 73 80 741% of Total 16.9 13.3 9.4 3.2 4.0 5.1 6.0 6.1 6.8 8.6 9.8 10.8 100.0
Average Number of Monthly Logging Truck Crashes British Columbia 2000 - 2004
0
20
40
60
80
100
120
140
January
FebruaryMarch
April MayJune
July
August
September
October
November
December
6
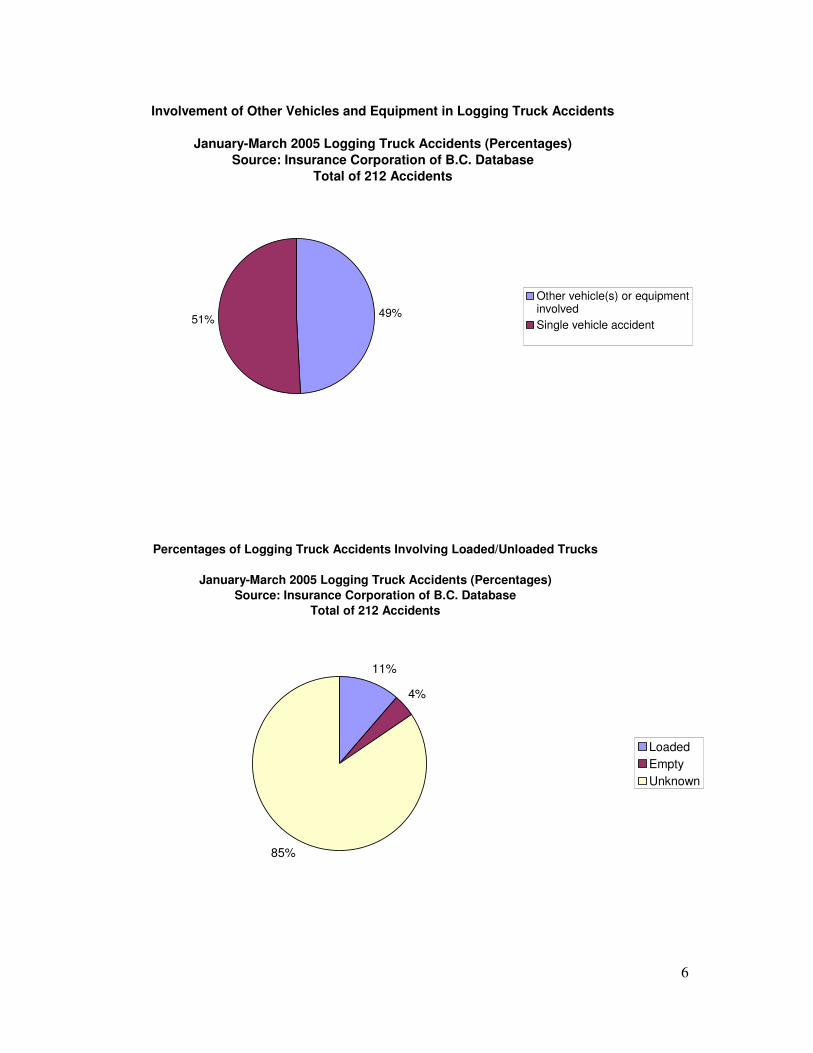
Involvement of Other Vehicles and Equipment in Logging Truck Accidents
January-March 2005 Logging Truck Accidents (Percentages)Source: Insurance Corporation of B.C. Database
Total of 212 Accidents
49%51%
Other vehicle(s) or equipmentinvolvedSingle vehicle accident
Percentages of Logging Truck Accidents Involving Loaded/Unloaded Trucks
January-March 2005 Logging Truck Accidents (Percentages)Source: Insurance Corporation of B.C. Database
Total of 212 Accidents
11%
4%
85%
LoadedEmptyUnknown
7
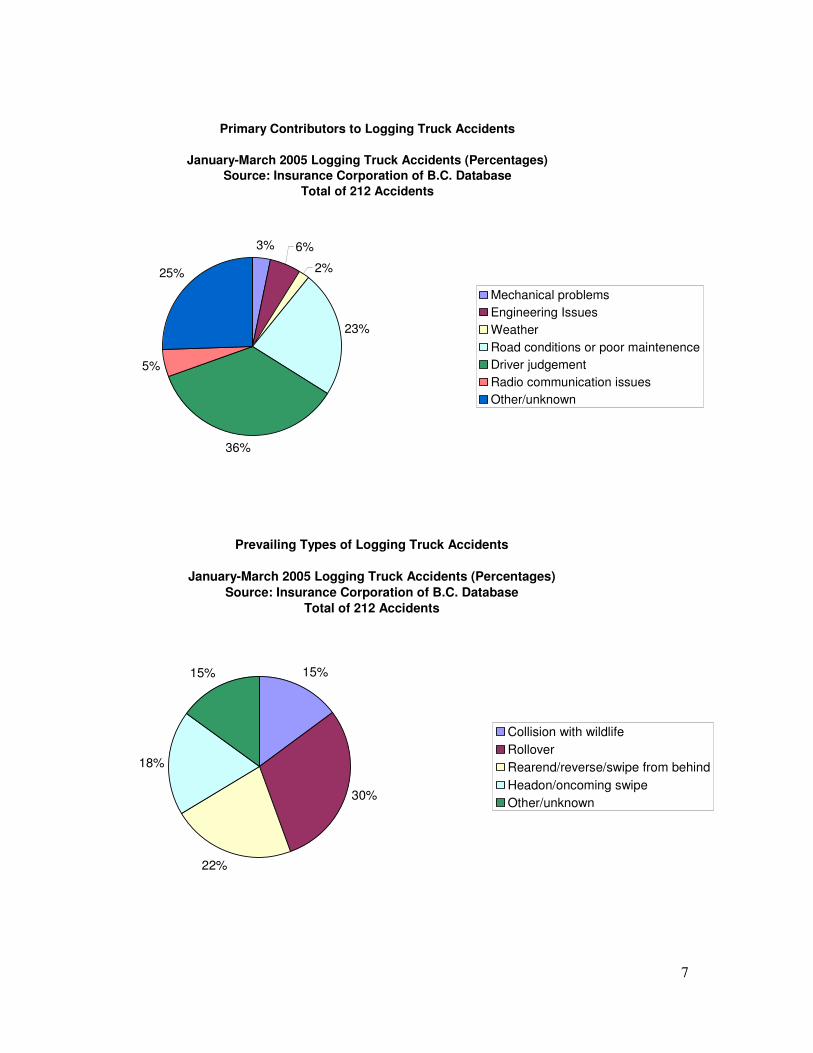
Primary Contributors to Logging Truck Accidents
January-March 2005 Logging Truck Accidents (Percentages)Source: Insurance Corporation of B.C. Database
Total of 212 Accidents
3% 6%
2%
23%
36%
5%
25%
Mechanical problemsEngineering IssuesWeatherRoad conditions or poor maintenenceDriver judgementRadio communication issuesOther/unknown
Prevailing Types of Logging Truck Accidents
January-March 2005 Logging Truck Accidents (Percentages)Source: Insurance Corporation of B.C. Database
Total of 212 Accidents
15%
30%
22%
18%
15%
Collision with wildlifeRolloverRearend/reverse/swipe from behindHeadon/oncoming swipeOther/unknown
8
Did you know?
A recent study in British Columbia showed that Aboriginal peoples were 9.3 times more likely to die due to motor vehicle accident injuries than other residents of the province.
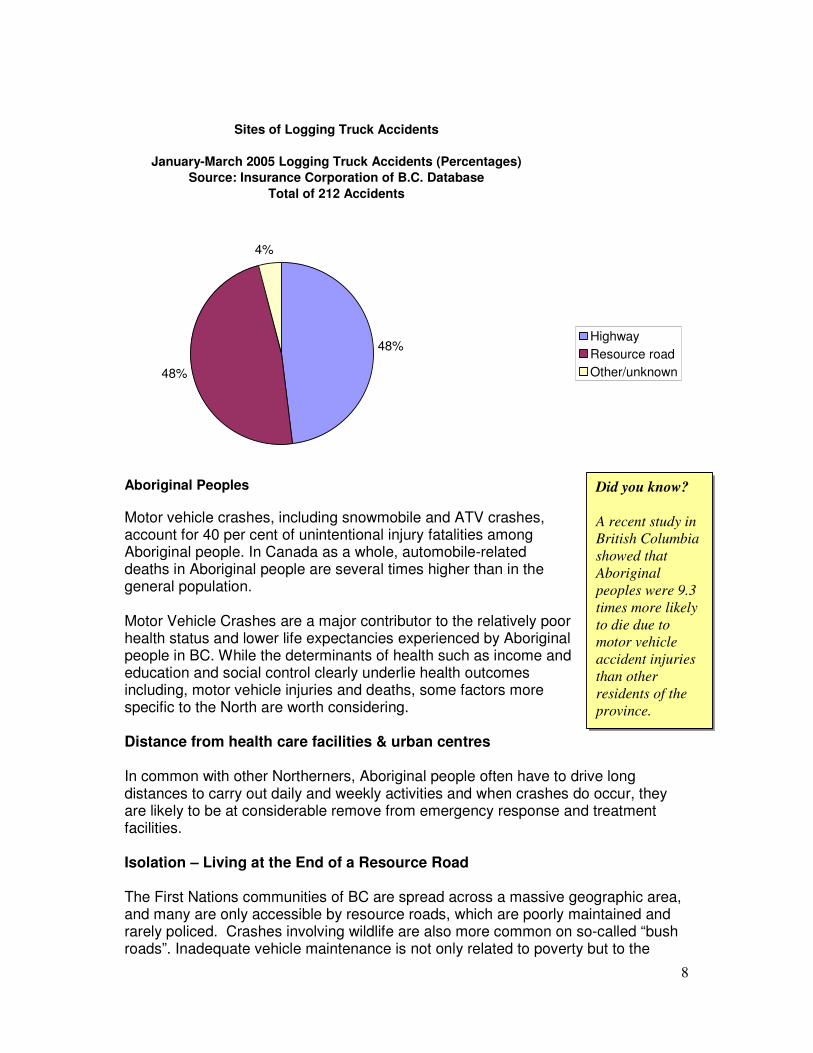
Sites of Logging Truck Accidents
January-March 2005 Logging Truck Accidents (Percentages)Source: Insurance Corporation of B.C. Database
Total of 212 Accidents
48%
48%
4%
HighwayResource roadOther/unknown
Aboriginal Peoples Motor vehicle crashes, including snowmobile and ATV crashes, account for 40 per cent of unintentional injury fatalities among Aboriginal people. In Canada as a whole, automobile-related deaths in Aboriginal people are several times higher than in the general population. Motor Vehicle Crashes are a major contributor to the relatively poor health status and lower life expectancies experienced by Aboriginal people in BC. While the determinants of health such as income and education and social control clearly underlie health outcomes including, motor vehicle injuries and deaths, some factors more specific to the North are worth considering. Distance from health care facilities & urban centres In common with other Northerners, Aboriginal people often have to drive long distances to carry out daily and weekly activities and when crashes do occur, they are likely to be at considerable remove from emergency response and treatment facilities. Isolation – Living at the End of a Resource Road The First Nations communities of BC are spread across a massive geographic area, and many are only accessible by resource roads, which are poorly maintained and rarely policed. Crashes involving wildlife are also more common on so-called “bush roads”. Inadequate vehicle maintenance is not only related to poverty but to the
9
0 1 2 3 4 5 6 7 8 9 10
BC
Fraser East
Fraser North
Fraser South
Richmond
Vancouver
N.Shore / C.Garibaldi
S. Vancouver Is.
C. Vancouver Is
N. Vancouver Is.
E. K / Kootenay B.
Okanagan
Thomps-Cariboo-Shus
Northwest
Northern Interior
Other Residents Status Persons
reality that many smaller, remote communities have no mechanical services available. Gravel and forest service roads are rough, and increase the likelihood of mechanical breakdown for all vehicles. It has been noted that on reserve especially, vehicles may be overloaded, seat belts a not utilized, and children not properly secured in child safety seats,. Access to the nearest town which acts as a service centre to the First Nations community can be a challenge for many First Nations people who don’t own a reliable vehicle.
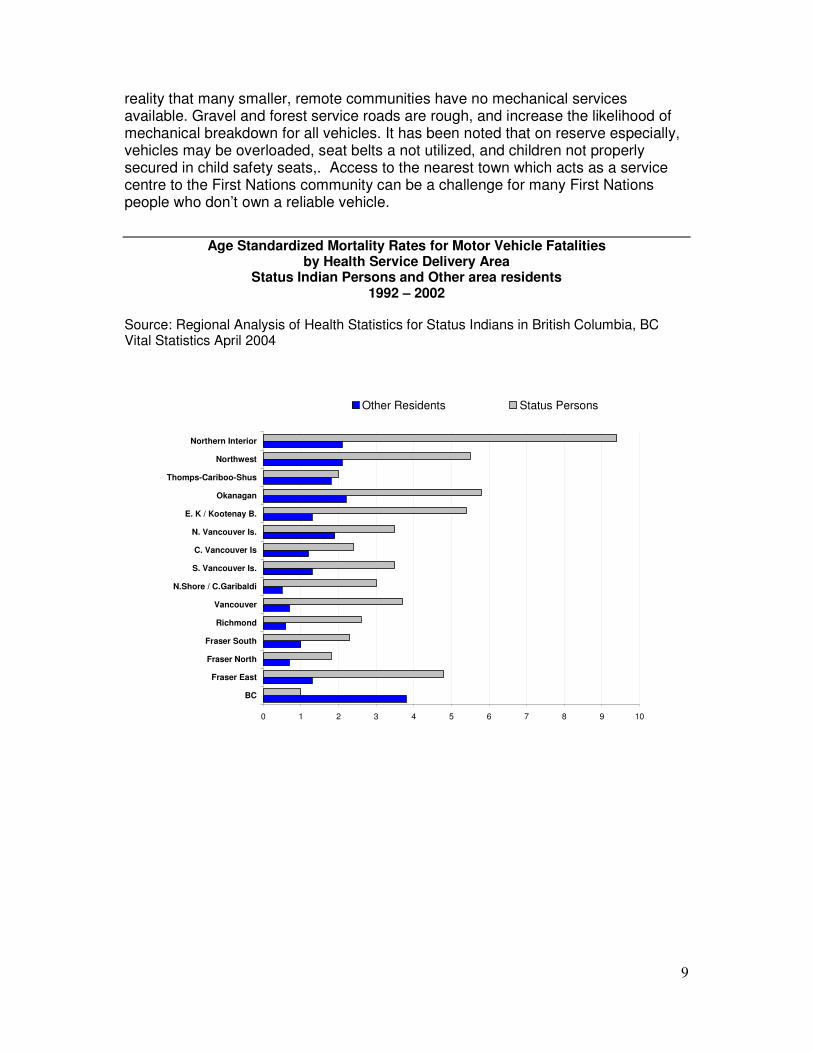
Age Standardized Mortality Rates for Motor Vehicle Fatalities by Health Service Delivery Area
Status Indian Persons and Other area residents 1992 – 2002
Source: Regional Analysis of Health Statistics for Status Indians in British Columbia, BC Vital Statistics April 2004
10
Did you know? A recent informal survey of Hwy 97 north from Cache Creek to Prince George counted commercial trucks southbound. Trucks from the forestry sector counted more than double all other commercial vehicles combined: 70 Log trucks 54 Chip trucks 91 Lumber trucks 215 101 All others Over 452 kms, that works out to one truck every 2.2 kms. At 100 kmph, that’s one every 1.6 minutes!
Did you know? The economic and social consequences of road crashes are profound - estimated to be $25 billion a year. This figure includes not only the direct and indirect costs but the estimated costs of pain and suffering.
Age Standardized Mortality Rate (ASMR) per 10,000 population For all areas in BC, the Status Indian ASMRs for Motor Vehicle crashes were higher than those for other residents in the same geographic area – The Northeast had the widest gap in rates and also the highest ASMR for Status Indians. Note: Age standardized mortality rates (ASMR), allow for direct comparison between populations with different age structures.
Commercial Drivers The major economic growth currently being experienced in the forest, mining, gas & oil and exploration sectors of Northern BC is translating into higher volumes of traffic and increased incidents of commercial crashes, especially those which involve collisions between commercial and private vehicles. E Division (BC) RCMP Inspector Norm Gaumont believes that commercial drivers are involved in 50% of all crashes in BC.3
Seat belts- lack of seat belt wear. A mythology exists among many truckers that wearing a seatbelt will hinder them from escaping their trucks in a crash. As a result, in many crashes involving commercial vehicles, the
wrecked truck still contained “liveable life space”, but the driver was deceased. By self-report, only about 30% of truck drivers wear their seatbelts. Alcohol & Drugs- crash investigations are finding an increasing amount of drugs and alcohol as causal factors in commercial crashes. Autopsy toxicology reports indicate that a large number of commercial driver who died in crashes were legally impaired by alcohol, marijuana, cocaine and/or crystal meth. Fatigue- Driver fatigue is a major concern in the commercial vehicle crash picture. It is one of the 4 top causal factors. One of the issues that drivers constantly refer to is rates of pay, which translates into drivers over-extending themselves, log book violations, vehicle maintenance issues, and fatigue. Speed- excessive speed and aggressive driving contribute to all crashes, but even more to commercial vehicles because of vehicle weights and the subsequent increased amount of time and distance needed to stop safely. Other factors related to speed include overdriving the headlights, night driving, and road conditions. Driving the posted road speed is still dangerous when road or weather conditions are poor. In collisions, the sheer size of some trucks puts car occupants at a disadvantage. Many drivers are intimidated when they must share the road with large trucks, and not without reason. According to BCAA, people in passenger vehicles account for 98% of the deaths in fatal two-vehicle crashes involving a car and a truck over 10,000 pounds. However, the
11
survey found that in most cases, police, survivors or witnesses identified at least one unsafe act by the car driver.
A maneuver by a car near a large truck may be more dangerous than the same maneuver near another car. Similarly, a large truck may perform a maneuver that carries low risk of a crash near another truck in the traffic stream, but a higher risk when performed near a smaller vehicle.
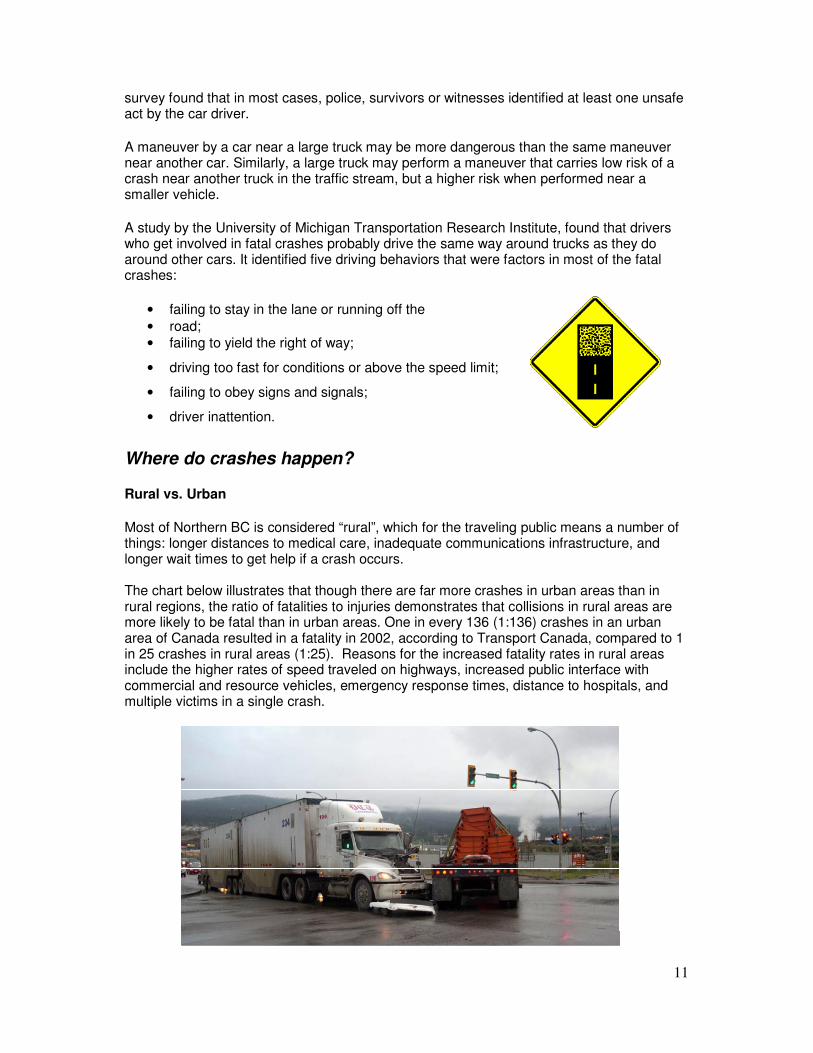
A study by the University of Michigan Transportation Research Institute, found that drivers who get involved in fatal crashes probably drive the same way around trucks as they do around other cars. It identified five driving behaviors that were factors in most of the fatal crashes:
• failing to stay in the lane or running off the • road; • failing to yield the right of way;
• driving too fast for conditions or above the speed limit;
• failing to obey signs and signals;
• driver inattention.
Where do crashes happen?
Rural vs. Urban
Most of Northern BC is considered “rural”, which for the traveling public means a number of things: longer distances to medical care, inadequate communications infrastructure, and longer wait times to get help if a crash occurs. The chart below illustrates that though there are far more crashes in urban areas than in rural regions, the ratio of fatalities to injuries demonstrates that collisions in rural areas are more likely to be fatal than in urban areas. One in every 136 (1:136) crashes in an urban area of Canada resulted in a fatality in 2002, according to Transport Canada, compared to 1 in 25 crashes in rural areas (1:25). Reasons for the increased fatality rates in rural areas include the higher rates of speed traveled on highways, increased public interface with commercial and resource vehicles, emergency response times, distance to hospitals, and multiple victims in a single crash.
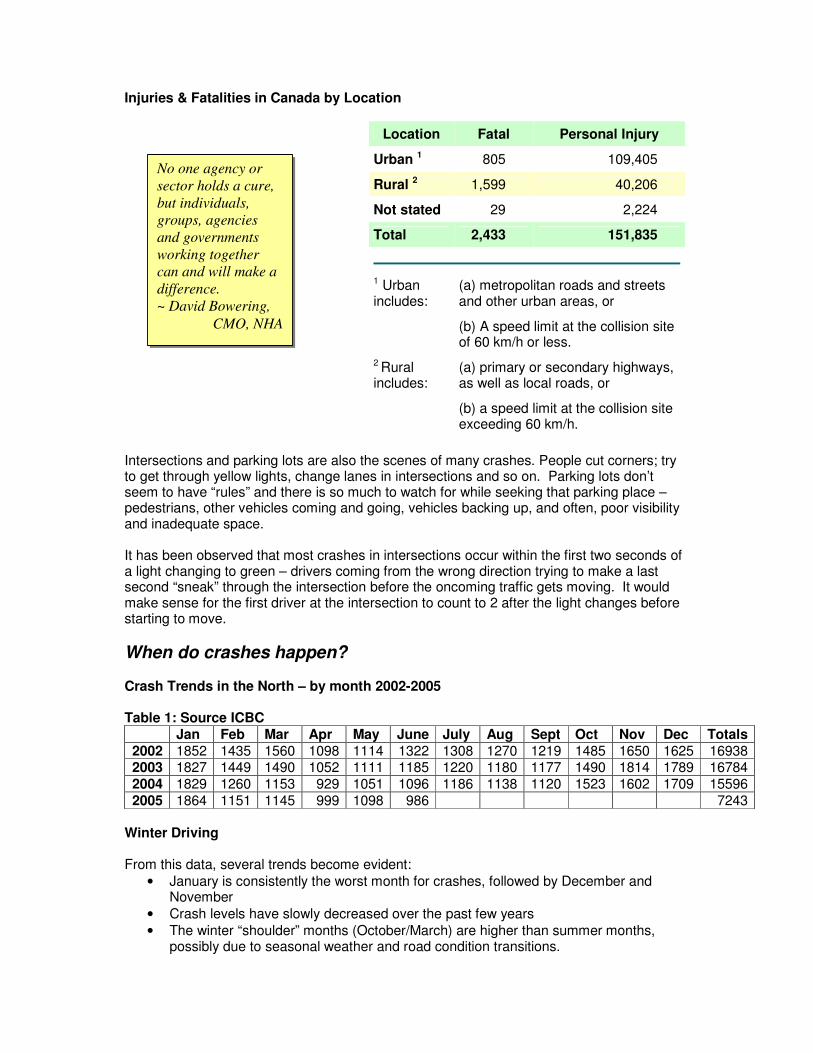
Injuries & Fatalities in Canada by Location
Location Fatal Personal Injury
Urban 1 805 109,405
Rural 2 1,599 40,206
Not stated 29 2,224
Total 2,433 151,835
1 Urban includes:
(a) metropolitan roads and streets and other urban areas, or
(b) A speed limit at the collision site of 60 km/h or less.
2 Rural includes:
(a) primary or secondary highways, as well as local roads, or
(b) a speed limit at the collision site exceeding 60 km/h.
Intersections and parking lots are also the scenes of many crashes. People cut corners; try to get through yellow lights, change lanes in intersections and so on. Parking lots don’t seem to have “rules” and there is so much to watch for while seeking that parking place – pedestrians, other vehicles coming and going, vehicles backing up, and often, poor visibility and inadequate space. It has been observed that most crashes in intersections occur within the first two seconds of a light changing to green – drivers coming from the wrong direction trying to make a last second “sneak” through the intersection before the oncoming traffic gets moving. It would make sense for the first driver at the intersection to count to 2 after the light changes before starting to move. When do crashes happen? Crash Trends in the North – by month 2002-2005 Table 1: Source ICBC Jan Feb Mar Apr May June July Aug Sept Oct Nov Dec Totals 2002 1852 1435 1560 1098 1114 1322 1308 1270 1219 1485 1650 1625 16938 2003 1827 1449 1490 1052 1111 1185 1220 1180 1177 1490 1814 1789 16784 2004 1829 1260 1153 929 1051 1096 1186 1138 1120 1523 1602 1709 15596 2005 1864 1151 1145 999 1098 986 7243
Winter Driving From this data, several trends become evident:
• January is consistently the worst month for crashes, followed by December and November
• Crash levels have slowly decreased over the past few years • The winter “shoulder” months (October/March) are higher than summer months,
possibly due to seasonal weather and road condition transitions.
No one agency or sector holds a cure, but individuals, groups, agencies and governments working together can and will make a difference. ~ David Bowering, CMO, NHA
13
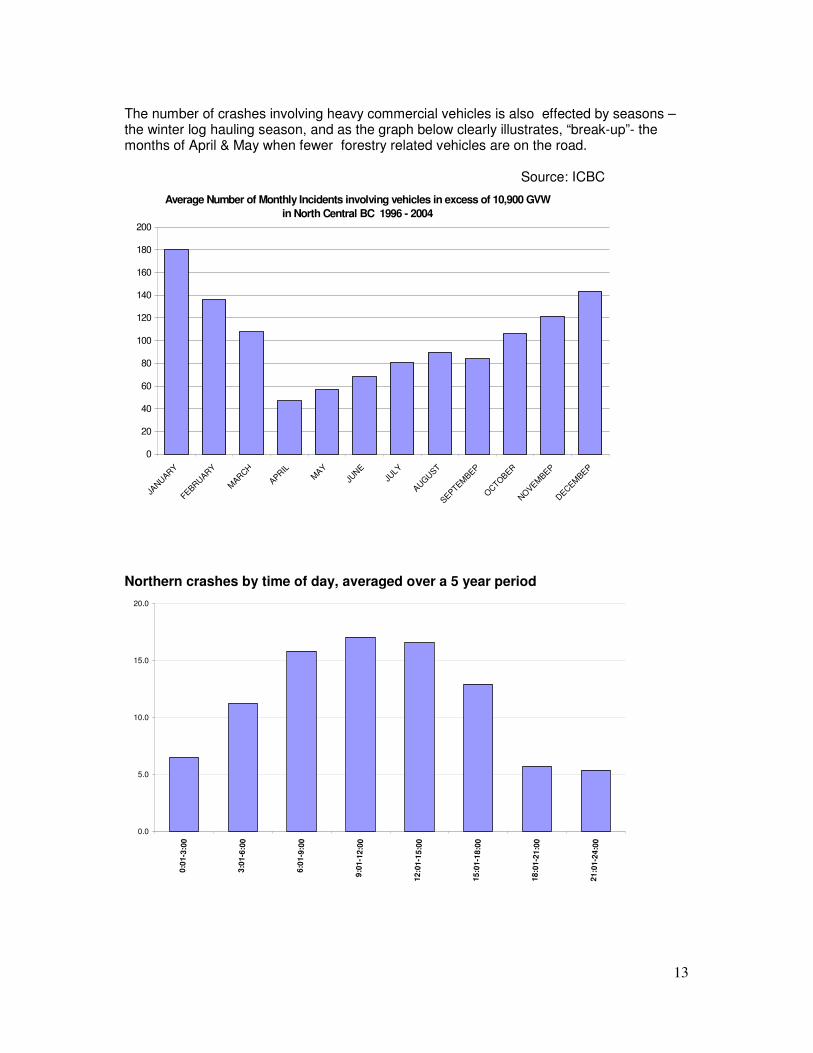
The number of crashes involving heavy commercial vehicles is also effected by seasons – the winter log hauling season, and as the graph below clearly illustrates, “break-up”- the months of April & May when fewer forestry related vehicles are on the road. Source: ICBC
Northern crashes by time of day, averaged over a 5 year period
0.0
5.0
10.0
15.0
20.0
0:01
-3:0
0
3 :0 1
-6:0
0
6:01
-9:0
0
9:01
-12 :
0 0
12:0
1-1 5
:00
1 5:0
1 -18
:00
18:0
1-2 1
:00
2 1:0
1-24
:00
0
20
40
60
80
100
120
140
160
180
200
JANUARY
FEBRUARY
MARCHAPRIL
MAYJU
NEJU
LY
AUGUST
SEPTEMBER
OCTOBER
NOVEMBER
DECEMBER
Average Number of Monthly Incidents involving vehicles in excess of 10,900 GVW in North Central BC 1996 - 2004
Top 3 Contributing Factors to Motor Vehicle Incidents during a calendar year based on 22,1222 cases recorded from 1996 - 2005 in North Central BC
0
200
400
600
800
1000
1200
JAN FEB MAR APR MAY JUN JUL AUG SEP OCT NOV DEC
Mon
thly
Inci
dent
s
Unsafe Speed Alcohol weather
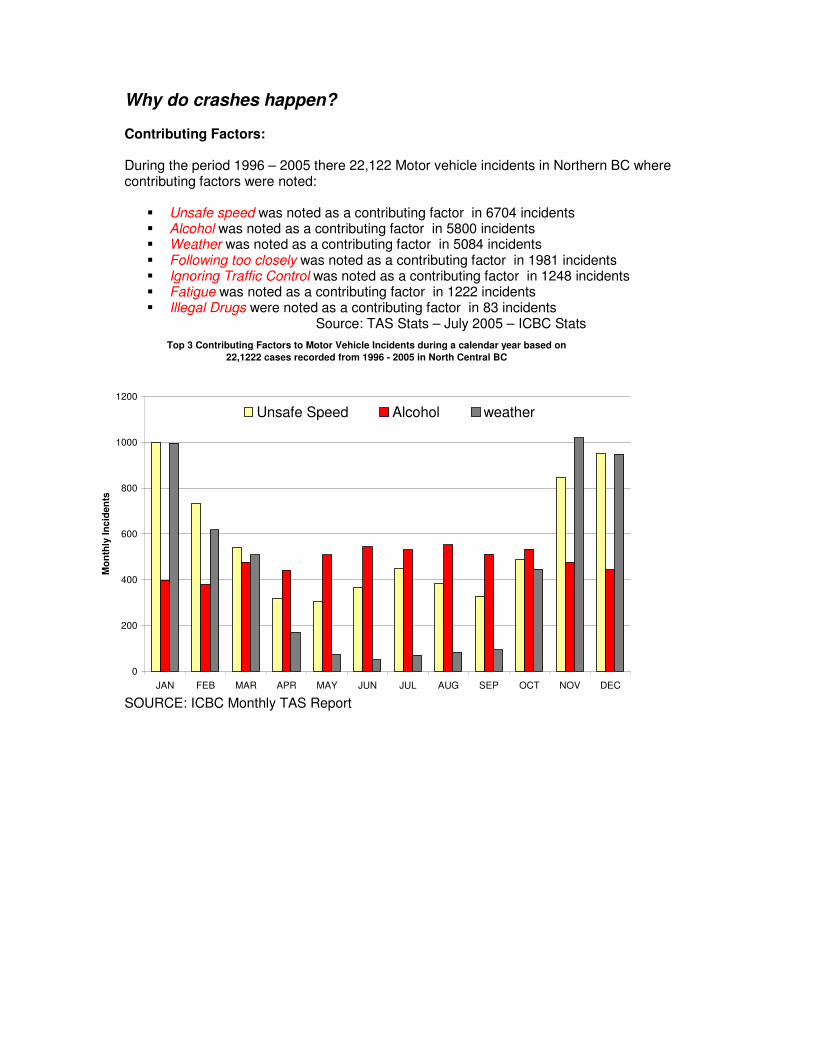
Why do crashes happen? Contributing Factors: During the period 1996 – 2005 there 22,122 Motor vehicle incidents in Northern BC where contributing factors were noted:
� Unsafe speed was noted as a contributing factor in 6704 incidents � Alcohol was noted as a contributing factor in 5800 incidents � Weather was noted as a contributing factor in 5084 incidents � Following too closely was noted as a contributing factor in 1981 incidents � Ignoring Traffic Control was noted as a contributing factor in 1248 incidents � Fatigue was noted as a contributing factor in 1222 incidents � Illegal Drugs were noted as a contributing factor in 83 incidents
Source: TAS Stats – July 2005 – ICBC Stats
SOURCE: ICBC Monthly TAS Report
Did you know? Allowing yourself enough time for a journey when the road conditions are less than ideal can save lives. A good rule of thumb, give yourself 7 minutes more time to reach your destination for every 10kms/hr you need to slow down to get there safely.
“Booze, belts & speed” According to a veteran RCMP officer, the top 3 contributing factors to injuries and fatalities due to motor vehicle crashes are “booze, belts and speed”. Impaired drivers still wreak havoc on our roadways. People still don’t put their seat belts on. And people still drive too fast for road conditions, traffic conditions and regulations, and their own levels of skill and control. Sadly, or fortunately, depending on how one views it, these same three factors are entirely changeable, through enforcement, education and engagement. People need to take personal responsibility for how fast they drive, the conditions in which they drive, and whether or not they utilize the devices that have been resoundingly proven to save lives and reduce injuries.
Not Just Booze A M.A.D.D. Canada report (2004) states 14% of Canadians reported using cannabis in the past year, double the rate reported in 1994 (7.4%). Reported youth rates show almost 30% of 15-17 year olds and just over 47% of 18-19 year olds used cannabis in the past year. (Health Canada, November 2004) In British Columbia, autopsies on 227 fatally injured drivers found 31% positive for only alcohol, 9% positive for drugs and 11% positive for both.
In Ontario, 1996 and 1997 surveys found people reporting driving within an hour of cannabis use in the past 12 months was 1.9% among the entire population; however, 9.3% among 18-19 year olds. Among cannabis users, the percentage reported driving within an hour of cannabis use was 22.8% (13.4% female and 28.2% male).
In Quebec, a study of fatally injured drivers (April 1999 to November2001) indicated 22.6% were positive for only alcohol, 17.8% were positive for only drugs, and 12.4% were positive for both.4
Weather
In British Columbia we seem to experience two driving seasons – winter and summer. The spring and the fall seasons are transitional, and depending on location and elevation, can still experience severe winter or summer conditions. Indeed, because Northern Health covers such a vast geographic area, a driver can encounter both sets of conditions in the same day!
Fog, severe rain and wind storms, and sticky wet snow are the main weather experiences of the coastal areas, often limiting visibility and making road conditions treacherous. The North experiences bitter cold, strong winds, and dry blowing snow. The wind and snow blowing across the roads can “polish” a
16
snow or ice covered roadway, like a sheet of glass, making it extremely slippery. In the Interior, fog, heavy rains, sticky wet snow, or dry blowing snow, and freezing rain are all common occurrences. A driver must be prepared to deal with every situation. According to enforcement and investigative agencies, drivers tend to put too much faith in their 4-wheel drives, their tires and their headlights. RCMP members cite many incidences of people overdriving their headlights (going faster than what their headlights can illuminate ahead), or relying on 4 wheel drive in order to maintain normal summer speeds on winter condition roads. Proper vehicle maintenance becomes critical for safe driving in severe weather conditions. All season radial tires just are not sufficient for driving on snow and ice. Proper tires, inflated to proper pressures, are absolutely necessary – they are the vehicle’s only contact with the road. Windshield wipers in poor condition reduce visibility, thereby increasing risk. Driving to suit weather and road conditions requires common sense, and discretion on the part of the driver, to assess the risk of travel, and the rates at which travel would be safe. The RCMP/Ministry of Highways closes roads upon occasion when conditions are very severe, but even though a road may be open, there still can be treacherous sections, or unexpected slippery spots (shade, over bridges, etc) Ultimately it is the driver’s responsibility to decide if travelling is safe, at what speed, in what condition of vehicle, and at what time of day. Sometimes the best decision would be to delay the travel rather than take the risk. Unfortunately, inexperienced drivers don’t have the appropriate knowledge and judgement needed to safely drive in harsh conditions, and as a result, are more likely to end up in crashes. Following too closely Following too closely is listed among the top 3 contributing factors to crashes in many of the communities in BC (ICBC: Community Crash Profiles, www.icbc.com). The distances needed to stop safely depend on the speed of travel and the reaction time of the driver and the weight of the vehicle being driven. Drivers need to be aware of the distance they need between themselves and the vehicles or obstacles in front of them.
There are three things that add up to total stopping distance: Perception Distance + Reaction Distance + Braking Distance = Total Stopping Distance
Perception distance. This is the distance the vehicle travels from the time the eyes see a hazard until the brain recognizes it. The perception time for an alert driver is about 3/4 second. At 90 kmph, the vehicle travels 60 feet in 3/4 second.
Reaction distance. The distance traveled from the time the brain tells the foot to move from the accelerator until the foot is actually pushing the brake pedal. The average driver has a reaction time of 3/4 second. This accounts for an additional 60 feet traveled at 90 kmph. Braking distance: The distance it takes to stop once the brakes are put on.
At 90 kmph on dry pavement with good brakes it can take a heavy vehicle about 170 feet to stop. It takes about 4 1/2 seconds.
Total stopping distance: At 90 kmph it will take about 6 seconds to stop and the vehicle will travel about the distance of a football field. (60 + 60 + 170 = 290 feet).
17
Did you know? A “microsleep”, one of those naps that last 4 or 5 seconds, is long enough for you to travel more than the length of a football field at highway speed. ~ Worksafe Alberta: Exhausted or Drunk, Behind the Wheel it Makes No Difference
Did you know? One man in the US had so many accidents related to food on his driving record. That a “restraining order" had been issued against having anything edible within his reach while driving. - Insure.com
Ignoring Traffic Controls Stop means stop. Yet every day drivers “roll through” stop signs, try to rush through a late yellow light at an intersection, and otherwise ignore the traffic controls that are put in place to regulate traffic flow. Roadways are engineered to be travelled at certain speeds. Exceeding those speeds increases the risk of losing control of the vehicle. Curves often have control signs indicating the maximum safe speed at which the curve should be negotiated, yet drivers will “cut to the inside” or try to take the corner as fast as they can.
Construction zones are flagged a good distance before the actual location of the work being done in order to give the driver plenty of warning of obstruction, narrowing to single lane traffic, slow-downs or possible delays. Yet every year crashes occur in construction zones, when a vehicle approaches a construction area too quickly, or smashes into a line-up of vehicles waiting to get through. The ultimate irony in drivers ignoring traffic controls are the deaths of “flag-persons”, the traffic controllers who stand in the roadway to direct traffic. Fatigue Driving long hours can make a person feel tired, sleepy, irritable, depressed, or giddy. Fatigued persons tend to react more slowly, fail to respond to things going on around them, are unable to respond correctly, are not able to concentrate, exercise poor judgement, and have a greater tendency to take risks.5 The long distances and hours many northerners drive create potential dangers due to driver fatigue. An article in the New England Journal of Medicine, “The Perils of Drowsy Driving”, states that “studies have identified fatigue as the leading cause of truck crashes”.6
The U.S. National Highway Traffic Safety Administration has long recognized drowsy driving as a “significant and complex public health threat”.7 The effect of lost sleep accumulates over time and does not dissipate. This means that with the same insufficient amount of sleep each day, the strength of the tendency to fall asleep while driving progressively increases.8 A study of long-haul truckers and sleep deprivation concludes, “long-haul truck drivers obtained less sleep than is required for alertness on the job.”9 Other studies have shown that drivers who drive long distances over long periods of time (1 year or more) are more likely to experience daytime fatigue, daytime tiredness, unrestorative sleep, hypertension and overweight.10 Sleep apnea is a condition in which breathing stops or hypoventilation occurs during sleep. People with sleep apnea are typically overweight, have loud irregular snoring, and are tired during the day because of their disturbed sleep patterns. The relationship between sleep apnea and traffic accidents has been found to be significant11, even when other circumstances such as alcohol consumption, age, body-mass index, driving experience, sleep schedule, use of drugs and personal driving history are factored in. Study results show that the rate of crashes among persons with sleep apnea is three to four
18
times the rate among persons without the condition. Unfortunately, an estimated 80% of cases of sleep apnea are undiagnosed. Many professional drivers, particularly logging truck drivers, work upwards of 12 hours per day. WorkSafeBC and the BC Forest Safety Council’s Forestry TruckSafe Initiative are currently surveying logging truck drivers in order to identify issues and strategies to reduce trucker fatigue. Wildlife
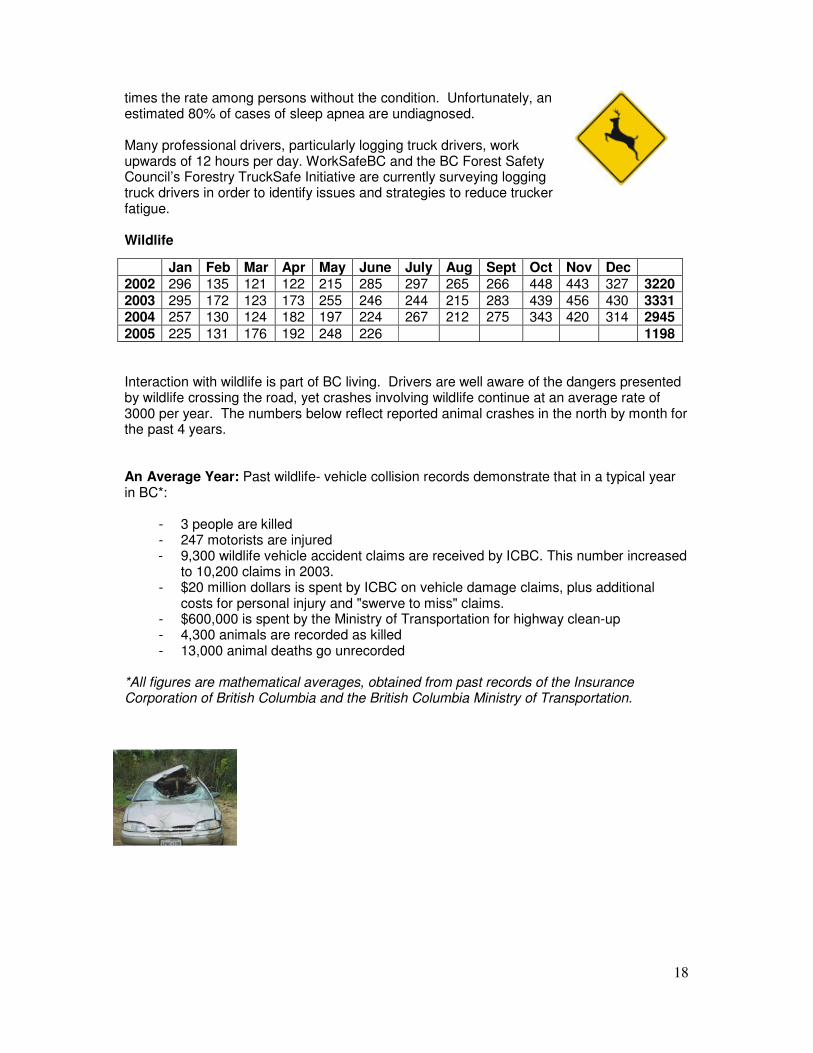
Interaction with wildlife is part of BC living. Drivers are well aware of the dangers presented by wildlife crossing the road, yet crashes involving wildlife continue at an average rate of 3000 per year. The numbers below reflect reported animal crashes in the north by month for the past 4 years. An Average Year: Past wildlife- vehicle collision records demonstrate that in a typical year in BC*:
- 3 people are killed - 247 motorists are injured - 9,300 wildlife vehicle accident claims are received by ICBC. This number increased
to 10,200 claims in 2003. - $20 million dollars is spent by ICBC on vehicle damage claims, plus additional
costs for personal injury and "swerve to miss" claims. - $600,000 is spent by the Ministry of Transportation for highway clean-up - 4,300 animals are recorded as killed - 13,000 animal deaths go unrecorded
*All figures are mathematical averages, obtained from past records of the Insurance Corporation of British Columbia and the British Columbia Ministry of Transportation.
Jan Feb Mar Apr May June July Aug Sept Oct Nov Dec 2002 296 135 121 122 215 285 297 265 266 448 443 327 3220 2003 295 172 123 173 255 246 244 215 283 439 456 430 3331 2004 257 130 124 182 197 224 267 212 275 343 420 314 2945 2005 225 131 176 192 248 226 1198
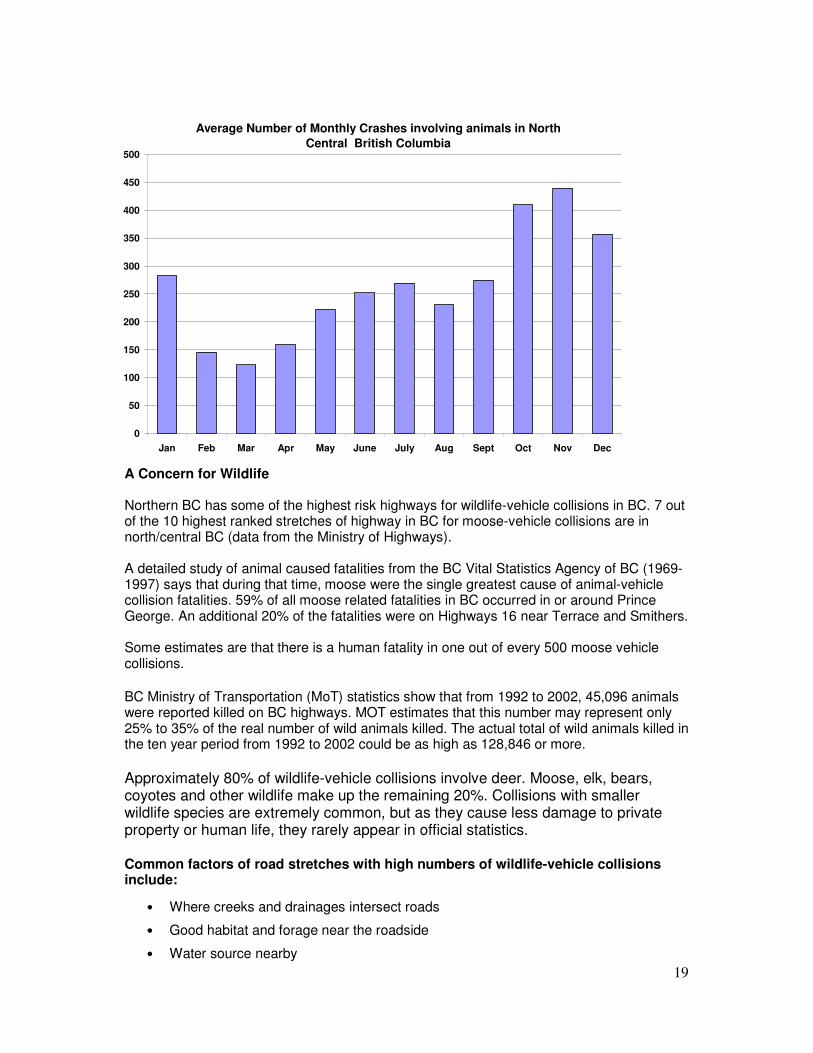
19
A Concern for Wildlife Northern BC has some of the highest risk highways for wildlife-vehicle collisions in BC. 7 out of the 10 highest ranked stretches of highway in BC for moose-vehicle collisions are in north/central BC (data from the Ministry of Highways). A detailed study of animal caused fatalities from the BC Vital Statistics Agency of BC (1969-1997) says that during that time, moose were the single greatest cause of animal-vehicle collision fatalities. 59% of all moose related fatalities in BC occurred in or around Prince George. An additional 20% of the fatalities were on Highways 16 near Terrace and Smithers. Some estimates are that there is a human fatality in one out of every 500 moose vehicle collisions.
BC Ministry of Transportation (MoT) statistics show that from 1992 to 2002, 45,096 animals were reported killed on BC highways. MOT estimates that this number may represent only 25% to 35% of the real number of wild animals killed. The actual total of wild animals killed in the ten year period from 1992 to 2002 could be as high as 128,846 or more.
Approximately 80% of wildlife-vehicle collisions involve deer. Moose, elk, bears, coyotes and other wildlife make up the remaining 20%. Collisions with smaller wildlife species are extremely common, but as they cause less damage to private property or human life, they rarely appear in official statistics.
Common factors of road stretches with high numbers of wildlife-vehicle collisions include:
• Where creeks and drainages intersect roads
• Good habitat and forage near the roadside
• Water source nearby
0
50
100
150
200
250
300
350
400
450
500
Jan Feb Mar Apr May June July Aug Sept Oct Nov Dec
Average Number of Monthly Crashes involving animals in North Central British Columbia
20
Did you know? There are three things that add up to total stopping distance: Perception Distance + Reaction Distance + Braking Distance = Total Stopping Distance
• Long, wide, straight stretches of road
The first three factors are self evident. The availability of forage and water close to the road is likely to increase the presence of animals.
The fourth factor is more troublesome. One assumption is that when there are good road conditions - long, wide and straight - motorists tend to feel safer and more confident, and therefore accelerate. This increase in speed reduces the reaction time of the driver when an animal is seen on the road.
Distractions
Driving requires alertness and concentration. Yet on long trips drivers tend to add extra activities to their trip to relieve boredom, or to help them stay awake. Studies show that distractions of any kind, even talking to passengers in the vehicle, reduce concentration and slows reaction time. With new technologies being added to vehicles, the number of activities requiring the driver’s attention has increased, to the point where drivers are paying attention to everything but the road.
Distractions in cars are considered the cause in 25 percent of the more than 6.3 million auto crashes in the US. According to NHTSA, "distraction was most likely to be involved in rear-end collisions in which the lead vehicle was stopped and in single-vehicle crashes." What makes distraction such a problem is the confluence of the distraction, such as eating, and the unexpected occurrence of events on the road, such as a sharp curve or a driver stopped ahead of you.
According to a State Farm Insurance Survey, eating while driving ranks as the No. 2 driving distraction. Fifty-seven percent of drivers surveyed say they eat and drive. The No. 1 distraction noted by 62 percent of surveyed drivers is tuning the radio, and No. 3, noted by 56 percent of drivers, is turning around to talk with passengers. Interestingly, only 29 percent of drivers surveyed listed talking on a cell phone as a distracting activity.12
Did you know? Eating while driving is dangerous, but what you eat while on your travels can be dangerous too. Many people eat junk food as they travel, and drink coffee or pop. Junk food is full of sugar and carbohydrates, which elevate your blood sugar levels which lead to a surge in insulin followed by low blood sugar… and you get sleepy. Drink water, and stop every couple of hours to stretch your legs and get some fresh air. The few minutes it will take could save a life.
Cell phones (and radios, other communication devices) The risk of a crash when using a cell phone is 4.3 times greater than the risk when a cell phone is not being used, according to a 1997 study.13 Cell phone use has proliferated since 1997, and several countries have banned the use of cell phones while driving. Not only is the risk present during the actual call, but this same study of 26,798 calls found that the risk is considerably increased close to the time around the call itself (4.8 for calls placed within 5 minutes of the crash, compared to 1.3 for calls placed more than 15 minutes before the collision). The use of hands-free technology offered no safety advantage over hand-held units. But the cell phones came in handy post-crash, to call for help! Sound systems Today’s sound systems are more complex and louder than ever. Tuning a radio or satellite radio, installing cd’s or cassettes, searching for the desired track, adjusting volumes, all take the driver’s eyes and attention off the road. To offset this concern, many automobile designers are now installing volume and search controls in the steering wheel.
Volume levels are of particular concern. Often one can hear a vehicle coming long before one sees it – and it’s not the sound of the vehicle’s engine that’s heard. So called “boom boxes” have volume and base level capabilities far beyond what’s necessary to hear the music. And the driver and passengers inside can’t hear what’s going on outside their vehicle, such as the air horn of a commercial truck, a train whistle, or the sirens of emergency vehicles.
Eating Eating while driving means that the driver does not have one, or even both, hands on the wheel. Hot food and beverages spill, and drivers react by trying to clean up, even while driving. The automatic human response is to jerk away and tend to the injury.
More than 70% of drivers surveyed by State Farm Insurance said they eat while they drive. Vehicles with standard transmissions require one hand working the shifter. If the driver has food in one hand, and the other on the shifter, what’s holding the wheel?
The quality of food eaten during travel is also a concern. Too many carbohydrates and sugar contribute to high blood sugar levels which are quickly followed by low blood sugar and sleepiness. Too much caffeine and salt contributes to high blood
pressure. Too much cholesterol (greasy food) contributes to heart disease. Many crashes are attributed to emergent health events such as strokes and heart attacks, and the driver’s diet and lifestyle are major contributing factors to those events. For commercial drivers or drivers whose job requires a great deal of road travel, nutrition and exercise are key to road safety and road health.
22
Did you know? Passenger car drivers were found to have contributed to fatal car-truck crashes 74.1% of the time. -University of Michigan Transportation and Satety Institute
What Works? Common themes among world leaders’ road safety strategies
� Engineering- road design, removal of hazards, enhancing signage, rumble strips, safety of curbs, road maintenance
� Enforcement- seat belts, speeding, drunk driving, targeted strategies based on research, child safety seats
� Education – improved driver training & certification, proper use of child safety seats, helmet use, pedestrian awareness, cyclist awareness, commercial driver certifications, seat belt use
� Engagement & collaboration- coalitions of government, public and private sectors, and citizens; sharing responsibilities for the roads among road users; partnering on every aspect of transportation, from engineering, cost sharing and usage.
� Research- building a repository of information, research and analysis for sharing best practices and outcomes of specific strategies.
� Promotion of a culture of road safety- in the words of the BC Forest Safety Council’s TruckSafe motto, “unsafe is unacceptable”. When the general population begins to embrace a culture of road safety, and further to that, “road health”, pressure builds on government, industry and every road user group to come up with solutions, both legislative and regulatory, and in the area of personal behaviour changes.
What are some of the other provinces doing about the issue?
• Ontario set up its road Safety Think Tank in October 2004, which consists of the ministries of Transportation and Labour, the Insurance Bureau of Canada, the Transportation Health and Safety Association of Ontario, and the Ontario Workplace Safety and Insurance board. This consortium is collaborating to focus on social marketing, education, legislation, enforcement, and infrastructure.
• Nova Scotia’s Workers’ Compensation Board is partnering with the Nova Scotia Trucking Safety Association to administer a Certificate of Recognition to good performers in the province’s trucking industry. The Nova Scotia Trucking Safety Association facilitates the deliver of quality, effective training programs to ensure a safe working environment and a skilled workforce in the trucking industry, in compliance with industry and government regulation (2002). WCB Nova Scotia now jointly signs the Certificate of Recognition (2004). Over the past 8 years WCB rates have been reduced by 40% in the forestry sector.
• Alberta released the report “Saving Lives on Alberta’s roads” (June 2004), which details recommendations for a comprehensive approach to road safety, with links among education, awareness, enforcement, engineering, legislation and standards, and social policy areas. Alberta’s Ministry of Transportation is now implementing a voluntary, one year diver training program, which will certify participants as professional truck drivers. The program will provide skills in driving, cargo securement, fatigue management, dangerous goods management, vehicle maintenance, and safe operation in all types of terrain and weather.
What are other countries doing about the issue?
• The United Sates is focusing considerable enforcement efforts on increasing seat belt use and decreasing drinking and driving. Their target is a 20% reduction in total road user fatalities and injuries by 2008 compared with 2000 figures and a 50% reduction in commercial vehicle related deaths and injuries by 2010.
23
• Great Britain has set up a year-round road safety, public awareness campaign called THINK!, which focuses on child safety, vulnerable road users, drinking and driving, and related road use issues.
• Sweden’s Vision Zero program (which is also the country’s long-term goal) focuses on special safety measures for the most dangerous roads and safer traffic movement in built-up areas, emphasizing road user responsibility, safer cycling conditions, and compulsory use of studded winter tires.
• The Netherlands has focused on sharing of costs and responsibilities among the national, provincial, and municipal governments as well as the private sector. Some key activities include modifying all road user behaviour, improving road and motorway infrastructure, improving driver training, enhancing police enforcement, and reinforcing the safety culture.
• Norway, like Sweden, is implementing the Vision Zero concept. Norway is targeting measures to regulate driver behaviour such as reducing speed limits on the most dangerous roads, banning the use of hand-held cell phones while driving, and increasing the demerit points for driving offences.
Did you know? At 100 kmph it takes 100 meters for a loaded tractor-trailer unit to stop. A straight truck (less than 33,000 lbs) needs 95 meters to stop. A smaller commercial vehicle, such as a 5 ton cargo van, needs 65 meters to stop safely at 100 km/ph speeds. Empty trucks actually require greater distances to stop because empty vehicles have less traction and are more likely to bounce or have the wheels lock up - Stopping Power, by Paul Hartley
FAQ’s from WorkSafeBC Why is the trucking industry important to BC and Canada? In 2002, BC’s trucking industry:
• Represented about 15.7% of Canada’s commercial transportation industry
• Contributed 5.4% of B.C.’s GDP In 1999, more than 90,000 people in BC worked in the transportation and storage industry, with trucking representing 28% of this industry sector’s workforce. Most of the industries within this group are involved in the transportation of either freight or passengers. What are some of the factors that contribute to serious injuries and fatalities?
• Unrealistic scheduling demands on trucking firms, drivers, or shippers and receivers
• Driver fatigue • Overexertion • Falls from elevation • Inadequate facilities for safe transfer • Improperly secured truck loads • Roads design and maintenance • Truck maintenance frequency • Driving without due care • Unsafe speed • Failing to yield right of way
What are the general claims and fatality statistics for the trucking industry? In the years 2000 and 2004, truck driver injuries in BC represented about:
• 114 fatalities. Nine of these were young workers • 533 serious injuries • 21,700 time loss claims. These are claims that have had costs
such as wage loss or a permanent disability award. Medical aid only claims are not included.
• 650,900 work days lost. When prior years’ claims are included, the total work days lost is 1,181,000.
• $101 million in claims costs. These claim costs reflect the actual payments and awards from 2000 to 2004, not the full (e.g., does not include administrative) and future cost (liabilities) of claims. When prior year costs are included, this total is $298 million in claim costs.
How is safety climate defined? The safety climate of a company is an assessment of employees’ perceptions (or shared understanding) of the company’s safety policies and procedures, compared to actual safety practices and behaviours. It indicates how workers’ perceive the priority given to safety over production in their workplace. “Safety culture” and “safety climate” are sometimes used interchangeably. Safety culture can be defined as the shared values, beliefs, assumptions, and norms that govern how a company makes decisions about safety and the attitudes of individuals and groups toward
25
safety. Some regard safety climate as a measure of the safety culture of an organization because it examines workers’ perceptions of the priority of safety in their workplace. Research has found a link between a company’s safety climate and employees’ safety behaviour and injuries. Company leaders create safety climate and culture. Therefore, managers and supervisors are key to improving safety culture and reducing workplace injuries in an organization. Won't this plan cost trucking companies more money at a time when costs are already high? Although profit margins are narrow in the trucking, it has been proven that health and safety programs add to the profit margin. As employers and drivers adopt and implement Codes of Practice or safety performance agreements, economic incentives will reward well-performing trucking companies committed to health and safety, and encourage improvements in the performance of other trucking companies.
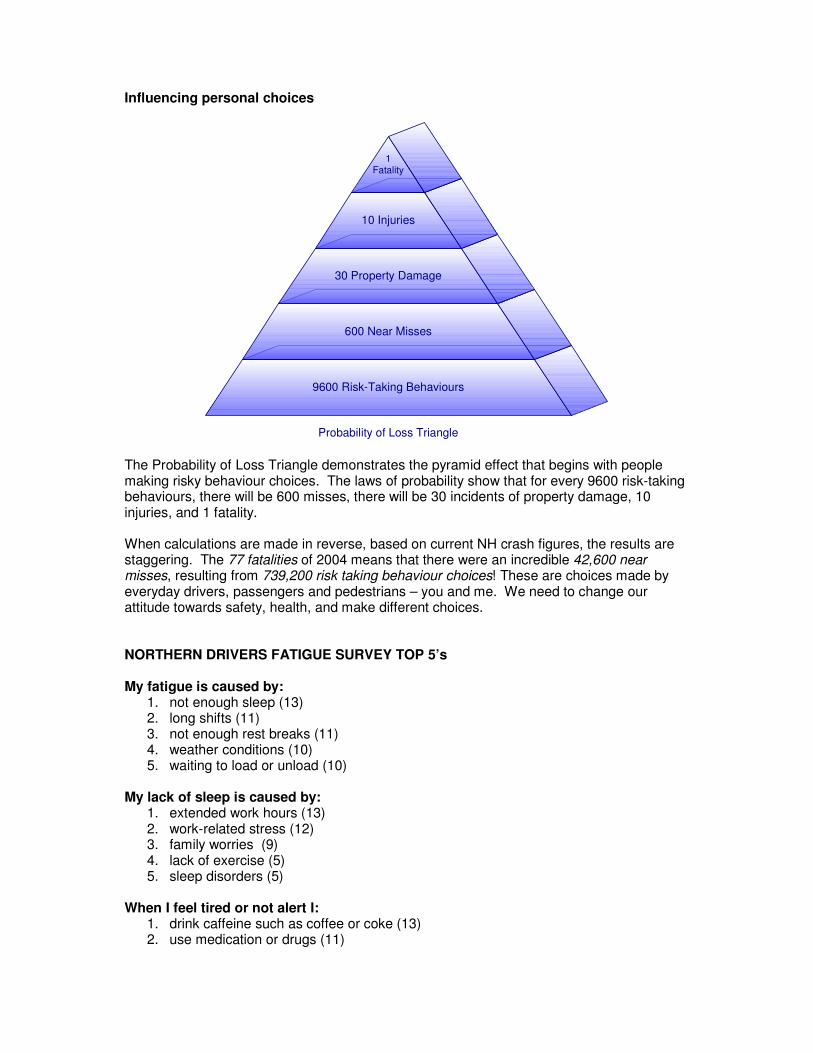
Influencing personal choices
9600 Risk-Taking Behaviours
600 Near Misses
30 Property Damage
10 Injuries
1Fatality
Probability of Loss Triangle The Probability of Loss Triangle demonstrates the pyramid effect that begins with people making risky behaviour choices. The laws of probability show that for every 9600 risk-taking behaviours, there will be 600 misses, there will be 30 incidents of property damage, 10 injuries, and 1 fatality. When calculations are made in reverse, based on current NH crash figures, the results are staggering. The 77 fatalities of 2004 means that there were an incredible 42,600 near misses, resulting from 739,200 risk taking behaviour choices! These are choices made by everyday drivers, passengers and pedestrians – you and me. We need to change our attitude towards safety, health, and make different choices. NORTHERN DRIVERS FATIGUE SURVEY TOP 5’s My fatigue is caused by:
1. not enough sleep (13) 2. long shifts (11) 3. not enough rest breaks (11) 4. weather conditions (10) 5. waiting to load or unload (10)
My lack of sleep is caused by:
1. extended work hours (13) 2. work-related stress (12) 3. family worries (9) 4. lack of exercise (5) 5. sleep disorders (5)
When I feel tired or not alert I:
1. drink caffeine such as coffee or coke (13) 2. use medication or drugs (11)
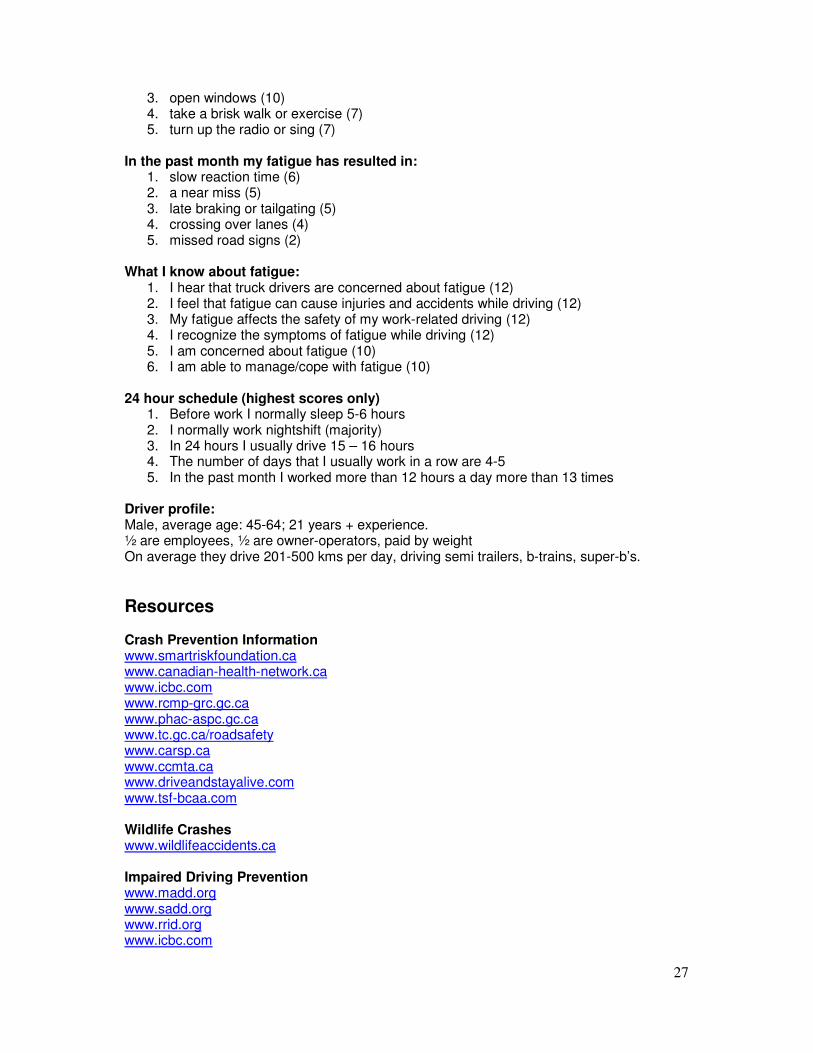
27
3. open windows (10) 4. take a brisk walk or exercise (7) 5. turn up the radio or sing (7)
In the past month my fatigue has resulted in:
1. slow reaction time (6) 2. a near miss (5) 3. late braking or tailgating (5) 4. crossing over lanes (4) 5. missed road signs (2)
What I know about fatigue:
1. I hear that truck drivers are concerned about fatigue (12) 2. I feel that fatigue can cause injuries and accidents while driving (12) 3. My fatigue affects the safety of my work-related driving (12) 4. I recognize the symptoms of fatigue while driving (12) 5. I am concerned about fatigue (10) 6. I am able to manage/cope with fatigue (10)
24 hour schedule (highest scores only)
1. Before work I normally sleep 5-6 hours 2. I normally work nightshift (majority) 3. In 24 hours I usually drive 15 – 16 hours 4. The number of days that I usually work in a row are 4-5 5. In the past month I worked more than 12 hours a day more than 13 times
Driver profile: Male, average age: 45-64; 21 years + experience. ½ are employees, ½ are owner-operators, paid by weight On average they drive 201-500 kms per day, driving semi trailers, b-trains, super-b’s. Resources Crash Prevention Information www.smartriskfoundation.ca www.canadian-health-network.ca www.icbc.com www.rcmp-grc.gc.ca www.phac-aspc.gc.ca www.tc.gc.ca/roadsafety www.carsp.ca www.ccmta.ca www.driveandstayalive.com www.tsf-bcaa.com Wildlife Crashes www.wildlifeaccidents.ca Impaired Driving Prevention www.madd.org www.sadd.org www.rrid.org www.icbc.com
28
www.cancelled.ca Commercial Vehicles www.cantruck.com www.bctrucking.com www.safety-council.org www.worksafebc.ca www.bcforestsafe.org Best Practices www.safespeed.org (UK) www.thinkroadsafety.gov.uk (UK) www.ntf.se/engl/english.htm (Sweden) References ������ � ��� �� � ���� � �� � � �� � ���� �� � �� ��� � ��� �� ��� �� �� � �� ��� � ���� � ����� � � �� � ������!� � � �� � �" # �$ � �� % � � �� � �� � &��' ����" � �( � �� ��) � % �� ���* � �+�, � -��. � ��//, �� +���, 01��� 1439; Evans, Leonard�3���� ( 2 �3 �. �4 �" �� � ��$ � ��� �. �" ���� ��� � ���� �� �4 �� " �� �� � � �� �5 � 6 7 � �8 ����������� 4 � 7 ���� � ������7 7 7 +6 � � +� �9���5 ��� % � � � �� � �� ��� ��� �� � �8 � � ��� � �8 " � �� �: �� �� ��� � � � �� � �� �' % �� ��� �;���!� � �2 ���" �� ��. �� 7 " � �. ��4 �� � &��� � �$ 7 �3 � � � � � �) � % �� ��� ��( � �� �� ��* � �% 6 ��
�������, , -<, -01�-0���� �������//-+�-����!� � 6 6 � � �� <�= ��� � > �= ��� � ?&��$ ��� � ��� �� � 7 � �� � ���� �� � 6 �� �" �� ��� � ��
�������$ � � " ��� � � �" �� ��3 6 �� � � � �( � �� �� +�* � ���9@�A��� ������ � 9�� ��, �1�, ;+�0����� � �2 ���" �� ��. �� 7 " � �. ��4 �� � &��� � �$ 7 �3 � � � � � �) � % �� ��� ��( � �� �� ��* � �% 6 ��
�������, , -<, -01��-0���� �������//-+�/����!� � �� � �� ��B � � � 1� % ��� �% � 8 �. �4 �" &��$ 7 �3 � � � � � �) � % �� ��� ��( � �� �� ��* � �% 6 ��
��������, , -<-991-;�+�� �������//-��� ����!� � � � � �� � 1. �" � �� � � �' � �� �� � ��� � � 6 6 �� � ��B � � � �� % ��� �% � 8 ��
�������. ��4 �" &�� �� �� � �� �� � � " � �� �+���� � � �� �� �� � �. �" � �� �" � ��� �� � � � �� " �� � ��
������� � � ��� ���� �� � ���//�+�������!. ��4 �� � �7 ��� �� � �� � &��$ 7 �3 � � � � � �) � % �� ��� ��( � �� �� ��* � �% 6 �, �� <00�100, ���
��������( �� � ��0���///��������� �� <CC�� �� +�� " % � +� � 6 C % �� C: � �� � � �� �+� �6 ���, ����!� " " � � � ��� � �: �7 � � ��% � ��� � � � � � ��" � � � �( � �� ��* � �� � � � ���" � � " ��$ 7 ��
��������3 � � � � � �) � % �� ��� ��( � �� �� ��* � �% 6 �, , 9<�9, 1�90��5 : �% �� ��, ���//-�