Embed Size (px)
Citation preview

AccessData Workshop May 21-23, 2007
Evaluation Report October 20, 2007
Prepared by
Susan Lynds and Susan Buhr Cooperative Institute for Research in Environmental Sciences (CIRES)
University of Colorado

2
Table of Contents
Page
Executive Summary 3
Recommendations 4
Introduction 5
Evaluation Procedures 6
Participant Data 7
Data Use Survey 12
Daily and Final Surveys 20
Follow-up Interviews 44
Appendix I—Evaluation Instruments 46
Appendix II—Agenda 57

3
Executive Summary
This report is intended to inform members of the AccessData Workshop Team for the planning of future workshops. The main points are listed below. Schedule
• Participants often had expertise in more than one of the five primary professional roles—curriculum development, data expertise, education, software tools, and scientific research. Education was the most common area of experience. Because of this rich combination of knowledge, disaggregation of data by professional roles was not productive. However, expertise on individual teams was assessed and proved to be well covered by all roles.
• Participants value their team breakout time very highly. Although the breakout time has been extended from previous workshops, many attendees would still like more time, spread out fairly evenly over all three days.
• The Tool Time sessions were very well received; many suggestions for improving the effectiveness of Tool Time were offered.
• Participants valued the talks, especially the Tuesday talk, but generally thought there could have been less time spent on talks.
• Participants generally felt their groups were successful and well facilitated. Teams with at least one member familiar with the AccessData process and EET chapter development appreciated their expertise.
• Respondents tended to think the workshop was very well balanced. Although not as strongly expressed as in previous workshops, attendees still wished for greater education emphasis throughout the workshop.
• The poster session was moderately appreciated by attendees; several people appreciated having the session include demos as well as the traditional posters.
• As has been seen in years past, the final report-out is not highly rated. No suggestions to improve it were received, however.
• Participants offered a number of schedule modification ideas to allow more time for breakouts and tool sessions; a few (as in years past) suggested the workshop be extended to three full days.
• Participants commented on many plans they had to carry the workshop ideas into their daily work. These plans were varied, detailed, and numerous.
Data Use
• Attendees successfully used data for many different learning goals, especially interpreting satellite imagery, climate, environmental science, understanding the scientific method, and pattern recognition.
• Satellite imagery data and weather/climate observations were the most commonly used types of data. Image, text/ASCII, and GIS were the most commonly used formats.
• NASA, USGS, and NOAA were the main data sources attendees had used. • Almost all attendees had had to modify data before it was used by end-users, with subsetting the data being the
most common modification cited. End-users most commonly performed graphing, visualization/imaging, and plotting/mapping procedures on the data.
• Almost all respondents had been unsuccessful using a dataset in the past. Respondents cited the primary barriers as being incomplete data, poor documentation, and the inability to locate the data that was sought (discoverability).
• Preferred methods of instruction for learning about data use were step-by-step instructions, examples, reference manual/documentation, and online tutorials.
Workshop Logistics
• Team representatives who were interviewed valued the pre-workshop activities that were encouraged this year.
Many suggested enhancements to this process that would increase the productivity of the teams, including early assignment of team members and topics, more interaction between all team members before the workshop, and easy availability of information on the AccessData process and EET chapters for those not familiar with them.
• The location, facilities, and organization of the meeting were considered good to very good. The quality and quantity of the food were especially remarked upon.
• The website, swiki, and printed materials were all considered useful.

4
Recommendations Workshop
Consider extending the workshop to three full days to allow for a less intense schedule. Spread the breakout time evenly across all three days, as much as possible. Consider moving the poster session to Sunday evening to allow more breakout time on Monday.
Consider having shorter keynote talks, and eliminating the Wednesday talk in favor of more breakout time.
Continue Tool Time sessions, spreading them out in an even balance with the breakout sessions. Improve the
organization of the tool presentations to allow sufficient bandwidth during sessions and strongly encourage participants to have downloaded the tools beforehand.
Finalize team members and topics as early as possible. Continue this year’s effort to provide active support from
AccessData team members to ensure all teams are completing pre-workshop activities, such as communicating, practicing use of the wiki, and understanding the AccessData process and how to construct an EET chapter.
Including demos with the poster/share session is helpful; refreshments and an informal atmosphere are
appreciated.
Assigned experienced Curriculum Developers were appreciated. Consider expanding their responsibilities to include regular status reports to team members after the workshop to keep things moving.
Consider adding a wrap-up telecon with all team members and an AccessData team member at some point within
six months of the end of the workshop.
Returning teams appreciate the ability to “hit the ground running.” Data for Educational Use
Data providers should consider three primary barriers to educational use of their data—discoverability, incomplete data sets, and poor documentation.
Many users process data through converting into ASCII or Excel files. Data managers may want to consider how
easy this process would be for their educational data users.
To enhance educational use of their products, data providers and tool developers should consider using step-by-step instructions and examples in their online documentation, as well as providing a reference manual.
Evaluation
Ensure that evaluation instruments are updated as the schedule becomes finalized. Although professional role disaggregation is no longer appropriate in the evaluation, investigate whether any other
characteristics would be beneficial for isolated analysis in future years, such as team membership. Team membership could be gathered on the daily and the final surveys instead of just the final survey.
Daily questionnaires should ask two separate questions about the Tool Time sessions; one should ask all
respondees which Tool Time sessions they attended and another should be the inclusion of Tool Time sessions among the “most valuable aspects” of the day.

5
Introduction This report provides information to AccessData Workshop organizers to help them understand the degree to which the meeting (as perceived and experienced by participants) met goals and to inform planning for future workshops. Presented below are a description of the conference; the methods by which the evaluation data were elicited, compiled, and analyzed; information on the participants who responded to the surveys; a presentation of responses to survey items, and a summary of follow-up interviews with one representative from each team. The Appendices include the evaluation instruments and the workshop agenda. The goals of the AccessData project are to
• Increase the availability of and accessibility to high-quality data-rich educational materials and • Increase communication among professional roles to facilitate educator and student use of Earth science
datasets. The website for AccessData is http://serc.carleton.edu/usingdata/accessdata/index.html.
AccessData Workshops bring together a wide range of professionals who have a stake in getting data used in educational settings--Earth science data providers, data access and analysis tool experts, scientists, curriculum developers, and educators. To reach the project goals, all participants work together in the workshop process to explore and address issues regarding data use. Participants are chosen for their contributions of data, tools, or scientific and educational expertise needed for the development of a series of Earth Exploration Toolbook chapters. The 2007 workshop was held at the Marlborough Conference Center west of Boston, Massachusetts, on May 20-23, 2007. There were 61 participants, each assigned to one of 11 teams. Pre-assigned roles in the teams included a Group Facilitator, Curriculum Developer, and a Notes Facilitator. Assignment of these roles was intended to allow the teams to be more productive. In addition to the team sessions, there were daily keynote presentations, hands-on lab sessions (Tool Time), and a poster session with the theme "Success Stories: Using Data in Education." The agenda is provided in Appendix II.

6
Evaluation Procedures: Data Gathered and Analytical Methods Data informing this report were collected through a series of four questionnaires (see Appendix I) and a series of interview questions. The questionnaires were the following:
• Data Use Questionnaire. Administered on the first day. Nine multiple choice questions with open-ended option, one YES/NO with open-ended explanation requested).
• Daily Questionnaires. Administered at the end of Monday and Tuesday. Five questions (three multiple choice, one Likert, and one open-ended on Monday, with an additional open-ended question on Tuesday).
• Final Day Questionnaire. Sixteen questions (one multiple choice, three multiple choice with open-ended option, four open-ended, one Likert, and seven mixed Likert/explanation).
Results from each questionnaire are reviewed in this report, with the daily and final questionnaires combined in one section due to their overlapping topics. The results of Likert, multiple choice, and yes/no questions were processed in Excel and are presented in figures. Open-ended questions were categorized and coded for dominant themes and are summarized within the text of each section. Direct quotes are given as bullets, formatted in italics. An instrument error was noted in the final survey; participants were asked for their opinion about the data search scenario session, which did not appear in the final agenda. A similar instrument error was noted in the Monday survey, which asked about the poster session; the poster session was not held until after the Monday survey was administered. Telephone interviews were conducted between two and three months after the workshop with one member from each team. The questions used in the interview were open-ended and are included in Appendix I.

7
Participant Data Response rates to the questionnaires are summarized in Figures 1 and 2. Although the teams were mostly composed of at least one representative from each of the five professional roles (Curriculum Developer, Data Representative, Educator, Scientific Researcher, and Software Tool Specialist), many more identified themselves as educators than as the other roles. The variation of the role responses among the different surveys may have been due to different participants filling out the surveys or for people reconsidering their role over the course of the workshop.
Figure 1. Number of respondents to each questionnaire, grouped by professional role.

8
Table 1 shows the response rates for each questionnaire and each professional role, with the percent participation for each survey based on the total number of participants (61). Response rates were sufficient to provide valuable data. All questionnaires were well responded to, with response rates ranging from 72% to 85% (Figure 2). The response rates are slightly better overall than those at the DLESE Data Services Workshops, which were the predecessors to the AccessData Workshops. The slightly lower response rates for Monday may be due to people leaving early to prepare for the poster session. The lower response rates for the final day were likely due to people leaving a little early on their way out of town.
Table 1. Comparative response rates by role and questionnaire.
Questionnaire Curriculum developer
Data representative Educator Scientific
researcher
Software tool
specialist Totals Percent of
Participants
Data Use 8 3 17 11 10 49 80% Monday 5 5 17 9 8 44 72% Tuesday 8 6 17 10 11 52 85%
Final 9 7 12 8 9 45 74% Average 78%
Figure 2. Percentage of attendees responding to each questionnaire.

9
Professional Roles: Participants Self-Identification was Primarily Educator As in the 2006 DLESE Data Services Workshop, respondents identifying themselves as primarily Educators were the largest group for each survey. There were two professional role questions in each questionnaire. The first asked for their primary professional role (Figure 3).
Figure 3. Primary professional roles by survey.

10
The second professional role question asked for other professional activities that respondents participate in. The results for the second question are given in Figure 4 in percent of respondents for each survey. The reason for using percent in this graph is because the number of selections was quite variable in each survey. However, for each survey, Curriculum Developer and Educator were the most commonly chosen “other activities.” This confirms the indications from the first question that many attendees included education in their professional activities.
Figure 4. Other activities indicated by attendees. Results are given in percentage of total respondents for a particular
survey due to the variable numbers of selections in each survey.

11
Professional expertise was well distributed among the teams. On the final day, respondents were asked for their work team as well as their primary professional role and additional activity areas (as on previous surveys). It was interesting to note that although the results did not show that each team had exactly one respondent with each of the five primary professional roles, when all roles and activities were combined, most teams had expertise in each of the five areas. See Figure 5. All teams had indications of expertise in each of the five areas except NASA-NEO, NCAR, NODC, and Project WET. The number of respondees on each of these teams was fewer than the population of their teams (NASA-NEO 4 of 5; NCAR 3 of 6; NODC 3 of 6; WET 2 of 7), so it’s probable that the missing expertise would have been found in those members not represented by the final survey. There was not as large a drop-off in the rates of response for the final survey this year, compared to the Data Services Workshops of previous years. Only the Project WET team had only one respondent on the final survey.
Figure 5. Distribution of professional roles and activities by team in the Final Survey.

12
Data Use Survey
There were 51 respondents to the Data Use Questionnaire. Questions 1 and 2 addressed the attendees’ professional role and activities. The previous section of the report summarizes these findings over all four surveys. Question 3 asked about learning goals with successful use of data in educational contexts. Respondents selected from ten learning goals and could pick more than one answer (see Figure 6). Respondents selected Climate and Interpreting Satellite Imagery the most often. However, all options were selected relatively evenly (within ten votes of each other) and were very similar to results from a similar question at previous workshops. Pattern recognition was slightly higher this year than in previous years; Climate and Environmental Science were new categories this year, and were both well-selected.
Figure 6. Learning goals that respondents have successfully used data for in educational contexts.
Other learning goals participants listed were the following:
• Resources exploration • water chemistry • GIS • precision agriculture • understanding patterns of populations, energy use, air emissions, pollution • inquiries

13
Satellite Imagery and Weather/Climate Observations were the data most commonly used successfully. Question 4 asked what types of data respondents had used successfully; they could pick more than one category. The results are displayed in Figure 7. The results are very similar to those from the 2006 workshop. Satellite Imagery and Weather/Climate Observations were each selected 35 times. Topography Data was second at 27. Slightly more categories were chosen per respondent this year than last (3.54 vs. 3.37). Proportionally, slightly more people in 2007 selected Census, Sea Surface Temperature, Tree Ring, and Weather/Climate Observations data than in 2006; fewer selected Earthquake/Volcano, Satellite Imagery, and Topography.
Figure 7. Specific data which have been used successfully by respondents.
Other data types mentioned by respondents included the following:
• Field data (gps spectral measurements, emission thing and temperature measurements) • Biomass, NPP, other forest ecosystem data • Forest characteristics • Stream flow data, mineral consumption / production data, ice core data, sea level • Various soilogical data sets from NOAA national oceanographic data center • EPA - Ozone data , EIA - emissions and energy use data species populations data from national marine
sanctuaries • Field and sample data (leaf chemistry , tree biomass)

14
Question 5 asked participants what data formats they had used successfully; they could select multiple formats. Figure 8 shows the responses. Image, Text/ASCII, and GIS were the most commonly selected data formats. This was similar to the 2006 data, with more people selecting GIS than before (37, up from 27). Also, 24 selected the category GeoTIFF, which was a new category for 2007.
Figure 8. Data formats successfully used.
Other formats listed by respondents included the following:
• FITS, KML, BSQ, GRADS, IMG • Excel files • Imagine, ENVI, ArcView, NCAPS, Eudas *lan and *.gis, VICHR • Vector formats - shapelde, coverage , kml • PNG, MER analyst notebook

15
Question 6 asked participants what data sources they had used more than once; they could select as many as they wanted to. Figure 9 shows the responses. The results were very similar to previous years. NASA, USGS, and NOAA data were the most commonly selected data sources.
Figure 9. Data sources used more than once.
Other NOAA sources listed included three mentions of the National Ocean Service and two of NGDC. Additional sources listed were
• HCN, • Tides and currents, and • Tsunami data.
Other non-NOAA sources were as follows:
• Data from petroleum and mineral industry • www.wunderground.com • Castnet, Views • PSMSC • CDMO

16
Question 7 asked participants if they had found it necessary to modify data sets before they were used by an end-user or learner. Of 39 respondents, 36 reported that they had to modify data sets before providing them to the end-user. Twelve respondents specifically mentioned reducing file size. Eleven respondents imported data into Excel for direct use, modifications, or reformatting. Two modified HDF to another format, and one used HDF as the final format. Two began with NetCDF data and modified them. ArcGIS was mentioned by one user as an input format. Modifications described by respondents included
• Subsetting data to reduce file size, to focus on a spatial or temporal scope, or to accommodate Excel’s file size limits (ten respondents)
• Text data imported into Excel so that modification/corrections could be done in Excel (three respondents) • Changing units of measure (three respondents) • Filling missing data points (two respondents) • Conversion of time series and web data to Excel (two respondents) • Conversion of HDF to binary for importing into image software (two respondents) • Trimming regional data with graphic software • DBF format to Excel and GIS • NetCDF to ASCII for import into spreadsheet software • Projection modification • Modification of data in Excel to prepare them for GIS software • Take text based data and graph or map it • Text data manipulated in Unix; GIS data manipulated in GRASS or other open-source software

17
Question 8 asked what data analysis procedures have end-users or learners performed on data. Figure 10 provides a summary of the responses. End-users were most likely expected to use graphing, visualization/imaging, and plotting/mapping procedures on data. These results were very similar to those gathered in 2006 for this question. Slightly more respondents had learners using statistics and slightly fewer used basic math than in the 2006 survey; this can be explained by the demographics of the two workshops—more college educators were present in the 2007 workshop, so their learners were naturally using more statistics and fewer basic math skills.
Figure 10. Data analysis procedures performed by end-users or learners.
Other analyses listed by respondents were the following:
• Feature exploration; image and data fusion interpolation, Vector to raster; raster to vector etc. • Scientific studies using soilogical data (reef data) AVHRR data • Advanced nonlinear • Use of buffer zones for analysis

18
Question 9 asked participants if they had made any attempts to obtain and use data sets that were NOT successful and, if so, what barriers they encountered. Most respondents had run into unsuccessful data use situations. Figure 11 displays the barriers that they encountered. All but three respondents had been unsuccessful using a data set in the past. Incomplete data sets, discoverability, dataset size, and poor documentation were the most commonly cited barriers to use (over 20 responses each). Unusable format, software difficulties, broken links, proprietary restrictions, and prohibitive costs were all mentioned by over 15 respondents as well. Hardware and bandwidth limitations were only mentioned by 6 and 5 respondents, respectively. These responses were slightly different from those in previous years, when unusable format and files being too large joined discoverability and software difficulties as the top four barriers. File size may be a lessening concern in 2007 due to enhanced computer technology as well as fewer attendees being in K12 work environments (which tend to have less extensive computer networks available).
Figure 11. Barriers encountered when participants were unsuccessful in accessing data sets.
Two of the following additional comments from respondents indicated difficulties with data providers, and one comment included a number of issues.
• Data providers not knowing enough about their own data • Could locate data but was unable to persuade data owners to work with us to get data into usable format • Data was incomplete or just "bad" missing locations, data does not correlate with header info, poor documentation

19
Question 10 asked participants what types of instruction or support are most helpful to them when using specific data sets. Figure 12 displays the responses. Overall, step-by-step instructions, followed by examples were the most popular methods of instruction selected. Online tutorials and reference manual/documentation were also highly ranked, followed by one-on-one email assistance. These results were very similar to the previous year’s workshop, but step-by-step instructions was ranked lower than examples last year. In total votes, step-by-step instructions, tutorials, and reference manuals increased while all other choices decreased. Videos was a new category this year and was chosen by only four respondents.
Figure 12. The most helpful types of instruction or support when participants use data sets.
Other types of instruction or support suggested by respondents were two votes for detailed metadata.

20
Daily and Final Surveys
Data gathered from the first two questions on the Monday and Tuesday surveys and the first three questions on the final survey are summarized in the Participants section earlier in this report. Responses to the rest of the daily questionnaires and the corresponding questions in the final questionnaire are described together in the first part of this section. Analysis of the remainder of the final questionnaire is at the end of this section. Open-ended comments are in italics when quoted. When questions dealt with issues specific to a team and open-ended responses could shed some light on the team logistics, the name of the team is included in parenthesis after the quoted comment.

21
Most Valuable Aspects of the Workshop In the data from the Monday, Tuesday, and final surveys, the team breakout sessions were considered the most valuable part of the schedule (see Figures 13, 14, and 15). The Tool Time sessions were also highly regarded in all three surveys. The most popular talk was the Tuesday Keynote, both in the Tuesday survey and in the final survey. Participants were asked to check the most valuable aspects of the workshop on each of these surveys; multiple selections were allowed. The Monday survey showed similar valuation for networking with others in their field (18), networking with those outside their field (19), and the two first talks (21 and 17). The Tool Time session ranked slightly higher at 29 votes. The Tuesday survey showed the popularity of the keynote talk (42 votes), which was second only to the team breakout sessions (51 votes) for the most valuable part of the day. Tool time again ranked a strong third at 34 votes, with networking inside (22) and outside (27) their field being only slightly less valuable. The final survey correlated well with the first two days’ results, with the exception that in the final analysis, the Tool Time sessions ranked higher than the Tuesday talk. Out of 47 respondents, 38 selected the breakout sessions as the most valuable aspect of the workshop; 36 selected the Tool Time sessions. Networking with those in other fields (29) and the same field (28) were only slightly behind the Tuesday talk in votes. This is similar to the results from previous years. Among the talks, the Tuesday talk was selected as valuable (31 selections) most frequently, with the Monday talk receiving 21 votes, and the Wednesday talk receiving 12. The poster session and final report-out sessions were the least chosen aspects of the workshop in this value assessment. This is similar to results from the last two workshops. In the final survey, three people commented that the Monday evening session on An Inconvenient Truth was also valuable to them.
Figure 13. Most valuable aspects of Monday’s schedule.

22
Figure 14. Most valuable aspects of Tuesday’s schedule.
Figure 15. Most valuable aspects of workshop overall.

23
Balance of the Workshop Overall, most participants indicated that the workshop was well balanced. As in previous years, the average results for each survey indicated a slight preference for a greater emphasis on education. Also similar to previous years was a slight preference on each survey for less emphasis on talks. The data are similar to the results from the evaluations of the previous two years’ workshops, though the number of requests for more or less of any area is lower than in any previous years.

24
Feedback on the first day’s session indicated general satisfaction, with several respondents requesting more time for breakout sessions (Figures 16 and 17). Several participants suggested improvements to the Tool Time session.
Figure 16. Balance of Monday’s session, by category.
Figure 17. Balance of Monday’s session, averaged overall.

25
Comments on Monday’s session included six people asking for more breakout time with their team; one specifically asked for another breakout session after Tool Time. Two people remarked that there was plenty of food, although one complained that the breakout session ran long which made lunch too short. Four people specifically said that everything was fine. General schedule suggestions were
• Possibly [a] shorter keynote [talk] • Reinforcing difference between data use by scientist compared to data by students in education • A poster introduction or something for team intros in the morning so that you find out more about that others orgs
are doing. Suggestions for improving the Tool Time session included the following: • Person presenting must know program NI2K • I think my world is too complicated for a 1 hour session • Session 1 tool time - lacked organization • Perhaps should have asked us to download stuff before we arrived ( with some background info) • My world GIS tool session runs a little bit highly unexpected downloading prior to the session. And a bit
complicated for myself as a first time user. • Stella presentation well balanced with audience. PSICAT: inexperienced presenter eventually left me behind I left,
went to GE tool time • Demos could use a little more background --time is a little too brief for true hands on but overview is good --could
have used a little more time in breakout groups.

26
Feedback on Tuesday’s session also indicated general satisfaction, with several respondents requesting more hands-on learning time (Figures 18 and 19).
Figure 18. Balance of Tuesday’s session, by category.
Figure 19. Balance of Tuesday’s session, averaged overall.

27
Comments on what participants would have changed for Tuesday’s session included seventeen comments that the schedule on Tuesday was very good; four of these people specifically said how nice it was to have enough breakout time with their team. One person disagreed, saying that one breakout in the morning and one in the afternoon would have been better. A similar comment was made by another person, requesting less team time Tuesday and more on Wednesday. Two people requested more streamlining of the breakout tasks; one of these commented that the data sheet wasn’t needed because they could type straight into the wiki. Four people requested that the tool time be longer; two of these and one other person asked that the balance of Tool Time and breakout time on Monday and Tuesday be the same. One person, however, suggested dropping the Tuesday Tool Time and another suggested rearranging the schedule so the Tool Time session did not break up the breakout session. One additional suggestion was to stagger the Tool Times to maximize the bandwidth availability.

28
Tool Time Sessions Question 3 on the Monday and Tuesday questionnaires asked about the most valuable aspects of each day’s sessions. Those who selected a Tool Time session as valuable were asked which session they attended. The feedback indicates that the most valuable sessions were Google Earth, NEO, PSICAT and My World GIS. When the total number of responses for each session topic is normalized over the number of sessions, these four tools received the most votes as valuable. There were nine responses that did not select the Tool Time session as valuable but did fill in the session they attended. The data for all sessions listed as attended are shown in Figure 20. Note that there were two sessions of ArcGIS, My World GIS, Google Earth, NI2K and Stella, three sessions of NEO, and one session each of GeoMappApp and PSICAT.
Figure 20. Responses listing Tool Time sessions attended.

29
Figure 21 shows the data for those respondents who selected Tool Time as a valuable aspect of the day and indicated which Tool Time session they attended. Figure 22 shows the data for those who specified attending a session, broken out by day and topic.
Figure 21. Tool Time sessions selected as valuable by attendees.
Figure 22. Tool Time sessions attended by day and topic (yellow=Monday session 1; green=Monday session 2;
Blue=Tuesday session).

30
The final survey gathered balance feedback from participants at the end of the workshop. Results were very similar to the two daily surveys in most areas. See Figures 23 and 24. The talk on the third day scored the lowest of the talks in value and the final survey’s balance showed the most votes among the three surveys for too much emphasis on talks. One possible explanation is that by the third day participants are anxious to maximize their breakout time, worried about time running out, and are reluctant to sit through another talk. Nobody in the final survey wanted less emphasis on data and tools or breakout sessions.
Figure 23. Overall balance of the workshop, by category.

31
Figure 24. Balance of the workshop as a whole, averaged overall.
Comments on how attendees would have changed the workshop overall were varied. Five people took the opportunity to make positive comments about the workshop instead of suggesting any changes. One person suggested that an evening trip to Boston would have been nice. Pre-workshop Preparation Overall, there were fewer requests this year for more pre-workshop preparation work. This was probably due to the extra pre-workshop efforts made by the AccessData team this year to prepare teams for the conference. However, three people specifically requested more pre-workshop preparation; two were on the IODP team and one was on the NCAR team. Their comments were as follows:
• Our team needed more instruction on what to expect as we were a brand new team. Perhaps a pre-conference "breakout" session by phone to get new teams to "gel"
• Could we encourage more pre-workshop prep so we can get moving faster. Especially get all teams members talking
• I believe this was a unique experience to our team - but somehow ensuring that the team has ample time to do preliminary work on the data / project before the workshop
32
Talks Two people suggested not having a talk on the third day to allow more breakout time; one of these suggested that instead of the Wednesday talk, there be an optional Sunday evening talk. One other person suggested that the talks be shorter to allow more schedule time for breakouts and tools. Another suggestion was to put the talks in the middle of the morning. Tool Time There were three requests for more time for data access, Tool Time, and data tool demos. Two people asked that Tool Time and the breakout sessions be more spread out, while another asked for better balance between breakouts and Tool Time. More Time As in previous years, respondents wanted more time to do the work. Two suggested extending the workshop to three full days, and one suggested three and a half. Seven people requested more breakout time; four specifically wanted another team session on the first day, and one wanted another session on the final day. One person asked for more background and context for the data tool demonstrations. Other Comments Other comments included five specific suggestions for additional sessions, and one complaint about a perceived political atmosphere at the workshop.
• Streamline process of writing -> set format so everything can be added and written directly onto wiki • Overt consideration of National [Standards] and instruction in ES teaching • [It] seems like there could be more on data availability. There are many other sources not mentioned or available
in workshop--maybe refer to a listing of data sites. • [Could we have] presentations on developing online lessons--appropriate pedagogy, guidelines , online learning • I would add one more work session [on] the design of an EET chapter as the overall goal of the meeting for teams • I was surprised to find that the workshop tended to focus on climate change and was disappointed in the
conservative bashing that occurred

33
Question 7 of the final survey addressed the effectiveness of the poster session. See Figure 25. The poster session was rated about the same as in previous years, as moderately successful in promoting learning about data access, tools, and educational uses of data.
Figure 25. Rating of the poster session.
Comments on the poster session were largely appreciative, although one person said it was too crowded, and another was a poster presenter and was disappointed they couldn’t visit the other posters. Specific comments about what was most appreciated are as follows:
• Nice location - food was great :) • Great opportunity to learn about new tools (best part was those with computers to show off stuff) • It was nice to socialize and many of the posters were interesting • Allowed me to see some of the other or parts of other tool time sessions that overlapped
Suggestions for improvement of the poster session were the following:
• Posters about each different data providers would have also been good • Poster could be a time for data - providers and or analysis tools to share • Maybe have the posters stay up in the conference room all 3 days that would give more time for looking at them • Needed more • The poster sessions could also be used to illustrate importance and ways that highlighted data are used

34
Question 8 asked about the breakout team. See Figure 26. There was almost complete agreement among participants that the teams worked well or very well together at the workshop. The overall rating was not quite as positive as in previous workshops. Comments received were many and varied. The most common theme was appreciation for pre-workshop preparation from some teams, and a desire for more of it from other teams. IODP was the team that most often mentioned a request for more preparation, although WET and GLOBE Carbon (and to a degree NSIDC) also mentioned this issue. NODC, NCAR, and NSIDC team members commented on how the pre-workshop preparation had helped. Also acknowledging the value of preparation were two members of the NASA Neo team, who were working on this project for the second year. Two comments indicated possible problems with too much preparation (or familiarity between members) on the NSIDC and GLOBE Seasons.
Figure 26. Rating of how well the teams worked together.
35
Comments on how the teams worked together offered appreciation for what worked as well as suggestions for how the team interaction might be improved. Seven attendees expressed appreciation for why their team worked well:
• Lots of good ideas, expertise in a wide range of fields (NASA Aura) • All members were very open and participated in discussions and classifications (NCDC) • Felt great was overall great (NASA Aura) • Our TERC person Nick Haddad was invaluable (GLOBE Seasons) • We all worked very well together. Different perspectives [are] always good. (NCAR) • Sometime we're carried away by our different sense of humor but we're human beings working very hard. Ha!
(NCDC) • Our team had a good blend of backgrounds and skill sets which were complementary. (NASA Neo)
Seven respondents thought that preparation before the workshop would have enhanced their team’s work. Four of these were from the IODP team.
• I contributed to the group but my original role wasn't defined before I arrived (NSIDC) • We came together as a team quickly and worked well but we could have used a pre cont. meeting to get
organized (IODP) • It would be helpful to have the team facilitator be someone who has participated before (GLOBE Carbon) • We were inexperienced in the AccessData process so it might have been nice to have a bit of guidance. (IODP) • We started off feeling pretty behind and very scattered and could have used more time pre-workshop to organize
(IODP) • [Having] longer lead tome to think about objective would make time here more productive - focused data
specialist would help (WET) • I believe this was a unique experience to our team - but somehow ensuring that the team has ample time to do
preliminary work on the data / project before the workshop (IODP) Three respondents commented on how the pre-workshop preparation had helped their team:
• We had the advantage of 3 people from NODC best thing was our pre-preparation. Our team members were great a good mix positive - no negatives (NODC)
• Prior preparation by group members helped - everything seemed to work (NSIDC) • It was great that some of them talked before the workshop (NCAR)
On a similar topic two respondents (both from NASA Neo) commented that having their team assembled for the second time at the workshop was a big help:
• Having the team a second year made a big difference (NASA Neo) • Since we were all attending for the second time we were all able to hit the ground running (NASA Neo)
Three respondents brought up problems they found with their team:
• This year I felt like we came with a good idea but most people on the team lost interest / desire in the process once a basic idea / outline was captured. (Tues afternoon they all mentally checked out) (NSIDC)
• Too much off task business by content group. Our facilitator did hold us on task and out group had a pre-existing social connection that allow for too much social / business time in meetings (GLOBE Seasons)
• One team member was unable to attend due to lack of facility support for children (AmericaView)

36
Question 9 of the final survey asked, “What do you plan to do in your work as a result of this workshop that will facilitate the use of data?” The 36 respondents commented on their plans to work on EET development (6), general use of tools (2), classroom and outreach applications (11), professional development applications (7), and data/tool development (9). EET Development
• I will develop an EET chapter • Prepare data sets for chapter • I will be working to provide additional data as needed for the completion of our EET lesson • We plan to do more (at least one more) EET. We really want students to use data that collect on others data and
make since of it • Will continue to work with our toolbook chapter • Work to create screen grabs for EET chapter
General Tool Use
• I will definitely use several of the tool displayed during this workshop • Will use several tools I was unaware of before the meeting. Will try to get PSICAT used on out drillship for Core
description. Classroom and Outreach Applications
• Use this lesson as well others on the site in my classroom. I will also recommend these resources to other educators in my field.
• Incorporate tools and EET chapter into teaching ASAP • Bring into the classroom more emphasis on images from Earth Explorer and Google to supplement examples and
provide students with the means to work with the tools • Use the lessons in my classroom • Use new resources to develop programs • I plan to try to incorporate NASA EO and NEO into activities/ outreach tools I develop • Create lab experiences for my class • I’ll use some new tools (e.g. NEO) and some new data sets (e.g. temp data ) in my class • Incorporate celestia and gridview in my science class • Now that I am more aware of the applications of some data tools, I really want to integrate these into some of the
existing JOI Learning activities • Incorporate the information in university courses
Professional Development Applications
• Present teacher workshop on our chapter • Introduce colleagues in our PD classes • Teacher training at fall workshop on data access GLOBE and analysis Google earth • Tell ALISON teachers about the EET chapters • Need to educate myself to learn more on scientific tools. Especially Google Earth • Pass the information to K-12 teachers in workshops this summer and beyond. • This exercise will be integrated into Aura professional development workshop
Data and Tool Development • Several action items related to our data access systems • Improve the accessibility of GLOBE data and improve the user friendliness of the GLOBE visualizations and data
access pages • Interface design

37
• Inform GARSST of additional needs that will make it easier for user more visits and an easier web site to navigate--Don't be so technical; it scares people.
• Continue to advocate more online connectivity in our software tools • Work on making PSICAT easier to use and to develop some of the items for the activity • Develop additional data use/ tool applications to existing activities • Spend more time on specific case scenario. Make minor modifications to on-line data access interface - currently
suitable for scientist but a few minor changes will make this easier for educational exercises • We will continue to add to our data collection and to refine the ICE tools functionality.
Other Comments
• Increased access to new sources • Work to create screen grabs for EET chapter and solid numbers • I hope to continue the interactions I began here • Help my friends understand Global warming and globe Environment things that I learned here

38
Question 10 asked participants to rank the value of the printed materials distributed at registration. Results are summarized in Figure 27. Printed materials received for the meeting were rated above average. Nobody ranked them as any less than average.
Figure 27. Rating of the printed workshop materials.
Nine people commented on the printed workshop materials. Eight of these expressed either general appreciation or appreciation for specific aspects of the materials. One valued the workshop expectations and objectives being spelled out; another liked the color coding. The appreciative comments were:
• Perfect! • Color coding certain data made it easier to refer to areas we programmed • Worked for me • Good. I appreciated the documents in print • Details where fine grained and helpful • Very well organized and efficient • Good overview of the workshop expectations / objectives • Good. Everything I needed
One person suggested an addition that would have been helpful: • It would be useful also to get a one-page printout on useful links to relevant WebPages (and data and tools)

39
Questions 11, 12, 13, and 14 addressed the success of the workshop logistics and websites (see Figure 28). Online registration was found to be easy to use by 40 respondents (6 ranked it “fair”). The Wiki and information website was considered to be quite useful overall (only one person rated the Wiki as “not useful”). The meeting facilities, housing, and food were ranked well above average overall.
Figure 28. Ratings of online registration, website, facilities, housing, and food.

40
Meeting registration was ranked very highly by most respondents:
• Perfect! • Very nice no problems • Was good you could go and update plans as needed
A few problems were mentioned:
• Some instructions about what to bring were not obvious; info for reimbursement not clear. • I didn't see the part about transportation costs--you might make that more obvious • Very long • Need to indicate that additional nights of stay not possible so that response to registration efforts beyond "not
accepted" on what even it was. • Somewhat confusing at times • I would have liked to see deadlines. To know when I needed to respond by to know when I would hear back about
being accepted. The wiki and information pages were well-received. One respondent specified why it was useful for them:
• Good because I lost my folder! Good backup One suggestion for improvement on the information page was as follows:
• My only comment was that it would have been useful to have a contact phone # available in case there was trouble with transit from the airport
Five respondents discussed limitations they found in using the wiki. Ease of use and ability to modify the format were two issues that came up. One respondent requested some “quick start” instructions on using the wiki.
• As a team we really didn't use the wiki while working (GLOBE Carbon) • I loved the wiki as a concept but think that the odd - formatting issues, strange hyperlink technique, etc., were
unnecessarily difficult to use. A simple online discussion board that would allow each team to post meeting notes, easily "attach" a document, etc., would be a more appropriate tool.
• I think my group could have used a differently organized wiki page. I think the 6 sections were good for organizing the project but they made it hard to organize the content. More boxes that could be labeled by us would have helped
• I didn't really like how wiki wanted to format my team session notes • Perhaps some quick start instructions on the use of the Wiki could have been provided at the start
41
The meeting facilities were appreciated by most respondents.
• One of the best facilities I have been at • Great facilities- self contained • The big conference room was excellent will lit • Very good to excellent only wish for more shuttles. Hotel staff attentive and caring went out and got us toothpaste!
Great food and staff beautiful setting clean pleasant rooms wish I had had a bathing suit > good choice • Excellent food and location • The best one yet from meeting / talking with others [this from a fourth-time attendee] • We spend so much time indoors that windows are important • Outstanding - thanks!! • Nice facility. Well organized technologically . I was glad I didn't have to provide a projector
Two respondents, however, would rather have been located in the city, or at least had a visit there:
• I would prefer to be in Boston. I felt very isolated out here and not enough time outside too cold!!! • However if we all could be (provided) arranged in a way to visit downtown Boston to visit its historical site or a city
tour. It'll be a plus. All comments on the food and housing were very positive except one request for more vegetarian options with protein. Five attendees commented that the food was too plentiful (or too good):
• Too much • I'm on a diet for the rest of the week/month possibly • Really could have had lighter lunches and used that time for more presentations • I gained 30 lbs in 3 days • I think I gained 20lbs from all of the excellent food on this trip !
Other than that, the comments were excellent:
• Food was fantastic • Great - Thanks! :) • Cleanliness great! Food was superb! • The conference center was beautiful and the food was excellent. • I will miss the food and the bath and body works soap and hand crème • Everything was fine. I was looking forward to fresh seafood when we came here • Very impressive - Food was awesome!! • Great food! • The food was wonderful • Food was great

42
Question 15 asked for any additional comments. Summary comments on the workshop included appreciation for the workshop and some detailed suggestions for improvement. As in previous workshops, participants greatly appreciated the format of the event and the experience itself. Of the 28 open-ended comments, the following 13 positive comments featured their appreciation:
• It was great and I am glad I was a part of it. • I feel the workshop is very well run and organized • It was good to be "isolated" from distractions - more work got done I think well organized tome bites • I really enjoyed this workshop it is one of the most productive and best organized of the many I've attended • I hope to come back next year! • Great and wonderful and get to see the whole nine yards of operating a workshop. Most impressive I have is the
tool time session. And the informal talks then there are exchanges between educators and scientist and data reps. Simply and loosely put the workshop brings every aspect of view together
• Wonderful! I really enjoyed working with a group of varied background expertise. • I enjoyed the workshop and meeting others I am very excited to see the end product and hear about its use or
suggestions for improvements • This workshop is a great idea and I hope to participate again. • Very interesting mix of people • As a teacher, I had a great experience. It was great for me to involve real data rather than some can module that I
can see using my classroom • Excellent workshop - we were very productive, I learned about a lot of new tools and data resources and we were
able to network. I hope to be included in future workshops. • We were well taken care of ;)
Suggestions for the schedule were reflective of comments seen in other answers--two suggested spreading the breakouts around more; one asked for longer tool times; one requested no talk on the last day; and two asked for an outdoor event/field trip.
• Only that some tool time sessions need to be lengthened • Need an additional team day later the 1st day - that way the last 1/2 day won't be so rushed with getting the
presentation ready along with finishing the project. • Start the day a bit earlier, have some sort of outdoor event or opportunity • Next time maybe, for breakout sessions for 2 on day 1 and then 3 on day 2 and 1 on the final day 4 on day 2 was
maybe a little too grueling • How about adding a short field trip? • Don't recommend having a talk the last day as peoples heads are already on the road (some people)
Suggestions for the logistics included having printers available, nametags with affiliations, and a shuttle service.
• It would be good to have printers available to teams. The overall workshop was great thank you for inviting me. • To have shuttle service running at some point for people without cars • I interacted a bit more with my team that with other teams for some I don't even know their names and affiliations -
having TERC as the affiliation fro everyone on the badges was not very useful

43
Some respondents had suggestions for more pre-workshop planning as follows:
• Make sure everyone has downloads before hand - separate sheet to outline then - not lost in a page of text or have CD ROMS with necessary files
• I think the biggest impact we could have is more pre-workshop prep. Getting familiar with the tools and data (at least fro the teams ) and get the team members talking (NCAR)
• Some team introduction prior to the meeting could have been helpful (GLOBE Carbon) • Provide load time for pre conf. planning [and] some structured time to meet folks outside our working team (WET)
Other suggestions included topics to cover and participants to include:
• More land remote sensing data Maybe an ag-related lesson/module • Keynote talks might also touch on the scientific uses / significance of highlighted data • Would like to see more geological data shared • Other gov't agencies could be included - e.g. USGS, USDA , EPA

44
Follow-Up Interviews
Two to three months after the workshop, a ten-minute telephone interview was held with one representative from each team. The goal of this portion of the workshop evaluation was to gather feedback from participants on the effectiveness of the pre-workshop preparation that each team was encouraged to do. Five open-ended questions were developed by AccessData team members and the evaluator as follows:
• What sort of communication did you have with the AccessData team before the workshop?
• What sort of communication did your work team have among its members before the workshop?
• How productive were team interactions before the workshop?
• How can we improve pre-workshop team activities for next year?
• What suggestions can you offer to improve productivity and communication among your team for AFTER the workshop?
Teams all reported having interacted with the AccessData (AD) team members. Most reported this as being extremely helpful, especially those new to the EET process. There were no reports of any problems with these communications. Those teams who had interacted with the other work team members before the workshop thought it was very beneficial. Email was the most common method of communication, but many also used phone calls, telecons, and (where possible) meetings among team members. Suggestions for improving the pre- and post-workshop team activities included the following:
• Determine all team members as early as possible. It was fairly common that the curriculum developer (and sometimes educator) were not determined until the workshop. Although one team said this was not a problem, other teams reported that they would prefer to have the educational perspective involved from the beginning.
• One team didn’t have a tool specialist and they felt they needed that expertise. • Include one team member very familiar with AccessData and the EET to guide the process; if this is not
possible, be sure an AD team member is pro-active with the team to explain the process very clearly. Another suggestion was to develop a simpler version of an EET chapter to be developed at the workshop so that the process is less complicated.
• Support the use of the wiki before the workshop; perhaps a telecon with an AD team member and the work team could provide an introductory session on the wiki.
• Get biographies up on the wiki as soon as possible, with information on team assignments. • When selecting team members, ensure that they are willing and able to put in a reasonable amount of
time for the pre-workshop activities. • Consider having more structure (deadlines, tasks, telecons) for the pre-conference work. • Encourage teams to download and use tools before the workshop; with more conversation between team
members on their topic before the workshop, investigation into appropriate tools may naturally occur. • Ensure that the Curriculum Developers have time to do both the pre-workshop and post-workshop
facilitation, including being willing to work in the wiki. Encourage them to provide regular status reports to team members during the post-workshop period.
• Consider having scheduled post-conference telecons with AD team members to keep things moving and provide a venue for status reports.

45
Other Interview Notes The IODP team did not report much productivity before or after the workshop. Their representative said that there was very little interaction among the team before the workshop—only a few emails. She thought the wiki worked well during the workshop and speculated that it would be useful for pre-workshop activities. She also commented that including someone familiar with AccessData and the EET on the team would have been helpful. They have exchanged a few emails since the workshop but are not working on their activity. The NASA Aura team was similar in that they had no communication before the workshop, and very little after the workshop. However, the interviewee from this team was anxious to continue to work on the activity and hoped to hear from the Curriculum Developer soon. Including a team (NSIDC) from a previous workshop seemed to result in a highly productive team, according to the interviewee. They didn’t have the start-up issues that the other teams did. Team chemistry was generally very good. In the one reported exception (NCAR), however, a team member was not supportive of the science topic of the group; the team spent a great deal of time dealing with this member’s opinion that the topic was not valid. This impacted the experience and productivity for the rest of the team. Post-conference interactions have varied. Seven teams reported they were waiting on the Curriculum Developer to get back in touch and move the process along. Overall, the teams seemed to appreciate the idea of having a Curriculum Developer who is tasked with keeping things moving towards completion—it just wasn’t apparent that this was happening very quickly. Only one team reported that the Curriculum Developer had accomplished these goals. Establishing the Curriculum Developer as well as the other team members well before the workshop might ensure more consistent pre-workshop productivity as well as the wrap-up. The one team (WET) that reported having a Curriculum Developer involved from the beginning said that it was extremely helpful. The GLOBE Carbon representative mentioned some controversy with their Curriculum Developer in that she wanted to use Google instead of the wiki, which the rest of the team was unwilling to do. Eight team representatives would like to see some sort of structured follow-up after the workshop. Most thought that one or more status telecons would be helpful. AmericaView’s representative said that biweekly telecons were very effective in keeping everyone participating, as was LuAnn’s help in customizing the wiki for their continued use.

46
Appendix I—Evaluation Instruments AccessData Workshop 2007
Data Use Questionnaire We are interested in attendees' perspectives on the use of data in education. We hope to improve our understanding of the ways in which data are being used and the ways in which data use may be made easier. This information may be used to help define future projects that focus on bringing data into the classroom. Thank you for your help. 1. What is your primary professional role? (Please check only one.) _____Curriculum developer _____Data representative _____Educator _____Scientific researcher _____Software tool specialist _____Other; please describe ____________________________________________________________ 2. Please check any other professional activities you participate in: _____Curriculum developer _____Data representative _____Educator _____Scientific researcher _____Software tool specialist _____Other; please describe ___________________________________________________________ 3. For which learning goals have you successfully used data within educational contexts? (Please check all that apply.) ____Understanding weather ____Understanding the ocean ____Understanding geology/seismology ____Interpreting satellite imagery ____Understanding the scientific method ____Pattern recognition ____Meeting science standards ____Personal exploration and learning ____Climate ____Environmental science ____Other; please describe_______________________________________________________________ _____________________________________________________________________________________ 4. Which of the following data have you used successfully? (Please check all that apply.) ____Census ____Earthquake/volcano ____Satellite imagery (e.g., GOES, Landsat, MODIS, SeaWiFs) ____Sea surface temperature ____Topography data ____Tree ring data ____Climate/weather model simulation output ____Weather/climate observations (e.g., temperature, precipitation) ____Other; please list___________________________________________________________________

47
_____________________________________________________________________________________

48
5. Which of the following data formats have you used successfully? (Please check all that apply.) ____GIS (Geographic Information System) ____Image data (e.g., JPEG, GIF, TIFF) ____Text/ASCII (e.g., tab-delimited text for spreadsheet use) ____NetCDF (Network Common Data Format) ____HDF-EOS (Hierarchical Data Format-Earth Observing System) ____GeoTIFF (Georeferencing Tagged Image File Format) ____Other; please list___________________________________________________________________ _____________________________________________________________________________________
6. Which of the following data sources have you used more than once? (Please check all that apply.) ____DOD (Department of Defense) ____EPA (Environmental Protection Agency) ____GLOBE (GLobal Observations to Better the Environment) ____NASA (National Aeronautics and Space Administration) ____NCAR (National Corporation for Atmospheric Research) ____NOAO (National Optical Astronomy Observatories) ____USGS (United State Geological Survey) ____NSIDC (National Snow and Ice Data Center) NOAA (National Oceanic and Atmospheric Administration) Sources:
____NCDC (National Climatic Data Center) ____NODC (National Oceanographic Data Center) ____NWS (National Weather Service) ____Other NOAA; please list _______________________________________________________
____Other non-NOAA; please list __________________________________________________________ _____________________________________________________________________________________
7. Have you found it necessary to modify data sets before they were used by an end-user/learner (e.g., selected subset, imported into Excel)?
____ Yes _____No _____No opinion
If yes, please describe the original state of the data (e.g., format, file size, region, etc.): ________________________________________________________________________________ ________________________________________________________________________________ How did you modify the data (e.g., imported into Excel, selected time period, changed units, etc.)? ________________________________________________________________________________ ________________________________________________________________________________

49
8. What data analysis procedures have your end-users/learners performed on the data? (Please check all that apply.) ____Statistics ____Basic math ____Graphs ____Visualization/Imaging ____Queries ____Classification ____Plotting/Mapping ____Quality control ____Other; please describe ______________________________________________________________ _____________________________________________________________________________________
9. Have you made any attempts to obtain and use data sets that were NOT successful? ____ Yes _____No _____No opinion
If yes, what barriers did you encounter? (Please check all that apply.) ____Couldn't locate data ____Data set was incomplete ____Broken links ____Poor documentation ____Did not have access to required software ____Required computer hardware was not available ____Insufficient bandwidth/connection ____Unusable format/unknown file extensions ____Software too difficult to use ____Terminology/acronym problems ____Dataset too large ____Proprietary restrictions ____Prohibitive costs ____Other; please describe__________________________________________________________ ________________________________________________________________________________
10. What types of instruction or support are most helpful to you when using specific data sets? (Please check all that apply.) ____One-on-one email assistance ____Phone support ____FAQ ____Glossary of terms ____Examples ____Step-by-step instructions ____Training workshops ____Online tutorial ____Live demos ____Videos ____Reference manual/documentation ____Other; please describe_______________________________________________________________ _____________________________________________________________________________________ Thank you for your feedback. Please return this form to a workshop staff person or to the drop-box at the registration table.

50
AccessData Workshop 2007 Monday Feedback Questionnaire
1. What is your primary professional role? (Please check only one.) _____Curriculum developer _____Data representative _____Educator _____Scientific researcher _____Software tool specialist _____Other; please describe _________________________________________ ___________ 2. Please check any other professional activities you participate in: _____Curriculum developer _____Data representative _____Educator _____Scientific researcher _____Software tool specialist _____Other; please describe _________________________________________ ___________ 3. What aspect(s) of the workshop today did you find the most valuable? (Please check all that apply.) _____Keynote talk – Keynote Presentation #1: Polar Science, Global Impacts: The Legacy, Activities, and
Relevance of the International Polar Year; Mark McCaffrey, Cooperative Institute for Research in Environmental Sciences (CIRES), University of Colorado at Boulder
_____Talk – Tangible products from this workshop: Earth Exploration Toolbook activities and DataSheets. Overview of using the Team wiki pages; Tamara Ledley and LuAnn Dahlman
_____Team breakout session _____"Tool Time" - Hands-on Lab Session 1 (Google Earth, NASA NEO, ESRI GIS) Please indicate tool session you attended_______________________________ _____"Tool Time" - Hands-on Lab Session 2 (NASA Image 2000 (NI2k), My World GIS, STELLA) Please indicate tool session you attended_______________________________ _____Poster and Demo Session and Reception--Challenges and Successes Using Data in Education _____Networking with others in my field _____Networking with those in other fields _____Other; please describe _________________________________________ ___________ 4. How would you rate the balance of the workshop today? (Please check only one.) Too much Just right Too little Talks Hands-on lab session Team breakout sessions Emphasis on data and tools Emphasis on education and curriculum 5. What aspects of today’s session would you have changed and how? ____________________________________________________________________________ ____________________________________________________________________________ Thank you for your feedback. Please return this form to a workshop staff person or to the drop-box at the registration table.

51
AccessData Workshop 2007 Tuesday Feedback Questionnaire
1. What is your primary professional role? (Please check only one.) _____Curriculum developer _____Data representative _____Educator _____Scientific researcher _____Software tool specialist _____Other; please describe _________________________________________ ___________ 2. Please check any other professional activities you participate in: _____Curriculum developer _____Data representative _____Educator _____Scientific researcher _____Software tool specialist _____Other; please describe _________________________________________ ___________ 3. What aspect(s) of the workshop today did you find the most valuable? (Please check all that apply.) _____Keynote talk – Democratizing Access to NASA Remote-Sensing Data Products; David Herring, Earth Sciences Division, NASA's Goddard Space Flight Center _____Team breakout sessions _____"Tool Time" - Hands-on Lab Session 3 (GeoMapApp, My World GIS, ArcGIS, NASA NEO) Please indicate tool session you attended_______________________________ _____Networking with others in my field _____Networking with those in other fields _____Other; please describe __________________________________________________________ 4. How would you rate the balance of the workshop today? (Please check only one.) Too much Just right Too little Talk Hands-on learning Team breakout sessions Emphasis on data and tools Emphasis on education and curriculum 5. What aspects of today’s sessions would you have changed and how? ___________________________________________________________________________________ ___________________________________________________________________________________ 6. Of the posters you visited at yesterday’s poster session, which were most interesting or useful to you and why? ___________________________________________________________________________________ ___________________________________________________________________________________ ___________________________________________________________________________________ Thank you for your feedback. Please return this form to a workshop staff person or to the drop-box at the registration table.

52
AccessData Workshop 2007 Final Day Questionnaire
Please answer the following questions for us so that we can determine what we did well and what we can improve. Any identifying information will be kept confidential. WORKSHOP CONTENT 1. Which was your work team? _____AmericaView _____NCAR - National Center for Atmospheric
Research _____GLOBE - Carbon Cycle _____NCDC - National Climatic Data Center _____GLOBE - Seasons and Biomes _____NODC - National Oceanographic Data Center _____IODP - Integrated Ocean Drilling Project _____Project WET - Water Education for Teachers _____NSIDC - National Snow and Ice Data Center _____Not on a team _____NASA - Aura _____NASA - NEO - NASA Earth Observations 2. What is your primary professional role? (Please check only one.) _____Curriculum developer _____Data representative _____Educator _____Scientific researcher _____Software tool specialist _____Other; please describe _________________________________________ ___________ 3. Please check any other professional activities you participate in: _____Curriculum developer _____Data representative _____Educator _____Scientific researcher _____Software tool specialist _____Other; please describe _________________________________________ ___________ 4. What aspect(s) of the workshop overall did you find the most valuable? (Please check all that apply.) _____Monday Keynote--Polar Science, Global Impacts: The Legacy, Activities, and Relevance of the IPY _____Tuesday Keynote--Democratizing Access to NASA Remote-Sensing Data Products _____Wednesday Keynote--Climate Change Studies Using Different Knowledge Systems _____Data access/tool demos _____Team breakout sessions _____Data search scenario session _____Poster session _____Final report out of teams _____Networking with others in my field _____Networking with those in other fields _____Other; please describe ____________________________________________________________________

53
5. How would you rate the balance of the workshop overall? (Please check only one.) Too little Just right Too much Talks Data access/tool demos Team breakout sessions Emphasis on data and tools Emphasis on education and curriculum Overall time spent on evaluation surveys 6. What aspects of the workshop overall would you have changed and how? ___________________________________________________________________________________________ ___________________________________________________________________________________________ ___________________________________________________________________________________________ 7. To what extent did the poster session facilitate your learning about data access, tools, and educational uses of data? (Please check only one.)
Not at all Slightly Moderately Well Extremely well
Additional comments: ___________________________________________________________________________________________ ___________________________________________________________________________________________ 8. How well did your work team work well together? (Please check only one.)
Not at all well Slightly Moderately Well Well Extremely well
Please comment on what did and didn’t work in your team: ___________________________________________________________________________________________ __________________________________________________________________________________________ ___________________________________________________________________________________________ 9. What do you plan to do in your work as a result of this workshop that will facilitate the use of data? ___________________________________________________________________________________________ ___________________________________________________________________________________________ ___________________________________________________________________________________________

54
WORKSHOP LOGISTICS 10. How valuable were the printed materials you received at registration? (Please check only one.) Not Valuable At
All Below Average Average Above Average Excellent
Additional comments on the printed materials you received at registration: ___________________________________________________________________________________________ ___________________________________________________________________________________________ 11. How easy was the online registration for the workshop? (Please check only one.)
Poor Fair Good Additional comments: ___________________________________________________________________________________________ ___________________________________________________________________________________________ 12. How useful were the sections of the meeting website? (Please check only one.)
Not useful Somewhat useful Very useful Information section Wiki Additional comments: ___________________________________________________________________________________________ ___________________________________________________________________________________________ 13. How would you rate the meeting facilities (e.g., meeting rooms, equipment)? (Please check only one.) Extremely Poor Below Average Average Above Average Excellent
Additional comments: ___________________________________________________________________________________________ ___________________________________________________________________________________________

55
14. How would you rate the housing and food? (Please check only one.) Extremely Poor Below Average Average Above Average Excellent
Additional comments on housing and food: ___________________________________________________________________________________________ ___________________________________________________________________________________________ GENERAL IMPRESSIONS OF WORKSHOP 15. Please use the space below to add any other comments you have, suggestions for improvements at future workshops, or any other ideas you would like to share with us. ___________________________________________________________________________________________ ___________________________________________________________________________________________ ___________________________________________________________________________________________ ___________________________________________________________________________________________ 16. If we may contact you further about your experience, please provide your contact information here: ___________________________________________________________________________________________ ___________________________________________________________________________________________ Please complete and turn in this form to a workshop staff person or to the drop-box at the registration table during your final day. Your feedback and comments will help to shape future AccessData workshops. Thank you for your participation!

56
Follow-up Interviews
Interviewees were asked the following questions:
• What sort of communication did you have with the AccessData team before the workshop?
• What sort of communication did your work team have among its members before the workshop?
• How productive were team interactions before the workshop?
• How can we improve pre-workshop team activities for next year?
• What suggestions can you offer to improve productivity and communication among your team for AFTER the workshop?

57
Appendix II—Agenda
AccessData 2007 Agenda
Sunday, May 20, 2007
Time Event
5:00 - 9:00
pm Workshop Registration Open, Marlborough Conference Center Front Desk
6:00 - 7:30
pm
Optional Dinner Buffet (box dinners will be available for guests who arrive after the
buffet)
Monday, May 21, 2007
7:00 -
8:30 am
Workshop Registration open at Conference Center Front Desk.
Turn in Data Use Questionnaires-yellow by 8:30 am
6:45 -
8:30 Breakfast Buffet available in the Dining Room
8:30 am Workshop Begins, Marlborough Conference Center, Room C-109
8:30 -
8:45 Welcome, Review of Meeting Goals and Logistics - Tamara Ledley
8:45 -
9:30
Keynote Presentation #1
Polar Science, Global Impacts: The Legacy, Activities, and Relevance of the
International Polar Year
Mark McCaffrey, Cooperative Institute for Research in Environmental Sciences (CIRES),
University of Colorado at Boulder
9:30 -
9:45 Break
9:45 -
10:30
Overview of the Earth Exploration Toolbook, DataSheets, and team wiki pages, plus
downloading of tools and data for Tool Time sessions - Tamara Ledley and LuAnn Dahlman
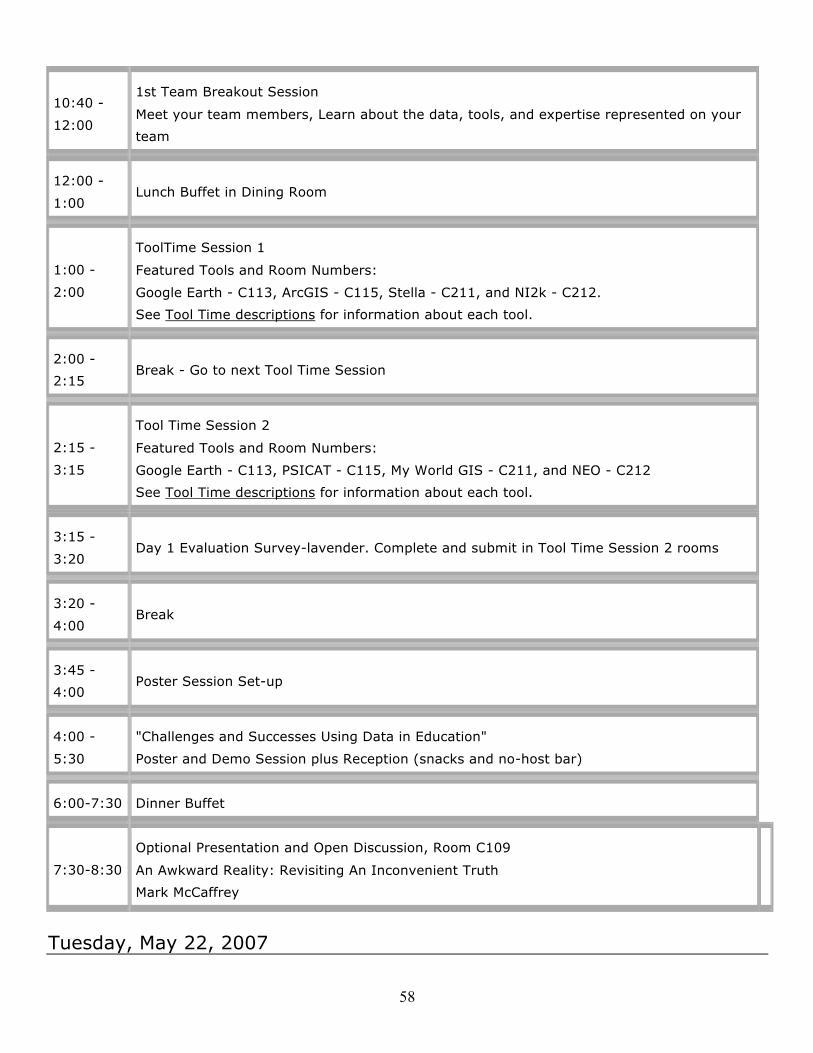
58
10:40 -
12:00
1st Team Breakout Session
Meet your team members, Learn about the data, tools, and expertise represented on your
team
12:00 -
1:00 Lunch Buffet in Dining Room
1:00 -
2:00
ToolTime Session 1
Featured Tools and Room Numbers:
Google Earth - C113, ArcGIS - C115, Stella - C211, and NI2k - C212.
See Tool Time descriptions for information about each tool.
2:00 -
2:15 Break - Go to next Tool Time Session
2:15 -
3:15
Tool Time Session 2
Featured Tools and Room Numbers:
Google Earth - C113, PSICAT - C115, My World GIS - C211, and NEO - C212
See Tool Time descriptions for information about each tool.
3:15 -
3:20 Day 1 Evaluation Survey-lavender. Complete and submit in Tool Time Session 2 rooms
3:20 -
4:00 Break
3:45 -
4:00 Poster Session Set-up
4:00 -
5:30
"Challenges and Successes Using Data in Education"
Poster and Demo Session plus Reception (snacks and no-host bar)
6:00-7:30 Dinner Buffet
7:30-8:30
Optional Presentation and Open Discussion, Room C109
An Awkward Reality: Revisiting An Inconvenient Truth
Mark McCaffrey
Tuesday, May 22, 2007
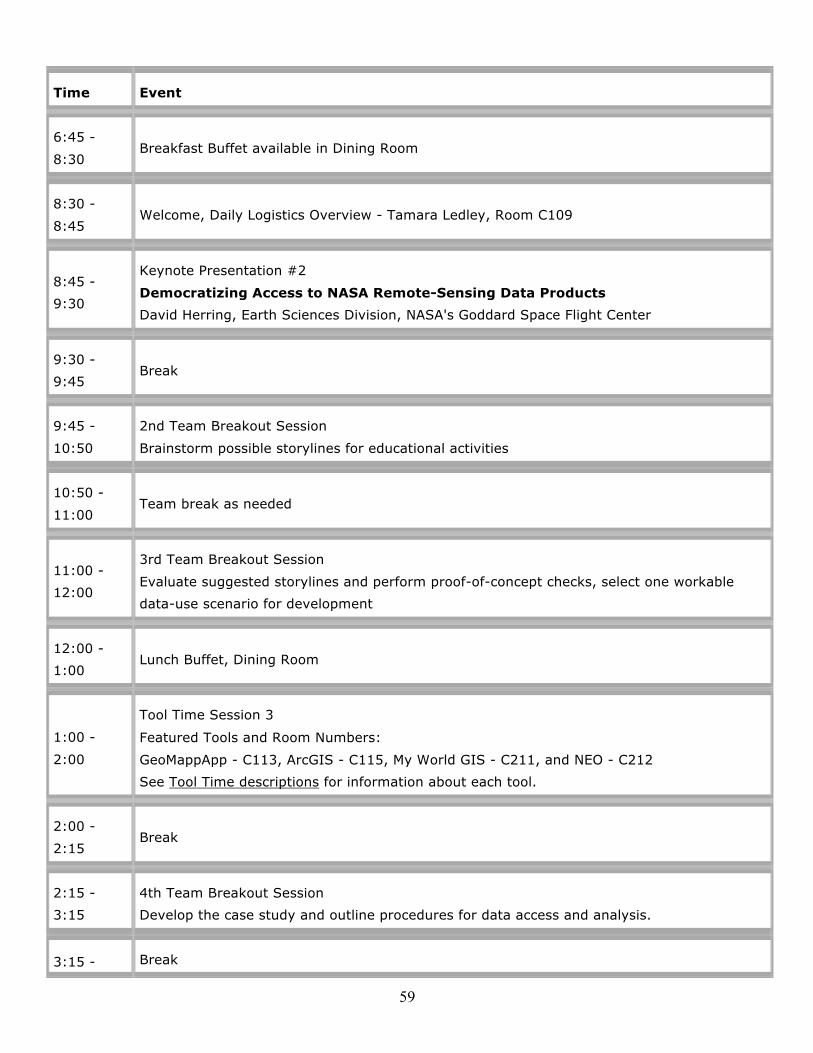
59
Time Event
6:45 -
8:30 Breakfast Buffet available in Dining Room
8:30 -
8:45 Welcome, Daily Logistics Overview - Tamara Ledley, Room C109
8:45 -
9:30
Keynote Presentation #2
Democratizing Access to NASA Remote-Sensing Data Products
David Herring, Earth Sciences Division, NASA's Goddard Space Flight Center
9:30 -
9:45 Break
9:45 -
10:50
2nd Team Breakout Session
Brainstorm possible storylines for educational activities
10:50 -
11:00 Team break as needed
11:00 -
12:00
3rd Team Breakout Session
Evaluate suggested storylines and perform proof-of-concept checks, select one workable
data-use scenario for development
12:00 -
1:00 Lunch Buffet, Dining Room
1:00 -
2:00
Tool Time Session 3
Featured Tools and Room Numbers:
GeoMappApp - C113, ArcGIS - C115, My World GIS - C211, and NEO - C212
See Tool Time descriptions for information about each tool.
2:00 -
2:15 Break
2:15 -
3:15
4th Team Breakout Session
Develop the case study and outline procedures for data access and analysis.
3:15 - Break

60
3:30
3:30 -
4:55
5th Team Breakout Session
Flesh out access and analysis procedures with info that will build users' knowledge about the
data and tools; suggest ideas for going further.
4:55 –
5:00 Day 2 Evaluation Survey-grey - Complete and submit in breakout rooms
6:00-7:30 Dinner Buffet, Dining Room
Wednesday, May 23, 2007
Time Event
6:45 - 8:30 Breakfast Buffet
8:30 - 8:50 Overview, Logistics, and Thank-yous (last time everyone is together) - Tamara Ledley,
Room C109
8:50 - 9:35
Keynote Presentation #3
Climate Change Studies Using Different Knowledge Systems
Elena Sparrow, International Arctic Research Center, University of Alaska, Fairbanks
9:35 - 9:50 Break
9:50 - 11:00
Final Team Breakout Session
Finalize activity outline. Upload summary PowerPoint Slides and all documents to team
wiki page.
11:00 -
11:15
Move to report out rooms, make certain team slides are available on projected computer.
Group 1: NCAR, NASA-AURA, AmericaView - Rm C212
Group 2: NCDC, NASA-NEO, IODP, GLOBE-Seasons&Biomes - Rm C113
Group 3: Project WET, NODC, GLOBE-Carbon Cycle, NSIDC - Rm C115
11:15 -
11:45 Team Report Out Sessions
11:45 -
12:00 Complete and submit Final Evaluation Survey-blue

61
12:00 Lunch Buffet (box lunches will be available for those who need to leave right away)