Embed Size (px)
Citation preview
Prepared by MORE Recycling for the American Chemistry Council
2018 National Post-Consumer Non-Bottle Rigid Plastic Recycling Report
August 2020
MORE RECYCLING • P.O. BOX 358 • SONOMA CA 95476 • 844.687.4757 MoreRecycling.com

2 2018 National Post-Consumer Non-Bottle Rigid Plastic Recycling Report
TABLE OF CONTENTS Introduction 3 Executive Summary 4 Methodology 6 Data Gaps and Assumptions 10 Findings 12 Discussion 16 Recommendations 17 Additional Information 19 Disclaimer and Copyright Notice 20

3 2018 National Post-Consumer Non-Bottle Rigid Plastic Recycling Report
INTRODUCTION The 2018 National Post-Consumer Non-Bottle Rigid Plastic Recycling Report is the twelfth annual report on pounds of post-consumer1 non-bottle rigid plastics—packaging and non-packaging—recovered2 for recycling in the United States (U.S.). Research for this report was conducted by MORE Recycling (MORE) for the Plastics Division of the American Chemistry Council.
1 The U.S. Environmental Protection Agency (EPA) defines “post-consumer material” as a material or a finished product that has served its intended use that is then diverted or recovered before it is disposed as solid waste. It is the material consumers and businesses collect for recycling; it does not include manufacturers’ waste, which is commonly reused in the original manufacturing process. The EPA defines “pre-consumer” as material that is recycled before it is used by a consumer (EPA WebArchive - https://archive.epa.gov/epawaste/conserve/smm/wastewise/web/html/buyq_a.html). This study uses EPA’s definition throughout this report, wherein “post-consumer” refers to plastics that have been previously used for their intended purpose by consumers and businesses. Commercial materials that have met their intended use are often recovered outside of curbside or drop-off collection programs and include items such as totes, pallets, crates, and other commercial packaging. This report does not cover the recycling of post-industrial (pre-consumer) materials. An example of post-industrial material is scrap and trimmings that are generated in manufacturing and converting processes. 2 “Recovery” or “recovered” throughout this report refers to material collected for recycling and sold to domestic or export buyers.

4 2018 National Post-Consumer Non-Bottle Rigid Plastic Recycling Report
EXECUTIVE SUMMARY Data reported indicate that at least 1.3 billion pounds of post-consumer non-bottle rigid plastic was recovered for recycling in 2018. As in previous years, the majority of non-bottle rigid plastic was purchased by U.S. and Canadian reclaimers. Domestic recovery of non-bottle rigid plastic for recycling has steadily increased, as shown in the chart below. However, the total amount recovered in 2018 dropped by 46.6 million pounds, which is a 3.5 percent decrease compared to 2017. Export purchases peaked in 2014 but have declined 63 percent since then, with a decline of 35 percent from 2017-2018. Exports made up only 13 percent of non-bottle rigid plastic recycled in the U.S. in 2018. Domestic reclaimers continued to purchase more non-bottle rigid plastic by an additional four percent compared to 2017.3 Total non-bottle rigid plastic recycling increased over 50 percent since 2010, while exports decreased by 50 percent since 2010. Figure 1: Purchases of U.S. Post-Consumer Recovered Non-Bottle Rigid Plastic
In addition to the continued trend of more material flowing to domestic reclaimers than export markets, more material was purchased, segregated by resin, than mixed. In 2018, 80 percent of non-bottle rigid plastic recovered for recycling was segregated by resin, compared to 77 percent in 2017. The remaining 20 percent recovered in 2018 was mixed resin material; 16 percent was mixed resin rigid bales and four percent was electronic scrap plastic. U.S. and Canadian reclaimers4 purchased four percent more segregated non-bottle rigid material compared to 2017. Export purchases dropped for both mixed and segregated material. Mixed resin rigid bale purchasing fell overall, due to a decline in export across bale categories and despite increased domestic purchases of 3-7 Bottles and Small Rigid Plastic and Mixed Bulky Rigid Plastic bales.
3 United States’ and Canadian purchases of non-bottle rigid plastics are combined throughout this report and may be referred to collectively as “domestic” purchases so as to distinguish them from material that is exported overseas. 4 MORE Recycling surveys and counts material from reclaimers, which are defined as companies that wash post-consumer material or otherwise process unwashed material into a clean feedstock or end product.
5 2018 National Post-Consumer Non-Bottle Rigid Plastic Recycling Report
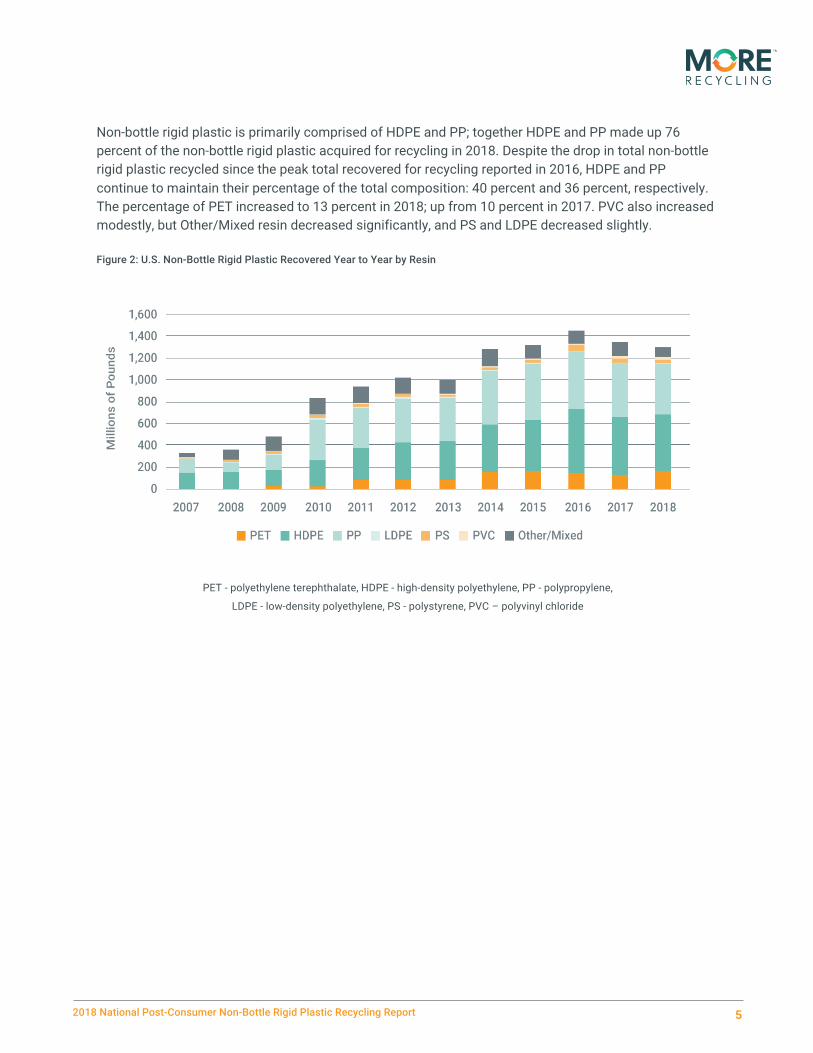
Non-bottle rigid plastic is primarily comprised of HDPE and PP; together HDPE and PP made up 76 percent of the non-bottle rigid plastic acquired for recycling in 2018. Despite the drop in total non-bottle rigid plastic recycled since the peak total recovered for recycling reported in 2016, HDPE and PP continue to maintain their percentage of the total composition: 40 percent and 36 percent, respectively. The percentage of PET increased to 13 percent in 2018; up from 10 percent in 2017. PVC also increased modestly, but Other/Mixed resin decreased significantly, and PS and LDPE decreased slightly. Figure 2: U.S. Non-Bottle Rigid Plastic Recovered Year to Year by Resin
PET - polyethylene terephthalate, HDPE - high-density polyethylene, PP - polypropylene,
LDPE - low-density polyethylene, PS - polystyrene, PVC – polyvinyl chloride

6 2018 National Post-Consumer Non-Bottle Rigid Plastic Recycling Report
METHODOLOGY Data on recovered post-consumer non-bottle rigid plastic are collected through a voluntary, annual plastic recycling survey that also gathers data on bottles, film and other plastics. THE FOLLOWING STEPS ARE TAKEN TO PREPARE THE REPORT
• MORE continually updates its markets database to include current exporters, reclaimers, and other handlers of plastic scrap;
• MORE conducts an electronic survey of market participants in plastic recycling to collect data; and • MORE undertakes a follow-up step for survey-collected data, to help check the accuracy of the data
through follow-up calls, conversations with industry contacts, and reviews of other sources of recycling industry information.
Data Collection and Analysis MORE regularly updates a proprietary database of plastic exporters, processors, reclaimers, and key brokers to help ensure that the survey reaches the key plastic scrap buyers of North American plastic.5 MORE uses a custom-designed, web-based survey system to gather data. Although the overall methodology has not changed since the first report, MORE seeks ways to improve the completeness and timeliness of survey responses with each iteration. These changes allow for better material flow tracking and assist with prevention of double counting. For example, MORE continues to expand questions related to non-mechanical recycling, as technology emerges in this space. The survey is distributed by sending an email with a unique link to each survey contact, including both U.S. and Canadian reclaimers, export buyers for post-consumer plastic, as well as some key players within the value chain, such as MRFs, brokers, and end users. After an appropriate amount of response time has passed, MORE employees send follow-up emails and make telephone calls to retrieve data. The data are entered into the online survey tool, either directly by the company surveyed, or by MORE staff in conjunction with the relevant company. Incoming data are reviewed for accuracy, and follow-up calls are made as needed. After data collection is complete, the data are compiled and categorized based on the detail reported.6 Commodity categories from commingled/other collection7 may be a mixture of resins, or some combination of bottles, containers, bulky items, and other non-bottle rigid plastic. Some commodity categories are further segregated by resin and others are intentionally a combination of resin and product type.
5 Through its project work in the industry and on the websites it manages—PlasticsMarkets.org, RecycleMorePlastic.org, and directories on PlasticFilmRecycling.org— MORE regularly engages with companies and new contacts in this sector. MORE also identifies potential buyers through published market databases and conversations with suppliers, such as material recovery facilities (MRFs) and key reclaimers. 6 MORE conducts the survey and takes steps to maintain the confidentiality of individual responses; including procedures designed so that no individual company data are released, nor are any specific data that do not include at least three companies reporting. 7 Typically collected curbside or at a municipal drop off. Previous reports used “residential” as synonymous with commingled/other collection, but this material can include curbside collection from businesses.

7 2018 National Post-Consumer Non-Bottle Rigid Plastic Recycling Report
Where the commodities are a mix of bottle and non-bottle or resin, the non-bottle rigid plastic portion of the mixed rigid bales reported by respondents is calculated for this report by applying the content percentages of resin and product type from the 2014/15 mixed rigid bale composition study with some adjustment given industry-provided audit data since that study.8 Since 2016, the 2014/2015 study data has been used for the reports whereas previous reports dating back to 2011 used the 2011 composition study.9 The final data totals are reviewed, analyzed, and reported in as much detail as possible without compromising the confidentiality of the participating companies’ individual responses. In order to determine trends and identify anomalies that may require further vetting, the analysis includes year-to-year comparisons of the totals, material categories, and trends among export and U.S. and Canadian buyers. This quality control, which often requires follow-up with survey responders, is essential to determining if there has been an actual shift or just an entry error by the responder. Clarification may also be needed to determine whether reported material can be counted as post-consumer/commercial or if it is, in fact, post-industrial scrap. Describing how the data are collected, as well as what is and is not included in the survey, provides readers of this report with the transparency needed to cross-reference the results with other available industry data. Survey Categories MORE is involved in the plastic recycling industry’s work to harmonize commodity categories and the terminology used by the industry. Updates to categories are reflected in MORE’s survey, this report, and in the other tools and resources that MORE manages. This is critical in order to report on the key materials, to avoid misunderstanding, and to further support harmonization of terminology used in the industry.10 The model bale specifications, maintained by the Association of Plastic Recyclers (APR), are a key resource in this process.11 The 2018 survey included the following rigid plastic categories: Mixed Resin Rigid Plastic
• 3-7 Bottles and Small Rigid Plastics - Bottles are mostly PP (PET and HDPE bottles have mostly been removed) also includes 1-7 containers (tubs, lids, cups, trays, clamshells) and products (non-packaging items like hangers)
• 3-7 Bottles and All Other Rigid Plastics - Bottles are mostly PP (PET and HDPE bottles have been removed) also includes 1-7 containers, products (see above) and large items (buckets, totes, crates, lawn furniture, carts, storage bins and other large items)
• 1-7 Bottles and Small Rigid Plastics - All bottles, containers (tubs, lids, cups, trays, clamshells) and products (non-packaging items like hangers)
8 National Mixed Rigid Plastic Bale Composition Study, Association of Plastic Recyclers (APR), July 2015. 9 National Mixed Rigid Plastic Bale Composition Study & Analysis of Non-Bottle Rigid Plastic Available for Recycling, Association of Plastic Recyclers (APR), 2011. 10 The Plastic Recycling Terms and Tools resource is intended to help harmonize terminology across the plastic recycling value chain. This resource can be found at https://www.recycleandrecoverplastics.org/recycling-professionals/education/terms-tools-app/. 11 Bale specifications maintained by the Association of Plastic Recyclers (APR) are in alignment with the Plastic Recycling Terms and Tools, https://www.plasticsrecycling.org/resources/model-bale-specs.
8 2018 National Post-Consumer Non-Bottle Rigid Plastic Recycling Report
• 1-7 All Rigid Plastics - All bottles, containers, products (see above) and large items (buckets, totes, crates, lawn furniture, carts, storage bins and other large items)
• Mixed Bulky Rigid Plastics - A mix of large items that are a mix of resins, but mostly PE and PP (buckets, totes, crates, lawn furniture, carts, storage bins and other large items)
• Mixed Clamshell - A mixture of PET, PP, PS, and PVC thermoformed containers (trays, cups, clamshells, boxes)
• Other Mixed Bottle and Non-bottle Rigid Plastic - A “catch-all” category, defined on a case-by-case basis.
Plastic Further Segregated by Resin
• PET Thermoforms - PET packaging not including bottles or jars (includes but not limited to egg cartons, baskets, clamshell containers, cups, lids, cake domes, covers, tubs, deli containers, trays and folded PET sheet containers)
• HDPE Colored Bottles with Containers - Pigmented bottles and containers; containers are typically canisters or jars
• PP Small Rigid Plastics - PP bottles, containers and products (includes but not limited to prescription bottles, yogurt cups, margarine tubs, ice cream tubs, cold drink cups, tofu tubs, dishwasher safe storage containers, hangers)
• PP All Rigid Plastics - PP bottles, containers, products (see above) and large items (buckets, totes, crates, lawn furniture, carts, storage bins and other large items)
• Tubs and Lids - Primarily PP and PE Non-bottle rigid household containers (yogurt cups, margarine tubs, ice cream tubs, cold drink cups)
• Tubs and Lids with Bulky - Primarily PP and PE Non-bottle rigid household containers (see above) and large items (buckets, totes, crates, lawn furniture, carts, storage bins)
• HDPE Injection Bulky Rigid Plastics - HDPE large plastics (includes buckets, totes, crates, lawn furniture, carts, storage bins), may include some bulky PP and LDPE
Other Categories
• Mixed Electronic Scrap - Primarily high impact polystyrene (HIPS), acrylonitrile butadiene styrene (ABS), polycarbonate (PC)
• Categories for Commercial Generated/Collected Non-Bottle Rigid Plastic Segregated by Resin - A list of major categories of non-bottle rigid plastic from commercial sources generating these commodities through their course of business or through special collection programs (e.g., PP battery casings). The list is based on categories that respondents have offered in previous surveys (e.g., HDPE injection drums-buckets-crates, PP hangers, PVC Flooring, and PC CDs). MORE also provides an “other” category for PET, HDPE, PP, PS, PVC, ABS, and PC within the survey
• Other Non-Bottle Rigid Plastic - A “catch-all” category for non-bottle rigid plastic segregated by resin that is different from the specific resin categories listed above
• Other Post-Commercial Mixed Rigid Plastic - A “catch-all” category for mixed resin rigid plastic that is generated from businesses, defined on a case-by-case basis

9 2018 National Post-Consumer Non-Bottle Rigid Plastic Recycling Report
The National Association for PET Container Resources (NAPCOR) conducts a separate, but similar, survey of U.S. and Canadian PET reclaimers. MORE does not survey these PET reclaimers and receives the aggregate data for non-bottle rigid plastic (e.g., thermoforms, cap and label material obtained through the PET bottle reclamation process and some post-commercial data) from NAPCOR. Circular Matters (Formerly Reclay StewardEdge Inc.) also assisted MORE in obtaining non-bottle rigid plastic recycling data for 2018, with a focus on closed loop recyclers.
10 2018 National Post-Consumer Non-Bottle Rigid Plastic Recycling Report
DATA GAPS AND ASSUMPTIONS Participation in the survey is voluntary and the reported data are based on the responses received. Many companies have limited resources to put towards participation in the survey, and some companies may choose not to respond due to their confidentiality policies. Therefore, because there is not 100 percent participation, the presented totals represent the minimum amount of non-bottle rigid plastic recovered for recycling and sold on the marketplace. Only data provided by North American reclaimers and exporters selling directly overseas, are included in the reported totals, unless MORE determines that data are missing in areas where substantive information from other reliable sources is available. If reclaimers omit their capacity data, MORE uses the pounds purchased for recycling as an estimate of their respective capacities. Data provided by brokers and MRFs are primarily used as a reference to better understand the flow of material, but MORE may include their data if enough information is provided that would enable attribution of material sold to a non-responding reclaimer or exporter. Again, since participation in the survey is voluntary, MORE sometimes receives responses from existing companies that did not previously respond. Changes in year-to-year recovery rates are often a combination of changes in actual collection, along with new information about material that was recycled in previous years, but not reported. When MORE can conclude the nature of an increase (or decrease), the reasoning is indicated. However, it can be difficult to make a reliable determination in any given year, depending on the depth of information MORE receives from plastic handling companies for previous years and while taking into account the need to protect the confidentiality of the data from individual responses. MORE tracks exporters’ purchasing of plastic through a number of industry resources. Except for the largest exporters, players in the export market come and go, and may change the type or mix of materials they purchase. Increased volatility in the export market began in 2017 with the National Sword policy in China, restricting the import of scrap materials. China’s Blue Sky plan, intended to curb pollution through continued restrictions on the import of scrap plastic, took effect in 2018 and remains in effect. In addition to the potential impact of non-responders, changes in how responders report pounds in the survey categories can impact the totals reported year over year. Mixed resin rigid bale commodities often require follow-up and a data quality check due to the inconsistent terminology used in the marketplace to describe these commodities. Post-commercial material, which is material from the commercial sector that has met its intended use, can be difficult to track because it is often purchased by companies that are also handling industrial scrap. To handle responses from industrial/commercial scrap recyclers, the survey specifically includes a detailed section on post-industrial plastic recycling to help differentiate and track post-commercial from post-industrial categories. As responses are received, responders are further engaged to determine if post-commercial material was handled that they may not realize is considered post-consumer. As previously mentioned, MORE applied the bale composition results from the 2014/15 study commissioned by the APR, adjusted based on additional industry data, to the mixed resin rigid plastic bale quantities reported by responders to arrive at the non-bottle portion of these bales, separated by

11 2018 National Post-Consumer Non-Bottle Rigid Plastic Recycling Report
resin.12 Only the plastic portions of the mixed resin rigid bales are included in the quantity totals; the waste is removed, unlike gross quantities that are used for most other recycled commodities. The composition of the mixed resin rigid bales may have begun to shift given the change in export purchasing. Based on separately available industry statistics for lead-acid battery and e-scrap recycling, it is likely that MORE did not receive survey responses from some key players in these sectors, and the total reported is likely less than the actual amount of plastic recycled from these two key recycling efforts.
12 National Mixed Rigid Plastic Bale Composition Study, Association of Plastic Recyclers (APR), July 2015.

12 2018 National Post-Consumer Non-Bottle Rigid Plastic Recycling Report
FINDINGS
Non-Bottle Rigid Plastic Recycled Data reported indicate 1.3 billion pounds of non-bottle rigid plastic was recovered in the U.S. for recycling in 2018. U.S. or Canadian reclaimers purchased approximately 87 percent of the 1.3 billion pounds in 2018, up from 80 percent in 2017, with the remainder exported overseas. As previously noted, because participation in the survey is voluntary, the data in the report represent a minimum total of non-bottle rigid plastic acquired for recycling.13
Table 1: U.S. Post-Consumer Non-Bottle Rigid Plastic Recovered Year Exported Purchase for Use in U.S. or Canada TOTAL (Millions of Pounds) Volume (Millions of Pounds) Percent Millions of Pounds)
2007 204.0 121.4 37% 325.4
2008 137.1 223.6 62% 360.8
2009 236.1 243.1 51% 479.2
2010 350.9 475.8 58% 826.7
2011 361.5 572.4 61% 933.9
2012 437.2 579.5 57% 1,016.7
2013 329.0 678.7 67% 1,007.7
2014 467.8 816.5 64% 1,284.3
2015 407.1 912.1 69% 1,319.2
2016 398.1 1,057.0 73% 1,455.1
2017 266.6 1,080.5 80% 1,347.1
2018 173.7 1,126.8 87% 1,300.5
13 Due to an additional effort to collect data from closed loop commercial reclaimers, MORE updated the 2015 data since the 2015 report was released, and that update is reflected in this report. The 2015 report documented 1.24 billion pounds and this report is updated to 1.32 billion pounds, a three percent increase over 2014. Additionally, when looking at year over year change, the increased post-commercial rigid plastic in 2010 compared to previous years is in large part due to new responders providing data for 2010 that likely also recycled in previous years.
13 2018 National Post-Consumer Non-Bottle Rigid Plastic Recycling Report
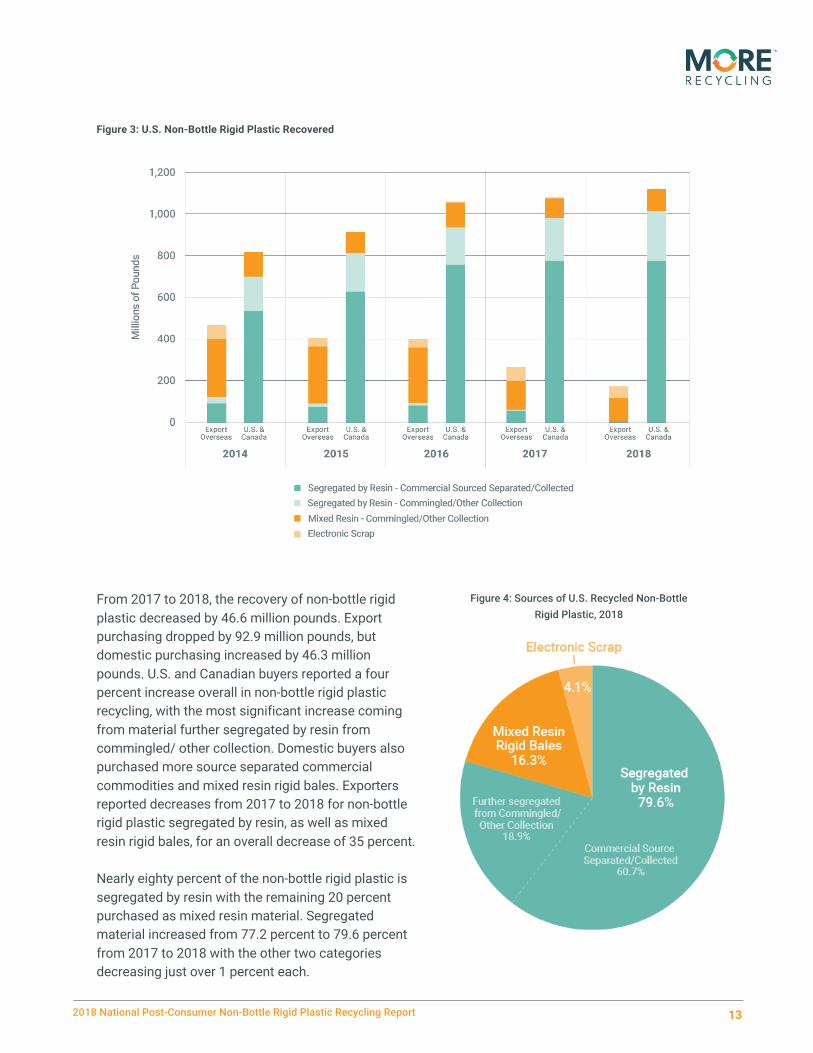
Figure 3: U.S. Non-Bottle Rigid Plastic Recovered
From 2017 to 2018, the recovery of non-bottle rigid plastic decreased by 46.6 million pounds. Export purchasing dropped by 92.9 million pounds, but domestic purchasing increased by 46.3 million pounds. U.S. and Canadian buyers reported a four percent increase overall in non-bottle rigid plastic recycling, with the most significant increase coming from material further segregated by resin from commingled/ other collection. Domestic buyers also purchased more source separated commercial commodities and mixed resin rigid bales. Exporters reported decreases from 2017 to 2018 for non-bottle rigid plastic segregated by resin, as well as mixed resin rigid bales, for an overall decrease of 35 percent. Nearly eighty percent of the non-bottle rigid plastic is segregated by resin with the remaining 20 percent purchased as mixed resin material. Segregated material increased from 77.2 percent to 79.6 percent from 2017 to 2018 with the other two categories decreasing just over 1 percent each.
Figure 4: Sources of U.S. Recycled Non-Bottle Rigid Plastic, 2018

14 2018 National Post-Consumer Non-Bottle Rigid Plastic Recycling Report
U.S. and Canadian markets continue to dominate the purchase of non-bottle rigid plastic further segregated by resin from commingled/other collection, reporting 99 percent of purchases in this category in 2018 and an increase of 16 percent compared to 2017. With a continued decline in purchases of mixed resin rigid bales by export markets, and some increase in domestic purchases, domestic markets purchased 50 percent of the non-bottle rigid plastic from mixed resin rigid bales in 2018. Figure 5: Non-Bottle Rigid Plastic from Commingled/Other Collection
In 2018, seventy-six percent of the non-bottle rigid plastic recycled was HDPE and PP (40 percent HDPE and 36 percent PP), comprising a significant majority of the non-bottle rigid plastic in mixed resin rigid bales and the majority of reported segregated resin material. The decline across all categories contributed to a decline in HDPE and PP resin totals, but HDPE and PP maintained the same respective percentage of total material as 2017. PET, at 13 percent in 2018, increased 38 million pounds primarily due to PET thermoforms recycled as part of PET bottle bales, and PVC modestly increased by 1.6 million pounds. The Other category (including mixed resins or otherwise unknown resin) represented the largest decrease in non-bottle rigid recycled in 2018 with a decrease of 39.5 million pounds, mainly due to a decrease in E-scrap and ABS reported. HDPE and PP shared equally in the second largest portion of the overall decrease in “Other” for 2018, at approximately 23 million pounds each. LDPE and PS modestly decreased by under one million pounds compared to 2017.
Figure 6: U.S. Post-consumer Non-Bottle Rigid Plastic Recovered in 2018 By Resin (Millions of Pounds)

15 2018 National Post-Consumer Non-Bottle Rigid Plastic Recycling Report
United States & Canadian Capacity and End Markets For 2018, MORE estimates there was approximately 1.3 billion pounds of non-bottle rigid plastic reclamation capacity in the U.S., a measure of total annual “pounds in” capacity to wash or process unwashed material directly into regrind, pellets, or end products. Canadian non-bottle rigid plastic reclamation capacity in 2018 was around 200 million pounds and absorbed both U.S. and Canadian material. It is important to acknowledge that there was likely additional grind capacity, in both the U.S. and Canada, for plastic scrap that was clean enough to be used unwashed that is not included in the reclamation capacity reported above. This material is often sold as regrind to manufacturers that use it as they would a washed flake or pellet. Most of the U.S. reclamation capacity for non-bottle rigid plastic is for relatively clean segregated PE and PP items, because it can be handled more cost effectively and often does not require washing. These items include, but are not limited to buckets, drums, crates, battery casings, storage bins, and hangers. End uses for non-bottle rigid plastics are automotive products, crates, buckets, pallets, lawn and garden products, and other relatively thick-walled injection molded products. A small portion of the non-bottle rigid plastic recovered is used in plastic lumber, rail ties and other extruded products.

16 2018 National Post-Consumer Non-Bottle Rigid Plastic Recycling Report
DISCUSSION NOTE: THE REMAINING SECTIONS OF THIS REPORT PRESENT DISCUSSION AND RECOMMENDATIONS THAT REFLECT
MORE RECYCLING’S EXPERTISE AND INDUSTRY KNOWLEDGE.
Survey data indicate an overall increase in non-bottle rigid plastic recycling since 2007, due in part to exporters buying the harder to recycle commodities, such as mixed resin rigid bales, but mostly due to growth in reclamation and manufacturing in North America. Mixed resin recycling streams are more susceptible to drops in the export market and world events, impacting the scrap marketplace for mixed resin commodities. Major events such as the Great Recession, Green Fence, Shale Gas Revolution, and National Sword had a greater impact on lower value mixed resin commodity pricing than segregated materials by product type, resin, and pigment. The collapse in demand from overseas markets was somewhat buffered by the increase in purchasing by buyers in North America. Fortunately, more capacity to handle mixed resin bales came online in 2018, easing the decline in demand from exporters for baled mixed rigid plastic coming out of a growing number of MRFs. MORE tracks the non-bottle rigid plastic recycling market throughout the calendar year. 2018 non-bottle rigid commodity prices were slightly more stable than in 2017, which experienced a precipitous drop for all categories. Some commodity prices increased in 2018, as was the case for PP Small Rigid Plastics. In response to the continued contracting demand from the export market, some MRFs are moving towards increased segregation of plastics to meet domestic market requirements; others have focused on the collection of PET and HDPE bottles only. PP remains in the middle of the infrastructure bottle neck. Roughly one third of the 3-7 Bottle and Small Rigid Plastic is PP, and even with markets purchasing PP, not all MRFs were equipped or had the means to sort out PP. The supply exists but there is limited sorting capacity to generate the bales that the market can absorb, thus creating a bottle neck. The fundamental challenges outlined in the 2017 Post-Consumer Non-Bottle Rigid Plastic Report persist. Most of the domestic reclamation capacity that does exist is setup to take segregated plastic material, and the U.S. is not well-positioned to sort beyond PET and HDPE bottles. Domestic sorting capacity and more processing capacity for non-bottle rigid plastic is essential to be able to handle the non-bottle rigid plastic from commingled/other collection that is available for recycling. Healthy end-use demand for recycled plastic is most essential for continued growth of non-bottle rigid plastic recycling. Finally, consumers need better incentives or motivators to recycle more and recycle right.

17 2018 National Post-Consumer Non-Bottle Rigid Plastic Recycling Report
RECOMMENDATIONS With stakeholders (e.g., consumer product goods companies, converters, legislators, and environmental non-profit organizations) continuing to demand plastic circularity, or the recovery of plastic and prevention of waste, there is a need to highlight the energy savings in using post-consumer resin (PCR) to stimulate more demand for PCR. According to a 2018 life cycle impact report commissioned by the Association of Plastic Recyclers, use of PCR offers significant energy savings when compared to virgin resin.14 Illustrating the benefits of using recycled content bolsters the value proposition of using PCR, which can stimulate investments to shore up the domestic infrastructure (sorting and processing) and engage all to participate in recycling. Demand for PCR is starting to grow, most prominently in Europe, although significant market disconnects remain. For example, PCR quality varies drastically and most of the demand is for the PCR that has near-virgin plastic quality. Using PCR in applications that currently use highly engineered resin and packaging formats, requires increased innovation in plastic recycling and recovery. Recyclers are dealing with more varied feedstock streams (i.e., different types of packaging), while also trying to compete with more specialized virgin resin for use in new products. The required resources for producing PCR are growing, alongside the increased specialization of plastic applications and the increased variety of plastic products on the market. Companies that put PCR in products are not yet widely recognized or rewarded for their greenhouse gas savings outside of environmental branding to a limited, but growing segment of consumers. When more consumers reward companies that use PCR through their purchase of PCR-containing products, we will likely see more drive for recycling and less plastic waste. Initiatives and policies designed to decrease environmental impacts and build circular value chains are essential. Three fundamental needs remain in order for non-bottle rigid plastic recycling to improve:
MORE DEMAND:
More demand to absorb the material currently collected (and the additional material with the potential to be collected)
• Given the economic competitiveness of virgin resin, without recognition of energy savings in material choices, demand will likely remain a challenge. Without demand there is a disincentive for improving the collection and processing infrastructure. There must be greater incentive for consumers (individuals and businesses) to engage in recycling.
IMPROVE SUPPLY:
Enhance and develop infrastructure to sort and process commingled non-bottle rigid plastic into segregated commodities
• Select reclaimers are setup to sort mixed resin rigid bales, but ultimately additional sorting at larger MRFs and secondary processing at MRFs unable to sort beyond PET and HDPE bottles is required to further segregate and consolidate the valuable rigid plastic beyond PET and HDPE bottles.
14 https://plasticsrecycling.org/images/apr/2018-APR-Recycled-Resin-Report.pdf.

18 2018 National Post-Consumer Non-Bottle Rigid Plastic Recycling Report
More education on what, where and why to recycle • Once there is demand for recycled plastic by end users, and therefore demand to process scrap
plastic for those end users, there will still be a need to motivate consumers to take the action of recycling.
Harmonization of Recycling Education & Design for Recycling MORE recommends that recycling education include greater emphasis on buying recycled content products to support the market pull for recycled plastics (see the Buy Recycled Products Directory). Improving the quality of the recycling stream can be enhanced by improving the original design of the product or package, as well as the handling and sorting practices for that package once the product has been used. With key tools like the APR Design Guide® for Plastics Recyclability and the How2Recycle label working in partnership, there has been positive movement in designing for recycling.15 However, with demand challenges for PCR, we recommend that future design goals strive for recyclability plus recycled content. Examples of full value chain alignment can be found on the new Recycling Market Development Platform. Circularity in Action, a platform to support recycling market development, is a holistic resource intended to support public and private initiatives aimed at improving the recycling ecosystem in the U.S. and highlighting companies and organizations engaging in the circular economy. The Platform connects people and organizations with tools made available by government, industry and NGOs, to take key actions required to increase opportunities and demand for post-consumer material that are critical for successful recycling. The Platform not only provides tools that connect buyers and suppliers of PCR and showcase products made with PCR, but it also recognizes entities using PCR and highlights the environmental benefits associated with using PCR. On the handling and sorting side of the system, we recommend clear, harmonized messaging. Many communities need support in determining what should go in the bin and resources to help them educate their residents. We recommend continued clarification and alignment on messaging and terminology across recycling organizations. Efforts from The Recycling Partnership, along with the Plastic Recycling Terms & Tools, initiative provide market based, research driven terms, images and messages.16
15 The APR Design Guide for Plastics Recyclability, http://www.plasticsrecycling.org/apr-design-guide/apr-design-guide-home; and, How2Recycle label - www.how2recycle.info. 16 https://www.recycleandrecoverplastics.org/recycling-professionals/education/terms-tools-app/.

19 2018 National Post-Consumer Non-Bottle Rigid Plastic Recycling Report
ADDITIONAL INFORMATION The Plastics Division of the American Chemistry Council (ACC), which provided funding to More Recycling (MORE) to prepare this report, provides resources to assist communities, businesses and others in increasing awareness and education about the recycling of plastic bottles, containers, plastic bags, and film. MORE is a recognized expert in the field of plastics recycling and has been conducting recycling studies for over 28 years. This work has been conducted and evaluated in an objective manner by persons qualified to do so, using procedures generally accepted in the profession. For information about recycling non-bottle rigid plastics, visit www.AmericanChemistry.com/Plastics. Also, visit www.PlasticsMarkets.org, which is maintained by MORE, for a directory of scrap plastic buyers and suppliers and access to additional resources, including the Buy Recycled Products Directory. This report and others on plastic recycling can be found at www.MoreRecycling.com.

20 2018 National Post-Consumer Non-Bottle Rigid Plastic Recycling Report
DISCLAIMER AND COPYRIGHT NOTICE The 2018 National Post-Consumer Non-Bottle Rigid Plastics Recycling Report was prepared to provide general information to readers interested in the recycling of plastics, in particular non-bottle rigid plastic materials. While provided in good faith, ACC, which sponsored the report does not make any warranty or representation, either express or implied, with respect to the accuracy or completeness of the information contained in this report; nor does ACC assume any liability of any kind whatsoever resulting from the use of or reliance upon any information or conclusion contained herein. This work is protected by copyright. ACC is the owner of the copyright, hereby grants a nonexclusive, royalty-free, revocable license to reproduce and distribute this work, subject to the following limitations: (1) the work must be reproduced in its entirety, without alterations; and (2) copies of the work may not be sold. Copyright © American Chemistry Council 2020.