Embed Size (px)
Citation preview

Prepared byHilary Hafner, Daniel Alrick, ShihMing Huang, and Adam Pasch
Sonoma Technology, Inc.Petaluma, CA
Presented at the 2010 National Air Quality ConferencesRaleigh, NC
March 15-18, 2010
3801
The Importance of MeteorologicalData in Exceptional Events Analysis

2
Outline
• Definition of an Exceptional Event
• Importance of meteorology in Exceptional Events; data sources and tools available
• Examples from past events
• Conclusions

3
What Are Exceptional Events?
Exceptional Events are unusual or naturally occurring events that can affect air quality but are not reasonably preventable using techniques air agencies can implement to meet National Ambient Air Quality Standards (NAAQS).
0
10
20
30
40
50
60
70
80
PM
2.5 (
µg
/m3 )
5/22
5/27
5/31
Three exceedance days in May 2007 were likely related to wildfires.

4
What Makes an Event Exceptional?
• To justify the exclusion of air quality data from NAAQS determination, the reporting agency must show
– A clear causal relationship between the measured values under consideration and an identified source,
– Measured value(s) are in excess of normal historical fluctuations, and
– No exceedance or violation would have occurred “but-for” the event.
• Exceptional Events cannot be caused by air mass stagnation, temperature inversions, high temperatures, lack of precipitation, or transport from anthropogenic sources.
Federal Register (72 FR 13560-13581). Treatment of Data Influenced by Exceptional Events; Final Rule. Vol.72, No. 55, Pages 13560-13581, March 22, 2007

5
Justifying an Exceptional Event
• Good meteorological data and useful or appropriate analysis tools must be available and put to use.
– Meteorological analyses help determine whether the event was unusual when compared to the historical record.
– Tools such as diffusion models and trajectory analyses are vital in examining pollution transport from unusual sources such as volcanoes, wildfires, and stratospheric ozone.
• No single data set necessarily has all the pertinent information.
– Surface meteorological and air quality instrumentation are usually not collocated.
– Sub-hourly information can be important (i.e., wind gusts).– Surface meteorology does not represent important aloft
meteorology.– Models may not be accurate.
6
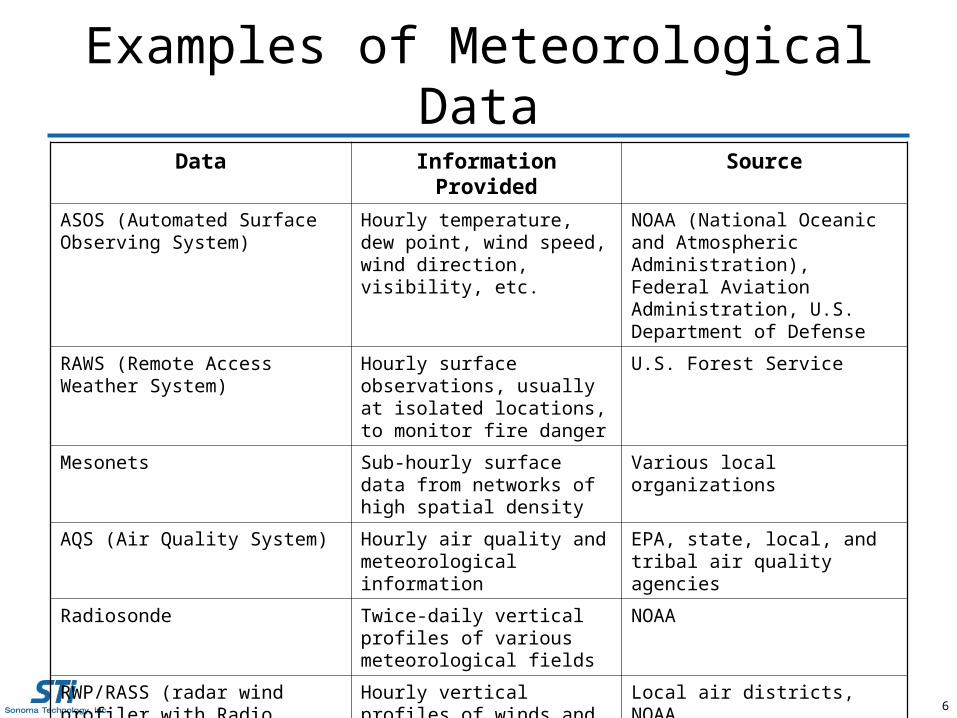
Examples of Meteorological Data
Data Information Provided Source
ASOS (Automated Surface Observing System)
Hourly temperature, dew point, wind speed, wind direction, visibility, etc.
NOAA (National Oceanic and Atmospheric Administration), Federal Aviation Administration, U.S. Department of Defense
RAWS (Remote Access Weather System)
Hourly surface observations, usually at isolated locations, to monitor fire danger
U.S. Forest Service
Mesonets Sub-hourly surface data from networks of high spatial density
Various local organizations
AQS (Air Quality System) Hourly air quality and meteorological information
EPA, state, local, and tribal air quality agencies
Radiosonde Twice-daily vertical profiles of various meteorological fields
NOAA
RWP/RASS (radar wind profiler with Radio Acoustic Sounding System)
Hourly vertical profiles of winds and temperature
Local air districts, NOAA
Satellites Monitor cloud cover, aerosols, visual images of smoke/dust
NASA/NOAA

7
Examples of Meteorology Analysis Tools
• Model predictions of pollution concentrations based on meteorological predictions
– BlueSky Gateway
– NOAA Model
– NAAPS (Navy Aerosol Analysis and Prediction System)
• Spatial analysis tools that use meteorological and/or air quality data
– AIRNow-Tech
– DataFed
– HYSPLITExample of output from a 12Z run of the NOAA model depicting predicted 1-hr maximum ozone concentrations (ppb)
http://www.nws.noaa.gov/aq/
8
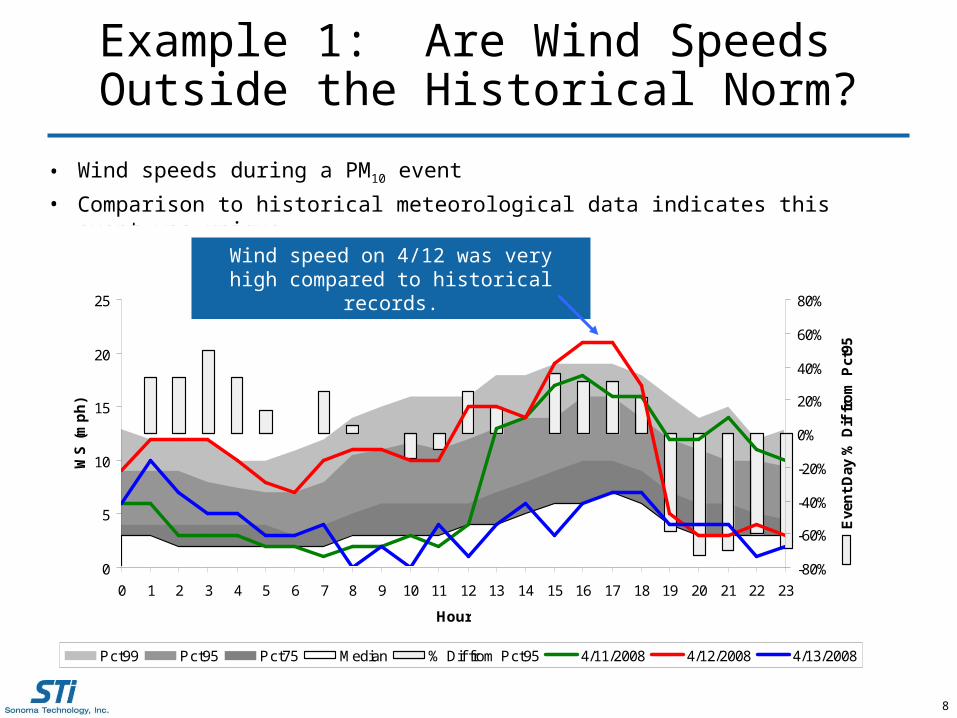
Example 1: Are Wind Speeds Outside the Historical Norm?
• Wind speeds during a PM10 event
• Comparison to historical meteorological data indicates this event was unique.
040134009 Diurnal WS
0
5
10
15
20
25
0 1 2 3 4 5 6 7 8 9 10 11 12 13 14 15 16 17 18 19 20 21 22 23
Hour
WS
(m
ph
)
-80%
-60%
-40%
-20%
0%
20%
40%
60%
80%
Eve
nt
Day
% D
if f
rom
Pct
95
Pct99 Pct95 Pct75 Median % Dif from Pct95 4/11/2008 4/12/2008 4/13/2008
0
100
200
300
400
500
600
700
800
900
01
23
45
67
89
1011
1213
1415
1617
1819
2021
2223
-100
%
-50%
0%50%
100%
150%
200%
Pct
99P
ct95
Pct
75M
edia
n%
Dif
from
Pct
954/
11/2
007
4/12
/200
74/
13/2
007
Wind speed on 4/12 was very high compared to historical records.
9
040134009 Diurnal PM10
0
100
200
300
400
500
600
700
800
900
0 1 2 3 4 5 6 7 8 9 10 11 12 13 14 15 16 17 18 19 20 21 22 23
Hour
Co
nce
ntr
atio
n (
µg
/m3 )
-100%
-50%
0%
50%
100%
150%
200%
Eve
nt
Day
% D
if f
rom
Pct
95
Pct99 Pct95 Pct75 Median % Dif from Pct95 4/11/2007 4/12/2007 4/13/2007
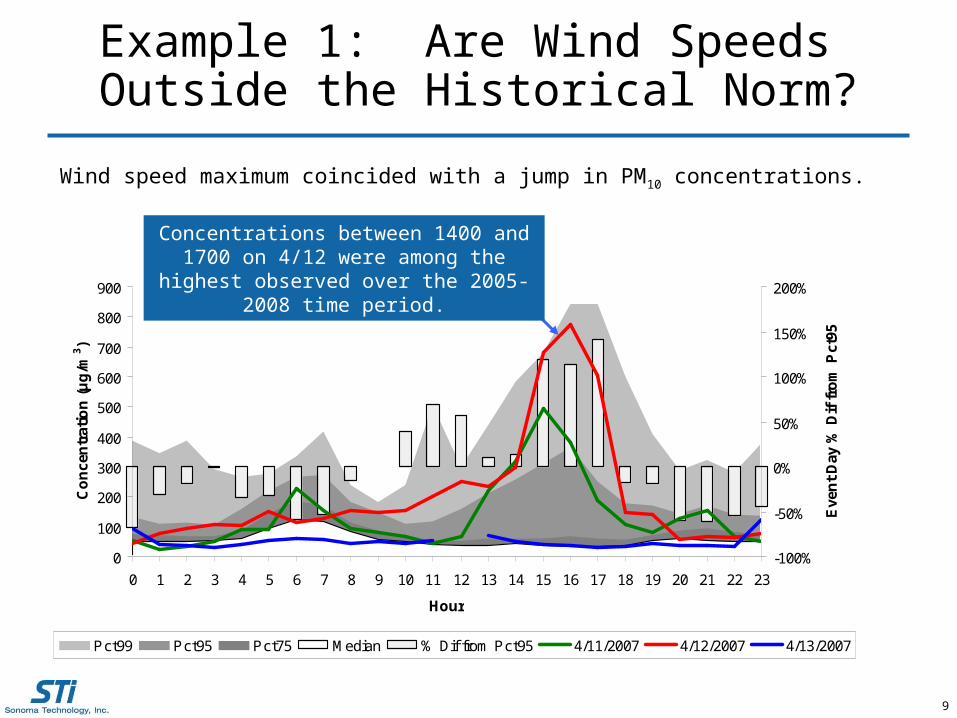
Example 1: Are Wind Speeds Outside the Historical Norm?
Wind speed maximum coincided with a jump in PM10 concentrations.
Concentrations between 1400 and 1700 on 4/12 were among the highest observed
over the 2005-2008 time period.
10
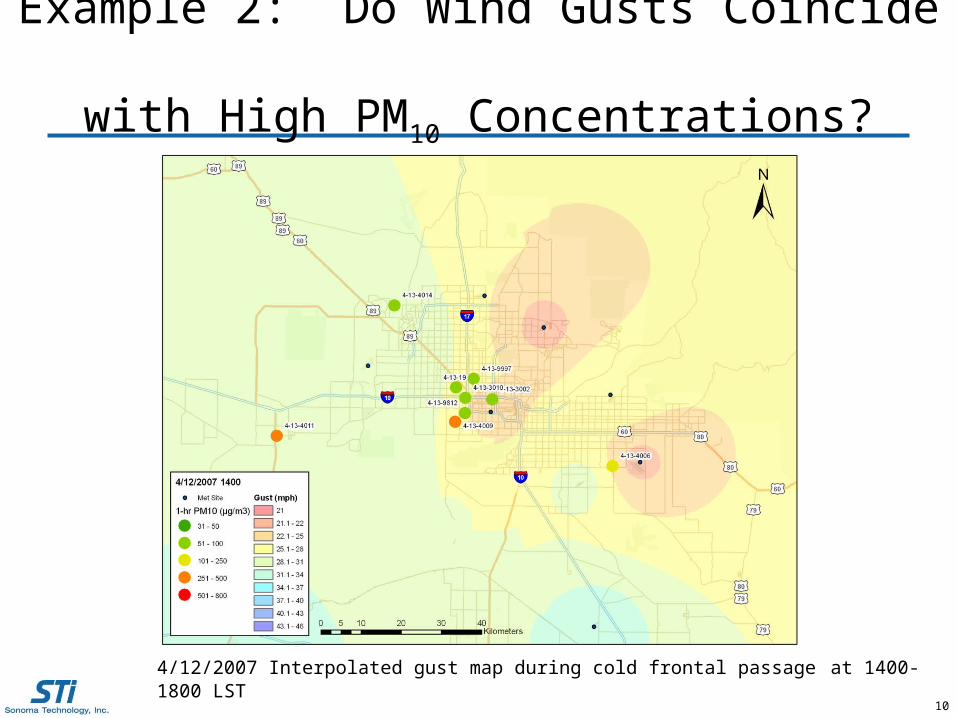
4/12/2007 Interpolated gust map during cold frontal passage at 1400-1800 LST
Example 2: Do Wind Gusts Coincide with High PM10 Concentrations?

11
4/12/2007 Interpolated gust map during cold frontal passage at 1400-1800 LST
Example 2: Do Wind Gusts Coincide with High PM10 Concentrations?

12
Note: Wind speed data are from AQS sites different from the meteorological sites that measure gust.
Example 2: Do Wind Gusts Coincide with High PM10 Concentrations?
4/12/2007 Interpolated wind speed map during cold frontal passage at 1400-1800 LST

13
Note: Wind speed data are from AQS sites different from the meteorological sites that measure gust.
Example 2: Do Wind Gusts Coincide with High PM10 Concentrations?
4/12/2007 Interpolated wind speed map during cold frontal passage at 1400-1800 LST

14
Example 2: Was the Wind Direction Different During the Event?
• Historical April wind rose suggests stronger winds come more frequently from the southwest and west.
• Strongest winds on the event day came from the northwest (circled in blue on second graph), indicating unique conditions.
Average April Winds Event Day Winds

15
Example 3: Was Transport of PM from Wildfires?
• DataFed-generated air trajectories indicate air parcels over the southeast came from a large fire in southern Georgia.
• The satellite-based Ozone Monitoring Instrument (OMI) shows high PM concentrations in the suspected source region.
• These tools help analysts make a case for an exceptional event.
DataFed-generated 24-hr backward trajectories and 24-hr average PM2.5
concentrations
OMI Aerosol Index
16
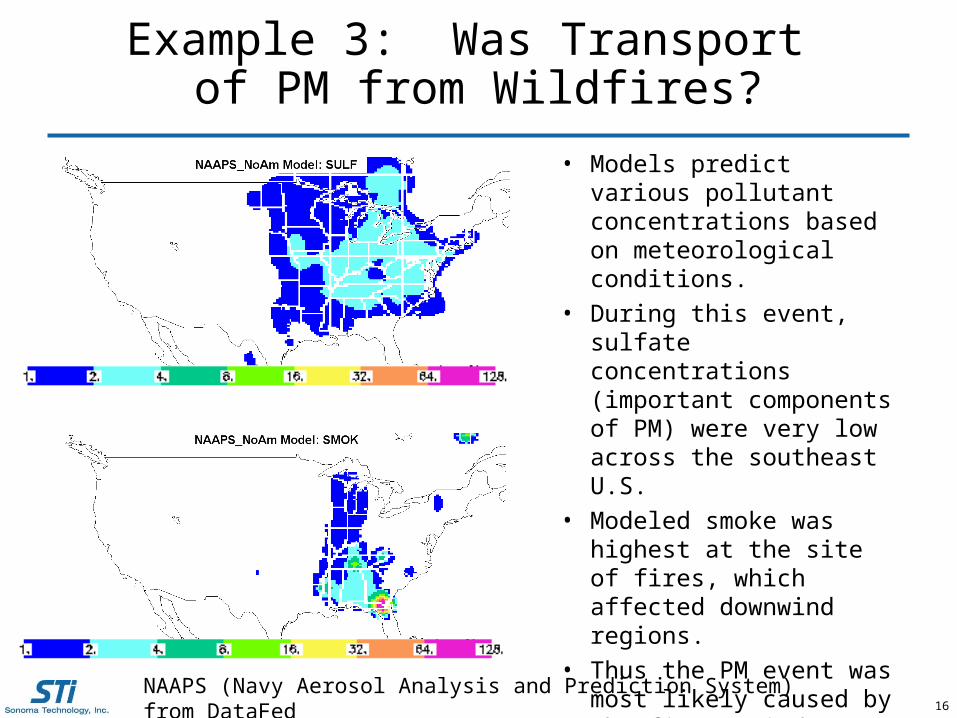
Example 3: Was Transport of PM from Wildfires?
• Models predict various pollutant concentrations based on meteorological conditions.
• During this event, sulfate concentrations (important components of PM) were very low across the southeast U.S.
• Modeled smoke was highest at the site of fires, which affected downwind regions.
• Thus the PM event was most likely caused by the fire upwind rather than by anthropogenic sulfate.
NAAPS (Navy Aerosol Analysis and Prediction System) from DataFed
17
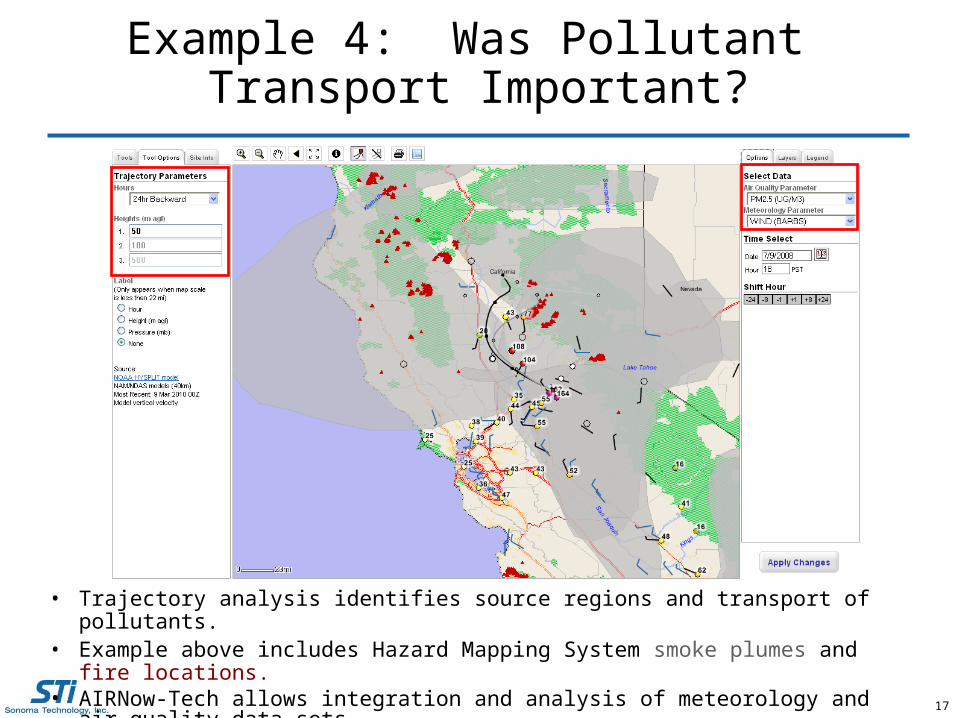
Example 4: Was Pollutant Transport Important?
• Trajectory analysis identifies source regions and transport of pollutants.• Example above includes Hazard Mapping System smoke plumes and fire locations.• AIRNow-Tech allows integration and analysis of meteorology and air quality data sets.

18
Example 5: What Would Concentrations Have Been?
• BlueSky Gateway models fire and non-fire PM2.5 separately.
• It also provides information on air quality “but-for” a wildfire; this aids Exceptional Events analysis.
• The accuracy of model predictions is tied in part to the quality and availability of meteorological data.
+ =

19
Conclusions
• The integration of air quality and meteorological data is vital in “telling the story” of an Exceptional Event.
• Properly justifying the exclusion of data due to an Exceptional Event may require multiple meteorological and air quality-related data sets, as well as a variety of analysis tools and atmospheric models.
Visible satellite showing extent of smoke plume from fires over southern Georgia. Red dot represents fire location Blue dot represents receptor location
Smoke

20
Selected Links to Data and Analysis Sources
• ASOS and Upper Air Data – www.weather.gov/observations.php
• AQS – www.epa.gov/ttn/airs/airsaqs• BlueSky Gateway – www.getbluesky.org• NOAA Air Quality Forecasting – www.arl.noaa.gov• NAAPS Model and Satellite Analyses –
www.nrlmry.navy.mil/aerosol• DataFed – www.datafed.net• AIRNow-Tech – www.airnowtech.org• MADIS – madis.noaa.gov