Embed Size (px)
Citation preview
Prepared by Food Bank For New York City
HUNGER’S NEW NORMAL:
REDEFINING EMERGENCY IN POST-RECESSION NEW YORK CITY
A Hunger Safety Net Report
ABOUT FOOD BANK FOR NEW YORK CITY
Food Bank For New York City recognizes 30 years as the city’s major hunger relief organization working to end food poverty in the five boroughs. As the city’s hub for integrated food poverty assistance, the Food Bank tackles the hunger issue on three fronts — food distribution, income support, and nutrition education. Through its network of community-based member programs citywide, the Food Bank helps provide 400,000 free meals a day to New York City residents in need. Its income support services help poor New Yorkers apply for SNAP benefits, and its free income tax services helps those who are employed gain access to the Earned Income Tax Credit, putting millions of dollars back into their pockets and helping them achieve greater dignity and independence. The Food Bank’s hands-on nutrition education programs in the public schools reach thousands of children, teens and adults who learn to eat healthfully on a budget. Learn how you can help at foodbanknyc.org.
© Copyright 2013 by Food Bank For New York City
Warehouse and Distribution Center:
Hunts Point Co-op Market
355 Food Center Drive
Bronx, NY 10474-7000
Phone: 718-991-4300
Fax: 718-893-3442
Administrative Office:
39 Broadway, 10th Floor
New York, NY 10038
Phone: 212-566-7855
Fax: 212-566-1463
www.foodbanknyc.org
Community Kitchen:
252 West 116 Street
New York, NY 10026
Phone: 212.566.7855
Fax: 212.662.1945
ACKNOWLEDGMENTS
BOARD OF DIRECTORS CHAIR, Rev. Henry Belin EXECUTIVE VICE CHAIR,Todd Aaron VICE CHAIR, Jewel Jones TREASURER, Robert Weinmann SECRETARY, John F. Fritts, Esq. Mario Batali Peter L. Bloom Anthony C. Bowe Gail Grimmett Carla A. Harris Tam Ho Gloria Pitagorsky Ralph L. Rogers, Jr. Lee Brian Schrager Eric Schwartz Eileen Scott Nancy Seliger Michael Smith Arthur J. Stainman Stanley Tucci Margarette Purvis President and CEO PRINCIPAL AUTHORS Gail Quets, Senior Director, Research and Evaluation Astrid Spota, Manager, Research and Evaluation Triada Stampas, Senior Director, Government Relations Zemen Kidane, Research and Evaluation Assistant
SPECIAL THANKS TO THE FOLLOWING FOR HELPING TO MAKE THIS REPORT POSSIBLE:
All of the emergency food program participants who generously gave of their time to participate in
interviews; staff and volunteers at Food Bank For New York City’s network of emergency food programs,
who helped recruit study participants; and Food Bank interns and volunteers, who helped conduct
interviews.
TABLE OF CONTENTS
PART ONE: EXECUTIVE SUMMARY ...................................................................................................... 1
PART TWO: INTRODUCTION ............................................................................................................... 5
PART THREE: KEY FINDINGS .............................................................................................................. 11
PART FOUR: REPORT HIGHLIGHTS .................................................................................................... 12
PART FIVE: FINDINGS ....................................................................................................................... 19
NUMBER OF UNIQUE INDIVIDUALS SERVED .............................................................................. 19 PATTERNS OF UTILIZATION ....................................................................................................... 20
Length of Use ................................................................................................................................. 20 Frequency of Use ............................................................................................................................ 22 Visiting Other Programs ................................................................................................................ 24 Response to Lack of Food ............................................................................................................... 27 EFP Participation by Other Household Members ........................................................................... 29 Knowledge of EFP’s ........................................................................................................................ 31 Commuting to EFP’s ....................................................................................................................... 33 EFP Program Satisfaction and Impact............................................................................................ 35
DEMOGRAPHICS: WHO USES EMERGENCY FOOD PROGRAMS? .................................................. 38 Participants' Racial/Ethnic Identity ................................................................................................ 38 Participants’ Birthplace .................................................................................................................. 39 Participants’ Citizenship ................................................................................................................. 40 Participants’ English Language Ability ........................................................................................... 41 Participants’ Education Level ......................................................................................................... 42 Participants’ Gender ...................................................................................................................... 43 Gender of All Members in Participants’ Households...................................................................... 43 Participants’ Age ............................................................................................................................ 44 Age of All Members in Participants’ Households ........................................................................... 45
Participants' Veteran Status…………………………………………………………………………………………………….. 45 HOUSEHOLD SIZE AND COMPOSITION ...................................................................................... 45
Household Size ............................................................................................................................... 46 Relationship of Participant to Members of His/Her Household ..................................................... 47 Children or Elderly in Household .................................................................................................... 48
INCOME AND EMPLOYMENT .................................................................................................... 49 Monthly Income ............................................................................................................................. 49 Annual Income ............................................................................................................................... 49 Below Poverty Level ....................................................................................................................... 50 Employment Status ........................................................................................................................ 51 Hours of Employment .................................................................................................................... 52 Length of Unemployment .............................................................................................................. 53 Receipt of Unemployment Insurance ............................................................................................. 54
INCOME SUPPORT PROGRAMS ................................................................................................. 54 Social Security ................................................................................................................................ 54 Supplemental Security Income (SSI)/Social Security Disability Insurance (SSDI) ........................... 55 Public Assistance ............................................................................................................................ 56
NUTRITION ASSISTANCE PROGRAMS ........................................................................................ 56 SNAP (Supplemental Nutrition Assistance Program) ..................................................................... 56 WIC (Special Supplemental Nutrition Program for Women, Infants and Children) ....................... 61 School Breakfast Program.............................................................................................................. 62 School Lunch Program.................................................................................................................... 63 SFSP (Summer Food Service Program) ........................................................................................... 64
HEALTH INSURANCE AND HEALTH CONDITIONS ........................................................................ 65 Health Insurance ............................................................................................................................ 65 Health Conditions ........................................................................................................................... 66
HOUSING ................................................................................................................................. 68 Housing Type .................................................................................................................................. 68 Rental Type .................................................................................................................................... 69
VOTER REGISTRATION AND HISTORY ........................................................................................ 70
PART SIX: POLICY IMPLICATIONS ...................................................................................................... 72
PART SEVEN: METHODOLOGY .......................................................................................................... 76
1
PART ONE: EXECUTIVE SUMMARY
Emergency food is most often used as the last line of defense against hunger; people turn to food
pantries or soup kitchens when income, benefits, and the generosity of friends and family have been
exhausted. The findings presented in this report provide insight into the experiences of the
approximately 1.4 million New York City residents currently relying on emergency food programs – a
number that has increased since 2007, when it stood at approximately 1.3 million.
In order to make food ends meet, most emergency food program participants must stitch together a
patchwork of resources in addition to emergency food – accessing income support and nutrition
assistance programs; relying on their own (often limited) income; and reaching out for support from
family and friends. Through the Great Recession and the anemic recovery that has followed,1 one of the
most important pieces of this patchwork has been the federal Supplemental Nutrition Assistance
Program, or SNAP (formerly known as Food Stamps). This report’s findings show:
Average SNAP benefits for emergency food program participants have increased considerably.
The average monthly household SNAP allotment for emergency food program participants
surveyed was $228, an increase of 55 percent from $147 in 2007.2 This largely reflects an
increase to benefits enacted by the American Reinvestment and Recovery Act (ARRA) in 2009.3
Despite increased benefit amounts, SNAP fails to last emergency food program participants
through the month. For three-quarters of emergency food program participants surveyed (75
percent), SNAP benefits lasted only three weeks into the month. This is an improvement from
2007, when a greater percentage of emergency food participants (84 percent) reported running
out of benefits within the first three weeks of the month.
At a time when SNAP faces deep and punishing cuts, these findings are a bleak omen. Although it is
heartening to report that SNAP benefits for emergency food program participants have increased, SNAP
benefits are still not sufficient to keep recipients off soup kitchen and food pantry lines. As of this
report’s publication, the benefit increase enacted under ARRA is scheduled to be clawed back in
November 2013, resulting in across-the-board cuts for every single SNAP recipient. An estimated 76
million meals will be lost in New York City alone – more food than Food Bank For New York City
distributes in a year. Additional cuts to SNAP are under consideration by Congress in the Farm Bill.
When cuts take effect, even fewer recipients will be able to stretch their SNAP dollars to cover an entire
month of grocery bills.
1 According to economists, the Great Recession started in December 2007 and ended in June 2009.
2 The $147 figure was reported in Food Bank For New York City’s NYC Hunger Safety Net 2007: A Food Poverty
Focus report, p. 34. 3 ARRA was passed as an economic stimulus package during the Great Recession, and included a boost to SNAP
benefits. While SNAP benefits are ordinarily indexed to annual changes in food costs, ARRA put into place an up-front SNAP benefit increase that was scheduled to expire when food inflation lifted underlying benefit amounts to the ARRA-boosted level.
2
Increases in the number of emergency food program participants who receive SNAP reflect a trend
begun after release of Food Bank For New York City’s 2004 Hunger Safety Net report, which revealed
that a shocking 69 percent of emergency food participants were not enrolled in SNAP. Strategic
investments of public and private dollars for targeted SNAP outreach and application assistance resulted
in an increase from 31 percent enrollment in 2004 to 46 percent enrollment in 2007. Continuing
outreach, along with a general swell in SNAP participation, resulted in a SNAP participation rate among
emergency food program participants of 57 percent in 2012. Without these focused SNAP outreach
efforts and the benefit boost ARRA provided, it is unlikely that the city’s emergency food system could
have performed as well as it did – particularly in light of the fact that by 2012, Food Bank For New York
City’s network had registered a 25 percent decrease in member soup kitchens and food pantries,
representing a loss of approximately 250 agencies.4
Emergency food program participants are among the city’s most vulnerable citizens. They are
overwhelmingly poor – 76 percent have household incomes at or below 100% of the federal poverty
level; 86 percent have household incomes at or below 130% of the poverty level; and 94 percent have
household incomes at or below 200% of the poverty level. Most often, they are people of color – 50
percent identify as African-American/Black, and 30 percent identify as Hispanic/Latino.
Thirty-six percent of emergency food program participants are unemployed, 24 percent are disabled,
and 21 percent are retired. Seven percent are veterans. Approximately one-quarter receive
Supplemental Security Income (SSI), and somewhat less than ten percent receive Social Security
Disability Income (SSDI).5 More than one-half report that they, or their families, are covered by
Medicaid. A little over 15 percent report receiving public assistance (or “welfare”). Forty percent of
those who rent their living space receive rental assistance in the form of a public housing unit or
participation in a Section 8 program. Eleven percent of emergency food program participants report
that they are homeless.
Although emergency food program participants remain a particularly disadvantaged group, changes in
the economy since the Great Recession have increased program participation by groups who are not
conventionally perceived as disadvantaged. Between 2007 and 2012, the percentage of participants
with a high school diploma or GED increased by 31 percent (from 26 percent to 34 percent), and percent
with some higher education or a college degree increased by 25 percent (from 24 percent to 30
percent). In addition, more New Yorkers who identify as Caucasian/White have turned to emergency
food. While still a small fraction of emergency food participants overall, the percentage of participants
on food pantry and soup kitchen lines who identified as Caucasian/White increased by 55 percent (from
9 percent to 14 percent).
4 Serving Under Stress Post-Recession: The State of Food Pantries and Soup Kitchens Today. Food Bank For New
York City, 2012. 5 Supplemental Security Income and Social Security Disability Insurance programs are the largest of several Federal
programs that provide assistance to people with disabilities. Financial need determines eligibility for SSI. To be eligible for SSDI benefits, potential recipients need to have worked for a certain period of time and paid Social Security taxes.
3
As regards performance, New York City’s soup kitchens and food pantries have succeeded in serving as a
vital source of needed nutrition. In 2012, almost 60 percent of emergency food program participants
reported that most of the produce they ate came from the emergency food program at which they were
surveyed, and approximately 40 percent reported that most of the protein they ate came from this
program. A majority of EFP participants reported satisfaction with the food they received at the
programs they visited.
Many emergency food program participants are accessing nutrition assistance programs besides SNAP,
though in many cases, participation is relatively low. Sixty percent of emergency food program
participants with school-aged children reported that their children participated in a school breakfast
program; seventy percent reported that their children participated in free school lunch. One-third of
emergency food program participants with school-aged children participated in the Summer Food
Service Program (SFSP). Almost one-half of emergency food program participants with children five
years of age or younger (48 percent) reported that their household participated in the Special
Supplemental Nutrition Program for Women, Infants, and Children (WIC). Increased participation by
emergency food program participants in these programs could help cushion the impact of cuts to SNAP
on the emergency food system.
Expiration of the SNAP provision in ARRA, and potential Farm Bill cuts, will take place in a still-weak
economy. A slow recovery from the Great Recession has so far failed to restore the jobs that were lost
during the downturn.6 As of December 2012, the unemployment rate in New York City was 8.8 percent,
almost double that of 4.8 percent unemployment at the start of the recession in December 2007.7
Moreover, the length of time that unemployed workers remain unemployed hit very high levels during
the Great Recession, and the recovery has not succeeded in bringing it back down.8
If high levels, and longer periods, of unemployment have played a role in pushing up the number of New
York City residents utilizing emergency food services, recent poverty figures underscore the continuing
need for these services. The poverty rate, which had been declining before the Great Recession, rose as
economic conditions worsened and still has not returned to previous levels. The rate increased to 21.2
percent in 2012, from 20.9 percent the year before, and 20.1 percent the year before that. Currently,
approximately 1.7 million New Yorkers are living in poverty.9
As unemployment and poverty continue to pose significant challenges, and the number of New Yorkers
visiting emergency food programs has increased, New Yorkers’ reliance on these services has grown.
Emergency food is no longer accessed only for short periods of time due to extenuating circumstances,
but is increasingly relied upon as a long-term means of keeping hunger at bay.
6 “Chart Book: The Legacy of the Great Recession,” Center on Budget and Policy Priorities. Special Series: Economic
Recovery Watch, updated May 3, 2013. 7 Unemployment data as calculated by the New York State Department of Labor in accordance with procedures
prescribed by the U.S. Department of Labor. 8 “Why is Unemployment Duration So Long?” by Rob Valletta and Katherine Kuang. FRBSF Economic Letter,
January 30, 2012. 9U.S. Census Bureau.
4
More than half of emergency food program participants (60 percent) reported they were long-term
visitors; i.e., had been coming for a year or more. Between 2007 and 2012, the percentage of
emergency food program participants visiting the program at which they were surveyed for less than
one year decreased (from 45 percent to 41 percent), and the percentage visiting for one year or more
rose (from 56 percent to 60 percent).
On average, food pantry and soup kitchen participants make multiple visits to emergency food programs
in a given month. Average number of visits made by soup kitchen participants over the last thirty days
to the program at which they were surveyed was 10.6. Average number of visits made by food pantry
participants over the last thirty days to the program at which they were surveyed was 3.3. One-half of
emergency food program participants reported also making visits to emergency food programs other
than the one at which they were surveyed. When total visits are considered (i.e., visits made to both the
program at which participants were surveyed and visits made to other programs), average number of
total visits made over the last thirty days by soup kitchen and food pantry participants rose to 13.3 and
3.4, respectively. The number of visits participants make to emergency food programs underscores the
fact that emergency food is used as a supplement to food obtained by other means.
Almost one-quarter of emergency food program participants reported that other members of their
household also visited emergency food programs. Average household size reported by emergency food
program participants was 2.0 for those surveyed at soup kitchens, and 3.0 for those surveyed at food
pantries. Approximately one-third of emergency food program households contained children, and
approximately one-third of emergency food program households contained someone 65 years of age or
older.
The importance of emergency food programs to the families they serve cannot be overstated. More
than one-half (55 percent) of emergency food program participants noted that without the program at
which they were surveyed, they would not have access to healthy, nutritious food. Forty two percent
said that they would go hungry without access to this program. When the stakes are this high, it is of
concern that even 20 percent of participants, as reported, had visited the program at which they were
surveyed only to find that no food was available.
The policy implications of this research are clear. SNAP works when benefit amounts are adequate;
cutting SNAP benefits ignores existing need and will only deepen food poverty. The strategies for SNAP
outreach which have proven successful among emergency food program participants should be
replicated to better connect these same participants to available federal child nutrition programs like
the Summer Food Service Program (SFSP) and the Special Supplemental Nutrition Program for Women,
Infants and Children (WIC). Last, in the face of looming cuts to SNAP benefits, protecting – and
bolstering – the emergency food supply must remain every policymaker’s imperative.
5
PART TWO: INTRODUCTION
Serving under Stress Post-Recession: The State of Food Pantries and Soup Kitchens Today examined the
operations of emergency food programs in New York City, nearly five years after the beginning of the
Great Recession (December 2007) and approximately three years after the start (June 2009) of a
disappointing economic recovery. Hunger’s New Normal: Redefining Emergency in Post-Recession New
York City is a companion to this report – it looks at emergency food program use from the point of view
of participants. Who are they? How often do they visit emergency food programs, and what kind of
experience do they have there? What is the extent of their participation in other nutrition assistance
programs, and in income support programs?
Data for Hunger’s New Normal: Redefining Emergency in Post-Recession New York City was collected via
a paper survey administered to 1,229 emergency food program participants at 141 emergency food
program sites across the five boroughs between November 9, 2011 and July 24, 2012. Data was
collected on a variety of topics, including patterns of participation, satisfaction with food service,
demographics, household composition, income and employment, participation in income support
programs, participation in nutrition assistance programs (like SNAP), housing, and health.
The information presented in this report represents responses from emergency food program
participants at both soup kitchens and food pantries. 265 program participants (22 percent) were
surveyed at soup kitchens, and 964 (78 percent) were surveyed at food pantries. Where possible,
comparisons to 2007 findings (from Food Bank For New York City’s NYC Hunger Safety Net 2007: A Food
Poverty Focus) are made.
Findings provide insight into the experiences of the approximately 1.4 million New York City residents
currently relying on emergency food programs. Note that the number of New York City residents relying
on emergency food programs has increased since 2007, when it stood at approximately 1.3 million. The
new 1.4 million figure comprises 815,000 adults ages 18 to 64 (up 12 percent from 730,000 in 2007),
339,000 children (down 15 percent from 397,000 in 2007), and 204,000 seniors (up 32 percent from
155,000 in 2007).
An increase in the total number of New York City residents relying on emergency food programs is not
surprising, given the economic context in which it has taken place. As noted above, New York City and
the nation were rocked by the Great Recession in December 2007. Although the beginnings of a
recovery were seen as early as June 2009, unemployment has remained a persistent problem, given the
extreme job loss created by the recession.10 As of December 2012, the unemployment rate in New York
City was 8.8 percent, almost double that of 4.7 percent unemployment at the start of the recession in
10
“Chart Book: The Legacy of the Great Recession,” Center on Budget and Policy Priorities. Special Series: Economic Recovery Watch, updated May 3, 2013.
6
December 2007.11 Moreover, the length of time that unemployed workers remain unemployed hit very
high levels during the Great Recession, and the recovery has not succeeded in pushing these levels back
down.12
Although unemployment benefits can keep some unemployed workers out of poverty and make
reliance on programs like emergency food less necessary, many low-wage workers aren’t eligible for
benefits, or their benefits run out before they find work.13 In the current economy, with job seekers
outnumbering available jobs, competition for any work, even low-wage work, is fierce, putting less-
skilled job seekers at a decided disadvantage. Moreover, even after unemployment rates fall, the
consequences of unemployment remain for individuals affected, as resources and support that might
otherwise be used to supplement earnings have been drained.14
More than one-third (36 percent) of emergency food program participants surveyed for this report
reported that they were unemployed. Only six percent of those who were unemployed reported
receiving unemployment insurance benefits. Between 2007 and 2012, the percentage of emergency
food program respondents who were unemployed rose by eight percentage points, or 29 percent. In
2012, nineteen percent of emergency food program participants reported that they were working, and
of those working, approximately 60 percent (62 percent) were working less than 35 hours per week.
Approximately one-quarter (27 percent) of emergency food program participants who reported that
they were unemployed reported that they had been unemployed for less than one year. Almost 20
percent (19 percent) reported that they had been unemployed for one to two years. More than one-
half (53 percent) reported unemployment of more than three years’ duration. Between 2007 and 2012,
the percentages of unemployed emergency food program participants reporting shorter periods of
unemployment dropped, and the percentages of unemployed participants reporting longer periods
rose.
If high levels, and longer periods, of unemployment play a role in pushing up the number of New York
City residents utilizing emergency food services, recent poverty figures underscore the continuing need
for these services. The poverty rate, which had been declining before the Great Recession, rose as
economic conditions worsened and still has not returned to previous levels. In 2012, 21 percent (1.7
million) of New York City residents were living below the federal poverty level, registering no change
from 21 percent in 2011.15 Average monthly household income reported by emergency food program
participants surveyed for this report (before taxes, and including wages, unemployment insurance,
11
Unemployment data as calculated by the New York State Department of Labor in accordance with procedures prescribed by the U.S. Department of Labor. 12
“Why is Unemployment Duration So Long?” by Rob Valletta and Katherine Kuang. FRBSF Economic Letter, January 30, 2012. 13
“Poverty in the United States” by Austin Nichols. Urban Institute, Unemployment and Recovery Project, September 12, 2012. 14
Ibid. 15
2012 American Community Survey. (2013). U.S. Census Bureau.
7
public assistance, Social Security and/or disability benefits) was $1,045. Approximately three-quarters
(76 percent) of emergency food program participants reported a household income that placed them at
or below 100 percent of the federal poverty level.
As unemployment and poverty continue to pose significant challenges, and the number of New Yorkers
visiting emergency food programs has increased, New Yorkers’ reliance on these services has also
grown. Emergency food is no longer accessed only for short periods of time due to extenuating
circumstances, but is increasingly relied upon as a long-term means of keeping hunger at bay.
Although approximately 40 percent of emergency food program participants surveyed reported that
they had been visiting the program at which they were surveyed for less than one year, a larger
percentage (60 percent) were long-term visitors; i.e., had been coming for a year or more. More than
one-quarter (27 percent) of long-term visitors had been visiting for one to two years; and 20 percent
had been visiting for three to five years. The remainder (13 percent) had been visiting the emergency
food program at which they were surveyed for six or more years. Between 2007 and 2012, the
percentage of emergency food program participants visiting the program at which they were surveyed
for less than one year decreased (from 45 percent to 41 percent), and the percentage visiting for one
year or more rose (from 56 percent to 60 percent).
Still, the number of visits participants make to emergency food programs implies that emergency food is
used as a supplement to food obtained by other means; i.e., that most program participants do not rely
on soup kitchens and food pantries alone for their meals. More than one-half of soup kitchen
participants (52 percent) surveyed reported making only one to five visits over the last thirty days to the
program at which they were surveyed. Two-thirds (66 percent) reported making ten or fewer visits.
Almost two-thirds of food pantry participants (63 percent) reported making only one or two visits over
the last thirty days to the program at which they were surveyed.
Supplemental Nutrition Assistance Program (also known as SNAP, or Food Stamps) benefits provide
emergency food program participants with another means of keeping themselves and their families fed.
As the recession brought hard times from which many still suffer, the number of New Yorkers
participating in SNAP increased dramatically. As of April 2012, 1.8 million New Yorkers were receiving
SNAP benefits, up 64 percent from the start of the recession in December 2007.16
Almost 60 percent (57 percent) of emergency food program participants surveyed reported that their
household received SNAP benefits. Between 2007 and 2012, receipt of SNAP benefits rose 14
percentage points among program participants surveyed at soup kitchens and 11 percentage points
among program participants surveyed at food pantries. Overall, receipt of SNAP benefits rose 11
percentage points. The average monthly SNAP benefit received by emergency food program
participants’ households was $228. Among survey respondents who reported that their household was
16
Analysis of SNAP data as reported by the New York City Human Resources Administration (HRA). This figure has continued to rise, hitting 1.9 million in April 2013.
8
receiving SNAP benefits, less than one-quarter (24 percent) reported that their benefits lasted four
weeks or more. Almost one-half (47 percent) reported that their benefits lasted two weeks or less.
Emergency food program participants may simultaneously utilize SNAP benefits and emergency food
services, or they may wait until their SNAP benefits and other resources are exhausted before turning to
soup kitchens or food pantries. One thing is clear: without the meals SNAP benefits can buy, New York
City’s emergency food network would be under pressure to provide more additional meals than it could
conceivably supply. The more food that can be purchased with SNAP dollars, the less reliant on
emergency food a family has to be. That is why Food Bank regards SNAP outreach as an extraordinarily
important part of its mission. In Serving under Stress Post-Recession: The State of Food Pantries and
Soup Kitchens Today, we reported that approximately one-half of soup kitchens (51 percent) had
information about SNAP available on-site, and that 44 percent had made referrals to SNAP offices (or to
other organizations processing SNAP applications). More than one-half of food pantries (56 percent)
had information about SNAP available on-site, and one-half (50 percent) made referrals to SNAP offices
or other organizations processing SNAP applications.
Emergency food program participants are also eligible for food assistance programs besides SNAP. Sixty
percent of emergency food program participants with school-aged children surveyed reported that their
children participated in a school breakfast program; seventy percent of emergency food program
participants with school-aged children reported that their children participated in a free lunch program.
Almost one-half of emergency food program participants with children five years of age or younger (48
percent) reported that their household participated in WIC. The reason most commonly cited for lack of
participation in WIC (reported by 29 percent of non-participating survey respondents with children five
years of age or younger) was simply that they were not aware of the program. Only one-third (33
percent) of emergency food program participants with school-aged children reported participation in
the Summer Food Service Program (SFSP). Again, the reason most commonly cited for lack of
participation in the Summer Food Service Program (reported by 32 percent of non-participating survey
respondents) was lack of knowledge about the program.
Keeping emergency food program participants informed not just about SNAP, but about all other
nutrition assistance programs available to them (especially WIC and the Summer Food Service Program),
and increasing eligible families’ participation in these programs, would presumably reduce their reliance
on emergency food, relieving pressure on a system struggling to serve everyone in need. Outreach on
behalf of these programs is therefore as important as outreach on behalf of SNAP.
Of course, not all low-income families and individuals are eligible for SNAP (citizenship and residency
requirements apply) and they may be ineligible, or lack access to, other nutrition assistance programs as
well. Also, as seen above, to put enough food on the table, many families surveyed combined
participation in SNAP and other nutrition assistance programs with reliance on soup kitchens and food
pantries. While outreach to increase participation in SNAP and other nutrition assistance programs is
important, it is also important that emergency food programs continue to serve those who enter their
doors with dignity and quality service.
9
Generally, emergency food program participants reported positive experiences with the soup kitchens
and food pantries they frequented. Almost three-quarters of emergency food program participants
overall (70 percent) reported that they were “very much” satisfied with service at the emergency food
program at which they were surveyed. Program participants’ responses reflected positively on recent
efforts to increase the amount of fresh produce distributed – almost 60 percent (57 percent) reported
that most of the fresh fruits and vegetables they ate came from the program at which they were
surveyed. (Serving under Stress Post-Recession: The State of Food Pantries and Soup Kitchens Today
reported that 88 percent of soup kitchens used fresh vegetables in their meals preparation, and 89
percent used fresh fruits. Eighty-eight percent of food pantries distributed fresh vegetables; and 85
percent, fresh fruits.) Forty-four percent of emergency food program participants overall reported that
most of the protein they ate came from the program at which they were surveyed; and 55 percent said
that without the program at which they were surveyed, they would not have access to healthy,
nutritious food.
The most frequently given explanation for dissatisfaction with a food program that was visited (reported
by only eight percent of respondents) was simply that there was not enough food served or distributed.
Twenty percent of emergency food program respondents reported that they had, at least once, visited
the program at which they were surveyed only to find that there was no food available. The latter fact
aligns with the finding, reported in Serving under Stress Post-Recession: The State of Food Pantries and
Soup Kitchens Today, that 63 percent of soup kitchens and food pantries reported running out of food
(or particular types of food required to produce adequate pantry bags or nutritious, balanced meals) at
some point during the previous twelve months.
When emergency food program participants report that they are unable to receive service at a program
they frequent, or an emergency food program reports that it has run out of food, the importance of
relieving pressure on an emergency food system which provides so many with access to healthy,
nutritious meals is highlighted. As noted above, one extremely important means of doing this is to
ensure that all emergency food program participants who are eligible to participate in SNAP and
nutrition assistance programs like WIC, school meals, and the Summer Food Service Program, do so.
Participation in these programs can reduce, or eliminate, some families’ reliance on emergency food,
and preserve quality service for those with nowhere else to turn.
Unfortunately, as this report goes to press, the SNAP program finds itself under attack. In November
2013, dramatic cuts to SNAP will take effect, and an estimated 76 million meals will be lost to New York
City residents. Worse yet, current versions of the Farm Bill, which is negotiated by Congress every five
years and determines funding not only for SNAP, but for emergency food distributed to soup kitchens
and food pantries (through the federal Emergency Food Assistance Program, or TEFAP) also propose
heavy cuts to SNAP, which could result in the loss of approximately 70 million to 130 million meals or
more.
The impact of cuts like these like these could cripple the emergency food system, as many more New
Yorkers turn to it in an attempt to alleviate hunger, and those that use it in combination with SNAP
10
benefits begin to rely on it more heavily. The satisfactory experience which most emergency food
program participants report could easily become a thing of the past, as lines get longer, pantry bags get
smaller, and emergency food program participants confront shortages at soup kitchens. Anti-hunger
advocates, including Food Bank For New York City, are advocating hard against SNAP cuts. Emergency
food program participants can themselves play a role in protecting SNAP benefits, thereby helping to
protect the stability of the emergency food system, by voting for anti-hunger advocates and SNAP
supporters – as noted in the report that follows, 77 percent of emergency food program participants are
U.S. citizens, 85 percent of those reporting citizenship are registered to vote, and 92 percent of those
registered to vote voted in the past.
11
PART THREE: KEY FINDINGS
The number of unique individuals accessing emergency food programs registered a small
increase from 2007 – rising from 1,281,061 in 2007 to 1,357,692 in 2012, even as approximately
250 food pantries and soup kitchens closed their doors.
Therefore, as the emergency food program network has contracted, remaining food pantries
and soup kitchens have managed to serve even more individuals than they did before.
Many emergency food program participants are also SNAP recipients (i.e., receive Food
Stamps). Fifty seven percent of EFP participants reported that the household participated in
SNAP.
Between 2007 and 2012, receipt of SNAP benefits rose 14 percentage points (or 32 percent)
among EFP participants surveyed at soup kitchens, and 11 percentage points (or 24 percent)
among EFP participants surveyed at food pantries.
Most EFP participants who reported receiving SNAP benefits had a household benefit level of
less than $200 per month.
Less than one-quarter (24 percent) of EFP participants receiving SNAP benefits reported that
their benefits lasted four weeks or more. Almost one-half (47 percent) reported that their
benefits lasted two weeks or less.
Between 2007 and 2012, the percentage of EFP participants reporting that their benefits lasted
four weeks or more increased eight percentage points (or 50 percent). The percentage of EFP
participants reporting that their benefits lasted two weeks or less decreased 13 percentage
points (or 22 percent).
Emergency food is no longer accessed only for short periods of time due to extenuating
circumstances, but is also relied upon as a long-term means of dealing with persistent hunger.
A majority of EFP participants reported satisfaction with the food they received at the programs
they visited, which serve as vital sources of nutrition.
Almost 60 percent of EFP participants reported that most of the produce they ate came from
the emergency food program at which they were surveyed, and approximately 40 percent
reported that most of the protein they ate came from this program.
Between 2007 and 2012, the number of EFP participants who were high school graduates, or
had a higher education, rose 14 percentage points (or 28 percent).
A majority of EFP participants are persons of color, but between 2007 and 2012, the percent
Caucasian/White rose five percentage points (or 55 percent).
12
PART FOUR: REPORT HIGHLIGHTS
Length of EFP Use
More EFP participants reported that they had visited the program at which they were surveyed
for one year or more than reported that they had visited for less than one year.
Between 2007 and 2012, the percentage of EFP participants who reported visiting the program
at which they were surveyed for one year or more rose.
Frequency of EFP Use
Two-thirds of EFP participants surveyed at soup kitchens reported making ten or fewer visits
over the last thirty days to the program at which they were surveyed.
Almost two-thirds of EFP participants surveyed at food pantries reported making one or two
visits over the last thirty days to the program at which they were surveyed.
Average number of visits made by soup kitchen participants over the last thirty days to the
program at which they were surveyed was 10.6.
Average number of visits made by food pantry participants over the last thirty days to the
program at which they were surveyed was 3.3.
Visiting Other Programs
One-half of EFP participants reported making visits to EFP’s other than the one at which they
were surveyed.
Total Frequency of EFP Use
Slightly less than two-thirds (64 percent) of participants who visited soup kitchens reported
making ten or fewer total visits over the last thirty days.
One-half of EFP participants who visited food pantries reported making one or two total visits
over the last thirty days.
Average number of total visits made over the last thirty days by soup kitchen participants was
13.3.
Average number of total visits made over the last thirty days by food pantry participants was
3.4.
13
Lack of Food
Twenty percent of EFP participants reported that they had, at least once, visited the program at
which they were surveyed only to find that they could not receive food.
EFP Participation by Other Household Members
Almost one-quarter of EFP participants surveyed reported that other members of their
household also visited EFP’s.
Knowledge of EFP’s
Word of mouth was the most frequently used method by which EFP participants reported that
they had first learned about the programs at which they were surveyed.
Commuting to EFP’s
Almost 60 percent of EFP participants reported that it took no longer than 15 minutes for them
to get from their home to the program at which they were surveyed.
Almost three-quarters of EFP participants reported that they walked to the program at which
they were surveyed.
EFP Program Satisfaction and Impact
The vast majority of EFP participants reported that they were “very much” or “somewhat”
satisfied with the program at which they were surveyed.
One-half (50 percent) of EFP participants reported that most of the food they ate came from the
food program at which they were surveyed.
More than 40 percent of EFP participants reported that they would go hungry without the
emergency food they received from the program at which they were surveyed.
Fifty-five percent of EFP participants reported that they would not have access to healthy,
nutritious food without the emergency food they received from the program at which they were
surveyed.
Racial/Ethnic Identity
One-half of EFP participants surveyed identified as African-American.
Thirty percent of EFP participants surveyed identified as Hispanic/Latino.
14
Birthplace
More than one-half of EFP participants (55 percent) reported being born in the United States.
Between 2007 and 2012, the percentage of EFP participants reporting that they were born in
the United States declined.
Citizenship
Approximately three-quarters of EFP participants reported that they were U.S. citizens.
Between 2007 and 2012, the percentage of EFP participants reporting U.S. citizenship declined.
English Language Ability
Almost three-quarters of EFP participants reported that their ability to speak English was
“excellent” or “good.”
Education
More than one-third of emergency food program participants surveyed had less than a twelfth
grade education. Another one-third (approximately) had graduated from high school or
obtained a high school equivalency degree. A final one-third (approximately) had been to
college or held a two-year, four-year, or advanced degree.
Between 2007 and 2012, the percentage of EFP participants surveyed who reported less than a
twelfth grade education declined, and percentages of EFP participants who reported high school
degrees, GED’s, or higher education rose.
Gender
EFP participants surveyed at soup kitchens were much more likely to be male; and EFP
participants surveyed at food pantries, much more likely to be female.
Between 2007 and 2012, soup kitchen participants showed an increase in percent female (four
percentage points) and a decrease in percent male (five percentage points).
Age
Almost three-quarters of EFP participants surveyed reported that they were between the ages
of 30 and 64.
Almost one-quarter (24 percent) of EFP participants surveyed reported that they were age 65 or
over.
15
Emergency food program participants surveyed at food pantries were more than twice as likely
to be age 65 or over than emergency food program participants surveyed at soup kitchens.
EFP Households
Average household size reported by EFP participants was 2.0 for those surveyed at soup
kitchens, and 3.0 for those surveyed at food pantries.
EFP participants surveyed at soup kitchens were more likely to report living alone than EFP
participants surveyed at food pantries.
EFP participants surveyed at soup kitchens were less likely than EFP participants surveyed at
food pantries to report living with their own children, living with a spouse or partner, living with
grandchildren, or living with other relatives.
Approximately one-third of EFP households contain children.
Approximately one-third of EFP households contain someone 65 years of age or older.
Income
Mean income reported by EFP participants surveyed at soup kitchens was lower than that
reported by EFP participants surveyed at food pantries ($950 vs. $1075).
Between 2007 and 2012, mean income rose for EFP participants surveyed at soup kitchens (by
19 percent) and for EFP participants surveyed at food pantries (by 8 percent).
Poverty
Approximately three-quarters of EFP participants reported a household income that placed
them at or below 100 percent of the federal poverty level.
Almost 95 percent of EFP participants reported a household income that placed them at or
below 200 percent of the federal poverty level.
Employment
Over one-third of EFP participants reported that they were unemployed.
Between 2007 and 2012, the percentage of EFP participants reporting unemployment rose.
Between 2007 and 2012, percentages of unemployed EFP participants reporting short periods of
unemployment dropped, and percentages of unemployed EFP participants reporting long
periods of unemployment rose.
16
EFP participants surveyed at soup kitchens were more than twice as likely as those surveyed at
food pantries to report being unemployed for more than five years.
Income Support Programs
Approximately one-quarter of EFP participants overall reported receiving Social Security
benefits.
Among EFP participants age 65 and above, almost two-thirds reported receiving Social Security
benefits.
EFP participants surveyed at food pantries were more than twice as likely as participants
surveyed at soup kitchens to report receipt of Social Security benefits.
Approximately one-quarter of EFP participants reported receiving Supplemental Security Income
(SSI).
Less than ten percent of EFP participants reported receiving Social Security Disability Insurance
(SSDI).
Sixteen percent of EFP participants reported receiving public assistance (or “welfare.”) EFP
participants surveyed at soup kitchens were more likely than EFP participants surveyed at food
pantries to report receipt of public assistance.
SNAP
Almost sixty percent of EFP participants reported receiving SNAP benefits.
Between 2007 and 2012, the percentage of EFP participants receiving SNAP benefits rose in
every borough.
The average SNAP benefit for EFP participants surveyed at soup kitchens was $221, and the
average SNAP benefit for EFP participants surveyed at food pantries was $231.
Only approximately one-quarter of EFP participants reported that their SNAP benefits lasted
four weeks or more.
Other Nutrition Assistance Programs
Almost one-half of EFP participants in households with children five years of age or younger
reported that their household participated in WIC.
Sixty percent of EFP participants in households with school-aged children reported that their
children participated in a school breakfast program.
17
Approximately three-quarters of EFP participants in households with school-aged children
reported that their children participated in a free or reduced-price lunch program.
Approximately one-third of EFP participants in households with school-aged children reported
that their children participated in the Summer Food Service Program (SFSP).
Health Insurance
Approximately 85 percent of EFP participants reported that they, or their family, had health
insurance coverage.
Approximately one-quarter of EFP participants reported that they, or their families, were
covered by Medicare.
More than one-half of EFP participants reported that they, or their families, were covered by
Medicaid.
Less than ten percent of EFP participants carried private insurance for themselves or their
families.
Health
Almost one-third of EFP participants reported suffering from hypertension.
Approximately 20 percent of EFP participants reported suffering from diabetes.
Approximately 20 percent of EFP participants reported suffering from asthma.
Housing
Approximately three-quarters of EFP participants reported that they rented their apartment.
Almost 60 percent of EFP participants who rented reported that they lived in private housing,
i.e., did not receive rental assistance in the form of a public housing unit or participation in a
Section 8 program.
Only 5 percent of EFP participants reported that they owned their own home.
Approximately ten percent of EFP participants reported that they were homeless.
EFP participants surveyed at soup kitchens were approximately four times as likely as those
surveyed at food pantries to be homeless.

18
Voting
Among EFP participants that reported citizenship, 85 percent said that they were registered to
vote.
Among registered voters, over 90 percent said that they had voted in the past.
19
PART FIVE: FINDINGS
NUMBER OF UNIQUE INDIVIDUALS SERVED
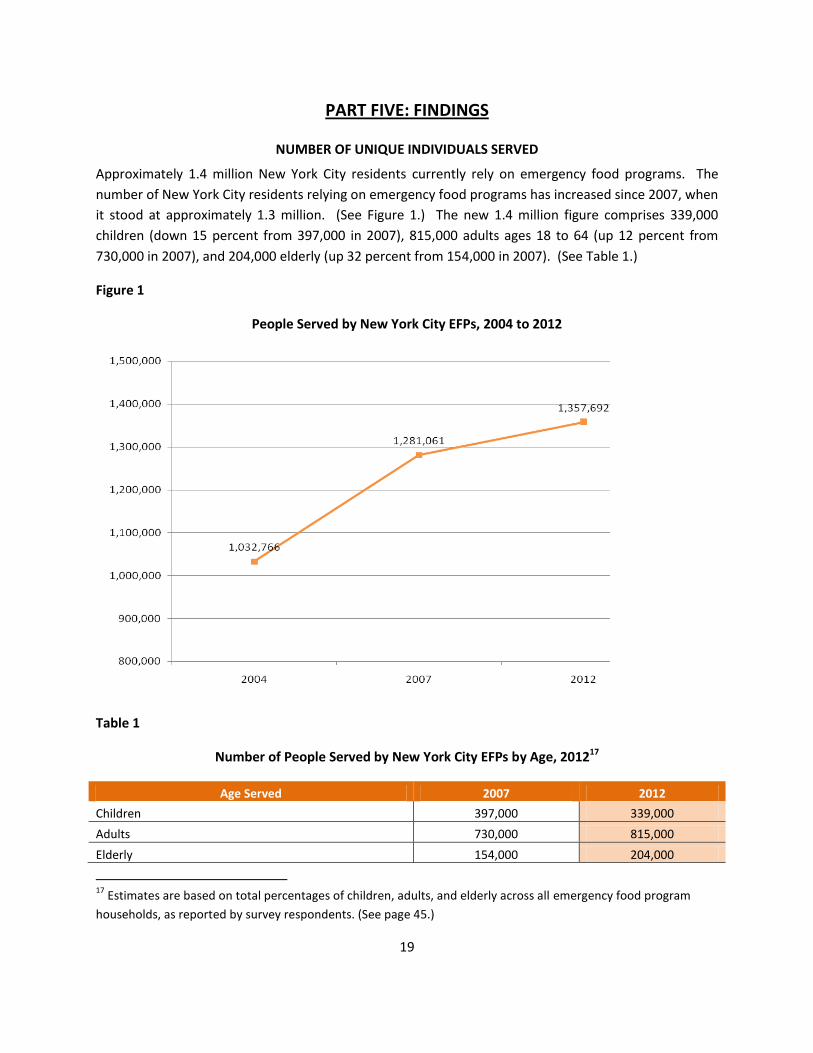
Approximately 1.4 million New York City residents currently rely on emergency food programs. The
number of New York City residents relying on emergency food programs has increased since 2007, when
it stood at approximately 1.3 million. (See Figure 1.) The new 1.4 million figure comprises 339,000
children (down 15 percent from 397,000 in 2007), 815,000 adults ages 18 to 64 (up 12 percent from
730,000 in 2007), and 204,000 elderly (up 32 percent from 154,000 in 2007). (See Table 1.)
Figure 1
People Served by New York City EFPs, 2004 to 2012
Table 1
Number of People Served by New York City EFPs by Age, 201217
Age Served 2007 2012
Children 397,000 339,000
Adults 730,000 815,000
Elderly 154,000 204,000
17
Estimates are based on total percentages of children, adults, and elderly across all emergency food program
households, as reported by survey respondents. (See page 45.)
20
The 1.4 million New Yorkers that rely on emergency food programs represent 16 percent of the city’s
population (which was 8,336,697 in 2012, according to the U.S. Census Bureau).
PATTERNS OF UTILIZATION
Length of Use
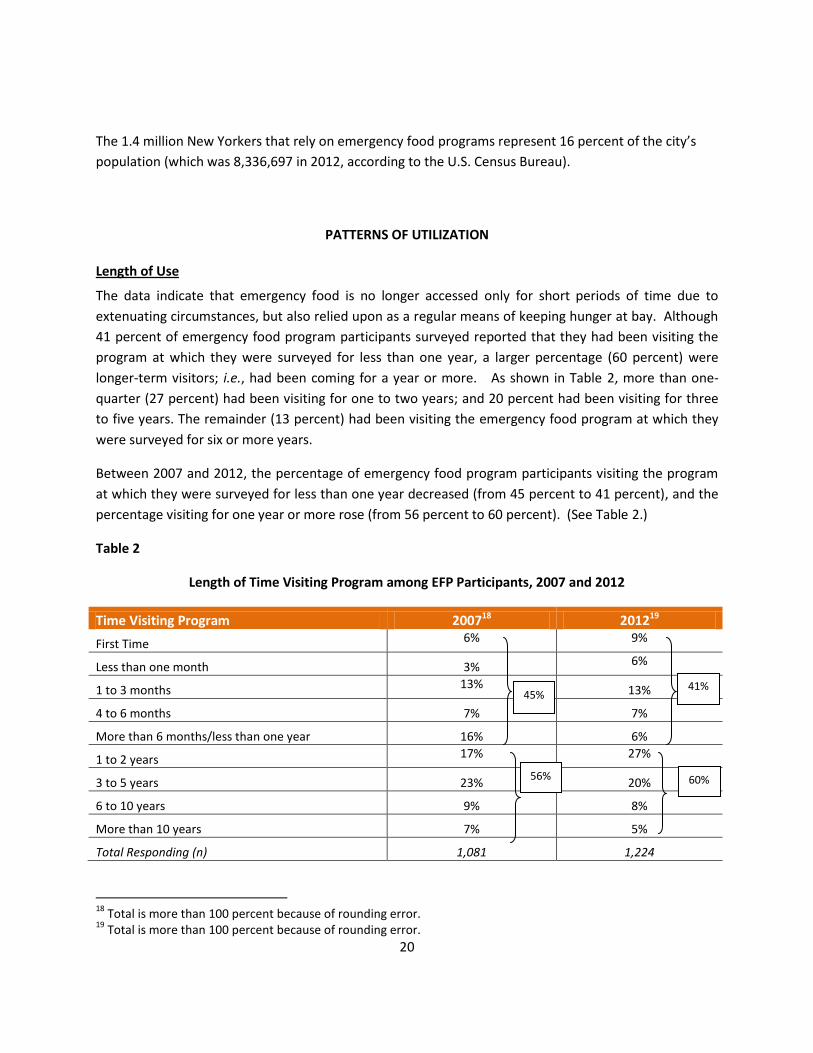
The data indicate that emergency food is no longer accessed only for short periods of time due to
extenuating circumstances, but also relied upon as a regular means of keeping hunger at bay. Although
41 percent of emergency food program participants surveyed reported that they had been visiting the
program at which they were surveyed for less than one year, a larger percentage (60 percent) were
longer-term visitors; i.e., had been coming for a year or more. As shown in Table 2, more than one-
quarter (27 percent) had been visiting for one to two years; and 20 percent had been visiting for three
to five years. The remainder (13 percent) had been visiting the emergency food program at which they
were surveyed for six or more years.
Between 2007 and 2012, the percentage of emergency food program participants visiting the program
at which they were surveyed for less than one year decreased (from 45 percent to 41 percent), and the
percentage visiting for one year or more rose (from 56 percent to 60 percent). (See Table 2.)
Table 2
Length of Time Visiting Program among EFP Participants, 2007 and 2012
Time Visiting Program 200718 201219
First Time 6% 9%
Less than one month 3% 6%
1 to 3 months 13% 13%
4 to 6 months 7% 7%
More than 6 months/less than one year 16% 6%
1 to 2 years 17% 27%
3 to 5 years 23% 20%
6 to 10 years 9% 8%
More than 10 years 7% 5%
Total Responding (n) 1,081 1,224
18
Total is more than 100 percent because of rounding error. 19
Total is more than 100 percent because of rounding error.
45%
56%
41%
60%
21
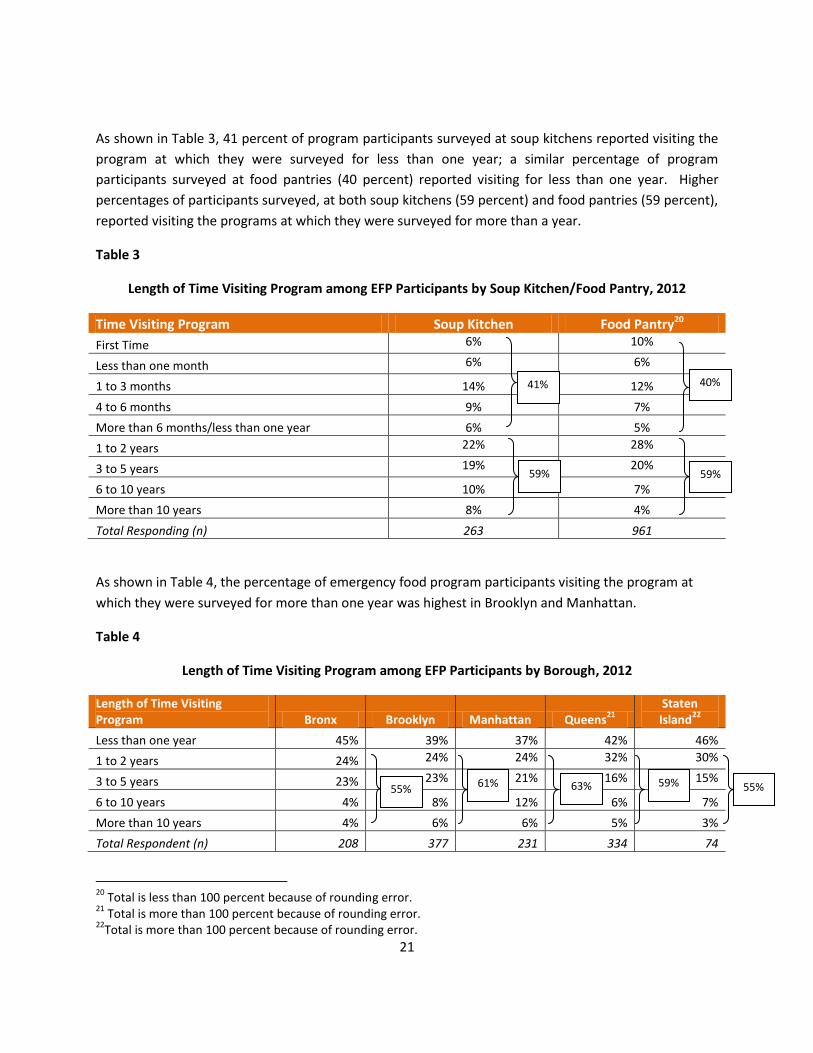
As shown in Table 3, 41 percent of program participants surveyed at soup kitchens reported visiting the
program at which they were surveyed for less than one year; a similar percentage of program
participants surveyed at food pantries (40 percent) reported visiting for less than one year. Higher
percentages of participants surveyed, at both soup kitchens (59 percent) and food pantries (59 percent),
reported visiting the programs at which they were surveyed for more than a year.
Table 3
Length of Time Visiting Program among EFP Participants by Soup Kitchen/Food Pantry, 2012
Time Visiting Program Soup Kitchen Food Pantry20
First Time 6% 10%
Less than one month 6% 6%
1 to 3 months 14% 12%
4 to 6 months 9% 7%
More than 6 months/less than one year 6% 5%
1 to 2 years 22% 28%
3 to 5 years 19% 20%
6 to 10 years 10% 7%
More than 10 years 8% 4%
Total Responding (n) 263 961
As shown in Table 4, the percentage of emergency food program participants visiting the program at
which they were surveyed for more than one year was highest in Brooklyn and Manhattan.
Table 4
Length of Time Visiting Program among EFP Participants by Borough, 2012
Length of Time Visiting Program Bronx Brooklyn Manhattan Queens
21
Staten Island
22
Less than one year 45% 39% 37% 42% 46%
1 to 2 years 24% 24% 24% 32% 30%
3 to 5 years 23% 23% 21% 16% 15%
6 to 10 years 4% 8% 12% 6% 7%
More than 10 years 4% 6% 6% 5% 3%
Total Respondent (n) 208 377 231 334 74
20
Total is less than 100 percent because of rounding error. 21
Total is more than 100 percent because of rounding error. 22
Total is more than 100 percent because of rounding error.
41%
59%
40%
59%
55% 63% 59% 55% 61%
22
Frequency of Use
Participant access to both food pantries and soup kitchens is dependent on programs’ days and hours of
operation.23 The data on participant visits presented below reflects a combination of need and access.
Participants report the number of visits they actually make – it should not be assumed that participants
would not have made more visits if opportunities to do so had existed. Also note that because soup
kitchens provide meals and not groceries, soup kitchen participants visit them more regularly than food
pantry participants visit pantries, to which providers may restrict food-related visits to once or twice per
month.
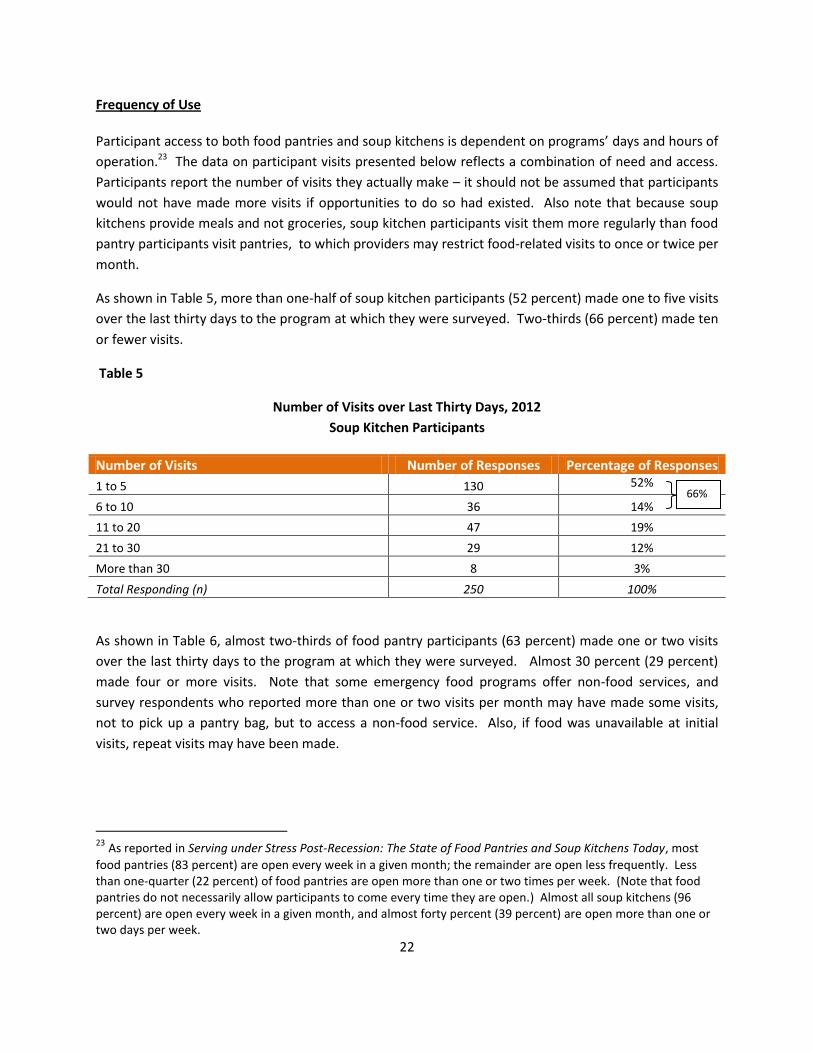
As shown in Table 5, more than one-half of soup kitchen participants (52 percent) made one to five visits
over the last thirty days to the program at which they were surveyed. Two-thirds (66 percent) made ten
or fewer visits.
Table 5
Number of Visits over Last Thirty Days, 2012
Soup Kitchen Participants
Number of Visits Number of Responses Percentage of Responses
1 to 5 130 52%
6 to 10 36 14%
11 to 20 47 19%
21 to 30 29 12%
More than 30 8 3%
Total Responding (n) 250 100%
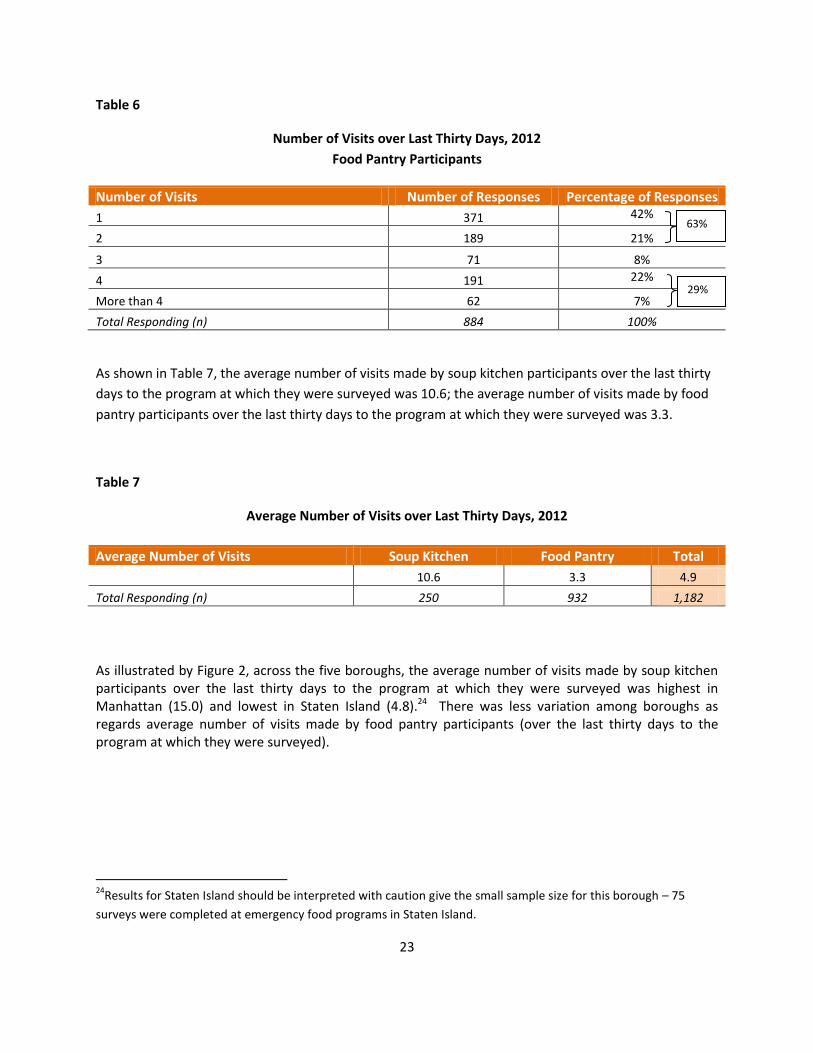
As shown in Table 6, almost two-thirds of food pantry participants (63 percent) made one or two visits
over the last thirty days to the program at which they were surveyed. Almost 30 percent (29 percent)
made four or more visits. Note that some emergency food programs offer non-food services, and
survey respondents who reported more than one or two visits per month may have made some visits,
not to pick up a pantry bag, but to access a non-food service. Also, if food was unavailable at initial
visits, repeat visits may have been made.
23 As reported in Serving under Stress Post-Recession: The State of Food Pantries and Soup Kitchens Today, most
food pantries (83 percent) are open every week in a given month; the remainder are open less frequently. Less than one-quarter (22 percent) of food pantries are open more than one or two times per week. (Note that food pantries do not necessarily allow participants to come every time they are open.) Almost all soup kitchens (96 percent) are open every week in a given month, and almost forty percent (39 percent) are open more than one or two days per week.
66%
23
Table 6
Number of Visits over Last Thirty Days, 2012
Food Pantry Participants
Number of Visits Number of Responses Percentage of Responses
1 371 42%
2 189 21%
3 71 8%
4 191 22%
More than 4 62 7%
Total Responding (n) 884 100%
As shown in Table 7, the average number of visits made by soup kitchen participants over the last thirty
days to the program at which they were surveyed was 10.6; the average number of visits made by food
pantry participants over the last thirty days to the program at which they were surveyed was 3.3.
Table 7
Average Number of Visits over Last Thirty Days, 2012
Average Number of Visits Soup Kitchen Food Pantry Total
10.6 3.3 4.9
Total Responding (n) 250 932 1,182
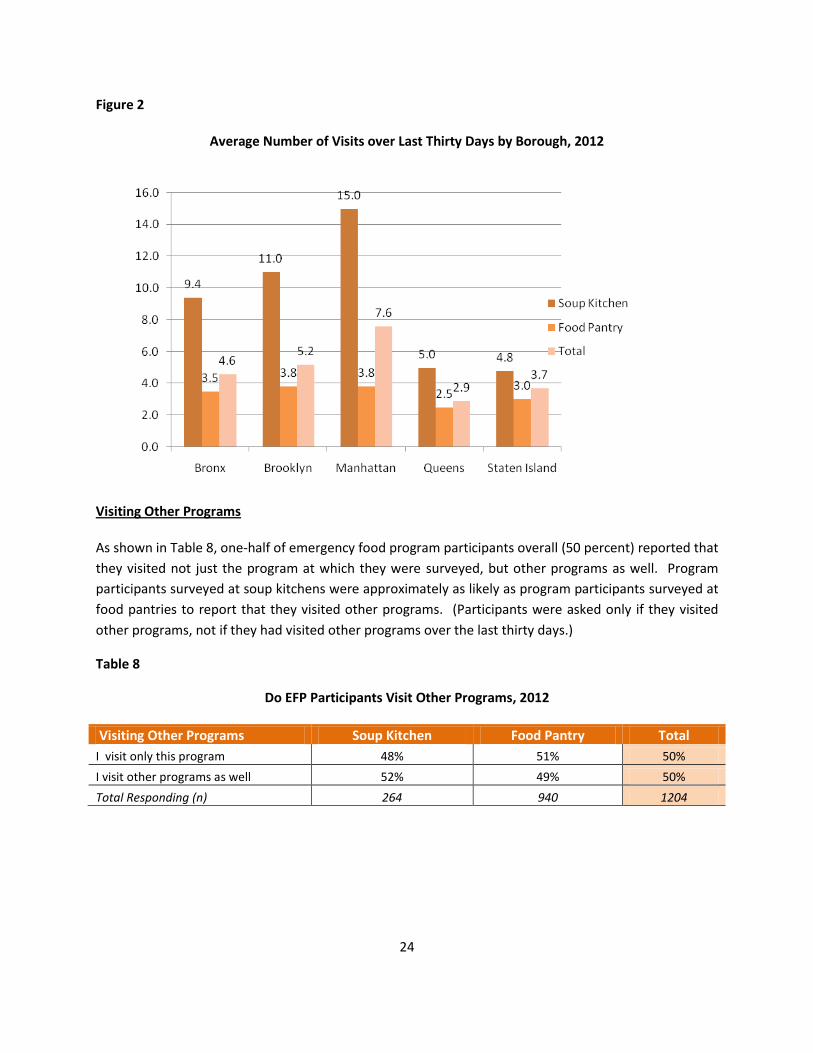
As illustrated by Figure 2, across the five boroughs, the average number of visits made by soup kitchen participants over the last thirty days to the program at which they were surveyed was highest in Manhattan (15.0) and lowest in Staten Island (4.8).24 There was less variation among boroughs as regards average number of visits made by food pantry participants (over the last thirty days to the program at which they were surveyed).
24
Results for Staten Island should be interpreted with caution give the small sample size for this borough – 75
surveys were completed at emergency food programs in Staten Island.
63%
29%
24
Figure 2
Average Number of Visits over Last Thirty Days by Borough, 2012
Visiting Other Programs
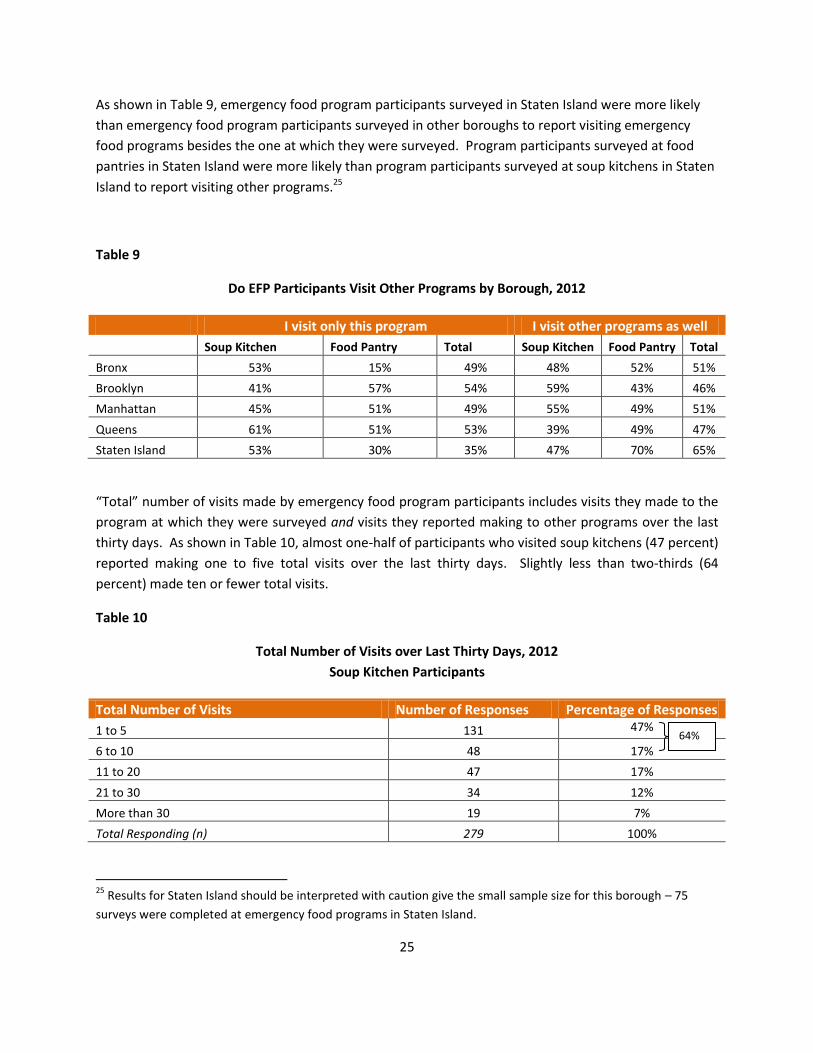
As shown in Table 8, one-half of emergency food program participants overall (50 percent) reported that
they visited not just the program at which they were surveyed, but other programs as well. Program
participants surveyed at soup kitchens were approximately as likely as program participants surveyed at
food pantries to report that they visited other programs. (Participants were asked only if they visited
other programs, not if they had visited other programs over the last thirty days.)
Table 8
Do EFP Participants Visit Other Programs, 2012
Visiting Other Programs Soup Kitchen Food Pantry Total
I visit only this program 48% 51% 50%
I visit other programs as well 52% 49% 50%
Total Responding (n) 264 940 1204
25
As shown in Table 9, emergency food program participants surveyed in Staten Island were more likely
than emergency food program participants surveyed in other boroughs to report visiting emergency
food programs besides the one at which they were surveyed. Program participants surveyed at food
pantries in Staten Island were more likely than program participants surveyed at soup kitchens in Staten
Island to report visiting other programs.25
Table 9
Do EFP Participants Visit Other Programs by Borough, 2012
I visit only this program I visit other programs as well
Soup Kitchen Food Pantry Total Soup Kitchen Food Pantry Total
Bronx 53% 15% 49% 48% 52% 51%
Brooklyn 41% 57% 54% 59% 43% 46%
Manhattan 45% 51% 49% 55% 49% 51%
Queens 61% 51% 53% 39% 49% 47%
Staten Island 53% 30% 35% 47% 70% 65%
“Total” number of visits made by emergency food program participants includes visits they made to the
program at which they were surveyed and visits they reported making to other programs over the last
thirty days. As shown in Table 10, almost one-half of participants who visited soup kitchens (47 percent)
reported making one to five total visits over the last thirty days. Slightly less than two-thirds (64
percent) made ten or fewer total visits.
Table 10
Total Number of Visits over Last Thirty Days, 2012
Soup Kitchen Participants
Total Number of Visits Number of Responses Percentage of Responses
1 to 5 131 47%
6 to 10 48 17%
11 to 20 47 17%
21 to 30 34 12%
More than 30 19 7%
Total Responding (n) 279 100%
25
Results for Staten Island should be interpreted with caution give the small sample size for this borough – 75
surveys were completed at emergency food programs in Staten Island.
64%
26
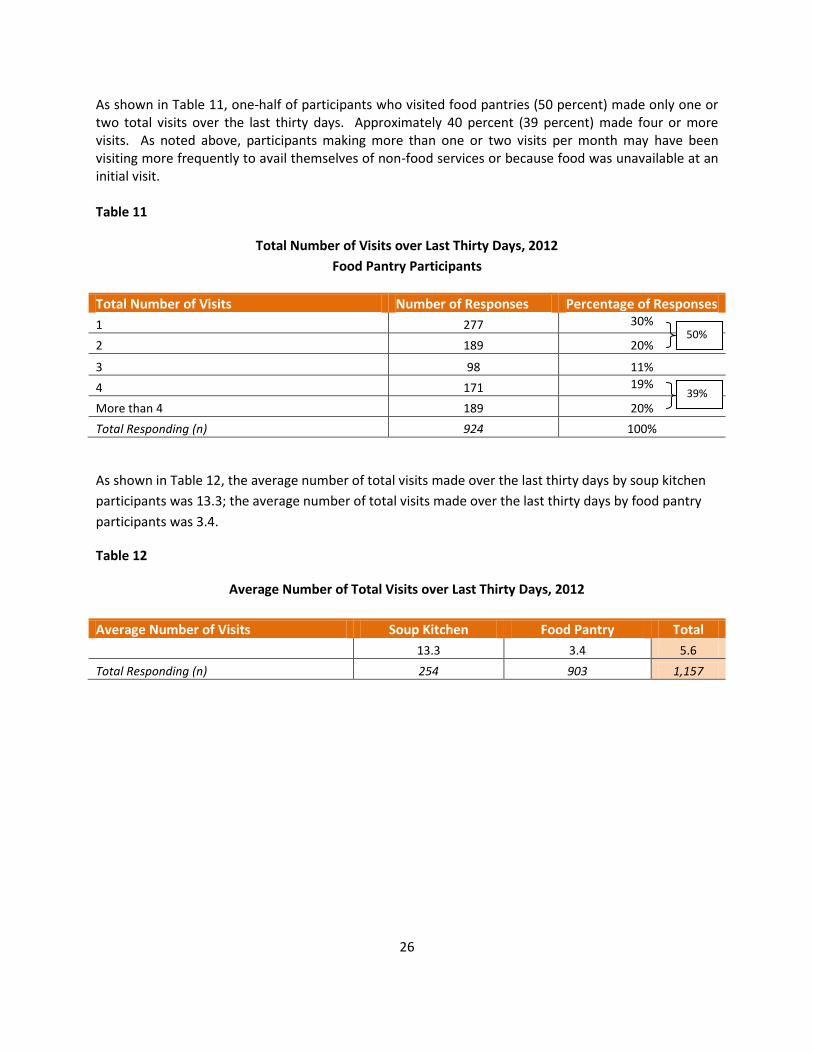
As shown in Table 11, one-half of participants who visited food pantries (50 percent) made only one or two total visits over the last thirty days. Approximately 40 percent (39 percent) made four or more visits. As noted above, participants making more than one or two visits per month may have been visiting more frequently to avail themselves of non-food services or because food was unavailable at an initial visit. Table 11
Total Number of Visits over Last Thirty Days, 2012
Food Pantry Participants
Total Number of Visits Number of Responses Percentage of Responses
1 277 30%
2 189 20%
3 98 11%
4 171 19%
More than 4 189 20%
Total Responding (n) 924 100%
As shown in Table 12, the average number of total visits made over the last thirty days by soup kitchen
participants was 13.3; the average number of total visits made over the last thirty days by food pantry
participants was 3.4.
Table 12
Average Number of Total Visits over Last Thirty Days, 2012
Average Number of Visits Soup Kitchen Food Pantry Total
13.3 3.4 5.6
Total Responding (n) 254 903 1,157
50%
39%
27
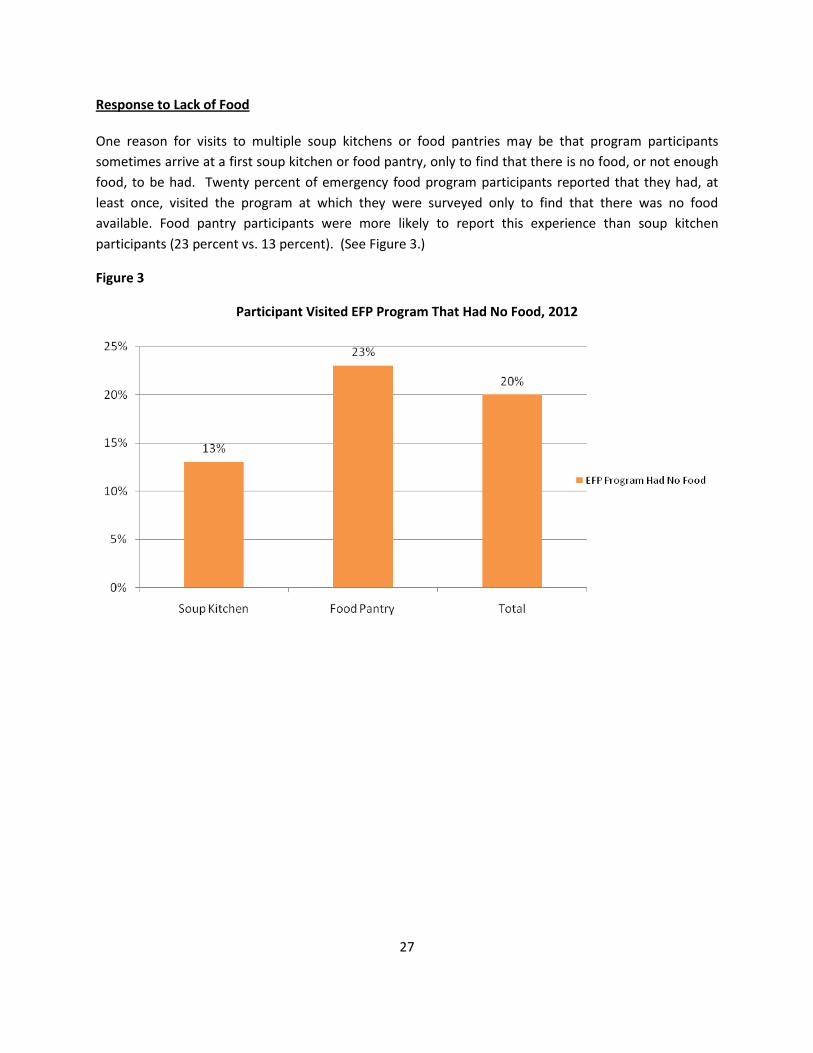
Response to Lack of Food
One reason for visits to multiple soup kitchens or food pantries may be that program participants
sometimes arrive at a first soup kitchen or food pantry, only to find that there is no food, or not enough
food, to be had. Twenty percent of emergency food program participants reported that they had, at
least once, visited the program at which they were surveyed only to find that there was no food
available. Food pantry participants were more likely to report this experience than soup kitchen
participants (23 percent vs. 13 percent). (See Figure 3.)
Figure 3
Participant Visited EFP Program That Had No Food, 2012
28
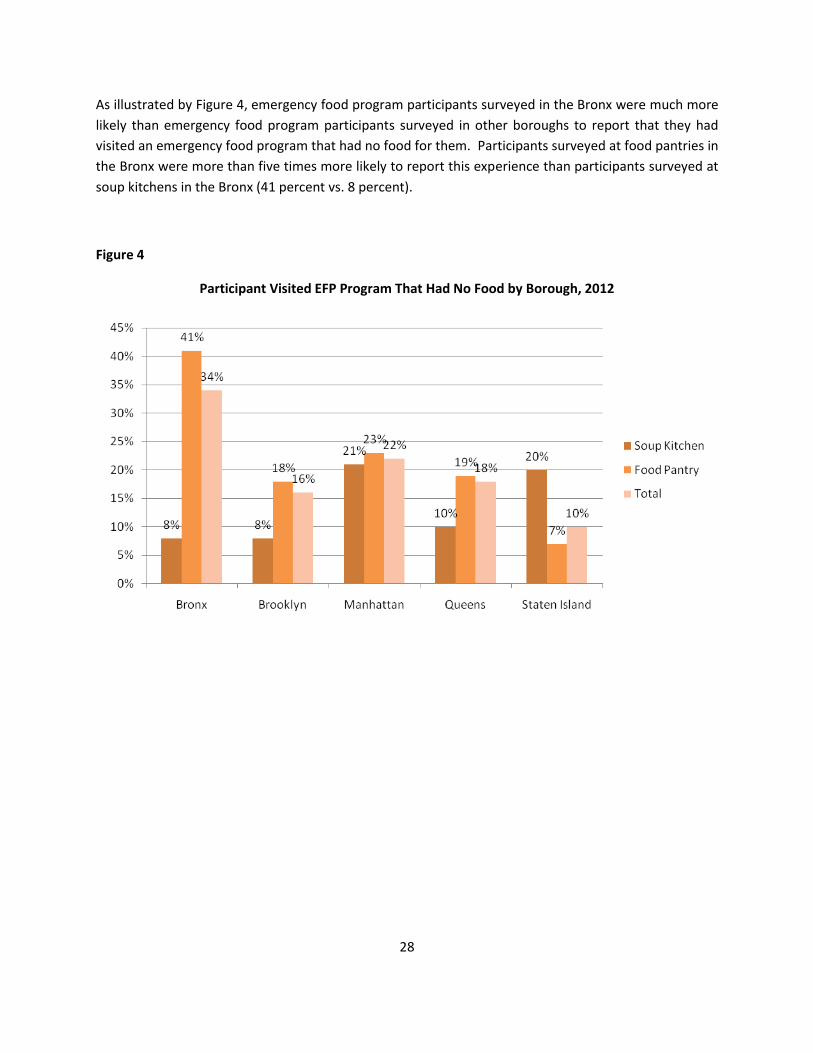
As illustrated by Figure 4, emergency food program participants surveyed in the Bronx were much more
likely than emergency food program participants surveyed in other boroughs to report that they had
visited an emergency food program that had no food for them. Participants surveyed at food pantries in
the Bronx were more than five times more likely to report this experience than participants surveyed at
soup kitchens in the Bronx (41 percent vs. 8 percent).
Figure 4
Participant Visited EFP Program That Had No Food by Borough, 2012
29
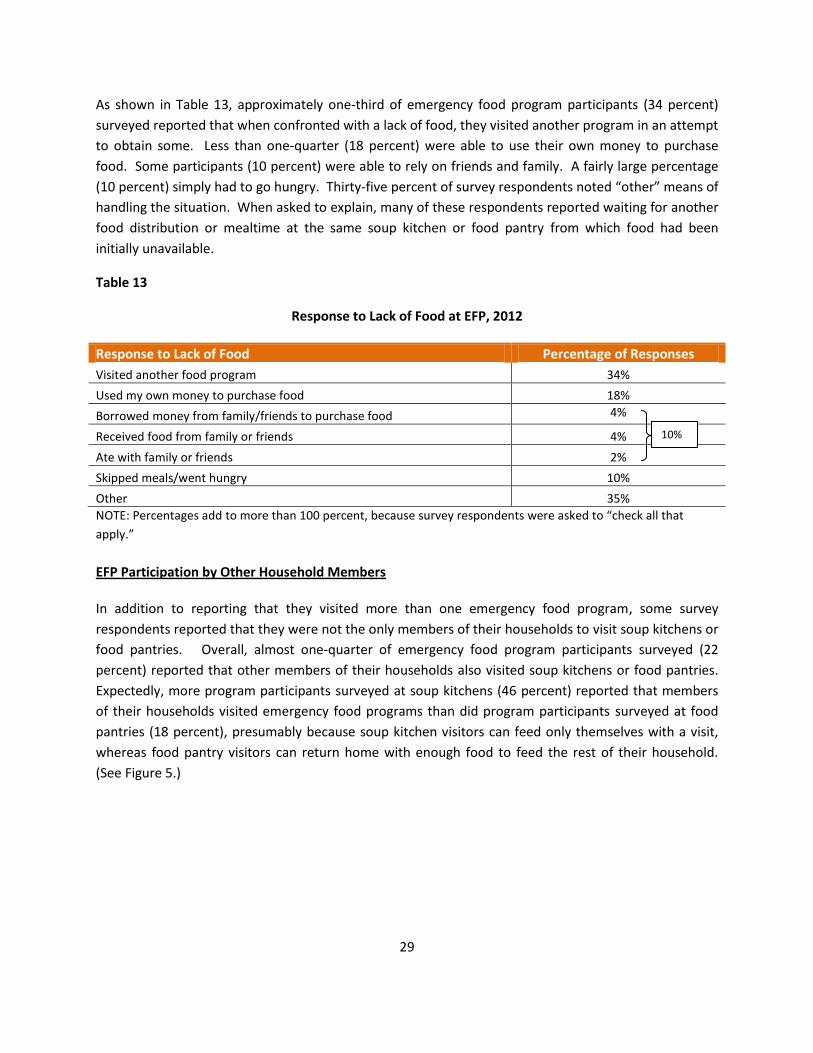
As shown in Table 13, approximately one-third of emergency food program participants (34 percent)
surveyed reported that when confronted with a lack of food, they visited another program in an attempt
to obtain some. Less than one-quarter (18 percent) were able to use their own money to purchase
food. Some participants (10 percent) were able to rely on friends and family. A fairly large percentage
(10 percent) simply had to go hungry. Thirty-five percent of survey respondents noted “other” means of
handling the situation. When asked to explain, many of these respondents reported waiting for another
food distribution or mealtime at the same soup kitchen or food pantry from which food had been
initially unavailable.
Table 13
Response to Lack of Food at EFP, 2012
Response to Lack of Food Percentage of Responses
Visited another food program 34%
Used my own money to purchase food 18%
Borrowed money from family/friends to purchase food 4%
Received food from family or friends 4%
Ate with family or friends 2%
Skipped meals/went hungry 10%
Other 35%
NOTE: Percentages add to more than 100 percent, because survey respondents were asked to “check all that
apply.”
EFP Participation by Other Household Members
In addition to reporting that they visited more than one emergency food program, some survey
respondents reported that they were not the only members of their households to visit soup kitchens or
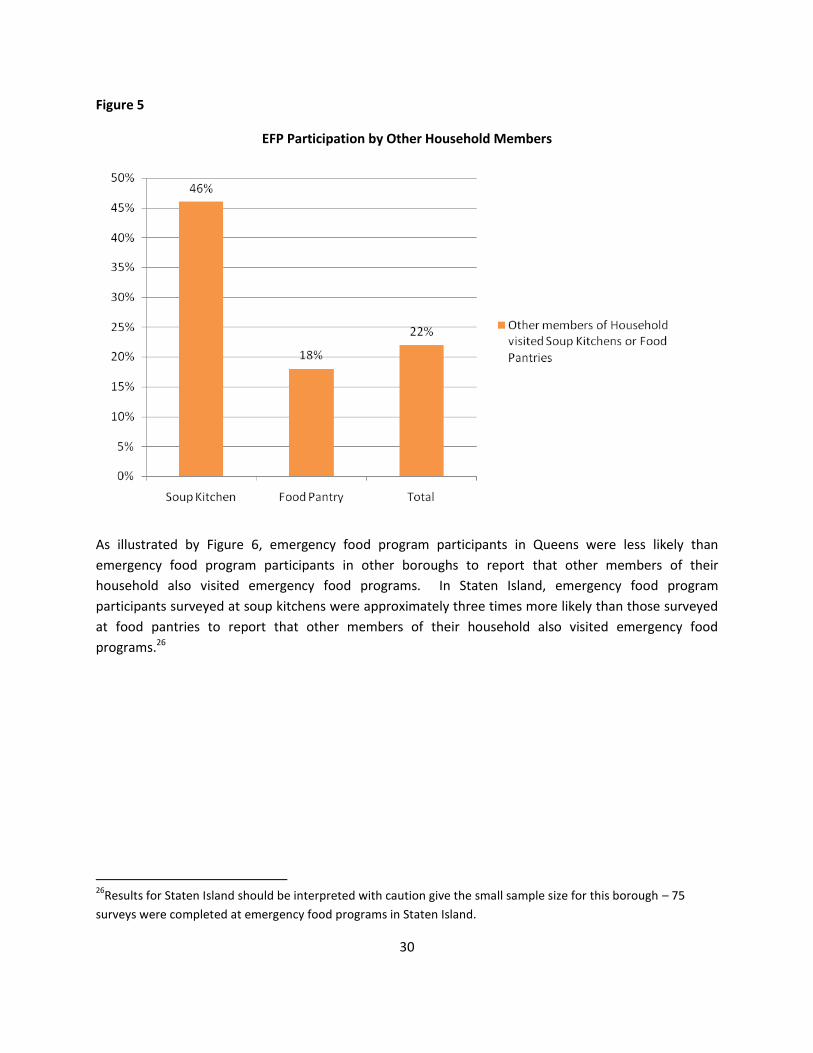
food pantries. Overall, almost one-quarter of emergency food program participants surveyed (22
percent) reported that other members of their households also visited soup kitchens or food pantries.
Expectedly, more program participants surveyed at soup kitchens (46 percent) reported that members
of their households visited emergency food programs than did program participants surveyed at food
pantries (18 percent), presumably because soup kitchen visitors can feed only themselves with a visit,
whereas food pantry visitors can return home with enough food to feed the rest of their household.
(See Figure 5.)
10%
30
Figure 5
EFP Participation by Other Household Members
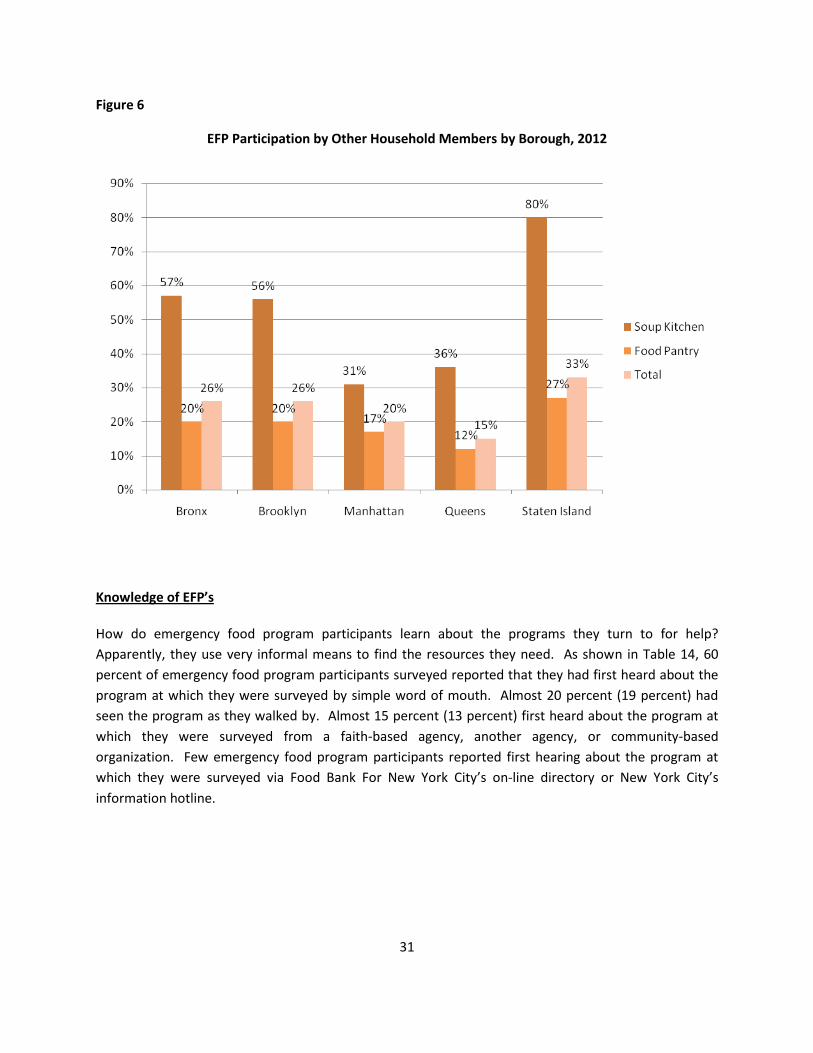
As illustrated by Figure 6, emergency food program participants in Queens were less likely than
emergency food program participants in other boroughs to report that other members of their
household also visited emergency food programs. In Staten Island, emergency food program
participants surveyed at soup kitchens were approximately three times more likely than those surveyed
at food pantries to report that other members of their household also visited emergency food
programs.26
26
Results for Staten Island should be interpreted with caution give the small sample size for this borough – 75
surveys were completed at emergency food programs in Staten Island.
31
Figure 6
EFP Participation by Other Household Members by Borough, 2012
Knowledge of EFP’s
How do emergency food program participants learn about the programs they turn to for help?
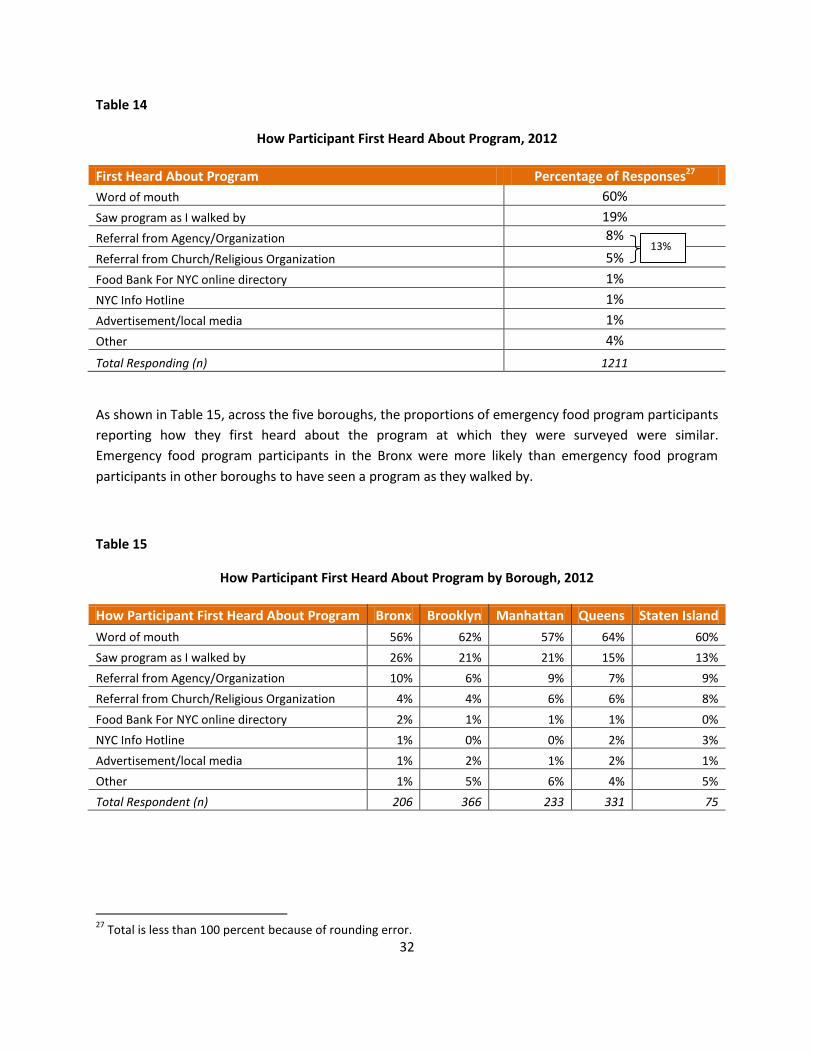
Apparently, they use very informal means to find the resources they need. As shown in Table 14, 60
percent of emergency food program participants surveyed reported that they had first heard about the
program at which they were surveyed by simple word of mouth. Almost 20 percent (19 percent) had
seen the program as they walked by. Almost 15 percent (13 percent) first heard about the program at
which they were surveyed from a faith-based agency, another agency, or community-based
organization. Few emergency food program participants reported first hearing about the program at
which they were surveyed via Food Bank For New York City’s on-line directory or New York City’s
information hotline.
32
Table 14
How Participant First Heard About Program, 2012
First Heard About Program Percentage of Responses27
Word of mouth 60%
Saw program as I walked by 19%
Referral from Agency/Organization 8%
Referral from Church/Religious Organization 5%
Food Bank For NYC online directory 1%
NYC Info Hotline 1%
Advertisement/local media 1%
Other 4%
Total Responding (n) 1211
As shown in Table 15, across the five boroughs, the proportions of emergency food program participants
reporting how they first heard about the program at which they were surveyed were similar.
Emergency food program participants in the Bronx were more likely than emergency food program
participants in other boroughs to have seen a program as they walked by.
Table 15
How Participant First Heard About Program by Borough, 2012
How Participant First Heard About Program Bronx Brooklyn Manhattan Queens Staten Island
Word of mouth 56% 62% 57% 64% 60%
Saw program as I walked by 26% 21% 21% 15% 13%
Referral from Agency/Organization 10% 6% 9% 7% 9%
Referral from Church/Religious Organization 4% 4% 6% 6% 8%
Food Bank For NYC online directory 2% 1% 1% 1% 0%
NYC Info Hotline 1% 0% 0% 2% 3%
Advertisement/local media 1% 2% 1% 2% 1%
Other 1% 5% 6% 4% 5%
Total Respondent (n) 206 366 233 331 75
27
Total is less than 100 percent because of rounding error.
13%
33
Commuting to EFP’s
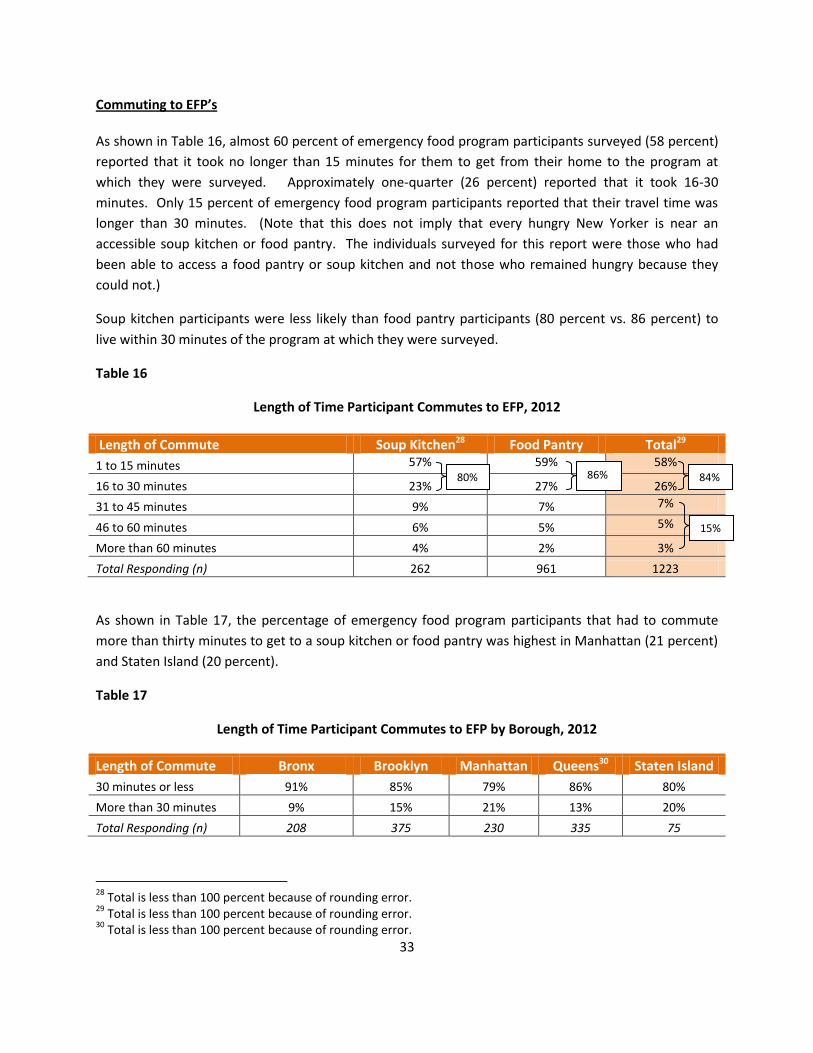
As shown in Table 16, almost 60 percent of emergency food program participants surveyed (58 percent)
reported that it took no longer than 15 minutes for them to get from their home to the program at
which they were surveyed. Approximately one-quarter (26 percent) reported that it took 16-30
minutes. Only 15 percent of emergency food program participants reported that their travel time was
longer than 30 minutes. (Note that this does not imply that every hungry New Yorker is near an
accessible soup kitchen or food pantry. The individuals surveyed for this report were those who had
been able to access a food pantry or soup kitchen and not those who remained hungry because they
could not.)
Soup kitchen participants were less likely than food pantry participants (80 percent vs. 86 percent) to
live within 30 minutes of the program at which they were surveyed.
Table 16
Length of Time Participant Commutes to EFP, 2012
Length of Commute Soup Kitchen28 Food Pantry Total29
1 to 15 minutes 57% 59% 58%
16 to 30 minutes 23% 27% 26%
31 to 45 minutes 9% 7% 7%
46 to 60 minutes 6% 5% 5%
More than 60 minutes 4% 2% 3%
Total Responding (n) 262 961 1223
As shown in Table 17, the percentage of emergency food program participants that had to commute
more than thirty minutes to get to a soup kitchen or food pantry was highest in Manhattan (21 percent)
and Staten Island (20 percent).
Table 17
Length of Time Participant Commutes to EFP by Borough, 2012
Length of Commute Bronx Brooklyn Manhattan Queens30 Staten Island
30 minutes or less 91% 85% 79% 86% 80%
More than 30 minutes 9% 15% 21% 13% 20%
Total Responding (n) 208 375 230 335 75
28
Total is less than 100 percent because of rounding error. 29
Total is less than 100 percent because of rounding error. 30
Total is less than 100 percent because of rounding error.
80% 86% 84%
15%
34
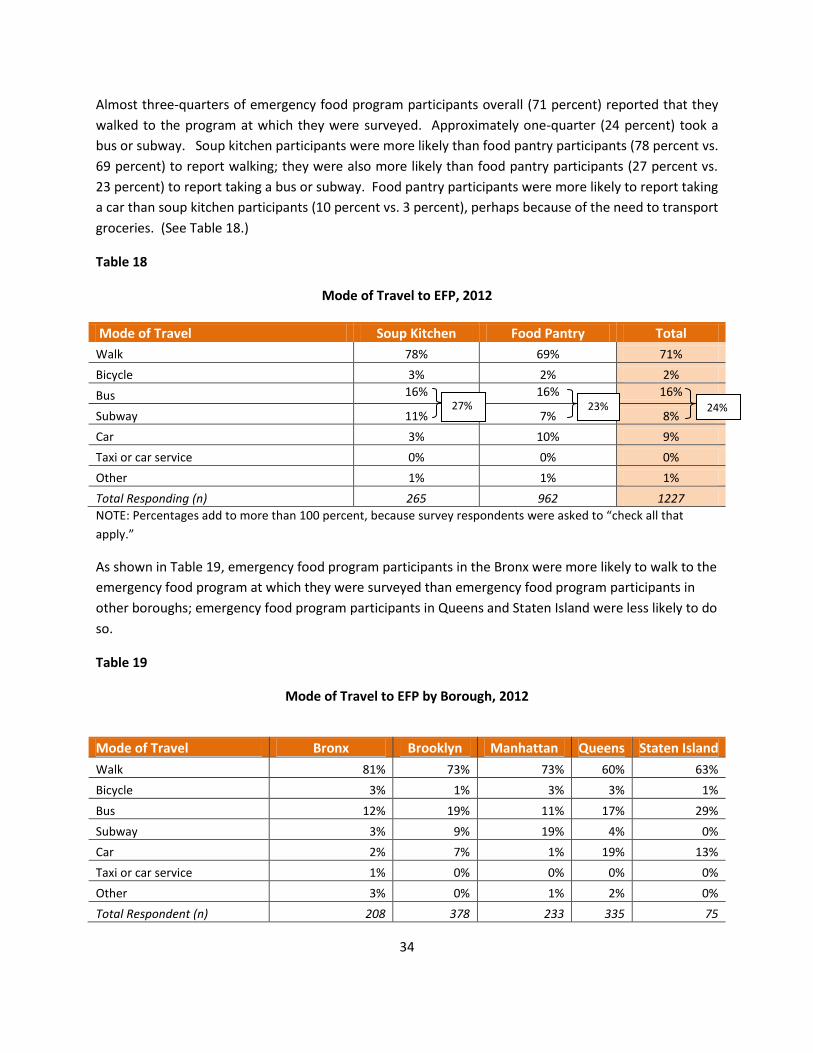
Almost three-quarters of emergency food program participants overall (71 percent) reported that they
walked to the program at which they were surveyed. Approximately one-quarter (24 percent) took a
bus or subway. Soup kitchen participants were more likely than food pantry participants (78 percent vs.
69 percent) to report walking; they were also more likely than food pantry participants (27 percent vs.
23 percent) to report taking a bus or subway. Food pantry participants were more likely to report taking
a car than soup kitchen participants (10 percent vs. 3 percent), perhaps because of the need to transport
groceries. (See Table 18.)
Table 18
Mode of Travel to EFP, 2012
Mode of Travel Soup Kitchen Food Pantry Total
Walk 78% 69% 71%
Bicycle 3% 2% 2%
Bus 16% 16% 16%
Subway 11% 7% 8%
Car 3% 10% 9%
Taxi or car service 0% 0% 0%
Other 1% 1% 1%
Total Responding (n) 265 962 1227
NOTE: Percentages add to more than 100 percent, because survey respondents were asked to “check all that
apply.”
As shown in Table 19, emergency food program participants in the Bronx were more likely to walk to the
emergency food program at which they were surveyed than emergency food program participants in
other boroughs; emergency food program participants in Queens and Staten Island were less likely to do
so.
Table 19
Mode of Travel to EFP by Borough, 2012
Mode of Travel Bronx Brooklyn Manhattan Queens Staten Island
Walk 81% 73% 73% 60% 63%
Bicycle 3% 1% 3% 3% 1%
Bus 12% 19% 11% 17% 29%
Subway 3% 9% 19% 4% 0%
Car 2% 7% 1% 19% 13%
Taxi or car service 1% 0% 0% 0% 0%
Other 3% 0% 1% 2% 0%
Total Respondent (n) 208 378 233 335 75
27% 23% 24%
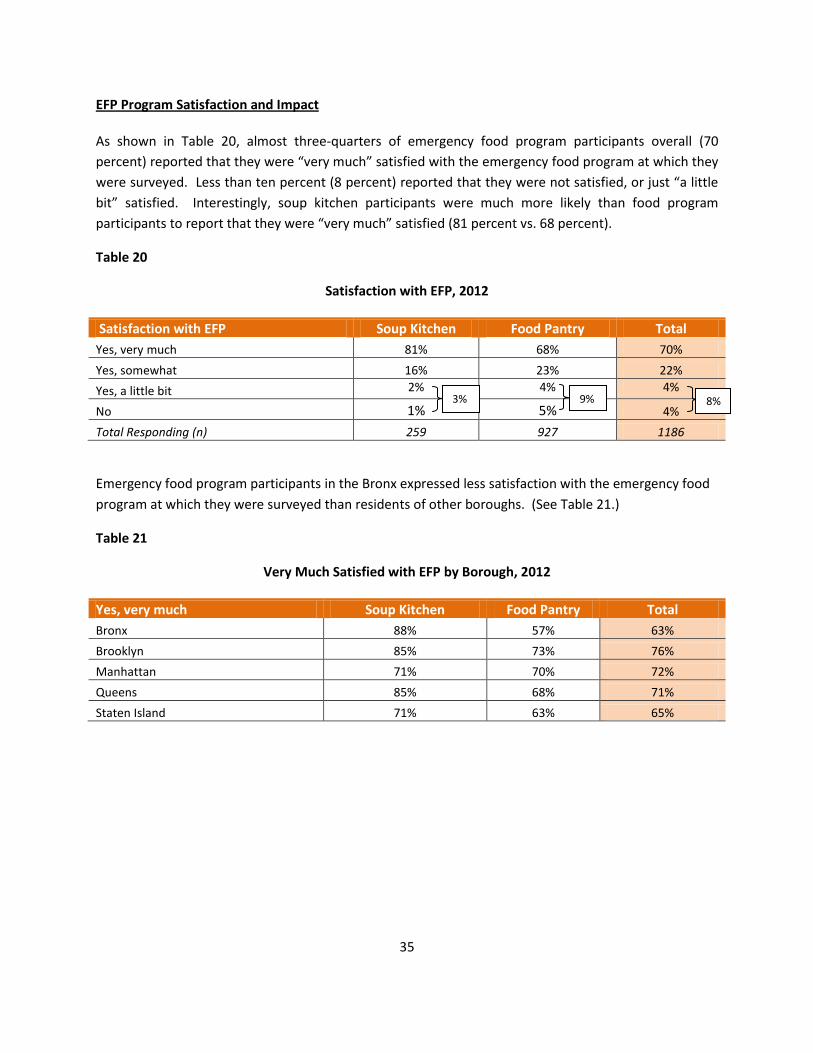
35
EFP Program Satisfaction and Impact
As shown in Table 20, almost three-quarters of emergency food program participants overall (70
percent) reported that they were “very much” satisfied with the emergency food program at which they
were surveyed. Less than ten percent (8 percent) reported that they were not satisfied, or just “a little
bit” satisfied. Interestingly, soup kitchen participants were much more likely than food program
participants to report that they were “very much” satisfied (81 percent vs. 68 percent).
Table 20
Satisfaction with EFP, 2012
Satisfaction with EFP Soup Kitchen Food Pantry Total
Yes, very much 81% 68% 70%
Yes, somewhat 16% 23% 22%
Yes, a little bit 2% 4% 4%
No 1% 5% 4%
Total Responding (n) 259 927 1186
Emergency food program participants in the Bronx expressed less satisfaction with the emergency food
program at which they were surveyed than residents of other boroughs. (See Table 21.)
Table 21
Very Much Satisfied with EFP by Borough, 2012
Yes, very much Soup Kitchen Food Pantry Total
Bronx 88% 57% 63%
Brooklyn 85% 73% 76%
Manhattan 71% 70% 72%
Queens 85% 68% 71%
Staten Island 71% 63% 65%
3% 9% 8%
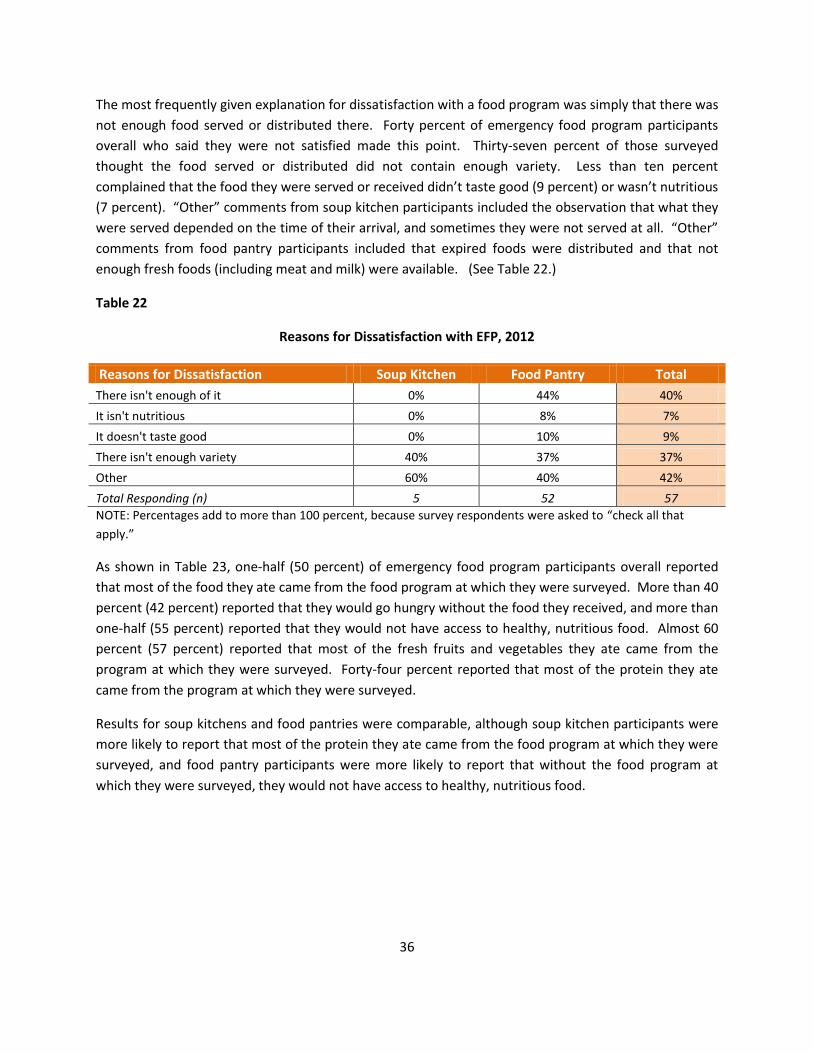
36
The most frequently given explanation for dissatisfaction with a food program was simply that there was
not enough food served or distributed there. Forty percent of emergency food program participants
overall who said they were not satisfied made this point. Thirty-seven percent of those surveyed
thought the food served or distributed did not contain enough variety. Less than ten percent
complained that the food they were served or received didn’t taste good (9 percent) or wasn’t nutritious
(7 percent). “Other” comments from soup kitchen participants included the observation that what they
were served depended on the time of their arrival, and sometimes they were not served at all. “Other”
comments from food pantry participants included that expired foods were distributed and that not
enough fresh foods (including meat and milk) were available. (See Table 22.)
Table 22
Reasons for Dissatisfaction with EFP, 2012
Reasons for Dissatisfaction Soup Kitchen Food Pantry Total
There isn't enough of it 0% 44% 40%
It isn't nutritious 0% 8% 7%
It doesn't taste good 0% 10% 9%
There isn't enough variety 40% 37% 37%
Other 60% 40% 42%
Total Responding (n) 5 52 57
NOTE: Percentages add to more than 100 percent, because survey respondents were asked to “check all that
apply.”
As shown in Table 23, one-half (50 percent) of emergency food program participants overall reported
that most of the food they ate came from the food program at which they were surveyed. More than 40
percent (42 percent) reported that they would go hungry without the food they received, and more than
one-half (55 percent) reported that they would not have access to healthy, nutritious food. Almost 60
percent (57 percent) reported that most of the fresh fruits and vegetables they ate came from the
program at which they were surveyed. Forty-four percent reported that most of the protein they ate
came from the program at which they were surveyed.
Results for soup kitchens and food pantries were comparable, although soup kitchen participants were
more likely to report that most of the protein they ate came from the food program at which they were
surveyed, and food pantry participants were more likely to report that without the food program at
which they were surveyed, they would not have access to healthy, nutritious food.
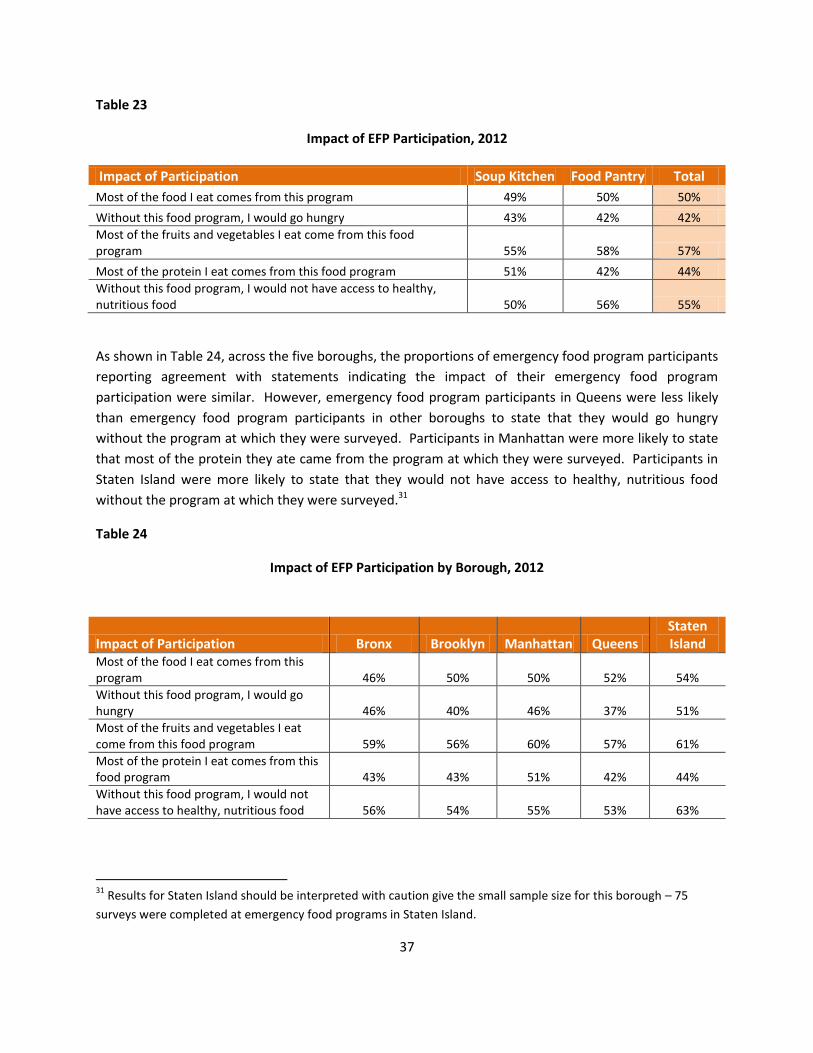
37
Table 23
Impact of EFP Participation, 2012
Impact of Participation Soup Kitchen Food Pantry Total
Most of the food I eat comes from this program 49% 50% 50%
Without this food program, I would go hungry 43% 42% 42%
Most of the fruits and vegetables I eat come from this food program 55% 58% 57%
Most of the protein I eat comes from this food program 51% 42% 44%
Without this food program, I would not have access to healthy, nutritious food 50% 56% 55%
As shown in Table 24, across the five boroughs, the proportions of emergency food program participants
reporting agreement with statements indicating the impact of their emergency food program
participation were similar. However, emergency food program participants in Queens were less likely
than emergency food program participants in other boroughs to state that they would go hungry
without the program at which they were surveyed. Participants in Manhattan were more likely to state
that most of the protein they ate came from the program at which they were surveyed. Participants in
Staten Island were more likely to state that they would not have access to healthy, nutritious food
without the program at which they were surveyed.31
Table 24
Impact of EFP Participation by Borough, 2012
Impact of Participation Bronx Brooklyn Manhattan Queens Staten Island
Most of the food I eat comes from this program 46% 50% 50% 52% 54%
Without this food program, I would go hungry 46% 40% 46% 37% 51%
Most of the fruits and vegetables I eat come from this food program 59% 56% 60% 57% 61%
Most of the protein I eat comes from this food program 43% 43% 51% 42% 44%
Without this food program, I would not have access to healthy, nutritious food 56% 54% 55% 53% 63%
31
Results for Staten Island should be interpreted with caution give the small sample size for this borough – 75
surveys were completed at emergency food programs in Staten Island.
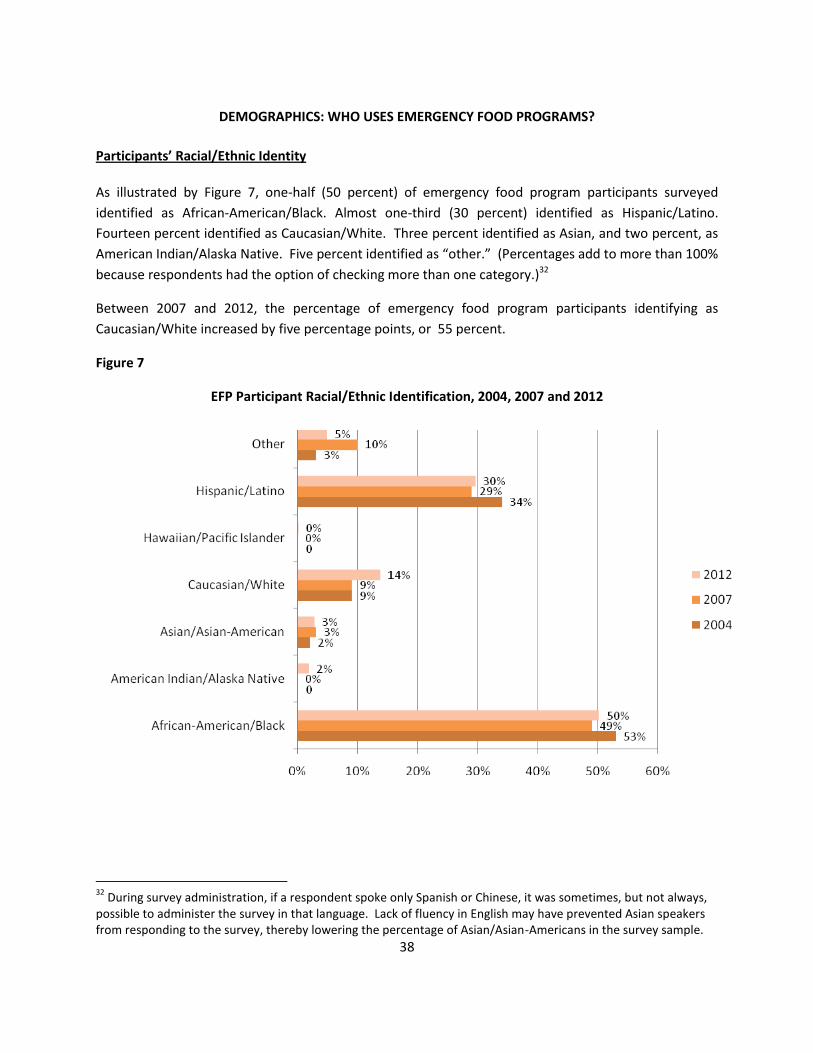
38
DEMOGRAPHICS: WHO USES EMERGENCY FOOD PROGRAMS?
Participants’ Racial/Ethnic Identity
As illustrated by Figure 7, one-half (50 percent) of emergency food program participants surveyed
identified as African-American/Black. Almost one-third (30 percent) identified as Hispanic/Latino.
Fourteen percent identified as Caucasian/White. Three percent identified as Asian, and two percent, as
American Indian/Alaska Native. Five percent identified as “other.” (Percentages add to more than 100%
because respondents had the option of checking more than one category.)32
Between 2007 and 2012, the percentage of emergency food program participants identifying as
Caucasian/White increased by five percentage points, or 55 percent.
Figure 7
EFP Participant Racial/Ethnic Identification, 2004, 2007 and 2012
32
During survey administration, if a respondent spoke only Spanish or Chinese, it was sometimes, but not always, possible to administer the survey in that language. Lack of fluency in English may have prevented Asian speakers from responding to the survey, thereby lowering the percentage of Asian/Asian-Americans in the survey sample.
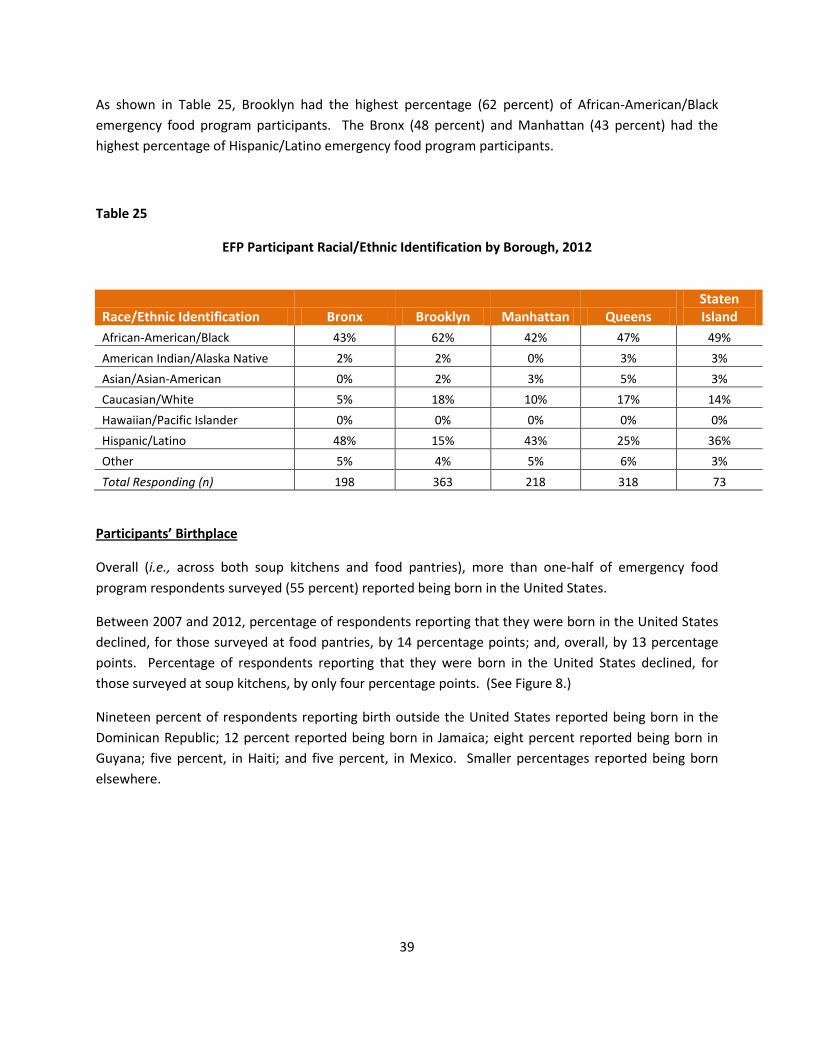
39
As shown in Table 25, Brooklyn had the highest percentage (62 percent) of African-American/Black
emergency food program participants. The Bronx (48 percent) and Manhattan (43 percent) had the
highest percentage of Hispanic/Latino emergency food program participants.
Table 25
EFP Participant Racial/Ethnic Identification by Borough, 2012
Race/Ethnic Identification Bronx Brooklyn Manhattan Queens Staten Island
African-American/Black 43% 62% 42% 47% 49%
American Indian/Alaska Native 2% 2% 0% 3% 3%
Asian/Asian-American 0% 2% 3% 5% 3%
Caucasian/White 5% 18% 10% 17% 14%
Hawaiian/Pacific Islander 0% 0% 0% 0% 0%
Hispanic/Latino 48% 15% 43% 25% 36%
Other 5% 4% 5% 6% 3%
Total Responding (n) 198 363 218 318 73
Participants’ Birthplace
Overall (i.e., across both soup kitchens and food pantries), more than one-half of emergency food
program respondents surveyed (55 percent) reported being born in the United States.
Between 2007 and 2012, percentage of respondents reporting that they were born in the United States
declined, for those surveyed at food pantries, by 14 percentage points; and, overall, by 13 percentage
points. Percentage of respondents reporting that they were born in the United States declined, for
those surveyed at soup kitchens, by only four percentage points. (See Figure 8.)
Nineteen percent of respondents reporting birth outside the United States reported being born in the
Dominican Republic; 12 percent reported being born in Jamaica; eight percent reported being born in
Guyana; five percent, in Haiti; and five percent, in Mexico. Smaller percentages reported being born
elsewhere.
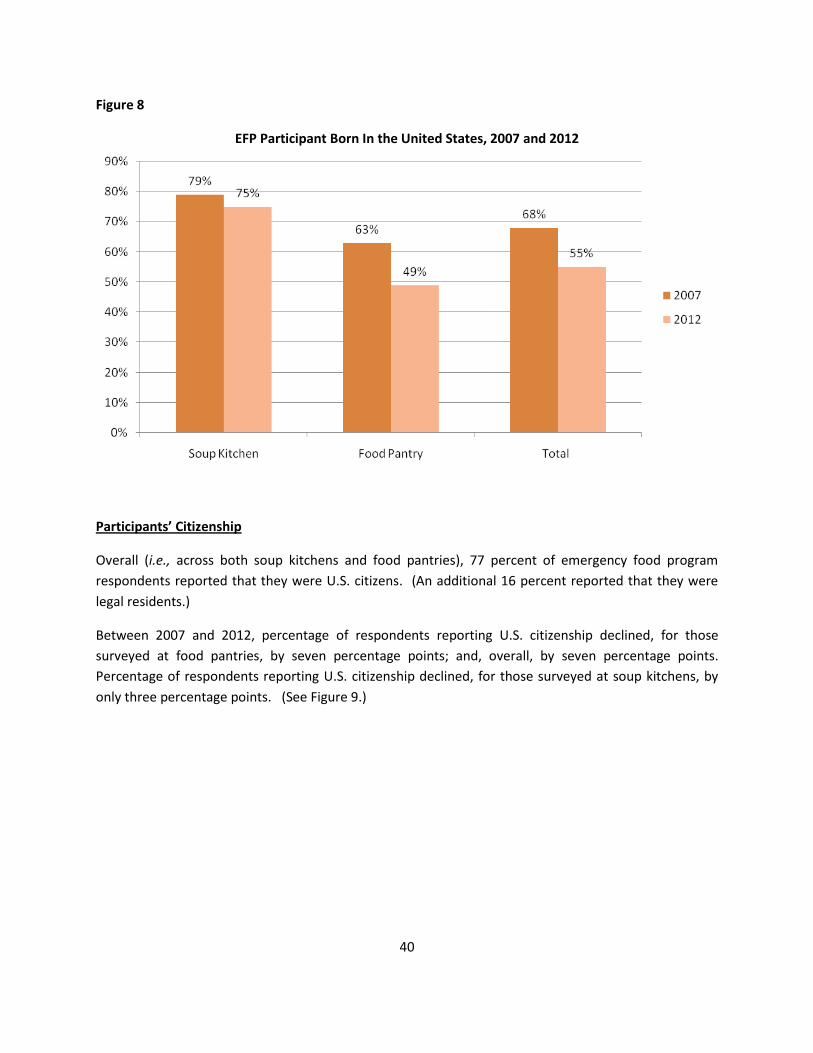
40
Figure 8
EFP Participant Born In the United States, 2007 and 2012
Participants’ Citizenship
Overall (i.e., across both soup kitchens and food pantries), 77 percent of emergency food program
respondents reported that they were U.S. citizens. (An additional 16 percent reported that they were
legal residents.)
Between 2007 and 2012, percentage of respondents reporting U.S. citizenship declined, for those
surveyed at food pantries, by seven percentage points; and, overall, by seven percentage points.
Percentage of respondents reporting U.S. citizenship declined, for those surveyed at soup kitchens, by
only three percentage points. (See Figure 9.)
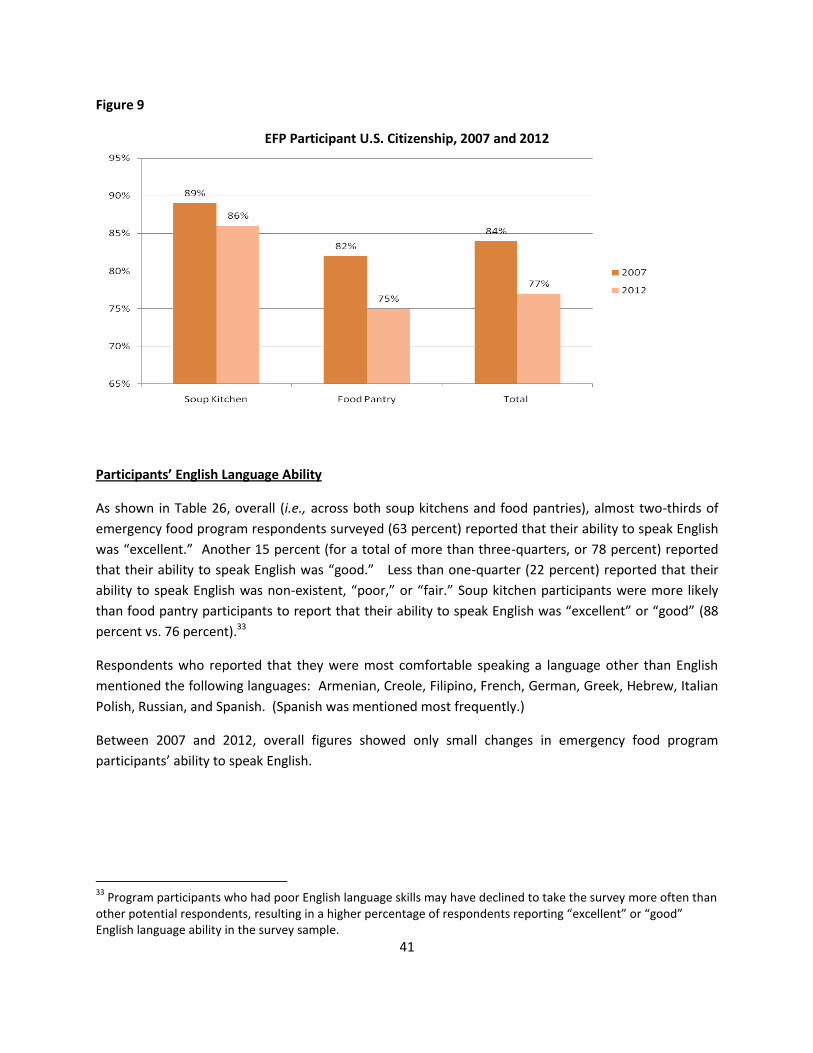
41
Figure 9
EFP Participant U.S. Citizenship, 2007 and 2012
Participants’ English Language Ability
As shown in Table 26, overall (i.e., across both soup kitchens and food pantries), almost two-thirds of
emergency food program respondents surveyed (63 percent) reported that their ability to speak English
was “excellent.” Another 15 percent (for a total of more than three-quarters, or 78 percent) reported
that their ability to speak English was “good.” Less than one-quarter (22 percent) reported that their
ability to speak English was non-existent, “poor,” or “fair.” Soup kitchen participants were more likely
than food pantry participants to report that their ability to speak English was “excellent” or “good” (88
percent vs. 76 percent).33
Respondents who reported that they were most comfortable speaking a language other than English
mentioned the following languages: Armenian, Creole, Filipino, French, German, Greek, Hebrew, Italian
Polish, Russian, and Spanish. (Spanish was mentioned most frequently.)
Between 2007 and 2012, overall figures showed only small changes in emergency food program
participants’ ability to speak English.
33
Program participants who had poor English language skills may have declined to take the survey more often than other potential respondents, resulting in a higher percentage of respondents reporting “excellent” or “good” English language ability in the survey sample.
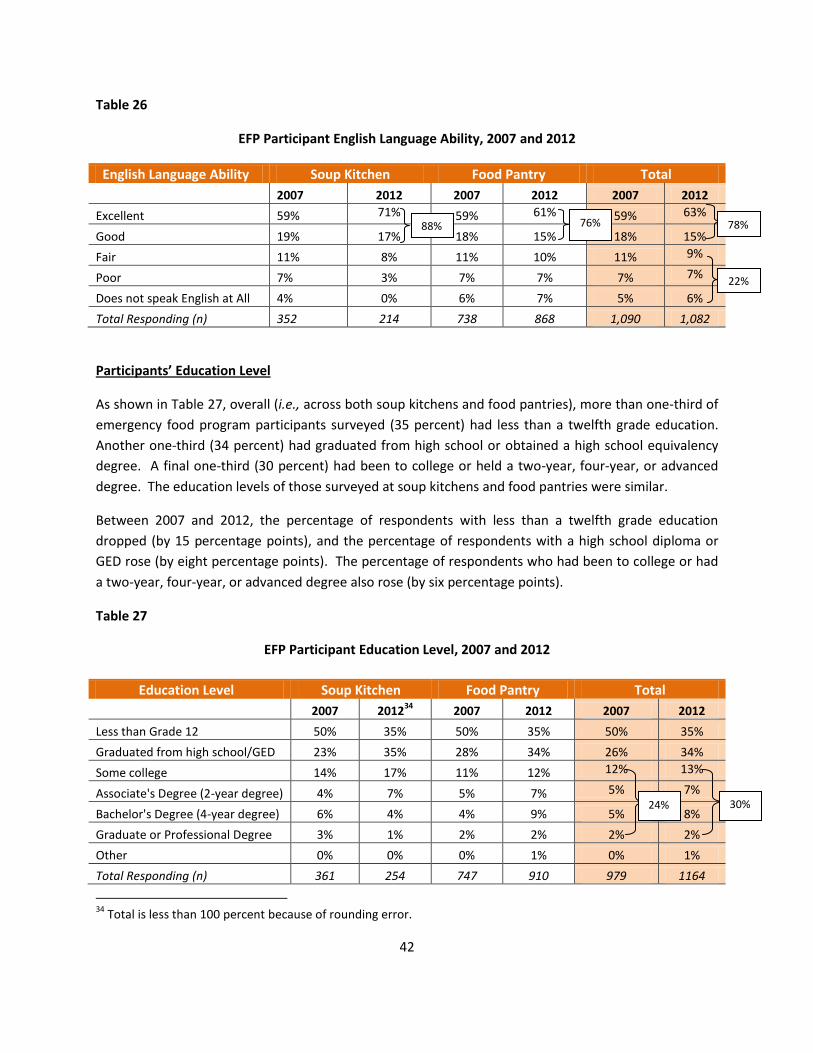
42
Table 26
EFP Participant English Language Ability, 2007 and 2012
English Language Ability Soup Kitchen Food Pantry Total
2007 2012 2007 2012 2007 2012
Excellent 59% 71% 59% 61% 59% 63%
Good 19% 17% 18% 15% 18% 15%
Fair 11% 8% 11% 10% 11% 9%
Poor 7% 3% 7% 7% 7% 7%
Does not speak English at All 4% 0% 6% 7% 5% 6%
Total Responding (n) 352 214 738 868 1,090 1,082
Participants’ Education Level
As shown in Table 27, overall (i.e., across both soup kitchens and food pantries), more than one-third of
emergency food program participants surveyed (35 percent) had less than a twelfth grade education.
Another one-third (34 percent) had graduated from high school or obtained a high school equivalency
degree. A final one-third (30 percent) had been to college or held a two-year, four-year, or advanced
degree. The education levels of those surveyed at soup kitchens and food pantries were similar.
Between 2007 and 2012, the percentage of respondents with less than a twelfth grade education
dropped (by 15 percentage points), and the percentage of respondents with a high school diploma or
GED rose (by eight percentage points). The percentage of respondents who had been to college or had
a two-year, four-year, or advanced degree also rose (by six percentage points).
Table 27
EFP Participant Education Level, 2007 and 2012
Education Level Soup Kitchen Food Pantry Total
2007 2012
34 2007 2012 2007 2012
Less than Grade 12 50% 35% 50% 35% 50% 35%
Graduated from high school/GED 23% 35% 28% 34% 26% 34%
Some college 14% 17% 11% 12% 12% 13%
Associate's Degree (2-year degree) 4% 7% 5% 7% 5% 7%
Bachelor's Degree (4-year degree) 6% 4% 4% 9% 5% 8%
Graduate or Professional Degree 3% 1% 2% 2% 2% 2%
Other 0% 0% 0% 1% 0% 1%
Total Responding (n) 361 254 747 910 979 1164
34
Total is less than 100 percent because of rounding error.
88% 78%
22%
30% 24%
76%
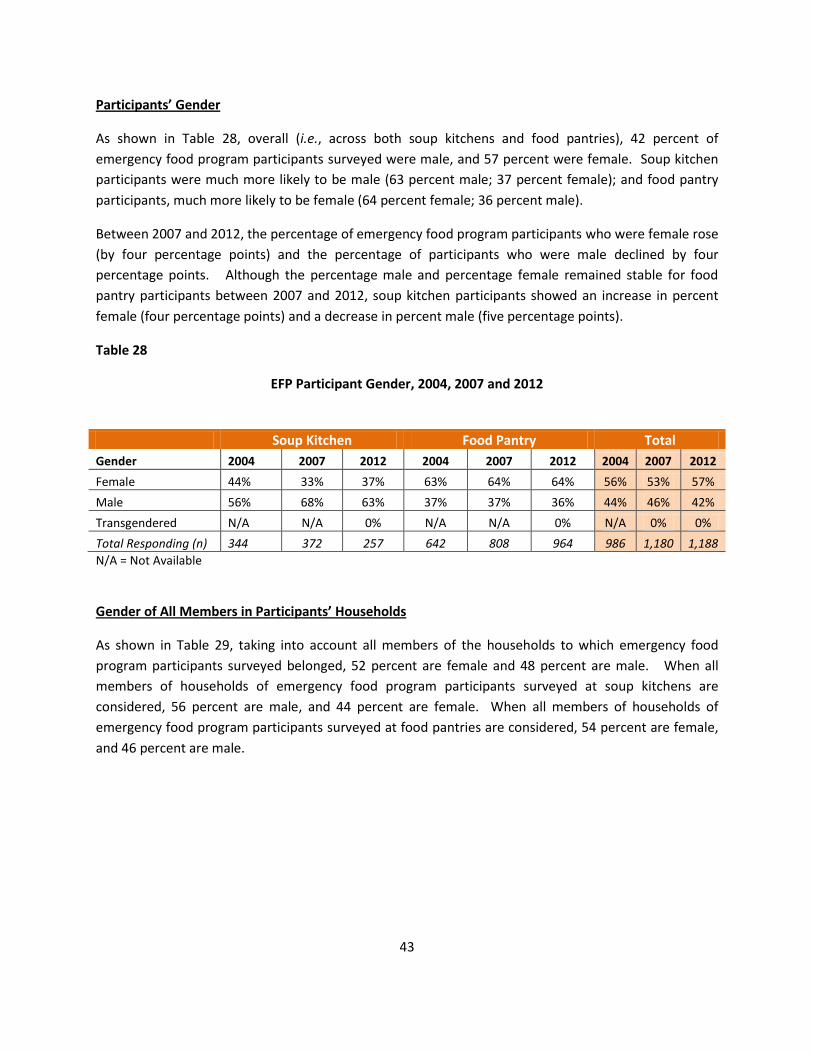
43
Participants’ Gender
As shown in Table 28, overall (i.e., across both soup kitchens and food pantries), 42 percent of
emergency food program participants surveyed were male, and 57 percent were female. Soup kitchen
participants were much more likely to be male (63 percent male; 37 percent female); and food pantry
participants, much more likely to be female (64 percent female; 36 percent male).
Between 2007 and 2012, the percentage of emergency food program participants who were female rose
(by four percentage points) and the percentage of participants who were male declined by four
percentage points. Although the percentage male and percentage female remained stable for food
pantry participants between 2007 and 2012, soup kitchen participants showed an increase in percent
female (four percentage points) and a decrease in percent male (five percentage points).
Table 28
EFP Participant Gender, 2004, 2007 and 2012
Soup Kitchen Food Pantry Total
Gender 2004 2007 2012 2004 2007 2012 2004 2007 2012
Female 44% 33% 37% 63% 64% 64% 56% 53% 57%
Male 56% 68% 63% 37% 37% 36% 44% 46% 42%
Transgendered N/A N/A 0% N/A N/A 0% N/A 0% 0%
Total Responding (n) 344 372 257 642 808 964 986 1,180 1,188
N/A = Not Available
Gender of All Members in Participants’ Households
As shown in Table 29, taking into account all members of the households to which emergency food
program participants surveyed belonged, 52 percent are female and 48 percent are male. When all
members of households of emergency food program participants surveyed at soup kitchens are
considered, 56 percent are male, and 44 percent are female. When all members of households of
emergency food program participants surveyed at food pantries are considered, 54 percent are female,
and 46 percent are male.
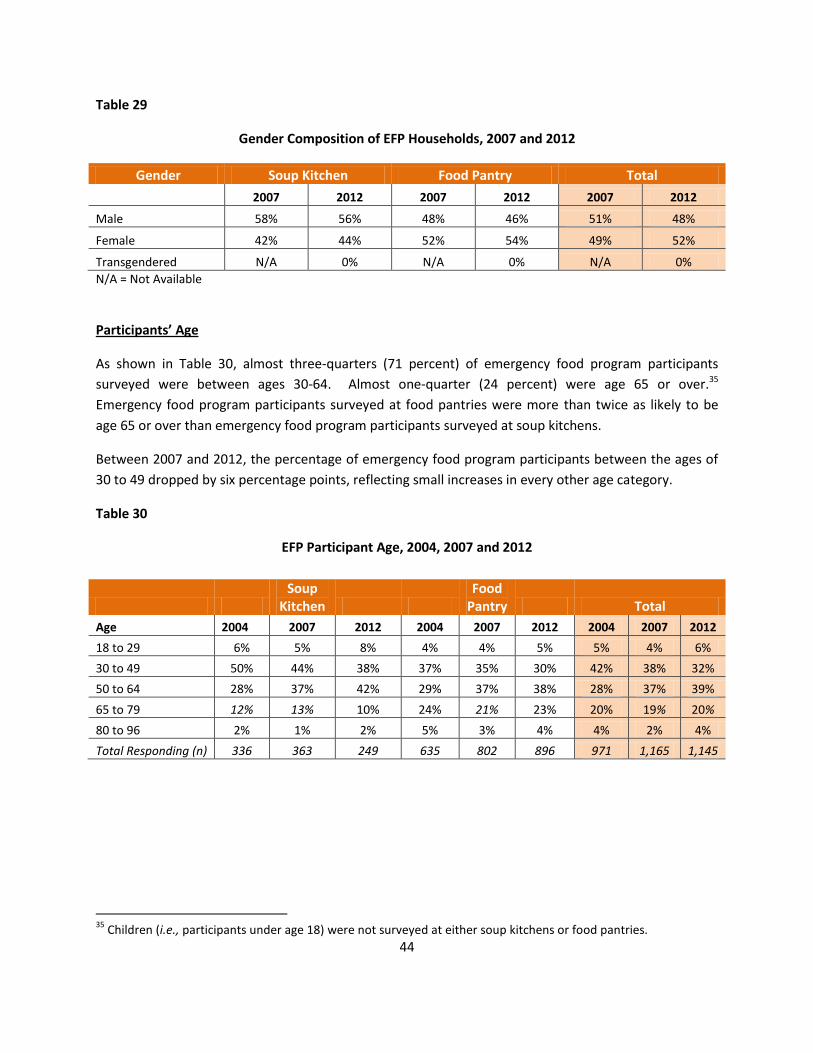
44
Table 29
Gender Composition of EFP Households, 2007 and 2012
Gender Soup Kitchen Food Pantry Total
2007 2012 2007 2012 2007 2012
Male 58% 56% 48% 46% 51% 48%
Female 42% 44% 52% 54% 49% 52%
Transgendered N/A 0% N/A 0% N/A 0%
N/A = Not Available
Participants’ Age
As shown in Table 30, almost three-quarters (71 percent) of emergency food program participants
surveyed were between ages 30-64. Almost one-quarter (24 percent) were age 65 or over.35
Emergency food program participants surveyed at food pantries were more than twice as likely to be
age 65 or over than emergency food program participants surveyed at soup kitchens.
Between 2007 and 2012, the percentage of emergency food program participants between the ages of
30 to 49 dropped by six percentage points, reflecting small increases in every other age category.
Table 30
EFP Participant Age, 2004, 2007 and 2012
Soup
Kitchen Food
Pantry Total
Age 2004 2007 2012 2004 2007 2012 2004 2007 2012
18 to 29 6% 5% 8% 4% 4% 5% 5% 4% 6%
30 to 49 50% 44% 38% 37% 35% 30% 42% 38% 32%
50 to 64 28% 37% 42% 29% 37% 38% 28% 37% 39%
65 to 79 12% 13% 10% 24% 21% 23% 20% 19% 20%
80 to 96 2% 1% 2% 5% 3% 4% 4% 2% 4%
Total Responding (n) 336 363 249 635 802 896 971 1,165 1,145
35
Children (i.e., participants under age 18) were not surveyed at either soup kitchens or food pantries.
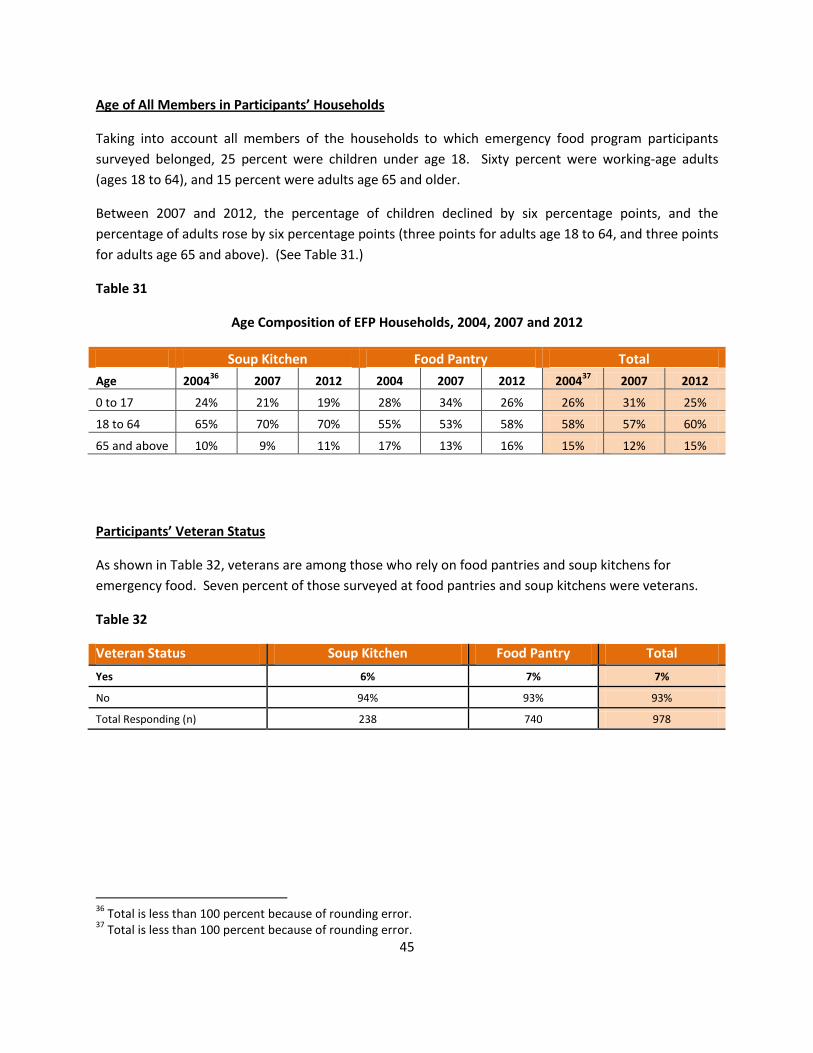
45
Age of All Members in Participants’ Households
Taking into account all members of the households to which emergency food program participants
surveyed belonged, 25 percent were children under age 18. Sixty percent were working-age adults
(ages 18 to 64), and 15 percent were adults age 65 and older.
Between 2007 and 2012, the percentage of children declined by six percentage points, and the
percentage of adults rose by six percentage points (three points for adults age 18 to 64, and three points
for adults age 65 and above). (See Table 31.)
Table 31
Age Composition of EFP Households, 2004, 2007 and 2012
Soup Kitchen Food Pantry Total
Age 200436
2007 2012 2004 2007 2012 200437
2007 2012
0 to 17 24% 21% 19% 28% 34% 26% 26% 31% 25%
18 to 64 65% 70% 70% 55% 53% 58% 58% 57% 60%
65 and above 10% 9% 11% 17% 13% 16% 15% 12% 15%
Participants’ Veteran Status
As shown in Table 32, veterans are among those who rely on food pantries and soup kitchens for
emergency food. Seven percent of those surveyed at food pantries and soup kitchens were veterans.
Table 32
Veteran Status Soup Kitchen Food Pantry Total
Yes 6% 7% 7%
No 94% 93% 93%
Total Responding (n) 238 740 978
36
Total is less than 100 percent because of rounding error. 37
Total is less than 100 percent because of rounding error.
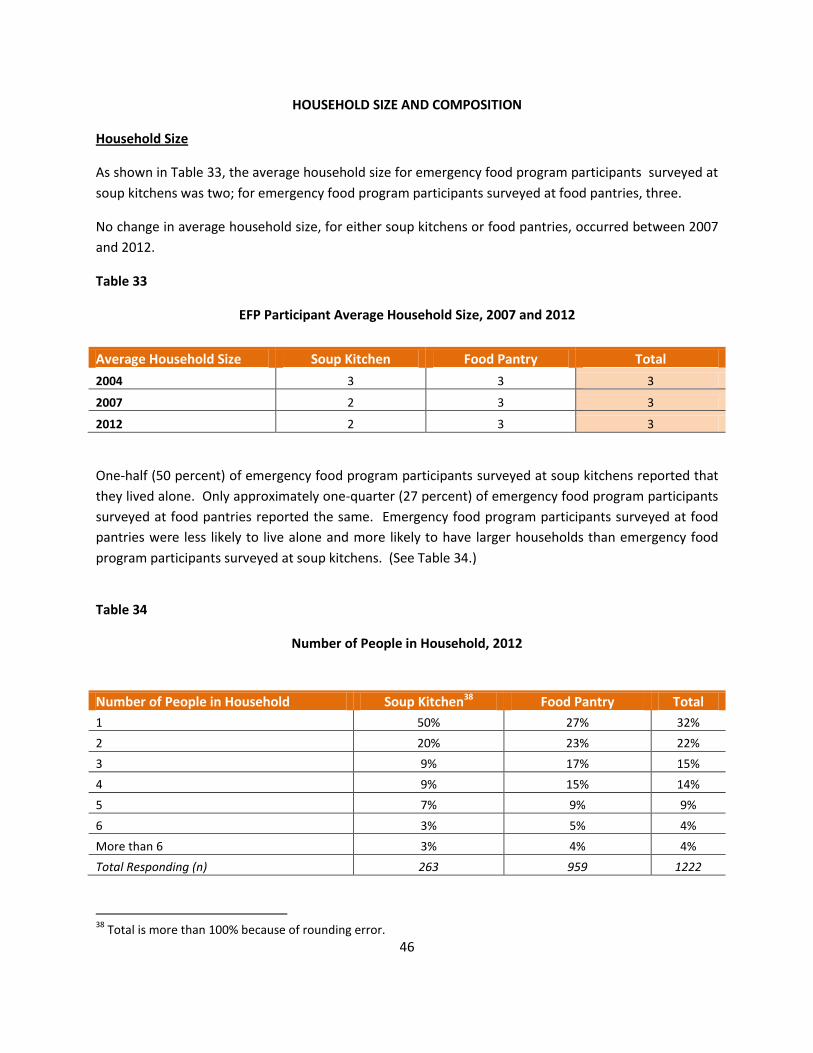
46
HOUSEHOLD SIZE AND COMPOSITION
Household Size
As shown in Table 33, the average household size for emergency food program participants surveyed at
soup kitchens was two; for emergency food program participants surveyed at food pantries, three.
No change in average household size, for either soup kitchens or food pantries, occurred between 2007
and 2012.
Table 33
EFP Participant Average Household Size, 2007 and 2012
Average Household Size Soup Kitchen Food Pantry Total
2004 3 3 3
2007 2 3 3
2012 2 3 3
One-half (50 percent) of emergency food program participants surveyed at soup kitchens reported that
they lived alone. Only approximately one-quarter (27 percent) of emergency food program participants
surveyed at food pantries reported the same. Emergency food program participants surveyed at food
pantries were less likely to live alone and more likely to have larger households than emergency food
program participants surveyed at soup kitchens. (See Table 34.)
Table 34
Number of People in Household, 2012
Number of People in Household Soup Kitchen38 Food Pantry Total
1 50% 27% 32%
2 20% 23% 22%
3 9% 17% 15%
4 9% 15% 14%
5 7% 9% 9%
6 3% 5% 4%
More than 6 3% 4% 4%
Total Responding (n) 263 959 1222
38
Total is more than 100% because of rounding error.
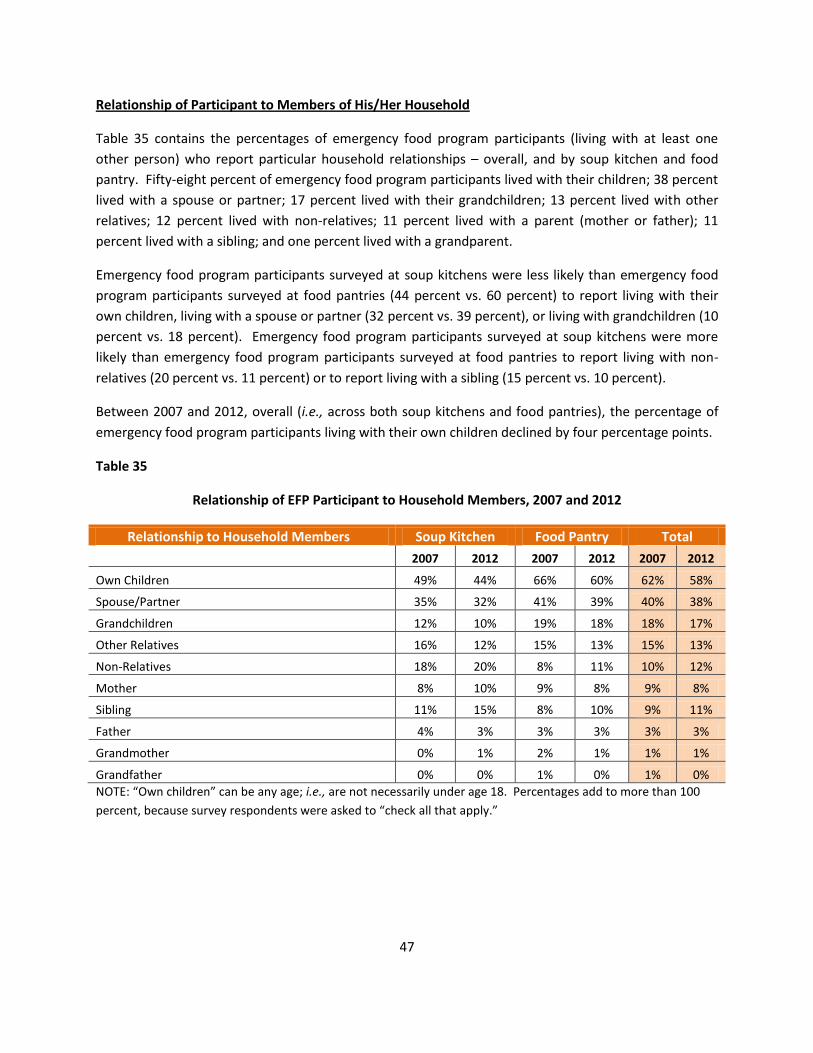
47
Relationship of Participant to Members of His/Her Household
Table 35 contains the percentages of emergency food program participants (living with at least one
other person) who report particular household relationships – overall, and by soup kitchen and food
pantry. Fifty-eight percent of emergency food program participants lived with their children; 38 percent
lived with a spouse or partner; 17 percent lived with their grandchildren; 13 percent lived with other
relatives; 12 percent lived with non-relatives; 11 percent lived with a parent (mother or father); 11
percent lived with a sibling; and one percent lived with a grandparent.
Emergency food program participants surveyed at soup kitchens were less likely than emergency food
program participants surveyed at food pantries (44 percent vs. 60 percent) to report living with their
own children, living with a spouse or partner (32 percent vs. 39 percent), or living with grandchildren (10
percent vs. 18 percent). Emergency food program participants surveyed at soup kitchens were more
likely than emergency food program participants surveyed at food pantries to report living with non-
relatives (20 percent vs. 11 percent) or to report living with a sibling (15 percent vs. 10 percent).
Between 2007 and 2012, overall (i.e., across both soup kitchens and food pantries), the percentage of
emergency food program participants living with their own children declined by four percentage points.
Table 35
Relationship of EFP Participant to Household Members, 2007 and 2012
Relationship to Household Members Soup Kitchen Food Pantry Total
2007 2012 2007 2012 2007 2012
Own Children 49% 44% 66% 60% 62% 58%
Spouse/Partner 35% 32% 41% 39% 40% 38%
Grandchildren 12% 10% 19% 18% 18% 17%
Other Relatives 16% 12% 15% 13% 15% 13%
Non-Relatives 18% 20% 8% 11% 10% 12%
Mother 8% 10% 9% 8% 9% 8%
Sibling 11% 15% 8% 10% 9% 11%
Father 4% 3% 3% 3% 3% 3%
Grandmother 0% 1% 2% 1% 1% 1%
Grandfather 0% 0% 1% 0% 1% 0%
NOTE: “Own children” can be any age; i.e., are not necessarily under age 18. Percentages add to more than 100
percent, because survey respondents were asked to “check all that apply.”
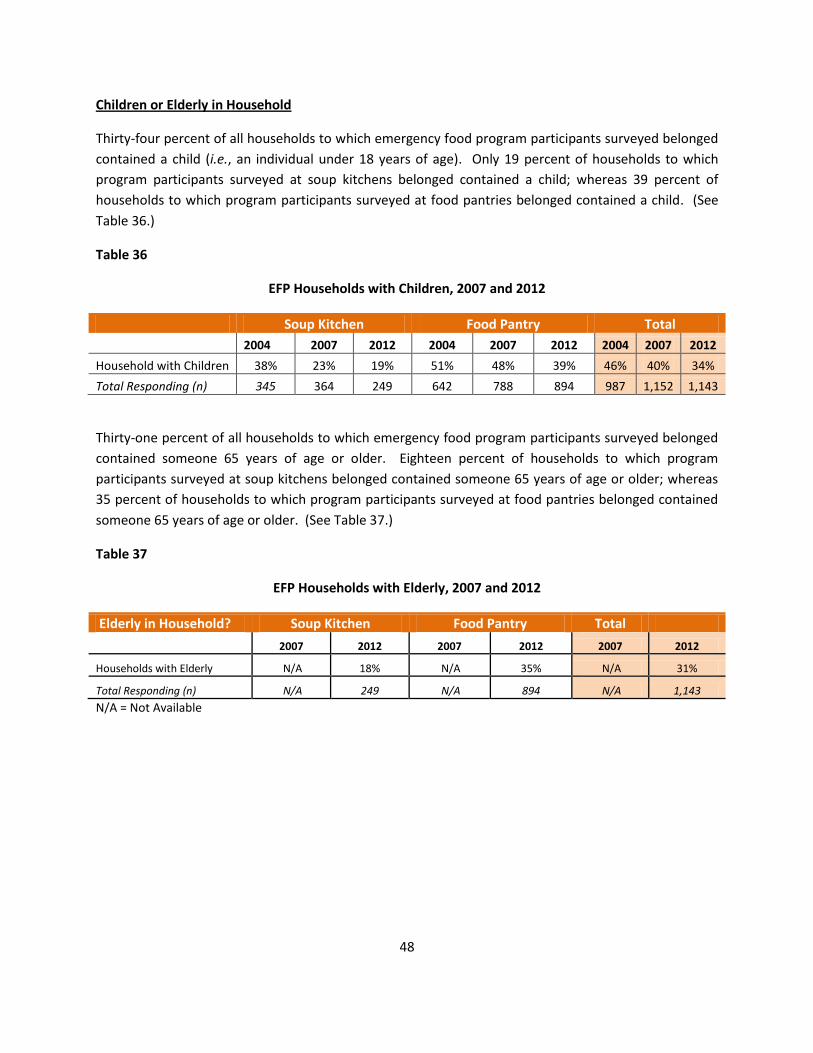
48
Children or Elderly in Household
Thirty-four percent of all households to which emergency food program participants surveyed belonged
contained a child (i.e., an individual under 18 years of age). Only 19 percent of households to which
program participants surveyed at soup kitchens belonged contained a child; whereas 39 percent of
households to which program participants surveyed at food pantries belonged contained a child. (See
Table 36.)
Table 36
EFP Households with Children, 2007 and 2012
Soup Kitchen Food Pantry Total
2004 2007 2012 2004 2007 2012 2004 2007 2012
Household with Children 38% 23% 19% 51% 48% 39% 46% 40% 34%
Total Responding (n) 345 364 249 642 788 894 987 1,152 1,143
Thirty-one percent of all households to which emergency food program participants surveyed belonged
contained someone 65 years of age or older. Eighteen percent of households to which program
participants surveyed at soup kitchens belonged contained someone 65 years of age or older; whereas
35 percent of households to which program participants surveyed at food pantries belonged contained
someone 65 years of age or older. (See Table 37.)
Table 37
EFP Households with Elderly, 2007 and 2012
Elderly in Household? Soup Kitchen Food Pantry Total
2007 2012 2007 2012 2007 2012
Households with Elderly N/A 18% N/A 35% N/A 31%
Total Responding (n) N/A 249 N/A 894 N/A 1,143
N/A = Not Available
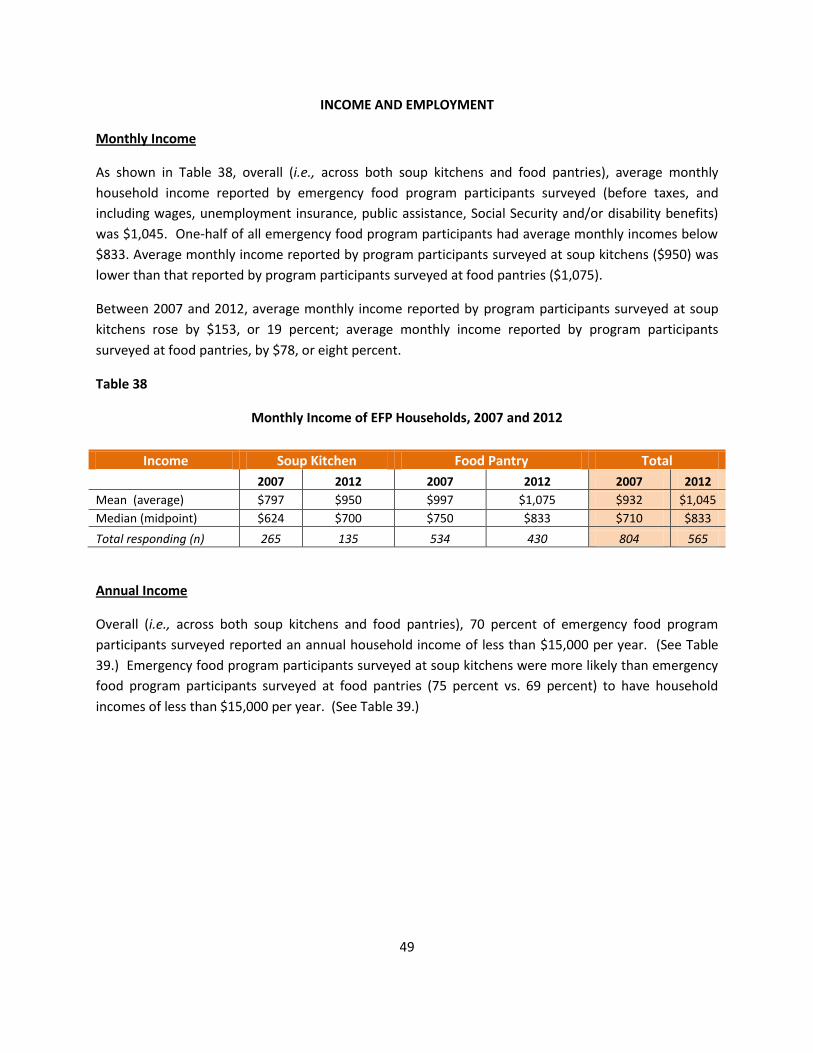
49
INCOME AND EMPLOYMENT
Monthly Income
As shown in Table 38, overall (i.e., across both soup kitchens and food pantries), average monthly
household income reported by emergency food program participants surveyed (before taxes, and
including wages, unemployment insurance, public assistance, Social Security and/or disability benefits)
was $1,045. One-half of all emergency food program participants had average monthly incomes below
$833. Average monthly income reported by program participants surveyed at soup kitchens ($950) was
lower than that reported by program participants surveyed at food pantries ($1,075).
Between 2007 and 2012, average monthly income reported by program participants surveyed at soup
kitchens rose by $153, or 19 percent; average monthly income reported by program participants
surveyed at food pantries, by $78, or eight percent.
Table 38
Monthly Income of EFP Households, 2007 and 2012
Income Soup Kitchen Food Pantry Total
2007 2012 2007 2012 2007 2012
Mean (average) $797 $950 $997 $1,075 $932 $1,045
Median (midpoint) $624 $700 $750 $833 $710 $833
Total responding (n) 265 135 534 430 804 565
Annual Income
Overall (i.e., across both soup kitchens and food pantries), 70 percent of emergency food program
participants surveyed reported an annual household income of less than $15,000 per year. (See Table
39.) Emergency food program participants surveyed at soup kitchens were more likely than emergency
food program participants surveyed at food pantries (75 percent vs. 69 percent) to have household
incomes of less than $15,000 per year. (See Table 39.)
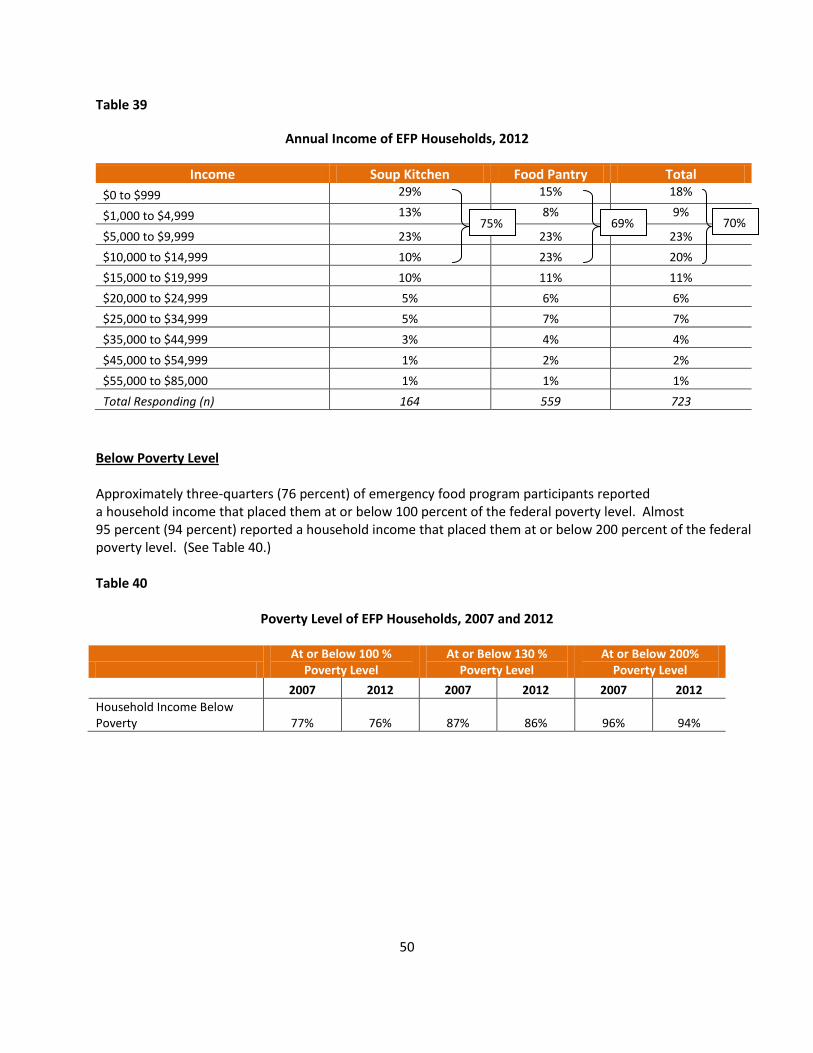
50
Table 39
Annual Income of EFP Households, 2012
Income Soup Kitchen Food Pantry Total
$0 to $999 29% 15% 18%
$1,000 to $4,999 13% 8% 9%
$5,000 to $9,999 23% 23% 23%
$10,000 to $14,999 10% 23% 20%
$15,000 to $19,999 10% 11% 11%
$20,000 to $24,999 5% 6% 6%
$25,000 to $34,999 5% 7% 7%
$35,000 to $44,999 3% 4% 4%
$45,000 to $54,999 1% 2% 2%
$55,000 to $85,000 1% 1% 1%
Total Responding (n) 164 559 723
Below Poverty Level Approximately three-quarters (76 percent) of emergency food program participants reported a household income that placed them at or below 100 percent of the federal poverty level. Almost 95 percent (94 percent) reported a household income that placed them at or below 200 percent of the federal poverty level. (See Table 40.)
Table 40
Poverty Level of EFP Households, 2007 and 2012
At or Below 100 %
Poverty Level At or Below 130 %
Poverty Level At or Below 200%
Poverty Level
2007 2012 2007 2012 2007 2012
Household Income Below Poverty 77% 76% 87% 86% 96% 94%
70% 69% 75%
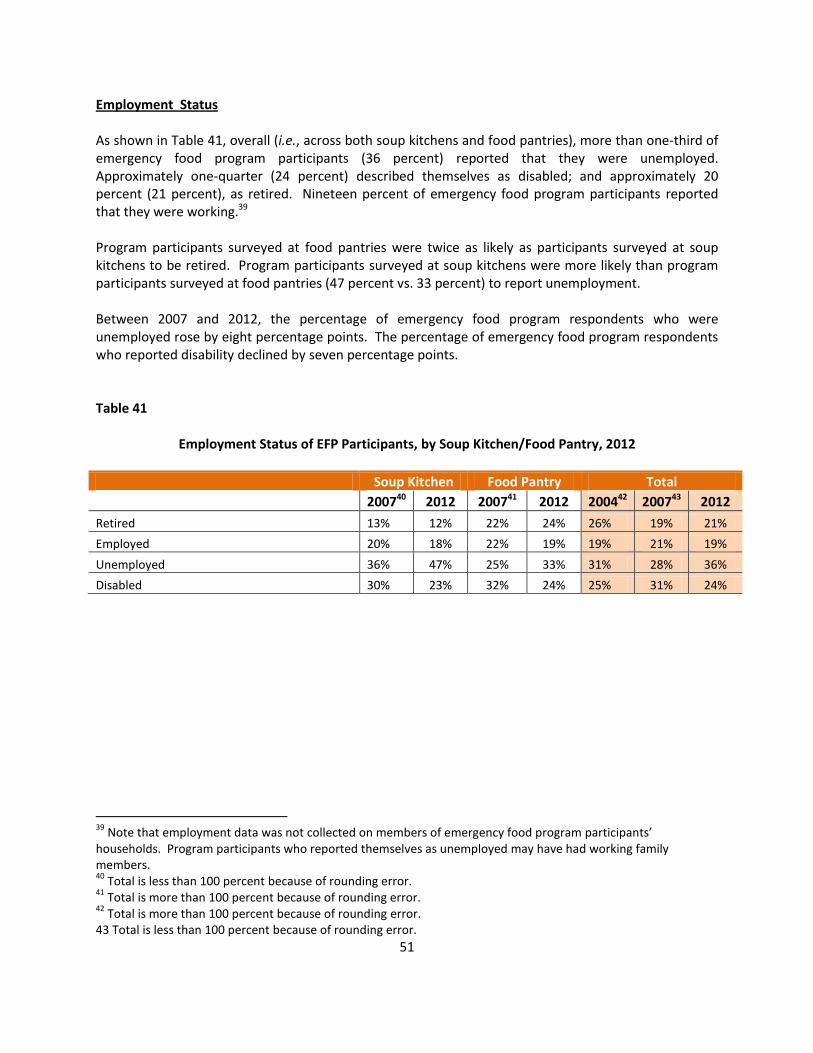
51
Employment Status As shown in Table 41, overall (i.e., across both soup kitchens and food pantries), more than one-third of emergency food program participants (36 percent) reported that they were unemployed. Approximately one-quarter (24 percent) described themselves as disabled; and approximately 20 percent (21 percent), as retired. Nineteen percent of emergency food program participants reported that they were working.39 Program participants surveyed at food pantries were twice as likely as participants surveyed at soup kitchens to be retired. Program participants surveyed at soup kitchens were more likely than program participants surveyed at food pantries (47 percent vs. 33 percent) to report unemployment. Between 2007 and 2012, the percentage of emergency food program respondents who were unemployed rose by eight percentage points. The percentage of emergency food program respondents who reported disability declined by seven percentage points. Table 41
Employment Status of EFP Participants, by Soup Kitchen/Food Pantry, 2012
Soup Kitchen Food Pantry Total
200740 2012 200741 2012 200442 200743 2012
Retired 13% 12% 22% 24% 26% 19% 21%
Employed 20% 18% 22% 19% 19% 21% 19%
Unemployed 36% 47% 25% 33% 31% 28% 36%
Disabled 30% 23% 32% 24% 25% 31% 24%
39
Note that employment data was not collected on members of emergency food program participants’ households. Program participants who reported themselves as unemployed may have had working family members. 40
Total is less than 100 percent because of rounding error. 41
Total is more than 100 percent because of rounding error. 42
Total is more than 100 percent because of rounding error. 43 Total is less than 100 percent because of rounding error.
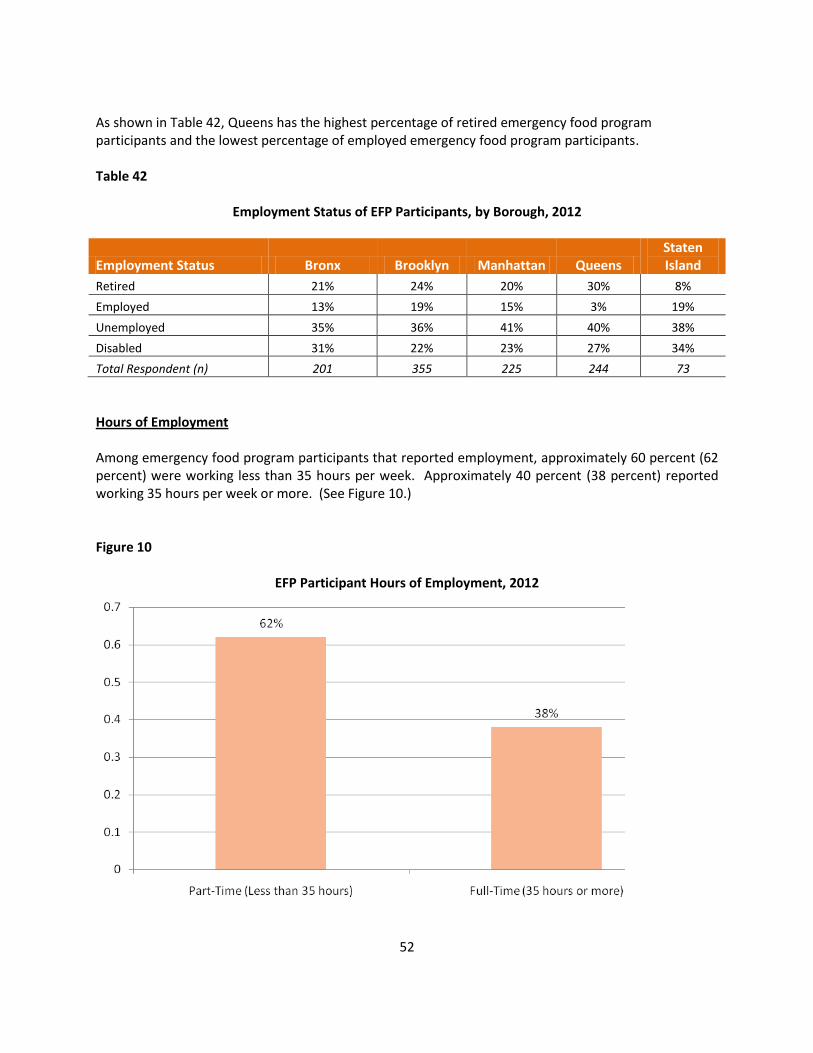
52
As shown in Table 42, Queens has the highest percentage of retired emergency food program participants and the lowest percentage of employed emergency food program participants. Table 42
Employment Status of EFP Participants, by Borough, 2012
Employment Status Bronx Brooklyn Manhattan Queens Staten Island
Retired 21% 24% 20% 30% 8%
Employed 13% 19% 15% 3% 19%
Unemployed 35% 36% 41% 40% 38%
Disabled 31% 22% 23% 27% 34%
Total Respondent (n) 201 355 225 244 73
Hours of Employment Among emergency food program participants that reported employment, approximately 60 percent (62 percent) were working less than 35 hours per week. Approximately 40 percent (38 percent) reported working 35 hours per week or more. (See Figure 10.) Figure 10
EFP Participant Hours of Employment, 2012
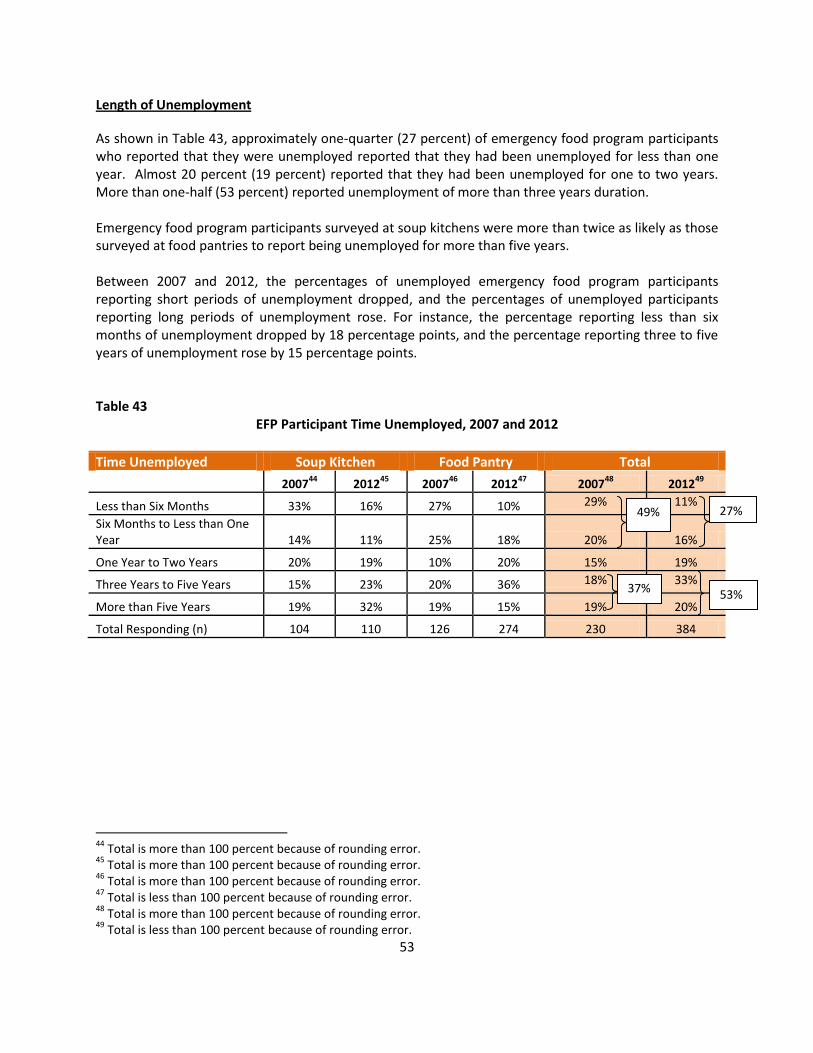
53
Length of Unemployment
As shown in Table 43, approximately one-quarter (27 percent) of emergency food program participants who reported that they were unemployed reported that they had been unemployed for less than one year. Almost 20 percent (19 percent) reported that they had been unemployed for one to two years. More than one-half (53 percent) reported unemployment of more than three years duration. Emergency food program participants surveyed at soup kitchens were more than twice as likely as those surveyed at food pantries to report being unemployed for more than five years.
Between 2007 and 2012, the percentages of unemployed emergency food program participants reporting short periods of unemployment dropped, and the percentages of unemployed participants reporting long periods of unemployment rose. For instance, the percentage reporting less than six months of unemployment dropped by 18 percentage points, and the percentage reporting three to five years of unemployment rose by 15 percentage points. Table 43
EFP Participant Time Unemployed, 2007 and 2012
Time Unemployed Soup Kitchen Food Pantry Total
200744
201245
200746
201247
200748
201249
Less than Six Months 33% 16% 27% 10% 29% 11%
Six Months to Less than One Year 14% 11% 25% 18% 20% 16%
One Year to Two Years 20% 19% 10% 20% 15% 19%
Three Years to Five Years 15% 23% 20% 36% 18% 33%
More than Five Years 19% 32% 19% 15% 19% 20%
Total Responding (n) 104 110 126 274 230 384
44
Total is more than 100 percent because of rounding error. 45
Total is more than 100 percent because of rounding error. 46
Total is more than 100 percent because of rounding error. 47
Total is less than 100 percent because of rounding error. 48
Total is more than 100 percent because of rounding error. 49
Total is less than 100 percent because of rounding error.
27%
53%
49%
37%
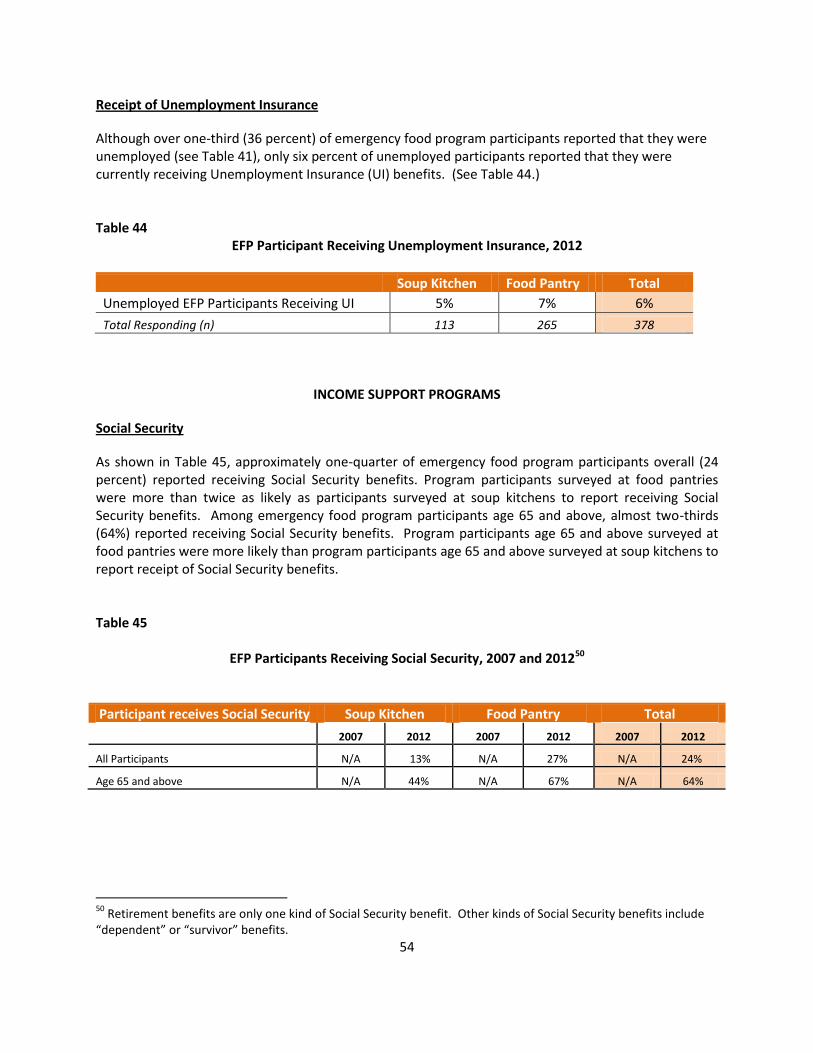
54
Receipt of Unemployment Insurance
Although over one-third (36 percent) of emergency food program participants reported that they were unemployed (see Table 41), only six percent of unemployed participants reported that they were currently receiving Unemployment Insurance (UI) benefits. (See Table 44.) Table 44
EFP Participant Receiving Unemployment Insurance, 2012
Soup Kitchen Food Pantry Total
Unemployed EFP Participants Receiving UI 5% 7% 6%
Total Responding (n) 113 265 378
INCOME SUPPORT PROGRAMS
Social Security
As shown in Table 45, approximately one-quarter of emergency food program participants overall (24 percent) reported receiving Social Security benefits. Program participants surveyed at food pantries were more than twice as likely as participants surveyed at soup kitchens to report receiving Social Security benefits. Among emergency food program participants age 65 and above, almost two-thirds (64%) reported receiving Social Security benefits. Program participants age 65 and above surveyed at food pantries were more likely than program participants age 65 and above surveyed at soup kitchens to report receipt of Social Security benefits. Table 45
EFP Participants Receiving Social Security, 2007 and 201250
Participant receives Social Security Soup Kitchen Food Pantry Total
2007 2012 2007 2012 2007 2012
All Participants N/A 13% N/A 27% N/A 24%
Age 65 and above N/A 44% N/A 67% N/A 64%
50
Retirement benefits are only one kind of Social Security benefit. Other kinds of Social Security benefits include “dependent” or “survivor” benefits.
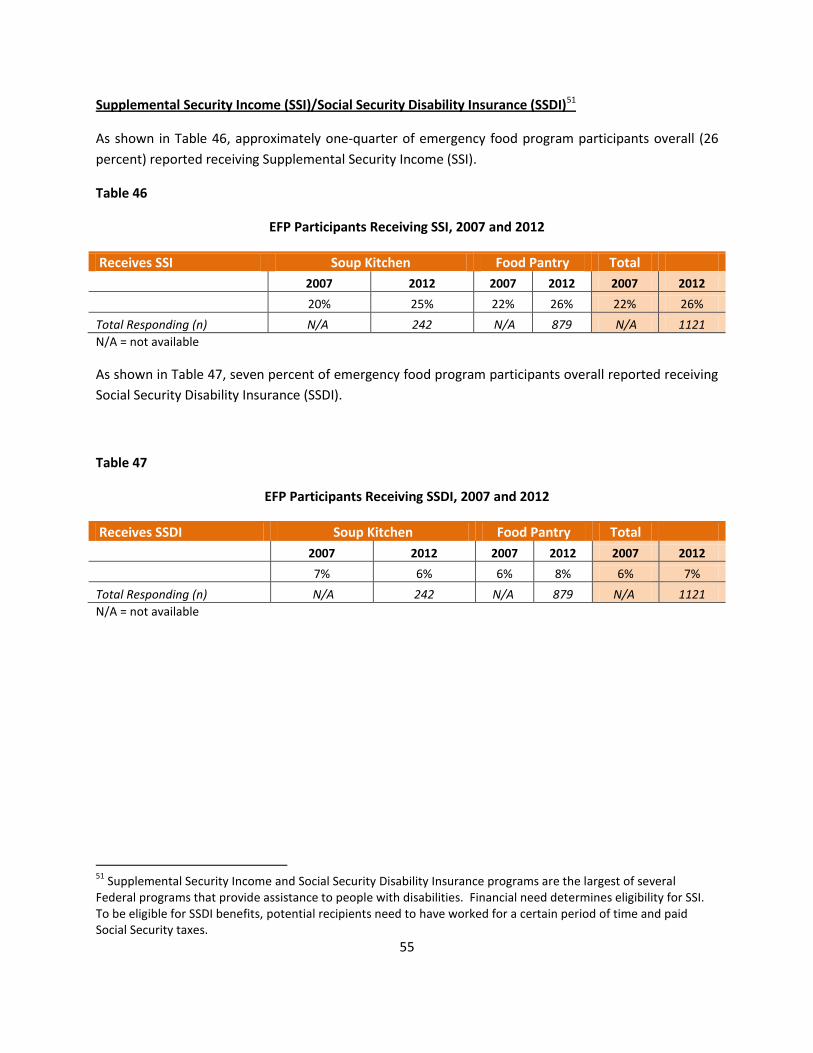
55
Supplemental Security Income (SSI)/Social Security Disability Insurance (SSDI)51
As shown in Table 46, approximately one-quarter of emergency food program participants overall (26
percent) reported receiving Supplemental Security Income (SSI).
Table 46
EFP Participants Receiving SSI, 2007 and 2012
Receives SSI Soup Kitchen Food Pantry Total
2007 2012 2007 2012 2007 2012
20% 25% 22% 26% 22% 26%
Total Responding (n) N/A 242 N/A 879 N/A 1121
N/A = not available
As shown in Table 47, seven percent of emergency food program participants overall reported receiving
Social Security Disability Insurance (SSDI).
Table 47
EFP Participants Receiving SSDI, 2007 and 2012
Receives SSDI Soup Kitchen Food Pantry Total
2007 2012 2007 2012 2007 2012
7% 6% 6% 8% 6% 7%
Total Responding (n) N/A 242 N/A 879 N/A 1121
N/A = not available
51
Supplemental Security Income and Social Security Disability Insurance programs are the largest of several Federal programs that provide assistance to people with disabilities. Financial need determines eligibility for SSI. To be eligible for SSDI benefits, potential recipients need to have worked for a certain period of time and paid Social Security taxes.
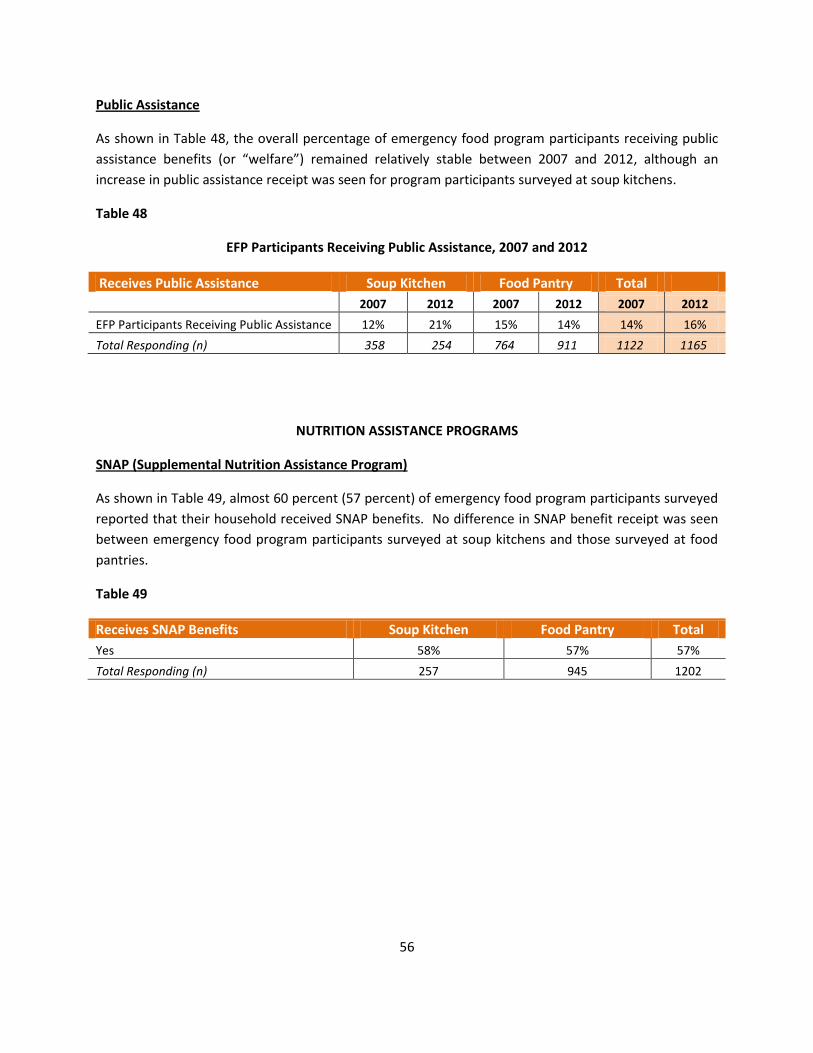
56
Public Assistance
As shown in Table 48, the overall percentage of emergency food program participants receiving public
assistance benefits (or “welfare”) remained relatively stable between 2007 and 2012, although an
increase in public assistance receipt was seen for program participants surveyed at soup kitchens.
Table 48
EFP Participants Receiving Public Assistance, 2007 and 2012
Receives Public Assistance Soup Kitchen Food Pantry Total
2007 2012 2007 2012 2007 2012
EFP Participants Receiving Public Assistance 12% 21% 15% 14% 14% 16%
Total Responding (n) 358 254 764 911 1122 1165
NUTRITION ASSISTANCE PROGRAMS
SNAP (Supplemental Nutrition Assistance Program)
As shown in Table 49, almost 60 percent (57 percent) of emergency food program participants surveyed
reported that their household received SNAP benefits. No difference in SNAP benefit receipt was seen
between emergency food program participants surveyed at soup kitchens and those surveyed at food
pantries.
Table 49
Receives SNAP Benefits Soup Kitchen Food Pantry Total
Yes 58% 57% 57%
Total Responding (n) 257 945 1202
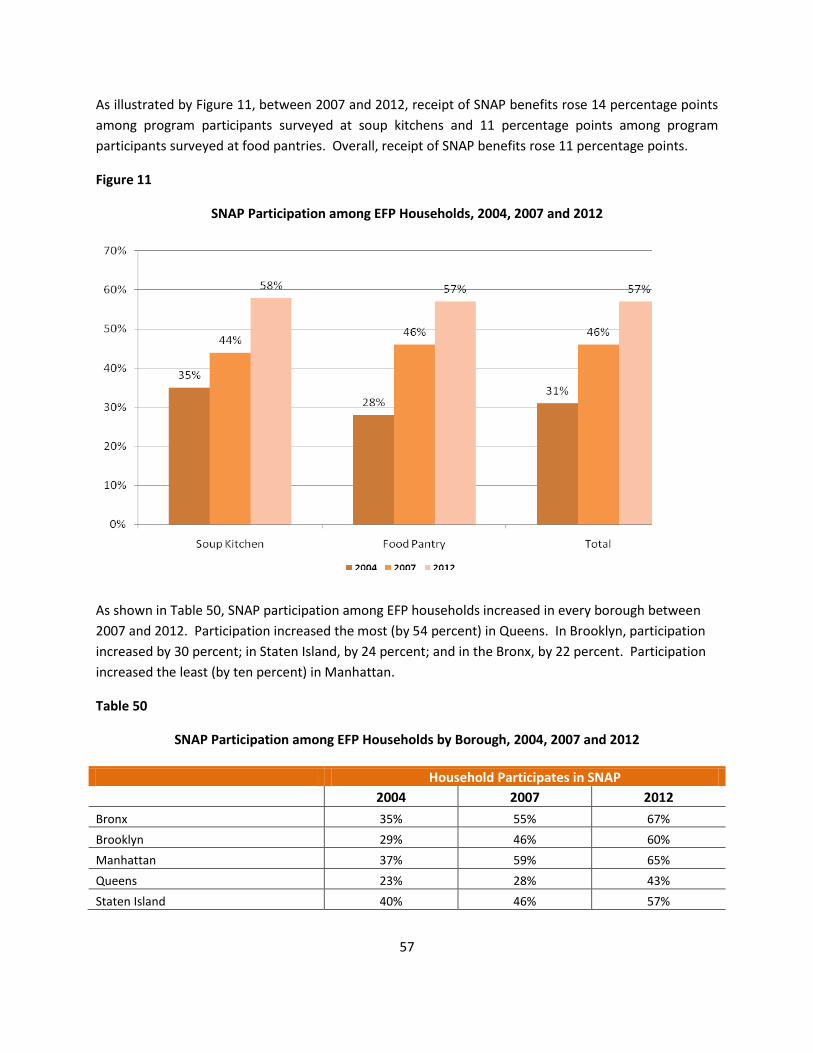
57
As illustrated by Figure 11, between 2007 and 2012, receipt of SNAP benefits rose 14 percentage points
among program participants surveyed at soup kitchens and 11 percentage points among program
participants surveyed at food pantries. Overall, receipt of SNAP benefits rose 11 percentage points.
Figure 11
SNAP Participation among EFP Households, 2004, 2007 and 2012
As shown in Table 50, SNAP participation among EFP households increased in every borough between
2007 and 2012. Participation increased the most (by 54 percent) in Queens. In Brooklyn, participation
increased by 30 percent; in Staten Island, by 24 percent; and in the Bronx, by 22 percent. Participation
increased the least (by ten percent) in Manhattan.
Table 50
SNAP Participation among EFP Households by Borough, 2004, 2007 and 2012
Household Participates in SNAP
2004 2007 2012
Bronx 35% 55% 67%
Brooklyn 29% 46% 60%
Manhattan 37% 59% 65%
Queens 23% 28% 43%
Staten Island 40% 46% 57%
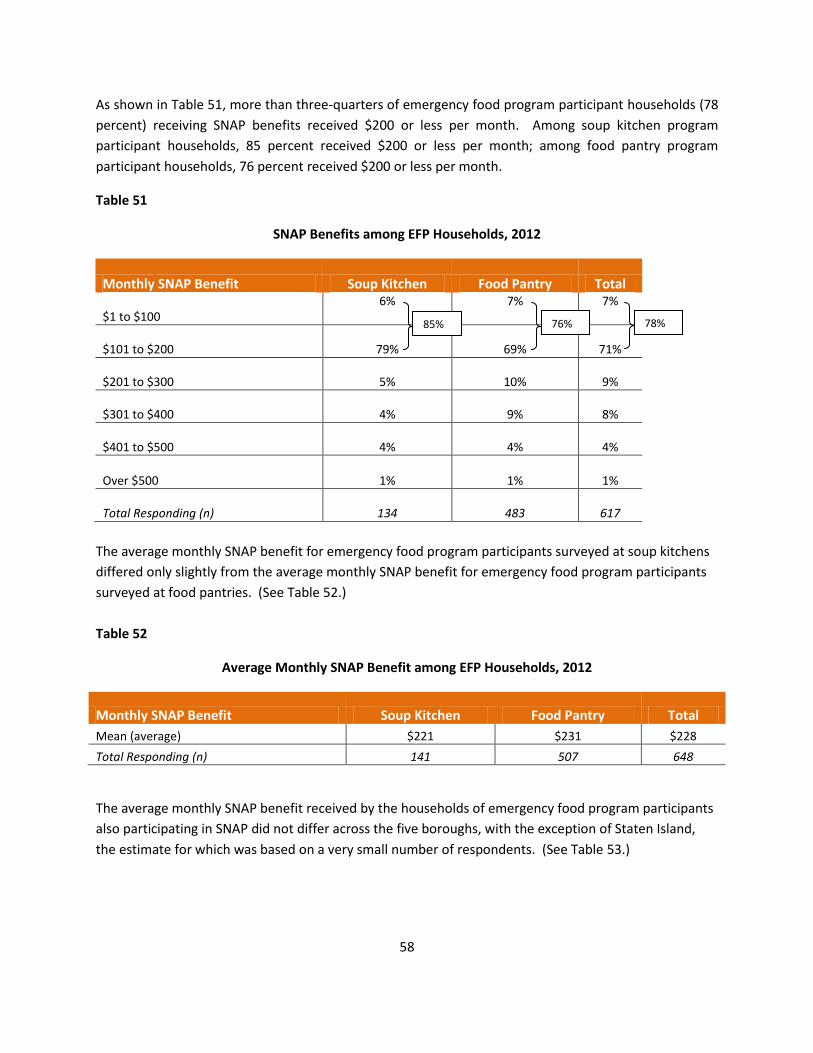
58
As shown in Table 51, more than three-quarters of emergency food program participant households (78
percent) receiving SNAP benefits received $200 or less per month. Among soup kitchen program
participant households, 85 percent received $200 or less per month; among food pantry program
participant households, 76 percent received $200 or less per month.
Table 51
SNAP Benefits among EFP Households, 2012
Monthly SNAP Benefit Soup Kitchen Food Pantry Total
$1 to $100 6% 7% 7%
$101 to $200 79% 69% 71%
$201 to $300 5% 10% 9%
$301 to $400 4% 9% 8%
$401 to $500 4% 4% 4%
Over $500 1% 1% 1%
Total Responding (n) 134 483 617
The average monthly SNAP benefit for emergency food program participants surveyed at soup kitchens
differed only slightly from the average monthly SNAP benefit for emergency food program participants
surveyed at food pantries. (See Table 52.)
Table 52
Average Monthly SNAP Benefit among EFP Households, 2012
Monthly SNAP Benefit Soup Kitchen Food Pantry Total
Mean (average) $221 $231 $228
Total Responding (n) 141 507 648
The average monthly SNAP benefit received by the households of emergency food program participants
also participating in SNAP did not differ across the five boroughs, with the exception of Staten Island,
the estimate for which was based on a very small number of respondents. (See Table 53.)
85% 76% 78%
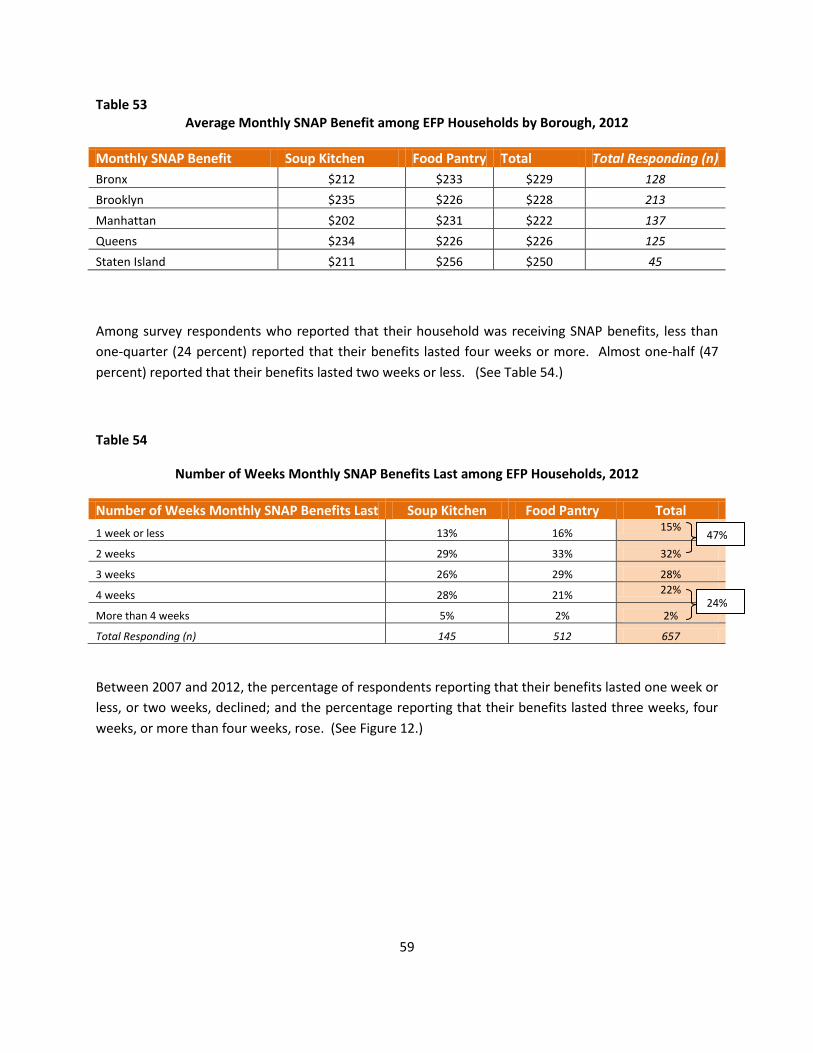
59
Table 53 Average Monthly SNAP Benefit among EFP Households by Borough, 2012
Monthly SNAP Benefit Soup Kitchen Food Pantry Total Total Responding (n)
Bronx $212 $233 $229 128
Brooklyn $235 $226 $228 213
Manhattan $202 $231 $222 137
Queens $234 $226 $226 125
Staten Island $211 $256 $250 45
Among survey respondents who reported that their household was receiving SNAP benefits, less than
one-quarter (24 percent) reported that their benefits lasted four weeks or more. Almost one-half (47
percent) reported that their benefits lasted two weeks or less. (See Table 54.)
Table 54
Number of Weeks Monthly SNAP Benefits Last among EFP Households, 2012
Number of Weeks Monthly SNAP Benefits Last Soup Kitchen Food Pantry Total
1 week or less 13% 16% 15%
2 weeks 29% 33% 32%
3 weeks 26% 29% 28%
4 weeks 28% 21% 22%
More than 4 weeks 5% 2% 2%
Total Responding (n) 145 512 657
Between 2007 and 2012, the percentage of respondents reporting that their benefits lasted one week or
less, or two weeks, declined; and the percentage reporting that their benefits lasted three weeks, four
weeks, or more than four weeks, rose. (See Figure 12.)
47%
24%
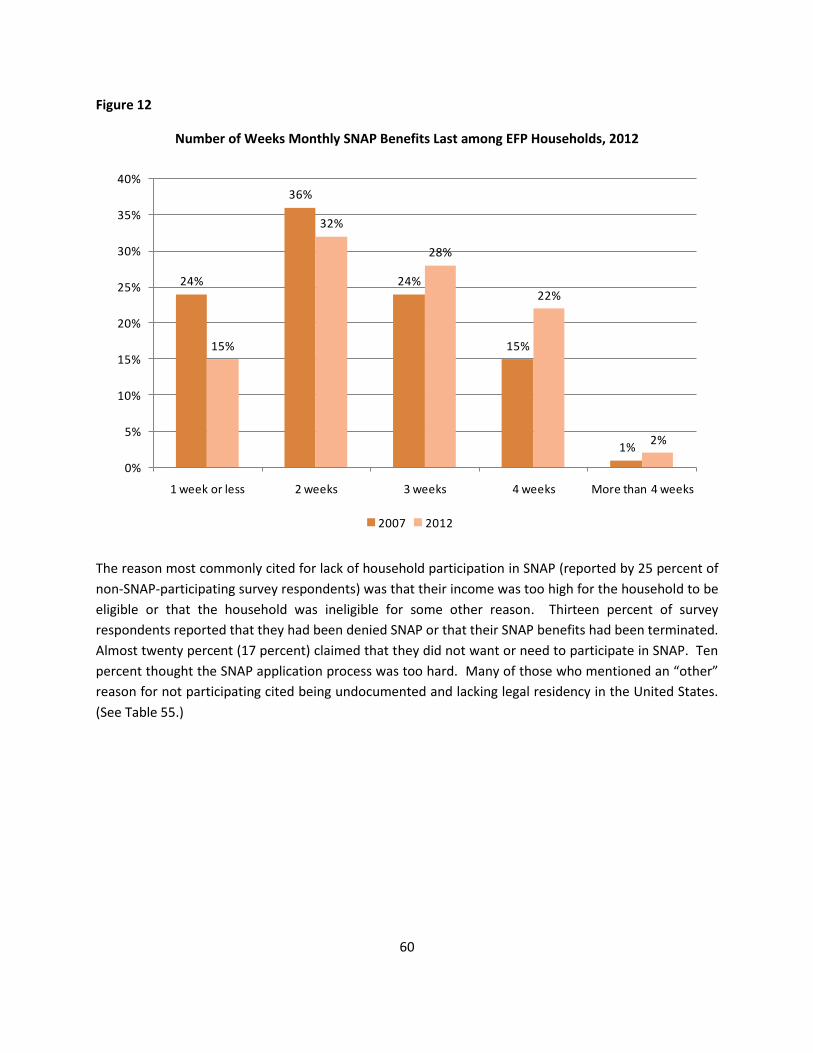
60
Figure 12
Number of Weeks Monthly SNAP Benefits Last among EFP Households, 2012
24%
36%
24%
15%
1%
15%
32%
28%
22%
2%
0%
5%
10%
15%
20%
25%
30%
35%
40%
1 week or less 2 weeks 3 weeks 4 weeks More than 4 weeks
2007 2012
The reason most commonly cited for lack of household participation in SNAP (reported by 25 percent of
non-SNAP-participating survey respondents) was that their income was too high for the household to be
eligible or that the household was ineligible for some other reason. Thirteen percent of survey
respondents reported that they had been denied SNAP or that their SNAP benefits had been terminated.
Almost twenty percent (17 percent) claimed that they did not want or need to participate in SNAP. Ten
percent thought the SNAP application process was too hard. Many of those who mentioned an “other”
reason for not participating cited being undocumented and lacking legal residency in the United States.
(See Table 55.)
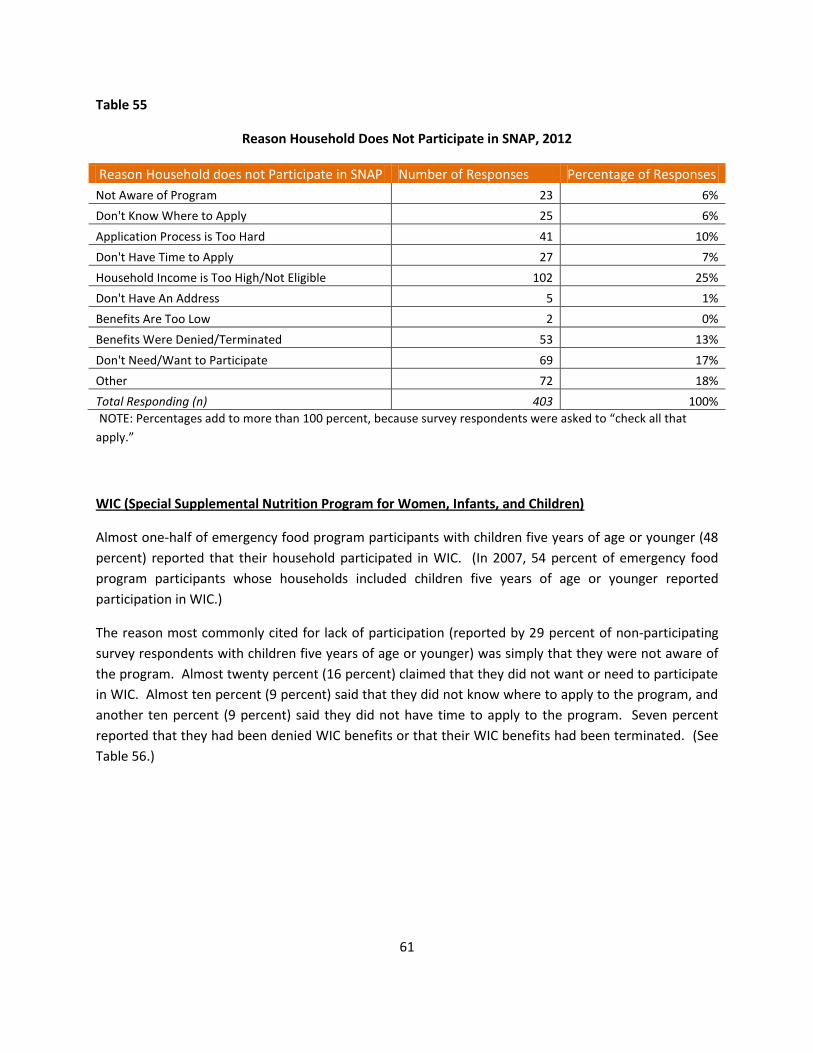
61
Table 55
Reason Household Does Not Participate in SNAP, 2012
Reason Household does not Participate in SNAP Number of Responses Percentage of Responses
Not Aware of Program 23 6%
Don't Know Where to Apply 25 6%
Application Process is Too Hard 41 10%
Don't Have Time to Apply 27 7%
Household Income is Too High/Not Eligible 102 25%
Don't Have An Address 5 1%
Benefits Are Too Low 2 0%
Benefits Were Denied/Terminated 53 13%
Don't Need/Want to Participate 69 17%
Other 72 18%
Total Responding (n) 403 100%
NOTE: Percentages add to more than 100 percent, because survey respondents were asked to “check all that
apply.”
WIC (Special Supplemental Nutrition Program for Women, Infants, and Children)
Almost one-half of emergency food program participants with children five years of age or younger (48
percent) reported that their household participated in WIC. (In 2007, 54 percent of emergency food
program participants whose households included children five years of age or younger reported
participation in WIC.)
The reason most commonly cited for lack of participation (reported by 29 percent of non-participating
survey respondents with children five years of age or younger) was simply that they were not aware of
the program. Almost twenty percent (16 percent) claimed that they did not want or need to participate
in WIC. Almost ten percent (9 percent) said that they did not know where to apply to the program, and
another ten percent (9 percent) said they did not have time to apply to the program. Seven percent
reported that they had been denied WIC benefits or that their WIC benefits had been terminated. (See
Table 56.)
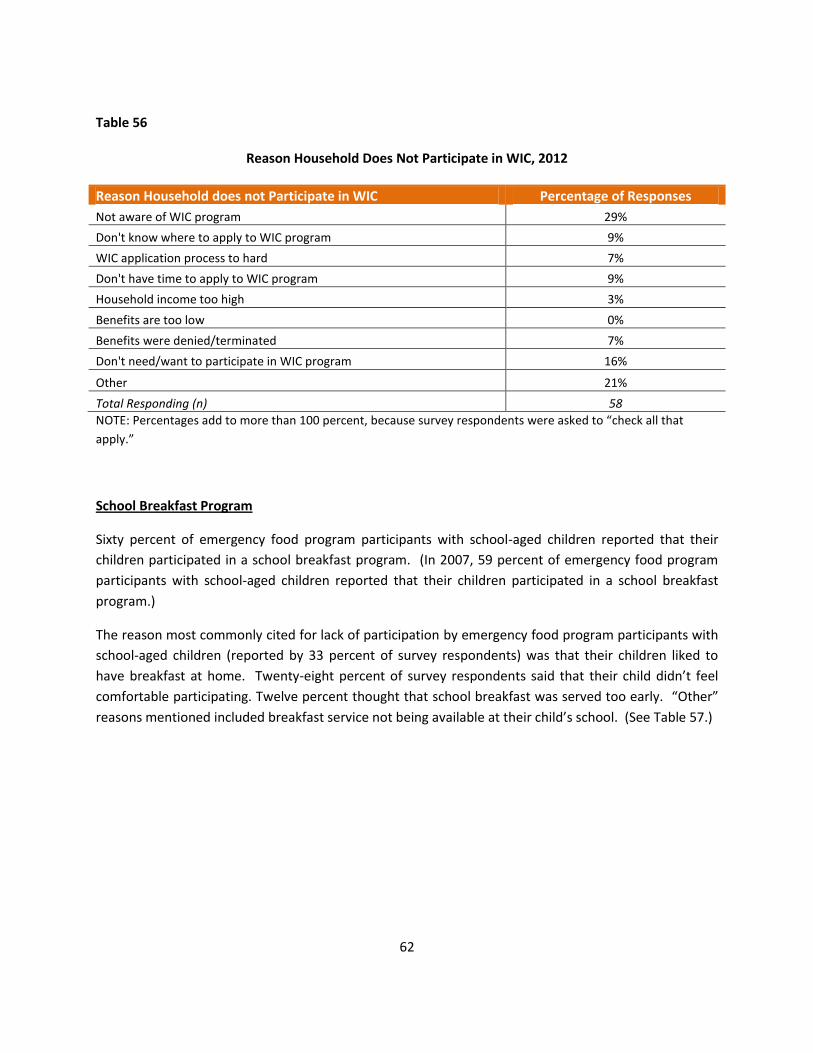
62
Table 56
Reason Household Does Not Participate in WIC, 2012
Reason Household does not Participate in WIC Percentage of Responses
Not aware of WIC program 29%
Don't know where to apply to WIC program 9%
WIC application process to hard 7%
Don't have time to apply to WIC program 9%
Household income too high 3%
Benefits are too low 0%
Benefits were denied/terminated 7%
Don't need/want to participate in WIC program 16%
Other 21%
Total Responding (n) 58
NOTE: Percentages add to more than 100 percent, because survey respondents were asked to “check all that
apply.”
School Breakfast Program
Sixty percent of emergency food program participants with school-aged children reported that their
children participated in a school breakfast program. (In 2007, 59 percent of emergency food program
participants with school-aged children reported that their children participated in a school breakfast
program.)
The reason most commonly cited for lack of participation by emergency food program participants with
school-aged children (reported by 33 percent of survey respondents) was that their children liked to
have breakfast at home. Twenty-eight percent of survey respondents said that their child didn’t feel
comfortable participating. Twelve percent thought that school breakfast was served too early. “Other”
reasons mentioned included breakfast service not being available at their child’s school. (See Table 57.)
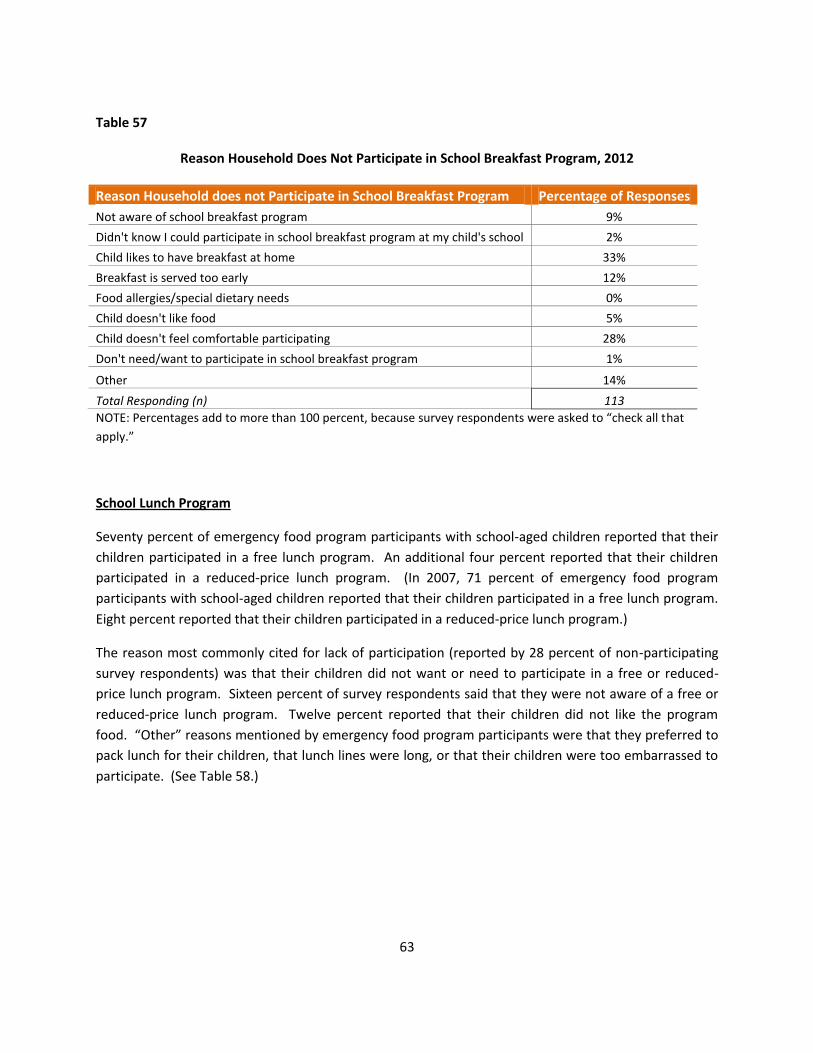
63
Table 57
Reason Household Does Not Participate in School Breakfast Program, 2012
Reason Household does not Participate in School Breakfast Program Percentage of Responses
Not aware of school breakfast program 9%
Didn't know I could participate in school breakfast program at my child's school 2%
Child likes to have breakfast at home 33%
Breakfast is served too early 12%
Food allergies/special dietary needs 0%
Child doesn't like food 5%
Child doesn't feel comfortable participating 28%
Don't need/want to participate in school breakfast program 1%
Other 14%
Total Responding (n) 113
NOTE: Percentages add to more than 100 percent, because survey respondents were asked to “check all that
apply.”
School Lunch Program
Seventy percent of emergency food program participants with school-aged children reported that their
children participated in a free lunch program. An additional four percent reported that their children
participated in a reduced-price lunch program. (In 2007, 71 percent of emergency food program
participants with school-aged children reported that their children participated in a free lunch program.
Eight percent reported that their children participated in a reduced-price lunch program.)
The reason most commonly cited for lack of participation (reported by 28 percent of non-participating
survey respondents) was that their children did not want or need to participate in a free or reduced-
price lunch program. Sixteen percent of survey respondents said that they were not aware of a free or
reduced-price lunch program. Twelve percent reported that their children did not like the program
food. “Other” reasons mentioned by emergency food program participants were that they preferred to
pack lunch for their children, that lunch lines were long, or that their children were too embarrassed to
participate. (See Table 58.)
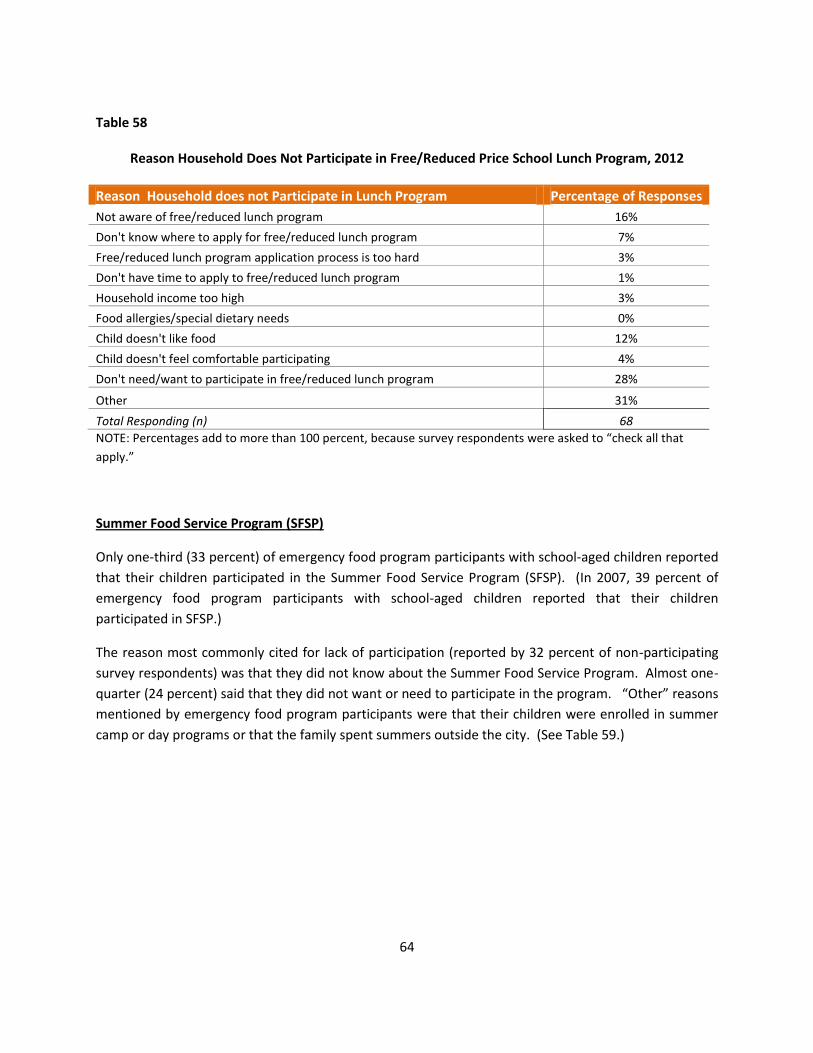
64
Table 58
Reason Household Does Not Participate in Free/Reduced Price School Lunch Program, 2012
Reason Household does not Participate in Lunch Program Percentage of Responses
Not aware of free/reduced lunch program 16%
Don't know where to apply for free/reduced lunch program 7%
Free/reduced lunch program application process is too hard 3%
Don't have time to apply to free/reduced lunch program 1%
Household income too high 3%
Food allergies/special dietary needs 0%
Child doesn't like food 12%
Child doesn't feel comfortable participating 4%
Don't need/want to participate in free/reduced lunch program 28%
Other 31%
Total Responding (n) 68
NOTE: Percentages add to more than 100 percent, because survey respondents were asked to “check all that
apply.”
Summer Food Service Program (SFSP)
Only one-third (33 percent) of emergency food program participants with school-aged children reported
that their children participated in the Summer Food Service Program (SFSP). (In 2007, 39 percent of
emergency food program participants with school-aged children reported that their children
participated in SFSP.)
The reason most commonly cited for lack of participation (reported by 32 percent of non-participating
survey respondents) was that they did not know about the Summer Food Service Program. Almost one-
quarter (24 percent) said that they did not want or need to participate in the program. “Other” reasons
mentioned by emergency food program participants were that their children were enrolled in summer
camp or day programs or that the family spent summers outside the city. (See Table 59.)
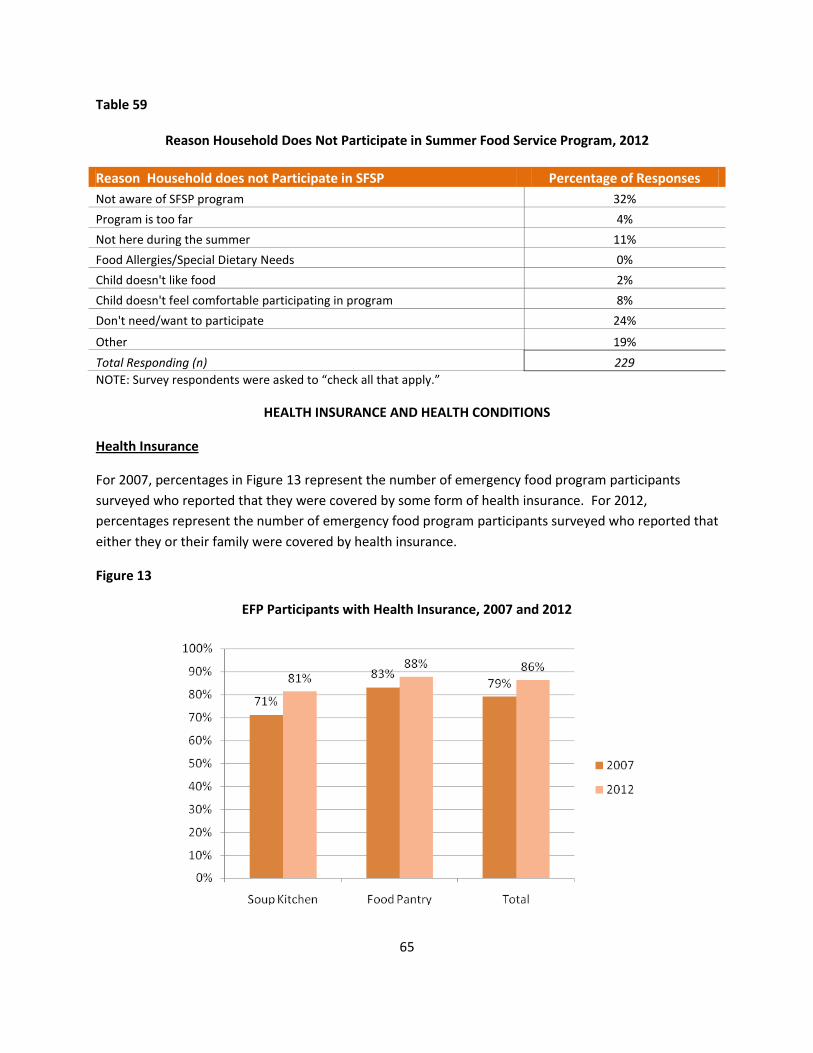
65
Table 59
Reason Household Does Not Participate in Summer Food Service Program, 2012
Reason Household does not Participate in SFSP Percentage of Responses
Not aware of SFSP program 32%
Program is too far 4%
Not here during the summer 11%
Food Allergies/Special Dietary Needs 0%
Child doesn't like food 2%
Child doesn't feel comfortable participating in program 8%
Don't need/want to participate 24%
Other 19%
Total Responding (n) 229
NOTE: Survey respondents were asked to “check all that apply.”
HEALTH INSURANCE AND HEALTH CONDITIONS
Health Insurance
For 2007, percentages in Figure 13 represent the number of emergency food program participants
surveyed who reported that they were covered by some form of health insurance. For 2012,
percentages represent the number of emergency food program participants surveyed who reported that
either they or their family were covered by health insurance.
Figure 13
EFP Participants with Health Insurance, 2007 and 2012
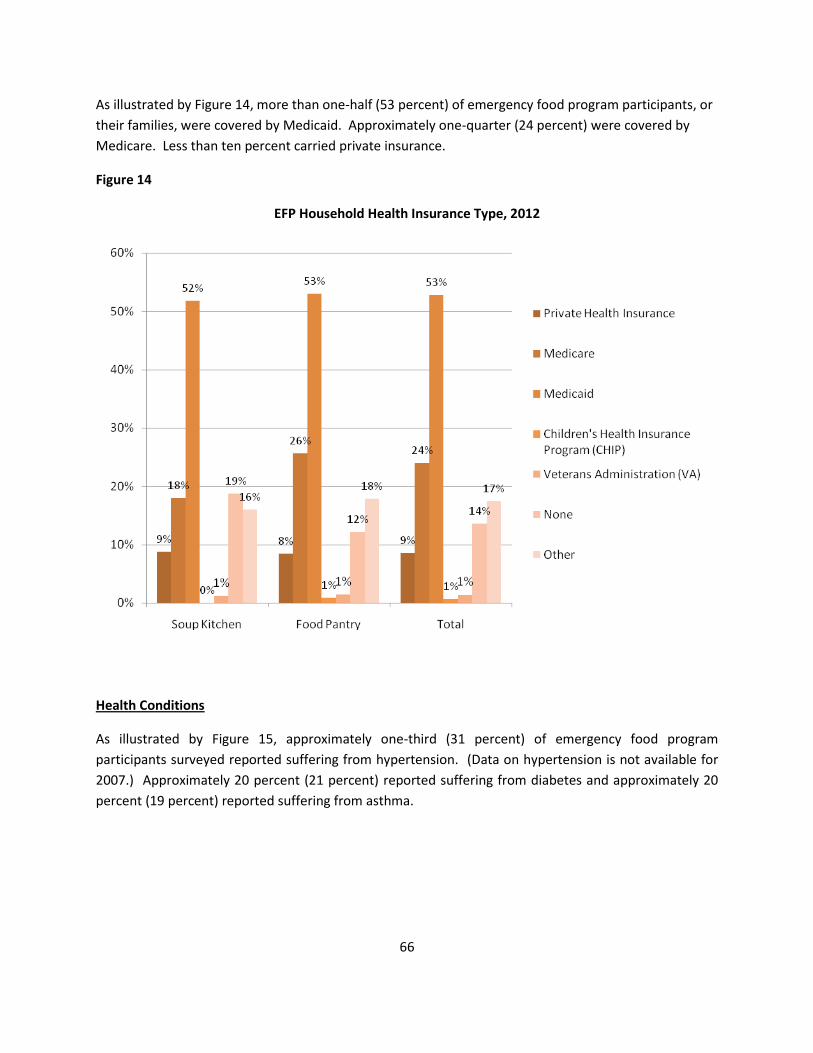
66
As illustrated by Figure 14, more than one-half (53 percent) of emergency food program participants, or
their families, were covered by Medicaid. Approximately one-quarter (24 percent) were covered by
Medicare. Less than ten percent carried private insurance.
Figure 14
EFP Household Health Insurance Type, 2012
Health Conditions
As illustrated by Figure 15, approximately one-third (31 percent) of emergency food program
participants surveyed reported suffering from hypertension. (Data on hypertension is not available for
2007.) Approximately 20 percent (21 percent) reported suffering from diabetes and approximately 20
percent (19 percent) reported suffering from asthma.
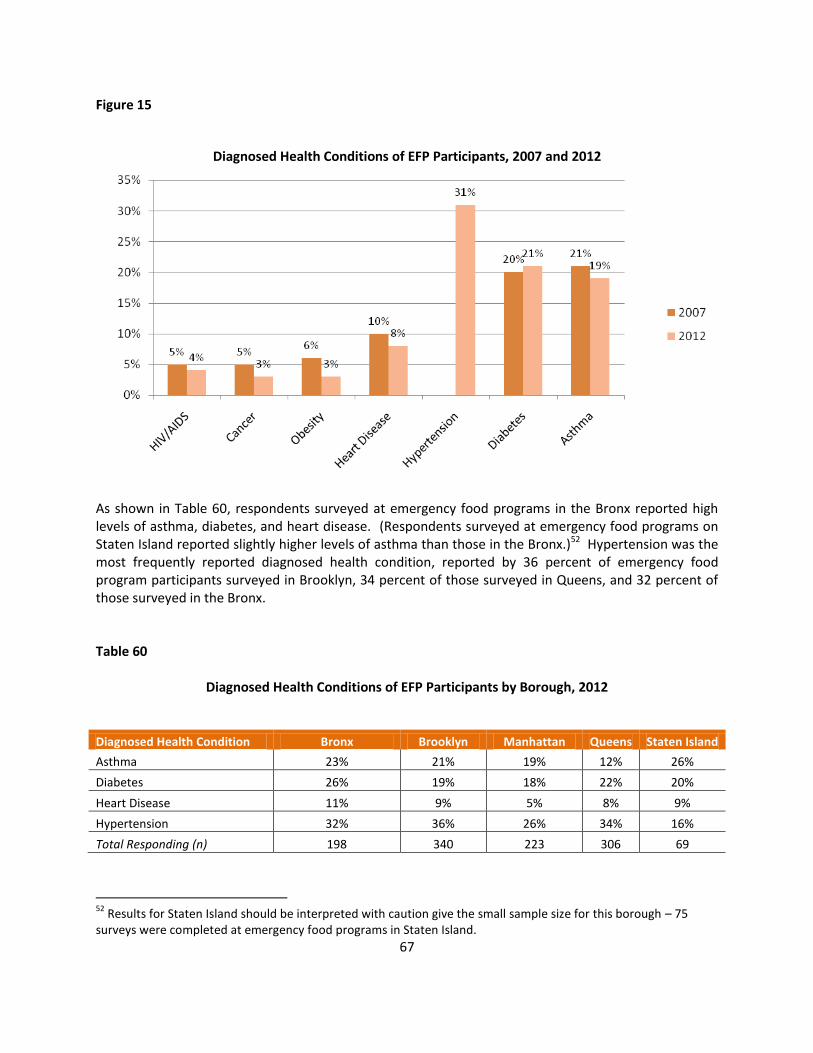
67
Figure 15
Diagnosed Health Conditions of EFP Participants, 2007 and 2012
As shown in Table 60, respondents surveyed at emergency food programs in the Bronx reported high levels of asthma, diabetes, and heart disease. (Respondents surveyed at emergency food programs on Staten Island reported slightly higher levels of asthma than those in the Bronx.)52 Hypertension was the most frequently reported diagnosed health condition, reported by 36 percent of emergency food program participants surveyed in Brooklyn, 34 percent of those surveyed in Queens, and 32 percent of those surveyed in the Bronx. Table 60
Diagnosed Health Conditions of EFP Participants by Borough, 2012
Diagnosed Health Condition Bronx Brooklyn Manhattan Queens Staten Island
Asthma 23% 21% 19% 12% 26%
Diabetes 26% 19% 18% 22% 20%
Heart Disease 11% 9% 5% 8% 9%
Hypertension 32% 36% 26% 34% 16%
Total Responding (n) 198 340 223 306 69
52
Results for Staten Island should be interpreted with caution give the small sample size for this borough – 75 surveys were completed at emergency food programs in Staten Island.
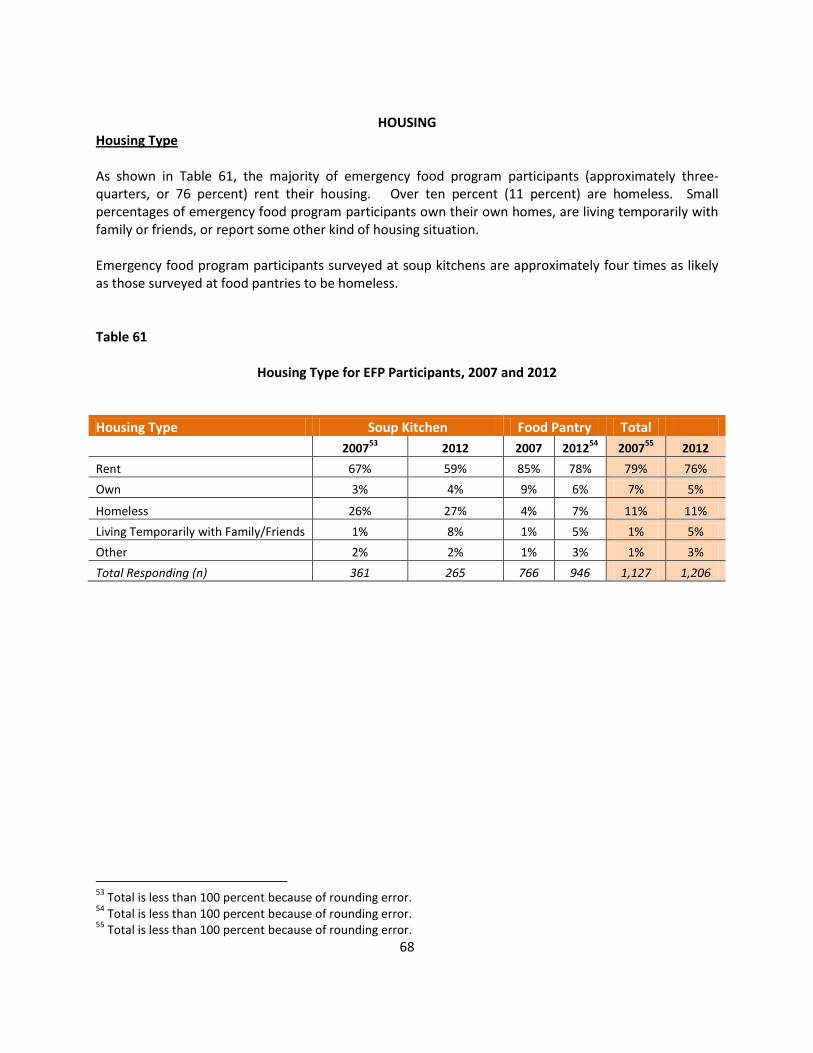
68
HOUSING
Housing Type As shown in Table 61, the majority of emergency food program participants (approximately three-quarters, or 76 percent) rent their housing. Over ten percent (11 percent) are homeless. Small percentages of emergency food program participants own their own homes, are living temporarily with family or friends, or report some other kind of housing situation. Emergency food program participants surveyed at soup kitchens are approximately four times as likely as those surveyed at food pantries to be homeless. Table 61
Housing Type for EFP Participants, 2007 and 2012
Housing Type Soup Kitchen Food Pantry Total
200753
2012 2007 201254
200755
2012
Rent 67% 59% 85% 78% 79% 76%
Own 3% 4% 9% 6% 7% 5%
Homeless 26% 27% 4% 7% 11% 11%
Living Temporarily with Family/Friends 1% 8% 1% 5% 1% 5%
Other 2% 2% 1% 3% 1% 3%
Total Responding (n) 361 265 766 946 1,127 1,206
53
Total is less than 100 percent because of rounding error. 54
Total is less than 100 percent because of rounding error. 55
Total is less than 100 percent because of rounding error.
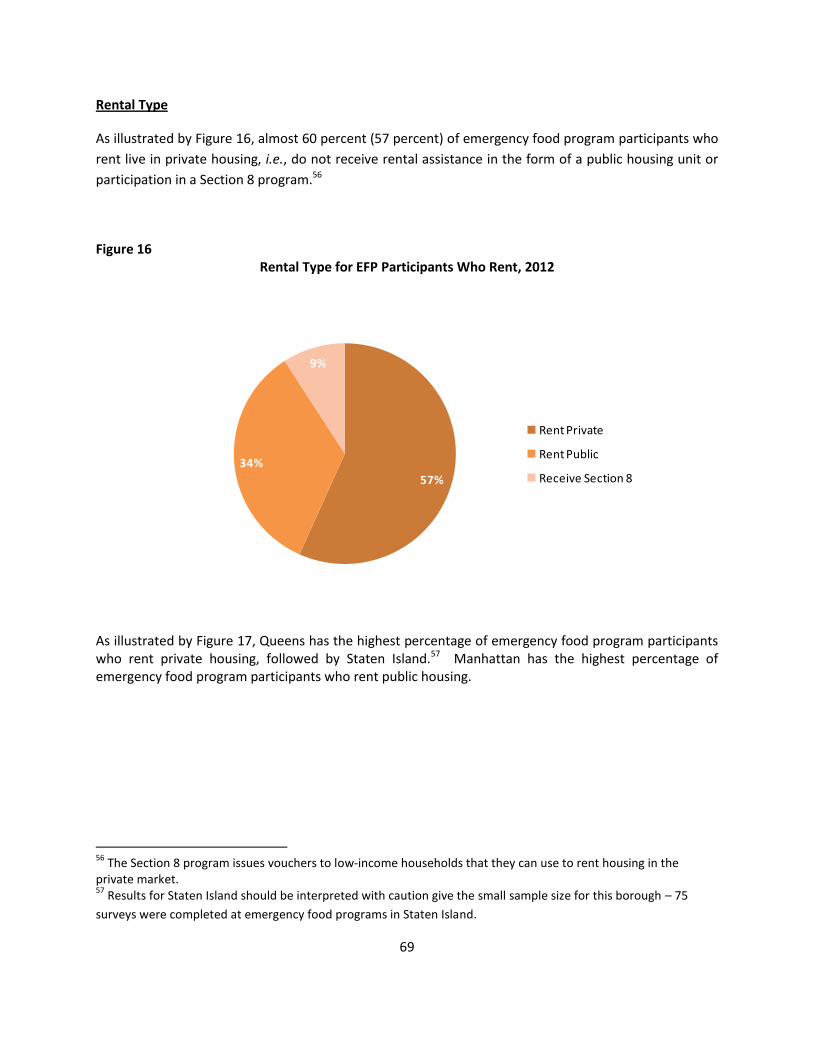
69
Rental Type
As illustrated by Figure 16, almost 60 percent (57 percent) of emergency food program participants who
rent live in private housing, i.e., do not receive rental assistance in the form of a public housing unit or
participation in a Section 8 program.56
Figure 16 Rental Type for EFP Participants Who Rent, 2012
57%
34%
9%
Rent Private
Rent Public
Receive Section 8
As illustrated by Figure 17, Queens has the highest percentage of emergency food program participants who rent private housing, followed by Staten Island.57 Manhattan has the highest percentage of emergency food program participants who rent public housing.
56
The Section 8 program issues vouchers to low-income households that they can use to rent housing in the private market. 57
Results for Staten Island should be interpreted with caution give the small sample size for this borough – 75
surveys were completed at emergency food programs in Staten Island.
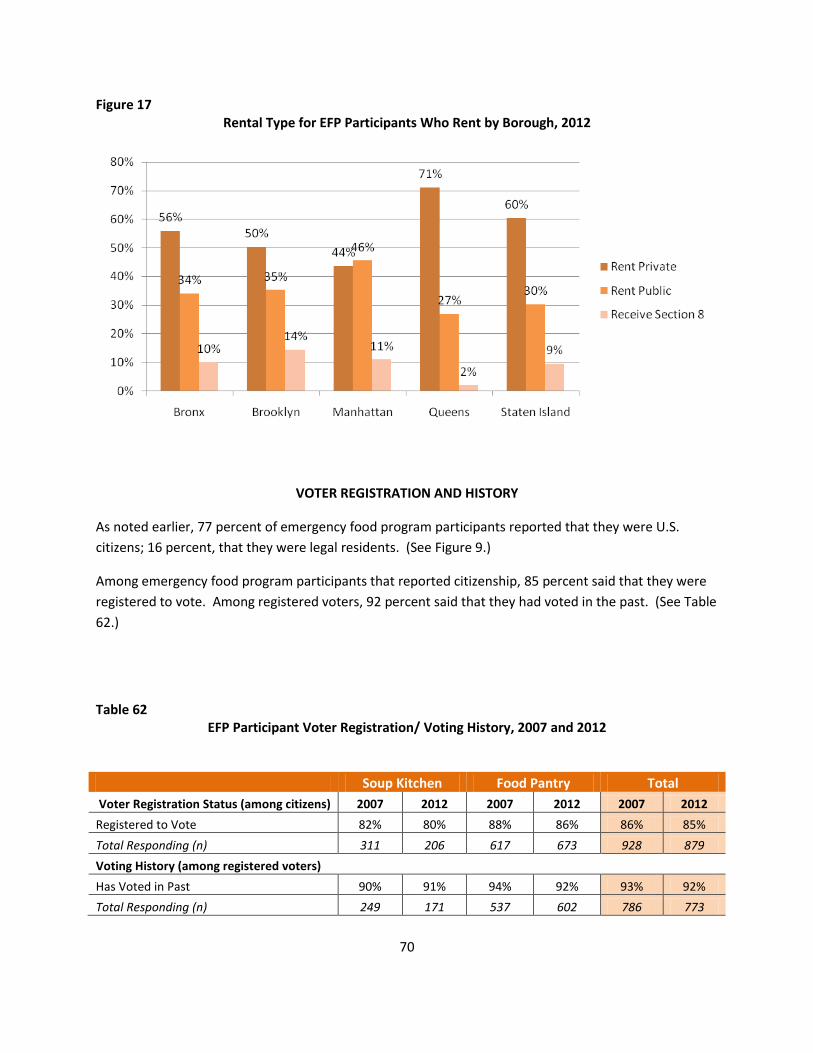
70
Figure 17 Rental Type for EFP Participants Who Rent by Borough, 2012
VOTER REGISTRATION AND HISTORY
As noted earlier, 77 percent of emergency food program participants reported that they were U.S.
citizens; 16 percent, that they were legal residents. (See Figure 9.)
Among emergency food program participants that reported citizenship, 85 percent said that they were
registered to vote. Among registered voters, 92 percent said that they had voted in the past. (See Table
62.)
Table 62
EFP Participant Voter Registration/ Voting History, 2007 and 2012
Soup Kitchen Food Pantry Total
Voter Registration Status (among citizens) 2007 2012 2007 2012 2007 2012
Registered to Vote 82% 80% 88% 86% 86% 85%
Total Responding (n) 311 206 617 673 928 879
Voting History (among registered voters)
Has Voted in Past 90% 91% 94% 92% 93% 92%
Total Responding (n) 249 171 537 602 786 773
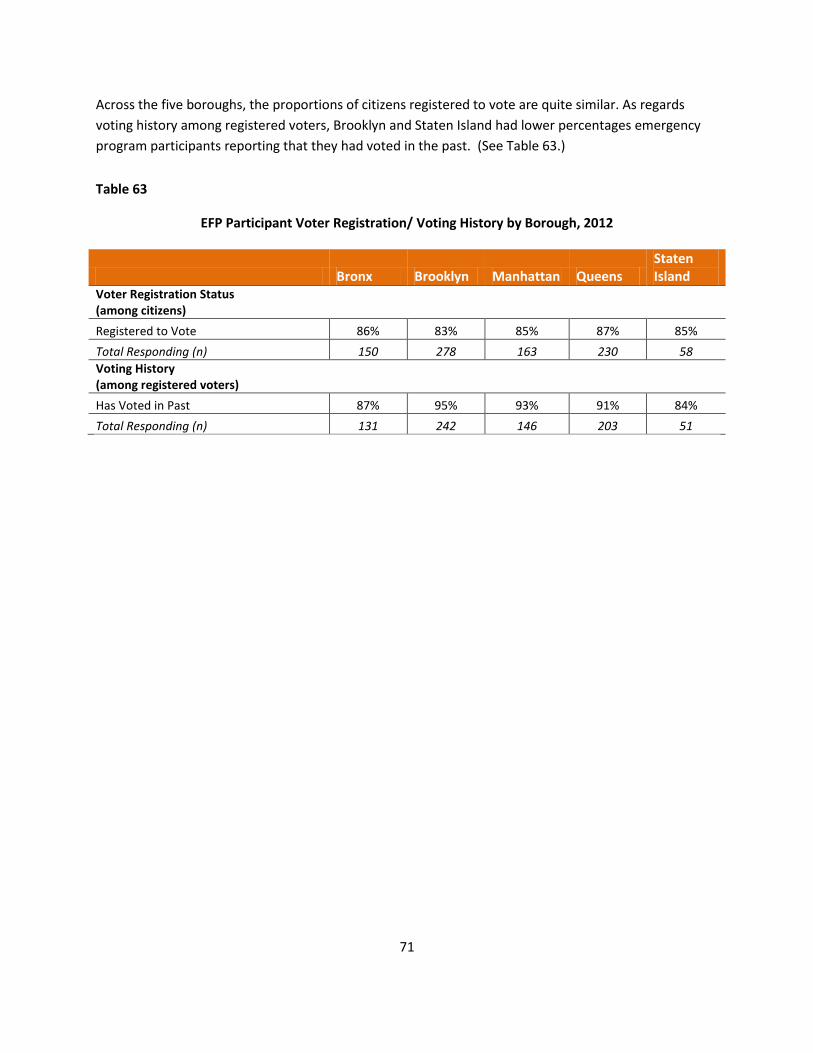
71
Across the five boroughs, the proportions of citizens registered to vote are quite similar. As regards
voting history among registered voters, Brooklyn and Staten Island had lower percentages emergency
program participants reporting that they had voted in the past. (See Table 63.)
Table 63
EFP Participant Voter Registration/ Voting History by Borough, 2012
Bronx Brooklyn Manhattan Queens Staten Island
Voter Registration Status (among citizens)
Registered to Vote 86% 83% 85% 87% 85%
Total Responding (n) 150 278 163 230 58
Voting History (among registered voters)
Has Voted in Past 87% 95% 93% 91% 84%
Total Responding (n) 131 242 146 203 51
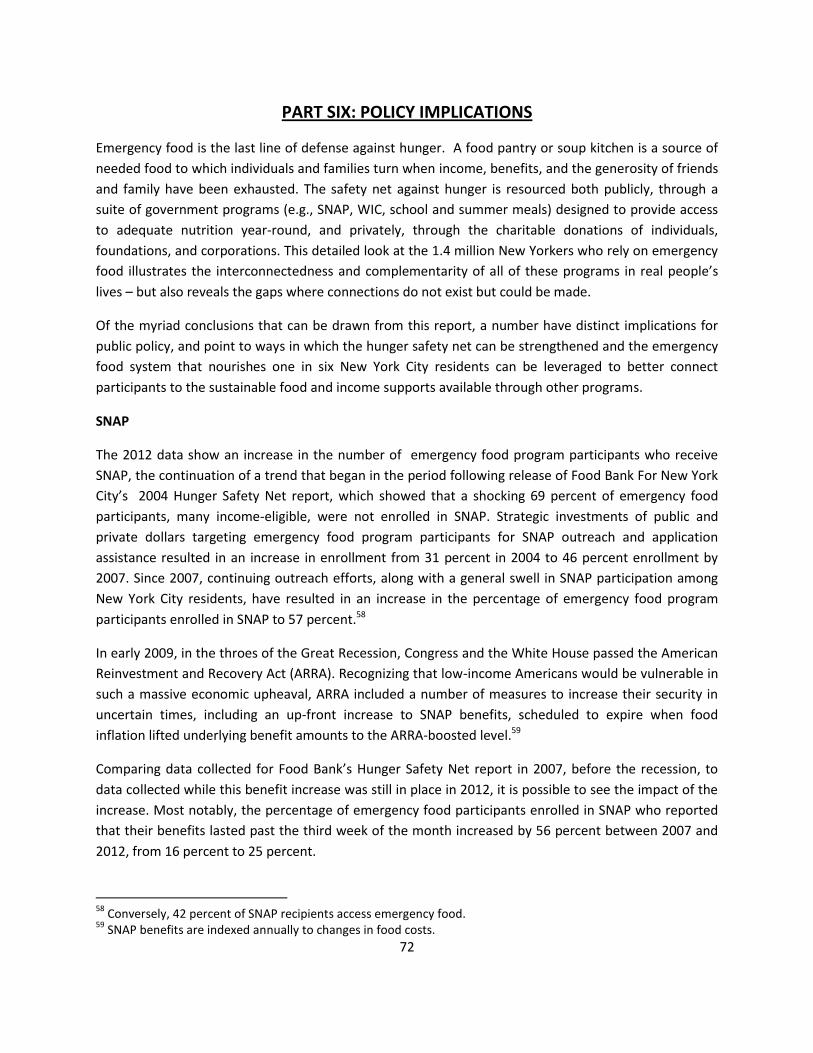
72
PART SIX: POLICY IMPLICATIONS
Emergency food is the last line of defense against hunger. A food pantry or soup kitchen is a source of
needed food to which individuals and families turn when income, benefits, and the generosity of friends
and family have been exhausted. The safety net against hunger is resourced both publicly, through a
suite of government programs (e.g., SNAP, WIC, school and summer meals) designed to provide access
to adequate nutrition year-round, and privately, through the charitable donations of individuals,
foundations, and corporations. This detailed look at the 1.4 million New Yorkers who rely on emergency
food illustrates the interconnectedness and complementarity of all of these programs in real people’s
lives – but also reveals the gaps where connections do not exist but could be made.
Of the myriad conclusions that can be drawn from this report, a number have distinct implications for
public policy, and point to ways in which the hunger safety net can be strengthened and the emergency
food system that nourishes one in six New York City residents can be leveraged to better connect
participants to the sustainable food and income supports available through other programs.
SNAP
The 2012 data show an increase in the number of emergency food program participants who receive
SNAP, the continuation of a trend that began in the period following release of Food Bank For New York
City’s 2004 Hunger Safety Net report, which showed that a shocking 69 percent of emergency food
participants, many income-eligible, were not enrolled in SNAP. Strategic investments of public and
private dollars targeting emergency food program participants for SNAP outreach and application
assistance resulted in an increase in enrollment from 31 percent in 2004 to 46 percent enrollment by
2007. Since 2007, continuing outreach efforts, along with a general swell in SNAP participation among
New York City residents, have resulted in an increase in the percentage of emergency food program
participants enrolled in SNAP to 57 percent.58
In early 2009, in the throes of the Great Recession, Congress and the White House passed the American
Reinvestment and Recovery Act (ARRA). Recognizing that low-income Americans would be vulnerable in
such a massive economic upheaval, ARRA included a number of measures to increase their security in
uncertain times, including an up-front increase to SNAP benefits, scheduled to expire when food
inflation lifted underlying benefit amounts to the ARRA-boosted level.59
Comparing data collected for Food Bank’s Hunger Safety Net report in 2007, before the recession, to
data collected while this benefit increase was still in place in 2012, it is possible to see the impact of the
increase. Most notably, the percentage of emergency food participants enrolled in SNAP who reported
that their benefits lasted past the third week of the month increased by 56 percent between 2007 and
2012, from 16 percent to 25 percent.
58
Conversely, 42 percent of SNAP recipients access emergency food. 59
SNAP benefits are indexed annually to changes in food costs.
73
Benefit adequacy remains an issue, particularly in New York City, where the cost of food and the rate of
food inflation routinely exceed national averages. 2012 data show that most emergency food
participants who receive SNAP receive a household allotment of $200 or less for food for the month. In a
city where food-secure households spend nearly three dollars per person per meal,60 these benefits are
hardly generous. Nevertheless, in light of the heightened need and numerous emergency food program
closures that took place during the recession, this finding offers both a measure of hope – more
emergency food participants are receiving SNAP, and the benefits they receive are lasting longer – and a
warning: the demand placed on the emergency food system could have been far greater without this
benefit increase.
Less than two years after passing ARRA, Congress and the White House enacted a clawback of the SNAP
benefit increase included in the Act that will result in across-the-board cuts to SNAP benefits in
November 2013. The resultant loss – the equivalent of 76 million meals in New York City alone – actually
exceeds Food Bank For New York City’s annual food distribution. A promise by the White House to work
with Congress to restore the funding needed to avoid benefit losses was not fulfilled – and Congress is
considering additional cuts to SNAP benefits as part of Farm Bill deliberations.
While we will never know who the ARRA benefit increase kept off food pantry and soup kitchen lines
through the worst of the recession, we will see who is forced to join these lines by the sudden loss of
needed SNAP dollars. Washington’s SNAP-cutting strategies will leave vulnerable New Yorkers worse off
– with emergency food providers unprepared to meet additional need. Congress should instead be
looking at ways to permanently ensure that households receive adequate SNAP benefits, by changing
the basis for benefit amounts and/or by indexing benefit amounts to regional variations in the cost of
food.61
In light of looming SNAP cuts, State and City government agencies should also work to ensure that
community-based organizations offering SNAP application assistance are well versed in underutilized
deductions available to SNAP applicants (e.g., expenses related to dependent care and medical care) to
ensure households receive the full SNAP allotment to which they are entitled. In addition, public and
private players in the emergency food system must redouble their efforts to ensure that emergency
food participants and members of their households are effectively connected not only to SNAP, but to
any other nutrition assistance programs to which they might be entitled.
Child Nutrition Programs
Child nutrition programs, such as school meals and the Summer Food Service Program (SFSP), remain
distressingly underutilized by households that participate in emergency food programs. In New York
60
According to research conducted by Feeding America, the average cost of a meal prepared in a food secure home in New York City is $2.94 per person – or approximately $267 per month. 61
SNAP benefits are based on the average cost of what is known as the Thrifty Food Plan, a market basket of foods designed to provide a minimum level of nutrition. Anti-hunger advocates have called for the adoption of a different market basket – the Low-Cost Food Plan – a slightly more substantial mix of foods, costing approximately 30 percent more than the Thrifty Food Plan, as the basis for SNAP benefit allotments.
74
City’s public schools, free breakfasts are available to every child, and with the elimination of the
reduced-price category in New York City’s fiscal year 2014 budget, free lunches became available to
approximately 75 percent of students. Many factors contribute to low participation in free school meals
programs – stigma among the most deleterious. That participation among emergency food program
participant households with children – arguably families with the most acute and obvious food needs –
is only 60 percent for school breakfast, and 70 percent for school lunch, suggests that a two-pronged
approach is needed: (1) directly addressing barriers to participation; and (2) targeting outreach and
education households that receive emergency food.
Successful strategies that address barriers to school meals participation are well documented. School
breakfast participation increases dramatically when breakfast is served in first-period classrooms.
Unfortunately, in New York City the norm is a cafeteria breakfast served 30 minutes before the start of
the school day – which segregates participating students (contributing to stigma) and causes scheduling
difficulties for some families. An initiative launched in 2007 by then-Schools Chancellor Joel Klein to
offer Breakfast in the Classroom (BIC) was discontinued after a target of 300 schools was reached. Some
participating schools launched the program in as few as two classrooms. It comes as little surprise, then,
that school breakfast participation among emergency food program participant households remains
essentially unchanged since 2007, when the percentage of households participating was 59 percent.
School lunch participation increases dramatically – especially among high school and middle school
students – when schools adopt universal school meals (USM).62 Young children are less sensitive to
distinctions made on the basis of income, but as students get older, their awareness of these differences
increases, and their participation in the school meals programs drops, presumably as a result of the
stigma they feel when they are singled out for this benefit. USM reverses this trend and allows all
children, no matter what their age, the opportunity to receive a nutritious, balanced lunch 180 days of
the school year without embarrassment or fear.
While the federal government covers the bulk of the cost of school lunch and breakfast programs, New
York State and/or City government could elect to cover the non-federal share of program costs,
rendering school meals free to every student. The National School Lunch Program offers a number of
provisions that, applied strategically, could maximize federal reimbursements for meal costs and
minimize the investment required of State and/or City government for implementation.
In 2012, participation by emergency food program households in SFSP stood at a dismal 33 percent. (In
2007, the comparable percentage for SFSP breakfast was 31 percent; and for SFSP lunch, 37 percent.)
One barrier to participation in SFSP is lack of knowledge about the program opportunity among
households that receive emergency food. Lack of awareness is also a barrier to participation in WIC.
Much as SNAP outreach strategies were crafted to target emergency food participants once low levels of
enrollment were discovered, the relatively low levels of participation among emergency food program
participant households across the range of child nutrition programs calls for a similar strategy. The data
62
Community Eligibility: Making High-Poverty Schools Hunger Free. Food Research and Action Center, 2013.
75
show that SNAP outreach among emergency food participants has worked to increase participation
rates, and it can serve as a model for a thoughtful, targeted strategy to increase participation in child
nutrition programs as well.
Emergency Food
While SNAP and child nutrition programs can help keep food-impoverished families off food pantry and
soup kitchen lines, this report clearly shows that for many of the 1.4 million New Yorkers who rely on
emergency food, a food pantry or soup kitchen is part of a multi-pronged strategy to put food on the
table – at least at current participation levels and benefit amounts.
Importantly, more than half of emergency food program participants identify emergency food as their
main source of produce, and for nearly half, it is also their main source of protein. This speaks at once
both to the tremendous efforts expended over several years to improve the nutritional quality of
emergency food, and to how costly these products can be, relative to other foods at neighborhood
supermarkets, grocery stores and bodegas.
Approximately one in five emergency food participants in New York City has already been turned away
from a food pantry or soup kitchen at some point due to lack of sufficient food. Emergency food
providers already ration existing food supplies, providing, on average, 5.8 meals per pantry bag rather
than the standard of nine meals per person; despite rationing, more than 60 percent of food pantries
and soup kitchens are experiencing food shortages.63 In light of looming SNAP cuts, protecting – and
bolstering – the emergency food supply ought to be every policymaker’s imperative.
63
Serving Under Stress Post Recession: The State of Food Pantries and Soup Kitchens Today. Food Bank For New York City. 2012.
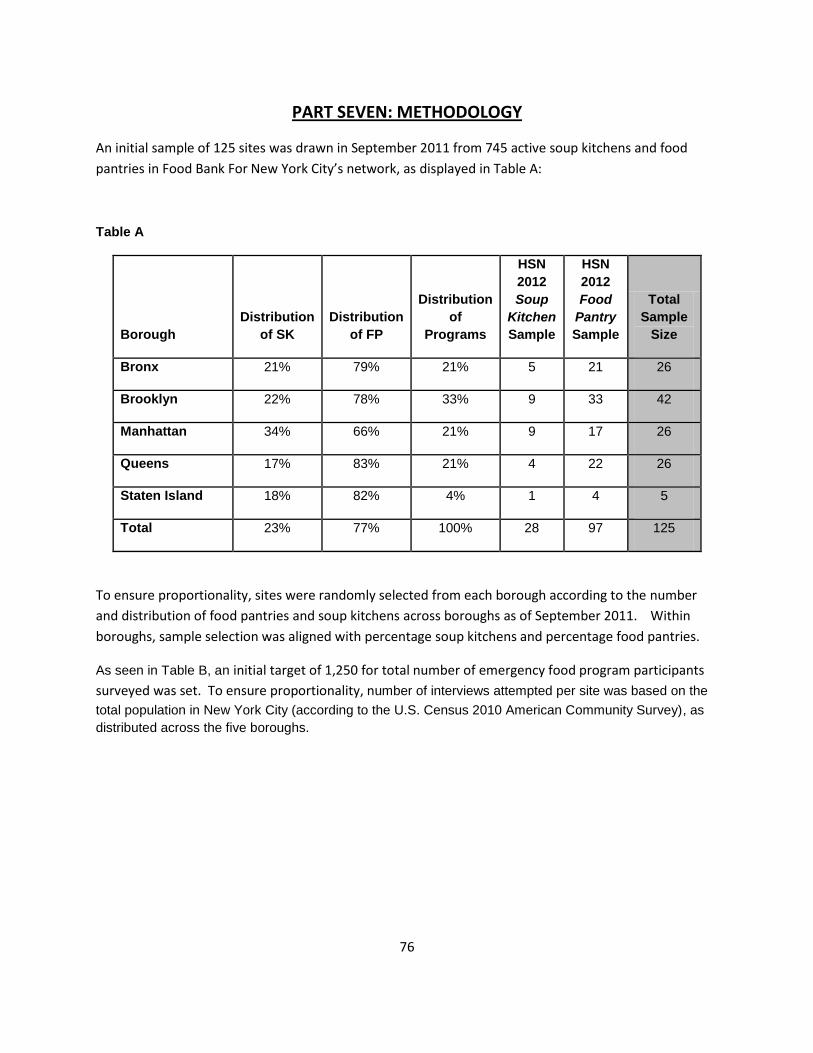
76
PART SEVEN: METHODOLOGY
An initial sample of 125 sites was drawn in September 2011 from 745 active soup kitchens and food
pantries in Food Bank For New York City’s network, as displayed in Table A:
Table A
Borough
Distribution
of SK
Distribution
of FP
Distribution
of
Programs
HSN
2012
Soup
Kitchen
Sample
HSN
2012
Food
Pantry
Sample
Total
Sample
Size
Bronx 21% 79% 21% 5 21 26
Brooklyn 22% 78% 33% 9 33 42
Manhattan 34% 66% 21% 9 17 26
Queens 17% 83% 21% 4 22 26
Staten Island 18% 82% 4% 1 4 5
Total 23% 77% 100% 28 97 125
To ensure proportionality, sites were randomly selected from each borough according to the number
and distribution of food pantries and soup kitchens across boroughs as of September 2011. Within
boroughs, sample selection was aligned with percentage soup kitchens and percentage food pantries.
As seen in Table B, an initial target of 1,250 for total number of emergency food program participants
surveyed was set. To ensure proportionality, number of interviews attempted per site was based on the
total population in New York City (according to the U.S. Census 2010 American Community Survey), as
distributed across the five boroughs.
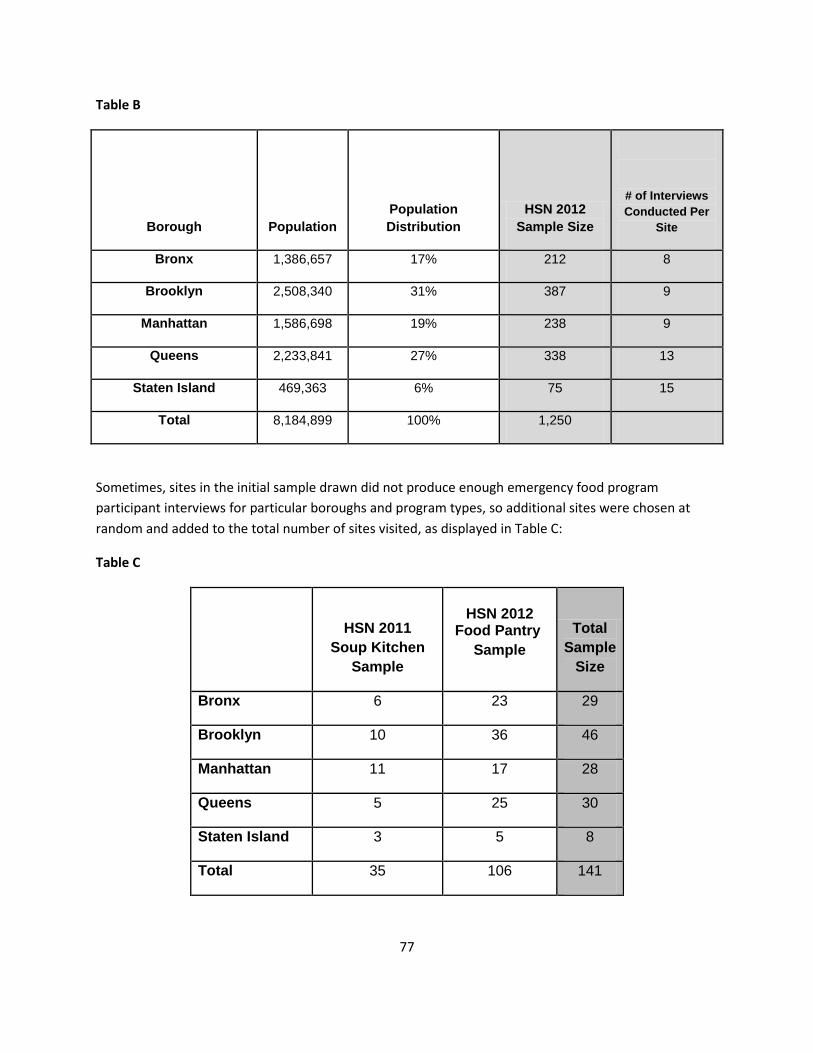
77
Table B
Borough Population
Population
Distribution
HSN 2012
Sample Size
# of Interviews
Conducted Per
Site
Bronx 1,386,657 17% 212 8
Brooklyn 2,508,340 31% 387 9
Manhattan 1,586,698 19% 238 9
Queens 2,233,841 27% 338 13
Staten Island 469,363 6% 75 15
Total 8,184,899 100% 1,250
Sometimes, sites in the initial sample drawn did not produce enough emergency food program
participant interviews for particular boroughs and program types, so additional sites were chosen at
random and added to the total number of sites visited, as displayed in Table C:
Table C
HSN 2011
Soup Kitchen
Sample
HSN 2012
Food Pantry
Sample
Total
Sample
Size
Bronx 6 23 29
Brooklyn 10 36 46
Manhattan 11 17 28
Queens 5 25 30
Staten Island 3 5 8
Total 35 106 141
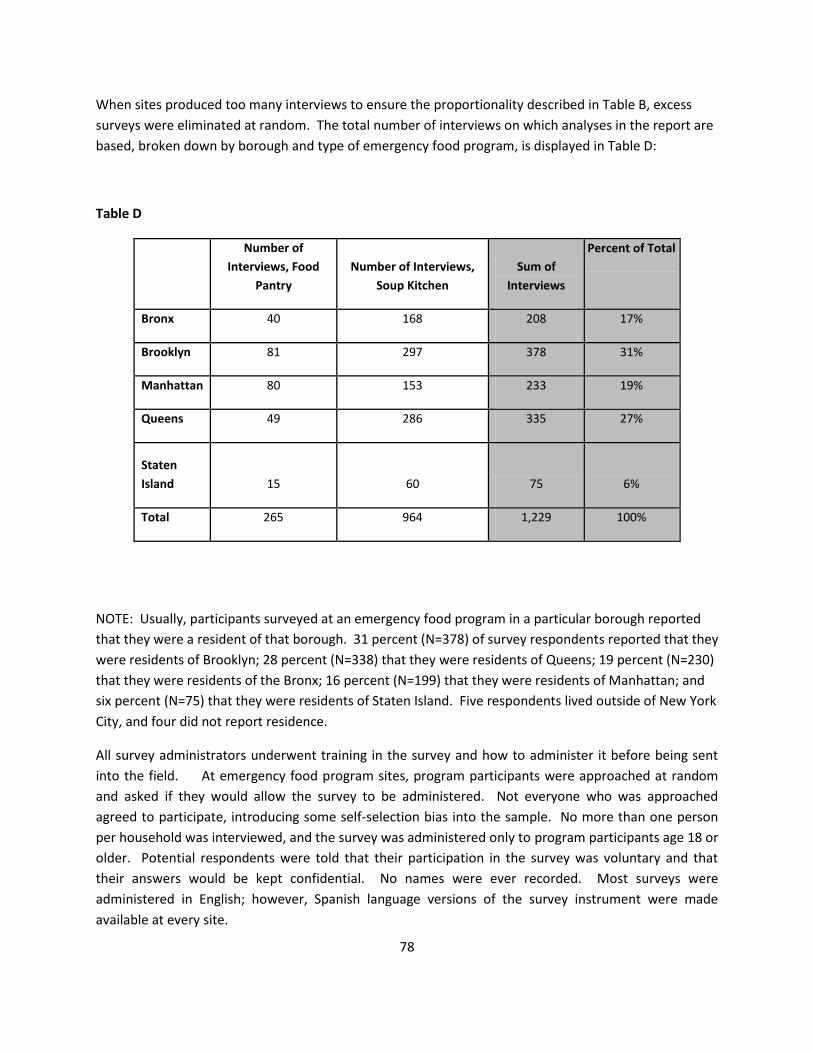
78
When sites produced too many interviews to ensure the proportionality described in Table B, excess
surveys were eliminated at random. The total number of interviews on which analyses in the report are
based, broken down by borough and type of emergency food program, is displayed in Table D:
Table D
Number of
Interviews, Food
Pantry
Number of Interviews,
Soup Kitchen
Sum of
Interviews
Percent of Total
Bronx 40 168 208 17%
Brooklyn 81 297 378 31%
Manhattan 80 153 233 19%
Queens 49 286 335 27%
Staten
Island 15 60 75
6%
Total 265 964 1,229 100%
NOTE: Usually, participants surveyed at an emergency food program in a particular borough reported
that they were a resident of that borough. 31 percent (N=378) of survey respondents reported that they
were residents of Brooklyn; 28 percent (N=338) that they were residents of Queens; 19 percent (N=230)
that they were residents of the Bronx; 16 percent (N=199) that they were residents of Manhattan; and
six percent (N=75) that they were residents of Staten Island. Five respondents lived outside of New York
City, and four did not report residence.
All survey administrators underwent training in the survey and how to administer it before being sent
into the field. At emergency food program sites, program participants were approached at random
and asked if they would allow the survey to be administered. Not everyone who was approached
agreed to participate, introducing some self-selection bias into the sample. No more than one person
per household was interviewed, and the survey was administered only to program participants age 18 or
older. Potential respondents were told that their participation in the survey was voluntary and that
their answers would be kept confidential. No names were ever recorded. Most surveys were
administered in English; however, Spanish language versions of the survey instrument were made
available at every site.