Embed Size (px)
Citation preview

Prepared by BRE on behalf of the Department of Energy and Climate Change
December 2013
BRE report number 283078
Report 2: Mean household temperatures

The EFUS has been undertaken by BRE on behalf of the Department of Energy and Climate Change (DECC).
Report editors and lead authors: Jack Hulme, Adele Beaumont and Claire Summers.
Project directed by: John Riley and Jack Hulme.
Data manager: Mike Kay.
Supporting authors and analysts: Mike Kay, Busola Siyanbola, Tad Nowak, Peter Iles, Andrew Gemmell, John Hart, John Henderson, Afi Adjei, Lorna Hamilton, Caroline Buchanan, Helen Garrett, Charlotte Turner, Sharon Monahan, Janet Utley, Sara Coward, Vicky Yan & Matt Custard.
Additional thanks to the wider team of reviewers and contributors at BRE, DECC and elsewhere, including GfK NOP Social Research, Gemini Data Loggers, Consumer Futures, G4S, Eon, British Gas, and for the input of the Project Steering Group and Peer Reviewers.
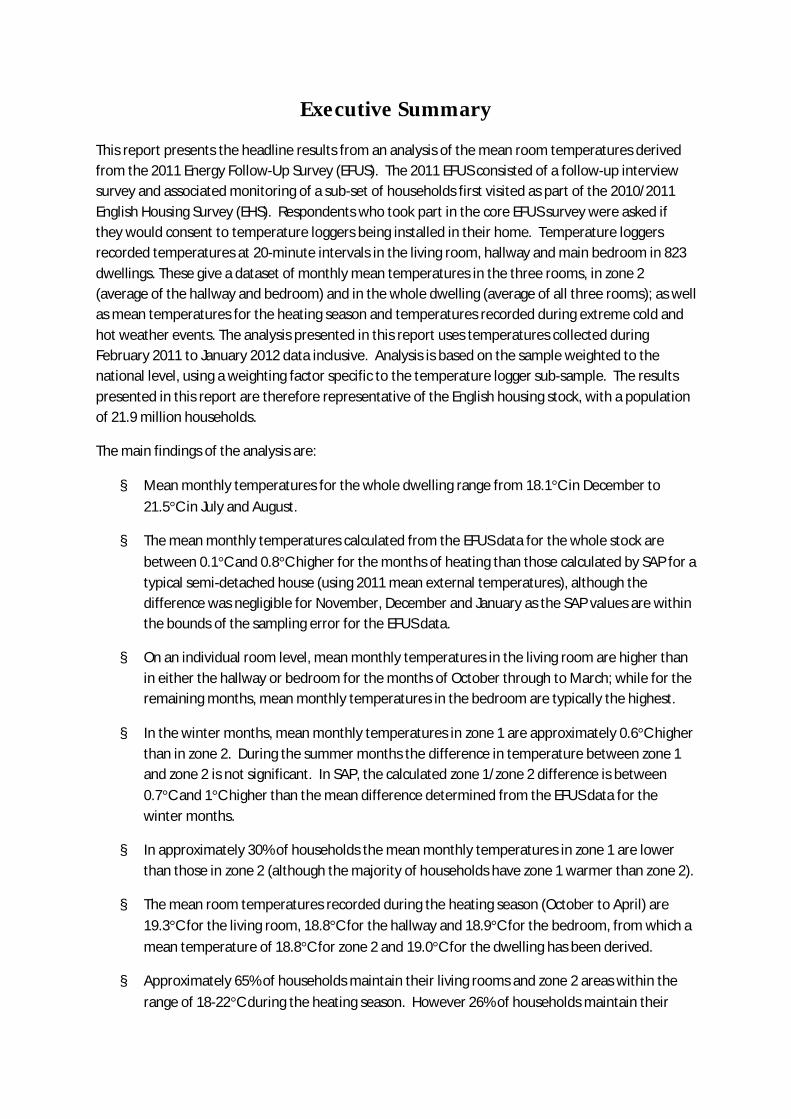
Executive Summary
This report presents the headline results from an analysis of the mean room temperatures derived from the 2011 Energy Follow-Up Survey (EFUS). The 2011 EFUS consisted of a follow-up interview survey and associated monitoring of a sub-set of households first visited as part of the 2010/2011 English Housing Survey (EHS). Respondents who took part in the core EFUS survey were asked if they would consent to temperature loggers being installed in their home. Temperature loggers recorded temperatures at 20-minute intervals in the living room, hallway and main bedroom in 823 dwellings. These give a dataset of monthly mean temperatures in the three rooms, in zone 2 (average of the hallway and bedroom) and in the whole dwelling (average of all three rooms); as well as mean temperatures for the heating season and temperatures recorded during extreme cold and hot weather events. The analysis presented in this report uses temperatures collected during February 2011 to January 2012 data inclusive. Analysis is based on the sample weighted to the national level, using a weighting factor specific to the temperature logger sub-sample. The results presented in this report are therefore representative of the English housing stock, with a population of 21.9 million households.
The main findings of the analysis are:
§ Mean monthly temperatures for the whole dwelling range from 18.1°C in December to 21.5°C in July and August.
§ The mean monthly temperatures calculated from the EFUS data for the whole stock are between 0.1°C and 0.8°C higher for the months of heating than those calculated by SAP for a typical semi-detached house (using 2011 mean external temperatures), although the difference was negligible for November, December and January as the SAP values are within the bounds of the sampling error for the EFUS data.
§ On an individual room level, mean monthly temperatures in the living room are higher than in either the hallway or bedroom for the months of October through to March; while for the remaining months, mean monthly temperatures in the bedroom are typically the highest.
§ In the winter months, mean monthly temperatures in zone 1 are approximately 0.6°C higher than in zone 2. During the summer months the difference in temperature between zone 1 and zone 2 is not significant. In SAP, the calculated zone 1/zone 2 difference is between 0.7°C and 1°C higher than the mean difference determined from the EFUS data for the winter months.
§ In approximately 30% of households the mean monthly temperatures in zone 1 are lower than those in zone 2 (although the majority of households have zone 1 warmer than zone 2).
§ The mean room temperatures recorded during the heating season (October to April) are 19.3°C for the living room, 18.8°C for the hallway and 18.9°C for the bedroom, from which a mean temperature of 18.8°C for zone 2 and 19.0°C for the dwelling has been derived.
§ Approximately 65% of households maintain their living rooms and zone 2 areas within the range of 18-22°C during the heating season. However 26% of households maintain their

living rooms at temperatures below 18°C, while a further 7% of households heat their living rooms to temperatures at or above 22°C.
§ There are no statistically significant differences between weekday and weekend day mean heating season temperatures in the living room, bedroom, zone 2 or the dwelling as a whole.
§ The variations in mean heating season temperatures for different dwelling and household characteristics have been investigated. Dwellings that were fully double glazed, those with someone in during the day during a weekday, and those in which the occupants are not under-occupying have both living room and zone 2 mean heating season temperatures that are significantly higher than their alternative category.
§ Other significant differences that could be seen include dwellings built pre-1919 having lower mean heating season temperatures in both zones than dwellings built between 1945 and 1990; dwellings with a floor area <50m2 having higher mean heating season temperatures in both zones than the largest dwellings with floor areas >140m2; owner-occupied dwellings having lower living room and zone 2 mean heating season temperatures than local authority or RSL dwellings and dwellings in which the Household Reference Person (HRP) is older than 75 years having higher living room and zone 2 mean heating season temperatures than dwellings with the HRP aged between 45-64 years.
§ Some groups of dwellings have significant differences in the mean heating season temperatures in one or other of the zones but not both:
o Flats are seen to have higher living room mean heating season temperatures than detached or semi-detached dwellings but no difference is seen between dwelling types for zone 2 mean heating season temperatures.
o Dwellings in rural locations tend to have lower zone 2 mean heating season temperatures than those in urban areas and dwellings in London tend to have higher zone 2 mean heating season temperatures than dwellings in the North West and Yorkshire and Humber regions but no differences are seen between the living room mean heating season temperatures for either characteristic.
o Dwellings with no insulation measures have lower living room mean heating season temperatures than dwellings with at least one or more insulation measure, but no differences are seen in the zone 2 mean heating season temperatures for this characteristic.
o Households with a pensioner living in the dwelling typically have higher living room mean heating season temperatures than households without a pensioner present; similarly households with one or more persons retired have higher living room mean heating season temperatures than households with one or more persons working full time. No differences in the mean heating season temperatures in zone 2 are seen for any of these groups.
§ For some groups there are no significant (or very small) differences in mean heating season temperatures: these are centrally heated versus non-centrally heated dwellings, dwellings using different fuels for their main heating; cavity insulated walls versus non-insulated walls,
differing levels of loft insulation, households of differing sizes, households with and without children present, households in all income quintiles and households in fuel poverty under the Low Income High Costs (LIHC) indicator.
§ The coldest days over most of the country were a period at the end of January 2011 and a period at the beginning of March 2011. Analysis of the EFUS data shows that temperatures collected during the January cold period are significantly lower than the average heating season temperature in all rooms. However the difference significance is not apparent for all rooms during the March period.
§ The hottest conditions occurred across most of the country on the 26-27 June 2011. Temperatures recorded in the dwellings during the hot spell are significantly higher than the summer average.
The key implications for the energy modelling methodologies of SAP/BREDEM are as follows:
§ The typical difference in the zone 1/zone 2 mean temperature calculated in the models may be an over-estimate. The results from the temperature monitoring suggest that zone 2 temperatures may be closer to the zone 1 temperatures than currently predicted by these models. Additional work in this area, however, required to fully understand what might cause these differences.
§ The difference between weekday/weekend day mean dwelling temperatures currently implemented in SAP may not be necessary. This supports the results presented in the Main Heating report, in that householders report little change in the number of hours that their heating is on between weekdays and weekends.
§ The monthly mean dwelling temperatures recorded during the EFUS 2011 match relatively well with the values calculated in SAP. The EFUS provides evidence for higher temperatures in summer compared to those used in SAP (due to a cap set in SAP) which, although not relevant to heating costs, may have implications for cooling costs in the future.

Table of Contents 1 Introduction .............................................................................................................................. 1
2 Methodology ............................................................................................................................. 3
2.1 Data quality........................................................................................................................ 5
2.2 Weighting factors ............................................................................................................... 5
2.3 Temperature definitions..................................................................................................... 5
2.4 Outliers in the recorded temperatures ............................................................................... 5
2.5 Calculating confidence intervals ......................................................................................... 6
3 Findings ..................................................................................................................................... 7
3.1 Weather conditions during the survey ................................................................................ 7
3.2 Summary of monthly mean room temperatures................................................................. 8
3.2.1 Dwelling average ........................................................................................................ 8
3.2.2 Room comparisons ..................................................................................................... 9
3.2.3 Zone 2 ...................................................................................................................... 15
3.3 Summary of mean room temperatures over a nominal heating season ............................ 19
3.3.1 Weekdays and weekend days ................................................................................... 20
3.4 Variation of mean heating season temperatures by dwelling and
household characteristics ................................................................................................. 20
3.5 Summary of temperatures achieved during extreme external conditions ......................... 27
4 Conclusions ............................................................................................................................. 29
Glossary .......................................................................................................................................... 32
Appendix A: Summary statistics for monthly mean temperature data ............................................. 35
1. External temperature ........................................................................................................... 35
a. All days in month mean temperature (°C) ......................................................................... 35
b. Weekdays only in month mean temperature (°C) ............................................................. 35
c. Weekend days only in month mean temperature (°C) ...................................................... 35
2. Dwelling temperatures ........................................................................................................ 36
a. All days in month ............................................................................................................. 36
b. Weekdays only in month .................................................................................................. 37
c. Weekend days only in month ........................................................................................... 39
Appendix B: Scatter plots and correlation coefficients of monthly mean room temperatures (°C) .... 41

1
1 Introduction The main aim of the 2011 Energy Follow-Up Survey (EFUS) was to collect new data on domestic energy use, in order to update the current modelling assumptions about how energy is used in the home, and to inform energy efficiency policy. The 2011 EFUS consisted of a follow-up interview survey of a sub-set of households first visited as part of the 2010/2011 English Housing Survey (EHS). Additionally, sub-samples of these households were selected to have temperature loggers and electricity consumption monitors installed. A further stage of the EFUS was the compilation of gas and electricity consumption data from meter readings.
This report focuses specifically on the analysis of the mean dwelling temperatures derived from the temperature monitoring data. Analysis is based on the temperature logger sub-sample weighted to the national level, using a weighting factor specific to the temperature logger sub-sample. The results presented in this report are therefore representative of the English housing stock, with a population of 21.9 million households.
The outcomes of this analysis will be used to inform and update assumptions within BREDEM and SAP, and to inform energy efficiency policy.
The primary energy modelling techniques used in the UK are the BRE Domestic Energy Model (BREDEM), and its derivative the Standard Assessment Procedure (SAP) 1. These methodologies are extensively used to predict the annual energy consumption in dwellings; BREDEM includes estimates for space and water heating, lighting, electrical appliances and cooking energy use; whereas SAP includes space and water heating and lighting energy use. CO2 emissions can be deduced directly from energy use, and the prediction of housing-related CO2 emissions through to 2050 will continue to rely heavily on the SAP and BREDEM methodologies. The key component of these models is the space heating equation. The calculation of this equation depends on the mean internal temperature, the mean useful gains, the specific heat loss for the dwelling and the mean external temperature. A two-zone model is used for space heating, zone 1 representing the living area, and zone 2 representing the rest of the house. The space heating equation is applied separately to each zone, taking into account the transfer of heat between the zones. In BREDEM, the mean internal temperature in each zone is calculated using geometrical relationships based on an idealised temperature time graph, in which a dwelling is heated to a ‘demand temperature’ and, when the heating is off, the temperature falls back to (or near to) the ‘background temperature’. The calculation of the ‘mean internal temperature’ is a function of the heating pattern and depends on the time taken for the dwelling temperature to fall from the demand temperature to the background temperature.
In BREDEM the usual value for the zone 1 demand temperature is 21°C, although any other figure may be entered if this value is believed to be more appropriate. The demand temperature in zone 2 is not precisely defined. Typically, the zone 2 demand temperature is 3°C lower than that in zone 1; however in practice, BREDEM assumes imperfect control in zone 2 so the actual demand temperature is higher than the design demand temperature. The background temperature depends on the heating system because an unresponsive heating system (e.g. an old, large-volume storage
1 Details of SAP can be found in the SAP 2009 Specification. DECC/BRE, 2011. Details of BREDEM can be found in the BREDEM 2012 Technical Specification, Henderson, J & Hart, J. BRE, 2013.

2
heater) will continue to output heat outside the heating period. Because of the different demand temperatures in each zone, this will typically lead to different background temperatures in each zone. For a fully responsive heating system, e.g. a gas boiler with radiators, the background temperature is equal to the external temperature plus the temperature rise resulting from useful gains, and is the same for both zones.
A key component of this analysis process has been the linkage of the EFUS data to key dwelling and household descriptor variables collected in the interview and physical survey components of the 2010 English Housing Survey (EHS). In this report, and the majority of the companion reports in this EFUS series, simple bivariate comparisons between the variable under consideration and individual descriptor variables have been performed in order to provide preliminary results and identify bivariate trends. It should be recognised, however, that subsequent investigations using more sophisticated statistical analysis may assist in the interpretation of results.
Other reports in this series cover the analysis of additional data derived from the temperature monitoring data, specifically the details of heating patterns and achieved temperatures can be found in the Main Heating Systems report, and an analysis of the risk posed from overheating can be found in the Thermal Comfort and Overheating report.

3
2 Methodology A summary of the methodology of particular relevance to this report is provided below. Additional details, including the full interview questionnaire, can be found in the Methodology report.
The EFUS 2011 interview survey was undertaken by interviewers from GfK NOP between December 2010 and April 2011. A total of 2,616 interviews were completed, drawn from a sample from the 2010/11 English Housing Survey (EHS). Ahead of the interview fieldwork, all interviewers were assigned a batch of temperature loggers which they attempted to install during the course of their interviews. They also received training on installing the loggers appropriately. During the EFUS interview survey householders were asked if they would like to take part in the temperature monitoring component. Those that expressed interest then had temperature monitors installed by the interviewer (if the interviewer had not already exhausted their allocation of loggers). Of the 2,616 households interviewed, 943 households received temperature loggers. Up to three temperature loggers were to be placed in the main bedroom, hallway and living room of these households. These rooms were selected as they represent the key living spaces in dwellings. There were a small number of households without all three rooms (e.g. bedsits) which received only two loggers. The interviewers were instructed to place the loggers on internal walls out of direct sunlight and away from sources of heat. The temperature loggers were programmed to record data every 20 minutes and had a capacity of over one year’s worth of data.
Loggers were installed in the dwellings during the period from December 2010 until April 2011, and householders returned the loggers to BRE in April/May 2012. A total of 118 sets of loggers failed to be returned and two sets were returned with all three loggers faulty. Thus the total number of sets of loggers adequate for analysis is 823. Of the 823 sets returned to BRE, 763 households returned three loggers, 57 households returned two, and three households returned one logger. On processing the logger outputs, it was found that 15 dwellings had one or more loggers that became faulty during the monitoring period; three dwellings had one or two loggers that failed to record from the outset and three households returned their loggers early (one in October 2011 and two in December 2011). See Table 1 for a summary.
Table 1: Summary of loggers returned and analysed
Number of households with logger installed 943 Number of households with no loggers returned/all faulty 120 No. of households with 1 or 2 loggers returned 60 No. of households with all 3 loggers returned 763
Total Households Analysed 823 Of the 823 households analysed……. % of total households
analysed All returned loggers correct 802 97.4% 1 or 2 loggers failed to record at all 3 0.4% Loggers returned early 3 0.4% 1 or more loggers became faulty during recording 15 1.8%
The temperature data was downloaded from the loggers, and processed to form key metrics, as outlined in Figure 1. Monthly mean temperatures for each household were calculated by averaging all the recorded temperatures obtained during that month; weekday means and weekend day

4
means used only the weekday and weekend recordings respectively2. Weather data was obtained from the Met Office (MIDAS dataset). The Met Office station closest to each household on the EFUS dataset was identified (75% of EFUS cases were less than 15 miles from the nearest station) and the hourly external temperatures recorded by each station were time-matched to the temperature data recorded by the loggers.
Figure 1: Key metrics resulting from processing of the temperature loggers
The dates of the hottest/coldest days were obtained by locating the days on which the highest and lowest external temperatures occurred in each year. If these values occurred multiple times during the course of the year, the date of the first instance at which the temperature occurred was used. The room temperatures for these dates were calculated as the 24-hour mean for the date specified. In the cases where a logger failed at some point during the year, the monthly average for the month has been calculated using the recordings up to the point of failure. Averages after this time were set to missing.
Only 13% of dwellings had the loggers installed in December 2010, and while the majority were installed during January 2011, 20% of dwellings were still outstanding in this month. Additionally, 2 due to the date of installation, means are calculated based on partial data for some months
Feb 2011
Jan 2012
Living RoomHall
BedroomZone 2
Alldays mean temperature
Weekdays mean temperature
Weekend days mean temperature
For every month and for ‘Heating Season’
For each room
Dwelling
(and Dec 2010, Jan 2011, Feb 2012)
Monthly means
2011Hottest day
Coldest day
(Based on mean of 24 hours)
Date
Living room mean temp
Hall mean temp
Bedroom mean temp
Dwelling mean temp(and 2010 and 2012)
Hottest/Coldest day

5
apart from those faulty or returned early, all the loggers finished recording on 10th February 2012. Therefore, the analysis presented in this report is based on the months February 2011 to January 2012; and the hottest/coldest day analysis is for 2011 only.
2.1 Data quality The quality of the data output from the loggers was generally good. For some dwellings it was noticed that for some months there were anomalous ‘spikes’ in the temperature readings, typically occurring at the same time each day for a few days, and which were presumably caused by direct sunlight hitting the logger. These were considered to have negligible effect on the calculation of the monthly averages, and no corrections were made.
2.2 Weighting factors Weighting factors specific to the sample of households that received temperature loggers were derived using logistic regression based on the profile of respondents for the Government Office Region, tenure, dwelling type and working status of household. Although the objective of the weighting factor is to provide totals that can be interpreted at the national level, readers should be aware that there may remain some uncorrected bias in the data (e.g. if the households that accepted loggers differ from the population in a way that is not visible to the weighting procedure).
2.3 Temperature definitions As described above, temperature loggers were placed in the living room, hallway and bedroom of each dwelling. In the following analysis, ‘zone 2’ temperatures refer to the mean of the hallway and bedroom temperatures and ‘dwelling’ temperatures refer to the mean of all three temperatures measured in the dwelling. For this analysis, a nominal ‘heating season’ has been taken to be the months of October to April following the responses given by household in the interview survey and identified by EFUS interview data3. Data from January 2012 has been used in this calculation, all other months being in 2011. The monthly mean temperatures reported in this work are calculated from the monthly mean temperatures for each household, averaged across all households (and weighted to the national level).
2.4 Outliers in the recorded temperatures Appendix A includes detailed tables of descriptive statistics for the mean monthly temperatures for each room and it can be seen from looking at the ‘minimum’ and ‘maximum’ values that for all the rooms, some dwellings recorded monthly mean temperatures that could be considered ‘outliers’ compared to the typical dwelling temperatures expected during the heating season e.g. minimum hallway temperatures in February 2011 of 8.8°C, maximum hallway temperatures in January 2012 of 29.4°C. A more detailed inspection of dwellings with low monthly mean temperatures recorded during the winter months shows that although there were some dwellings in which these low monthly mean temperatures were recorded in all rooms (therefore suggesting that the dwelling was not being heated), there were also dwellings in which low monthly mean temperatures were recorded in one room, while the other rooms were being heated to more typical temperatures. Similarly, for the high monthly mean temperatures, there was no obvious indication that these were not the actual temperatures being attained in the dwelling. Additionally, there was not a significant
3 See Main Heating Systems report.

6
difference between the mean and the median average temperatures, the maximum difference being 0.2°C. Therefore no procedures have been implemented to remove or adjust these outlying values as it was felt that there was no compelling evidence to do so.
2.5 Calculating confidence intervals All the confidence intervals presented in this report have been calculated using a design factor of 1.2 (see the Methodology report for further details).

7
3 Findings Below are the key headline findings from the temperature data recorded as part of the EFUS survey. An initial summary of external weather conditions during the survey gives a context to the room temperatures reported. This is followed by analysis of monthly mean temperatures for the whole dwelling, for each room, and split by a nominal zone 1 and 2. Monthly mean room temperatures within a nominal heating season are then analysed, including the variation of mean heating season temperatures by dwelling and household characteristics. Finally, mean room temperatures during extreme external temperature conditions are reported.
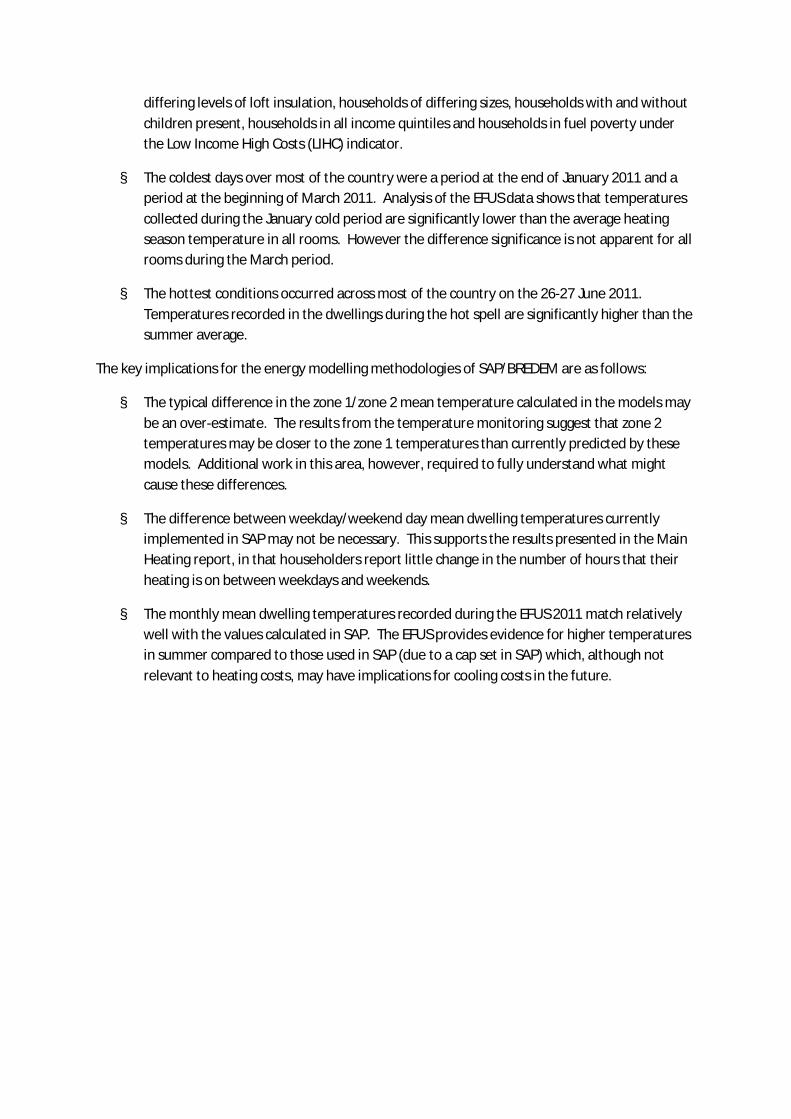
3.1 Weather conditions during the survey As discussed in the Methodology section above, monthly mean external temperatures were calculated for every dwelling using data from Met Office weather stations. The range of monthly mean temperatures is presented in Appendix A and a graph of the mean external temperatures is shown in Figure 2. The following synopsis from the Met Office UK Climate summaries4 provides the general context for the sampling period.
December 2010 was exceptionally cold across the UK with mean temperatures 5.0 °C below average (1971 to 2000 averages); chilly conditions persisted in early January 2011, before a milder spell around mid-month and then a return to colder weather. Temperatures were generally above average in February. This was followed by a warm Spring, with mean temperatures 0.6 °C above average during March, 3.7 °C above during April and 1.0 °C above in May. Summer was cool compared to average with the mean temperature near average during June, 0.7 °C below average during July and 0.6 °C below in August. Autumn 2011 was warm, with mean temperatures 1.5 °C above average in September, 2.0 °C above in October and 2.9 °C above in November. A spell of exceptionally warm weather occurred in late September and early October. Winter 2011/12 was mild, especially across southern areas. After a mostly mild January 2012, the last few days saw the onset of a cold spell that lasted two weeks with some sharp frosts and snowfalls, especially over England. Mild weather then returned until the end of February 2012.
Figure 2 also shows the long-term monthly mean external temperatures used in SAP which highlights the differences in the temperatures recorded in 2011 compared to the long-term average.
4 Summarised from information presented at http://www.metoffice.gov.uk/climate/uk/. Contains public sector information licensed under the Open Government Licence v1.0.
8
Figure 2: Monthly mean external temperatures (average over England)
Base: All households in EFUS 2011 temperature sub-sample (n=823) Source: External temperatures during EFUS 2011 obtained from Met Office (MIDAS dataset)
3.2 Summary of monthly mean room temperatures As discussed above, the results presented here are for the 12 month period from February 2011 to January 2012.
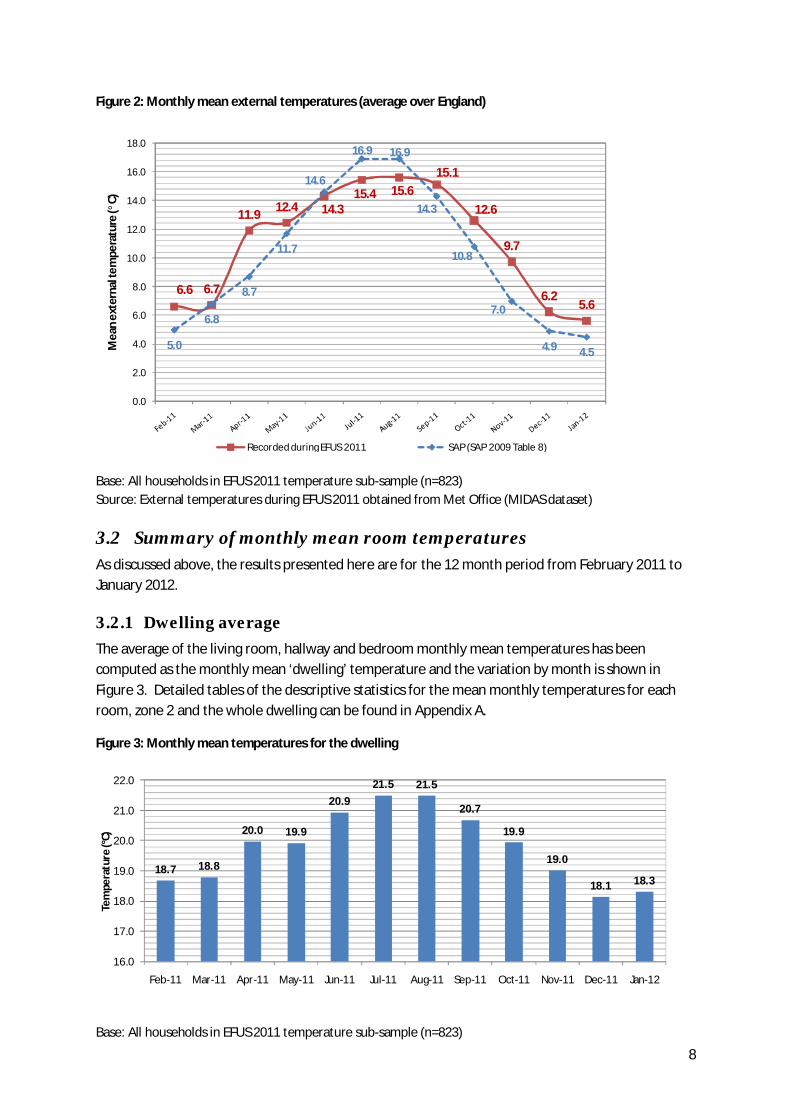
3.2.1 Dwelling average The average of the living room, hallway and bedroom monthly mean temperatures has been computed as the monthly mean ‘dwelling’ temperature and the variation by month is shown in Figure 3. Detailed tables of the descriptive statistics for the mean monthly temperatures for each room, zone 2 and the whole dwelling can be found in Appendix A.
Figure 3: Monthly mean temperatures for the dwelling
Base: All households in EFUS 2011 temperature sub-sample (n=823)
6.6 6.7
11.9 12.4 14.315.4 15.6
15.1
12.6
9.7
6.25.6
5.0
6.8
8.7
11.7
14.6
16.9 16.9
14.3
10.8
7.0
4.9 4.5
0.0
2.0
4.0
6.0
8.0
10.0
12.0
14.0
16.0
18.0
Mea
n ex
tern
al te
mpe
ratu
re (°
C)
Recorded during EFUS 2011 SAP (SAP 2009 Table 8)
18.7 18.8
20.0 19.9
20.921.5 21.5
20.7
19.9
19.0
18.1 18.3
16.0
17.0
18.0
19.0
20.0
21.0
22.0
Feb-11 Mar-11 Apr-11 May-11 Jun-11 Jul-11 Aug-11 Sep-11 Oct-11 Nov-11 Dec-11 Jan-12
Tem
pera
ture
(°C)

9
Monthly mean dwelling temperatures ranged from 18.1°C in December to 21.5°C in July and August. In SAP, the mean internal temperatures are calculated from an average of the ‘living area’ temperature and the ‘rest of dwelling’ temperature, weighted for the respective floor areas. The monthly mean internal temperatures calculated by SAP for a typical semi-detached house with stock average U-values and a typical gas heating system and a living area fraction of 0.25 are shown in Table 2. The first line in the table shows the mean internal temperatures calculated by SAP when using the long-term average external temperature. The second line shows the mean internal temperatures that would result from SAP if the SAP calculation procedure was forced to use the external temperatures recorded during the EFUS. Also shown in Table 2 are the 95% confidence intervals of the monthly mean dwelling temperatures recorded during EFUS 2011.
Table 2: Mean temperatures calculated in SAP 2009 and reported by EFUS 2011
Mean internal temperatures calculated in SAP 2009 (°C) Jan Feb Mar Apr May Jun Jul Aug Sep Oct Nov Dec Dwelling Average1 17.7 17.9 18.2 18.6 19.1 19.6 19.8 19.8 19.4 18.8 18.2 17.8 Dwelling Average2 18.0 18.2 18.3 19.1 19.3 19.5 19.6 19.6 19.6 19.2 18.7 18.1 EFUS monthly mean temperatures for the dwelling (°C)
Jan
2012 Feb
2011 Mar 2011
Apr 2011
May 2011
Jun 2011
Jul 2011
Aug 2011
Sep 2011
Oct 2011
Nov 2011
Dec 2011
EFUS dwelling average 18.3 18.7 18.8 20.0 19.9 20.9 21.5 21.5 20.7 19.9 19.0 18.1 EFUS 95% Confidence Intervals
(17.9, 18.6)
(18.3, 19.0)
(18.4, 19.1)
(19.7, 20.2)
(19.6, 20.1)
(20.7, 21.1)
(21.2, 21.7)
(21.2, 21.6)
(20.4, 20.9)
(19.6, 20.1)
(18.7, 19.3)
(17.7, 18.5)
Base: All households in EFUS 2011 temperature sub-sample (n=823) 1 Calculated using the long term average weather data (Table 8 in SAP2009) 2 Calculated using the Met office external weather data It can be seen from comparing the values in Figure 3 and Table 2 that the temperatures calculated by SAP for this stereotypical dwelling using the long-term average weather data are lower than those calculated using the EFUS data for all months, although the difference is negligible for December as the SAP values are within the bounds of the sampling error for the EFUS data. When the SAP procedure is forced to use the external temperatures recorded during the EFUS, the resulting mean internal temperatures increase compared to the original for all months except for June-August, making the difference between the SAP values and the EFUS data negligible for November, December and January but still lower (by up to 1°C) for the remaining months. It should be noted that the monthly mean summer temperatures are not appropriate for comparison because they are limited to 21°C due to the nature of SAP's heating calculation. The limitations of this comparison should also be emphasised in that the results compare a stereotypical semi-detached home for the SAP calculation against the sample of dwellings monitored in the EFUS that are representative of the dwelling stock.
3.2.2 Room comparisons The monthly mean room temperatures derived from the EFUS data for the living room, hallway and bedroom, along with the 95% confidence intervals are shown in Table 3 and Figure 4. As can be seen

10
from Figure 4, both the lowest and highest monthly mean room temperatures were found in the bedroom, where monthly mean temperatures ranged from 17.8°C in December to 21.7°C in July. Monthly mean temperatures in the living room were higher than in either the hallway or bedroom for the months of October through to March while, for the remaining months, monthly mean temperatures in the bedroom were typically the highest.
Table 3: Monthly mean room temperatures
Living Room (°C) Hallway (°C) Bedroom (°C) Mean 95% CI Mean 95% CI Mean 95% CI
Feb 2011 19.0 (18.8, 19.2) 18.5 (18.2, 18.7) 18.5 (18.2, 18.6) Mar 2011 19.0 (18.8, 19.2) 18.6 (18.3, 18.7) 18.8 (18.5, 18.9) Apr 2011 20.0 (19.8, 20.1) 19.7 (19.5, 19.8) 20.2 (20, 20.3)
May 2011 20.0 (19.8, 20.1) 19.7 (19.5, 19.8) 20.1 (19.9, 20.1) Jun 2011 20.9 (20.7, 21) 20.7 (20.6, 20.8) 21.2 (21, 21.3) Jul 2011 21.4 (21.2, 21.5) 21.3 (21.2, 21.4) 21.7 (21.6, 21.8)
Aug 2011 21.5 (21.3, 21.5) 21.3 (21.2, 21.4) 21.6 (21.5, 21.7) Sep 2011 20.8 (20.6, 20.8) 20.5 (20.4, 20.6) 20.7 (20.6, 20.8) Oct 2011 20.1 (19.9, 20.2) 19.8 (19.6, 19.9) 19.8 (19.7, 19.9) Nov 2011 19.3 (19.1, 19.5) 18.9 (18.7, 19) 18.8 (18.6, 18.9) Dec 2011 18.6 (18.3, 18.7) 18.0 (17.8, 18.2) 17.8 (17.6, 18)
Jan 2012 18.7 (18.4, 18.9) 18.2 (17.9, 18.4) 18.1 (17.8, 18.2) Base: All households in EFUS 2011 temperature sub-sample (n=823)
Figure 4: Monthly mean room temperatures and external temperature recorded during EFUS 2011
Base: All households in EFUS 2011 temperature sub-sample (n=823)
Examples of the underlying (derived) data on which these average statistics are calculated are shown in Figure 5. The first histogram shows the (weighted) percentage of monthly mean living room temperatures measured in households during January 2012, and the second histogram the same but
0.0
2.0
4.0
6.0
8.0
10.0
12.0
14.0
16.0
18.0
16.0
17.0
18.0
19.0
20.0
21.0
22.0
Mea
n ex
tern
al te
mpe
ratu
re (°
C)
Mea
n in
tern
al te
mpe
ratu
re (°
C)
Living Room HallwayBedroom External temperature (EFUS)

11
for July 2011 (note that these charts are shown with different scales for clarity). For both plots, the temperatures appear to be reasonably normally distributed, albeit with a very small positive skew and kurtosis. The histograms also provide evidence for the number of households with what could be considered ‘outlying values’, particularly for the winter months, for which there are a small number of dwellings (<1%) with average temperatures lower than 12°C and a slightly larger number of dwellings (8%) with average temperatures above 22°C.
Figure 5: Histogram of the monthly mean living room temperatures in a typical winter month (January 2012) and a typical summer month (July 2011)
Base: All households in EFUS 2011 temperature sub-sample (n=823) Figure 6 shows the monthly mean room temperatures grouped into four bands. For the winter months of December, January and February it can be seen that for all three rooms, between 1-3% of households had mean monthly temperatures below 12°C. A further 30-50% of households recorded monthly mean room temperatures between 12°C and 18°C for these same months. The proportion

12
of households with monthly mean room temperatures between 18°C and 22°C ranged from 45% in the bedroom in December to 60% in the living room in February and the proportion of households with monthly mean temperatures above this ranged from 4% to 9% in these winter months.

13
Figure 6: Distribution of monthly mean room temperatures in the living room (top), hallway (middle) and bedroom (bottom)
Base: All households in EFUS 2011 temperature sub-sample (n=823)
102030405060708090
100
Feb-
11
Mar
-11
Apr-
11
May
-11
Jun-
11
Jul-1
1
Aug-
11
Sep-
11
Oct
-11
Nov-
11
Dec-
11
Jan-
12
% o
f hou
seho
lds Living Room (°C)
22.00+
18.00 - 21.99
12.00 - 17.99
< 12.00
0102030405060708090
100
Feb-
11
Mar
-11
Apr-
11
May
-11
Jun-
11
Jul-1
1
Aug-
11
Sep-
11
Oct
-11
Nov-
11
Dec-
11
Jan-
12
% o
f hou
seho
lds Hallway (°C)
22.00+
18.00 - 21.99
12.00 - 17.99
< 12.00
102030405060708090
100
Feb-
11
Mar
-11
Apr-
11
May
-11
Jun-
11
Jul-1
1
Aug-
11
Sep-
11
Oct
-11
Nov-
11
Dec-
11
Jan-
12
% o
f hou
seho
lds Bedroom (°C)
22.00+
18.00 - 21.99
12.00 - 17.99
< 12.00

14
Figure 7 to Figure 9 show an alternative representation of the monthly mean living room, hallway and bedroom temperatures measured during the survey. The blue boxes represent the interquartile range (containing 50% of households) and the lines protruding from the box go out to the smallest and largest values. The position of the median value is also marked by the line at the centre of each box. It can be seen that for all three rooms the variation in mean monthly temperature was smaller in the summer months when, presumably, the dwelling temperatures were driven predominantly by the external temperature conditions. The extremely high monthly mean temperatures recorded in some dwellings in all three rooms during the summer months suggest that occupants of these dwellings may suffer from overheating. Approximately 1% of households recorded a monthly mean living room temperature of 25°C or higher during Jun/Jul/Aug. This issue is further discussed in the EFUS 2011 Thermal Comfort report.
Figure 7: Boxplot of the monthly mean temperatures in the living room
Base: All households in EFUS 2011 temperature sub-sample (n=823)
5
10
15
20
25
30
Tem
pera
ture
(deg
rees
C)

15
Figure 8: Boxplot of the monthly mean temperatures in the hallway
Base: All households in EFUS 2011 temperature sub-sample (n=823) Figure 9: Boxplot of the monthly mean temperatures in the bedroom
Base: All households in EFUS 2011 temperature sub-sample (n=823)
3.2.3 Zone 2 Zone 1 and zone 2 are the nomenclature used in BREDEM to describe different parts of the dwelling, where zone 1 is the main living area and zone 2 is the rest of heated area of the house. For this study, the average (mean) of the hall and bedroom temperatures has been taken as the proxy for the zone 2 temperature (although it should be noted that zone 2 covers all other heated rooms
5
10
15
20
25
30Te
mpe
ratu
re (d
egre
es C
)
5
10
15
20
25
30
Tem
pera
ture
(deg
rees
C)

16
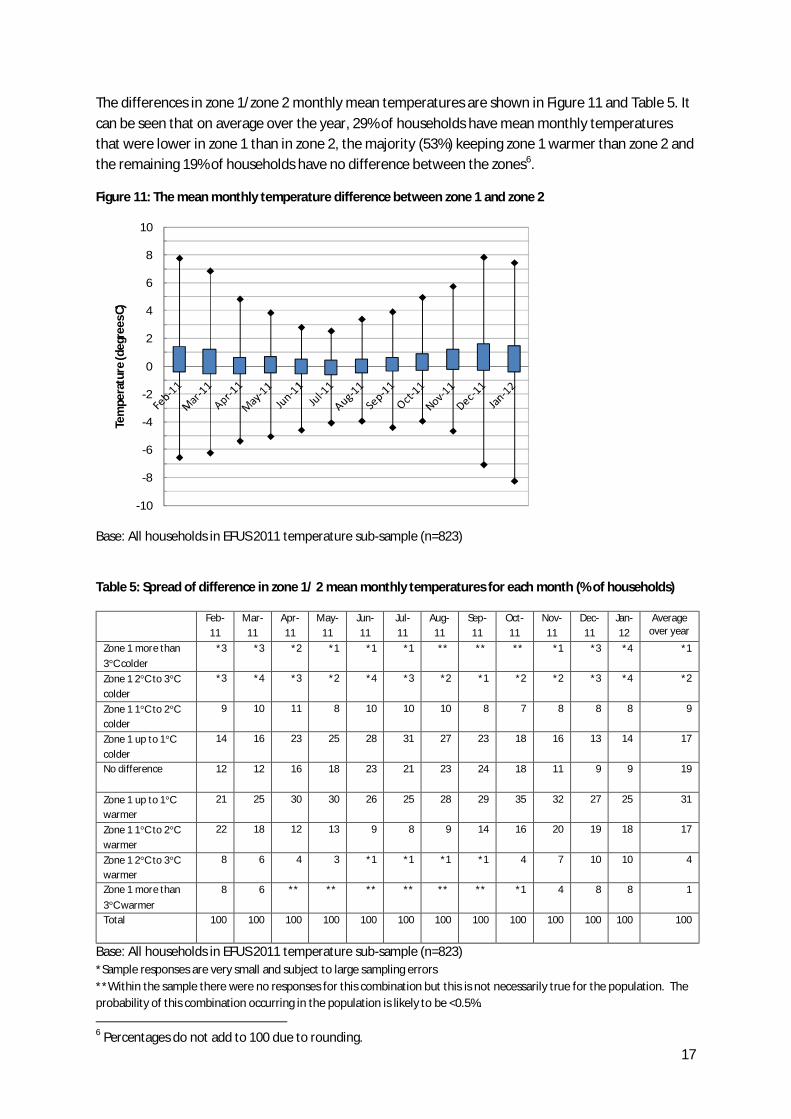
outside the main living area, rather than just the two monitored), and the living room temperature taken as the proxy for zone 1. The monthly mean temperatures for zone 2 and the 95% confidence intervals are shown in Table 4. Also shown in Table 4 is the mean monthly difference in zone 1 and zone 2 temperatures5. Comparison of the zone 1 and zone 2 temperatures for each month is shown in Figure 10 and from this, along with the results presented in Table 4, it can be seen that typically in the winter months, average temperatures in zone 1 were approximately 0.6°C higher than in zone 2. During the summer months the difference in temperature between zone 1 and zone 2 was not significant.
Table 4: Monthly mean temperatures for zone 1, zone 2 and the interzone difference
Zone 1 Zone 2 Zone 1 – zone 2 difference
Mean 95% CI Mean 95% CI Mean 95% CI
Feb 2011 19.0 (18.8, 19.2) 18.5 (18.2, 18.7) 0.6 (0.4, 0.7)
Mar 2011 19.0 (18.8, 19.2) 18.7 (18.4, 18.9) 0.3 (0.2, 0.4)
Apr 2011 20.0 (19.8, 20.1) 20.0 (19.7, 20.1) 0.0 (0, 0.1)
May 2011 20.0 (19.8, 20.1) 19.9 (19.6, 20) 0.1 (0, 0.1)
Jun 2011 20.9 (20.7, 21) 21.0 (20.7, 21.1) -0.1 (-0.1, 0)
Jul 2011 21.4 (21.2, 21.5) 21.5 (21.3, 21.7) -0.1 (-0.2, 0)
Aug 2011 21.5 (21.3, 21.5) 21.5 (21.3, 21.6) 0.0 (0, 0)
Sep 2011 20.8 (20.6, 20.8) 20.6 (20.4, 20.8) 0.1 (0, 0.1)
Oct 2011 20.1 (19.9, 20.2) 19.8 (19.6, 20) 0.3 (0.2, 0.3)
Nov 2011 19.3 (19.1, 19.5) 18.8 (18.5, 19) 0.5 (0.3, 0.6)
Dec 2011 18.6 (18.3, 18.7) 17.9 (17.6, 18.2) 0.6 (0.4, 0.7)
Jan 2012 18.7 (18.4, 18.9) 18.1 (17.8, 18.4) 0.6 (0.4, 0.7) Base: All households in EFUS 2011 temperature sub-sample (n=823)
Figure 10: Distribution of monthly mean temperatures in zone 1 and zone 2
Base: All households in EFUS 2011 temperature sub-sample (n=823)
5 Difference is calculated as zone 1 minus zone 2.
16.0
17.0
18.0
19.0
20.0
21.0
22.0
Feb-11 Mar-11 Apr-11 May-11 Jun-11 Jul-11 Aug-11 Sep-11 Oct-11 Nov-11 Dec-11 Jan-12
Tem
pera
ture
(°C)
Zone 1 Zone 2
17
The differences in zone 1/zone 2 monthly mean temperatures are shown in Figure 11 and Table 5. It can be seen that on average over the year, 29% of households have mean monthly temperatures that were lower in zone 1 than in zone 2, the majority (53%) keeping zone 1 warmer than zone 2 and the remaining 19% of households have no difference between the zones6.
Figure 11: The mean monthly temperature difference between zone 1 and zone 2
Base: All households in EFUS 2011 temperature sub-sample (n=823)
Table 5: Spread of difference in zone 1/ 2 mean monthly temperatures for each month (% of households)
Feb-11
Mar-11
Apr-11
May-11
Jun-11
Jul-11
Aug-11
Sep-11
Oct-11
Nov-11
Dec-11
Jan-12
Average over year
Zone 1 more than 3°C colder
*3 *3 *2 *1 *1 *1 ** ** ** *1 *3 *4 *1
Zone 1 2°C to 3°C colder
*3 *4 *3 *2 *4 *3 *2 *1 *2 *2 *3 *4 *2
Zone 1 1°C to 2°C colder
9 10 11 8 10 10 10 8 7 8 8 8 9
Zone 1 up to 1°C colder
14 16 23 25 28 31 27 23 18 16 13 14 17
No difference 12 12 16 18 23 21 23 24 18 11 9 9 19
Zone 1 up to 1°C warmer
21 25 30 30 26 25 28 29 35 32 27 25 31
Zone 1 1°C to 2°C warmer
22 18 12 13 9 8 9 14 16 20 19 18 17
Zone 1 2°C to 3°C warmer
8 6 4 3 *1 *1 *1 *1 4 7 10 10 4
Zone 1 more than 3°C warmer
8 6 ** ** ** ** ** ** *1 4 8 8 1
Total 100 100 100 100 100 100 100 100 100 100 100 100 100
Base: All households in EFUS 2011 temperature sub-sample (n=823) *Sample responses are very small and subject to large sampling errors **Within the sample there were no responses for this combination but this is not necessarily true for the population. The probability of this combination occurring in the population is likely to be <0.5%. 6 Percentages do not add to 100 due to rounding.
-10
-8
-6
-4
-2
0
2
4
6
8
10
Tem
pera
ture
(deg
rees
C)

18
Table 6 shows the typical mean internal temperatures in zones 1 and 2 as calculated by SAP 2009 for a typical three bedroom semi-detached dwelling7, as well as the difference in temperatures between the zones. The SAP calculation predicts a 1.3°C temperature difference between the zones in the months of heating8. For ease of comparison, the monthly mean zone 1 and zone 2 temperatures determined from the EFUS 2011 temperature data are also shown in the table. It can be seen that the SAP-calculated zone 1/zone 2 difference is between 0.7°C and 1.4°C higher than the mean difference determined from the EFUS data for the winter months. However, as before, the limitations of this comparison should also be emphasised in that the results compare a stereotypical semi-detached home for the SAP calculation against the sample of dwellings monitored in the EFUS that are representative of the dwelling stock.
Table 6: Typical zone 1 and zone 2 mean internal temperatures as calculated in SAP 2009 and reported by EFUS 2011
Mean internal temperatures calculated in SAP 2009 (°C) Jan Feb Mar Apr May Jun Jul Aug Sep Oct Nov Dec
Living room 18.7 18.9 19.2 19.6 20.1 20.6 20.9 20.8 20.4 19.8 19.2 18.8 Rest of house 17.4 17.5 17.9 18.3 18.8 19.2 19.4 19.4 19.1 18.5 17.8 17.5
Difference between
zone1- zone 2 1.3 1.3 1.3 1.3 1.3 1.4 1.5 1.4 1.3 1.3 1.3 1.3
Mean monthly room temperatures determined from the EFUS 2011 temperature data (°C) Living room 19.0 19.0 20.0 20.0 20.9 21.4 21.5 20.8 20.1 19.3 18.6 18.7
Zone 2 18.5 18.7 20.0 19.9 21.0 21.5 21.5 20.6 19.8 18.8 17.9 18.1 Difference between
zone1- zone 2 0.6 0.3 0 0.1 -0.1 -0.1 0 0.1 0.3 0.5 0.6 0.6
Base: All households in EFUS 2011 temperature sub-sample (n=823). For confidence intervals see Table 4 above.
Correlation between rooms
Scatter plots of the variation in monthly mean temperatures measured in the living room, hallway and bedroom for January 2012 and July 2011 are shown in Appendix B9. All the combinations suggest a positive correlation in temperatures between the rooms. The relationships between the monthly mean temperatures in each room for a typical winter (January) and summer (July) month were investigated using the Pearson product-moment correlation coefficient, the results of which are shown in Appendix B.
There is a strong positive correlation (significant at the p<0.01 level) between all three rooms for both seasons. In January, the strongest correlation is seen between the hallway and the bedroom [r=0.748, n=771] and the weakest between the living room and bedroom [r=0.681, n=771]. Even stronger correlations are seen in summer, when the heating is off and monthly mean temperatures were driven predominantly by external conditions. In this case the correlation between the living
7 Values are for a typical semi-detached house with a gas heating system. 8 Additional calculations show that for a typical mid-terrace the difference is about 1.1°C and for a typical detached dwelling the difference is about 1.4°C 9 Correlations were performed on the unweighted sample.

19
room and the hallway is strongest [r=0.807, n=774], possibly because these rooms were likely to be in close proximately to each other.
3.3 Summary of mean room temperatures over a nominal heating season
As described in the methodology, the nominal ‘heating season’ has been defined as the months of October through to April, and the individual monthly temperatures have been averaged to produce the mean room temperature over the heating season. Average heating season temperatures have not been calculated for households with missing information for 1 or more of the months. Figure 12 shows boxplots of the minimum and maximum values and the interquartile ranges for each room. The mean room temperatures recorded during the heating season were 19.3°C for the living room, 18.8°C for the hallway and 18.9°C for the bedroom, the averages of which resulted in a mean temperature of 18.8°C for zone 2 and 19.0°C for the whole dwelling.
Figure 12: Boxplot of mean heating season room temperatures
Base: All households in EFUS 2011 temperature sub-sample (n=823)
As was done for the monthly temperatures, the mean temperatures recorded during the heating season in the living room (zone 1) and in zone 2 have been grouped into four bands around the indoor temperature range of 18-22°C, and the results are shown in Table 7. It can be seen from this table that approximately 65% of households maintained mean heating season temperatures in their living rooms and zone 2 areas within the range of 18-22°C. However 26% of households maintained mean heating season temperatures in their living rooms at temperatures below 18°C, while a further 7% of households heated their living rooms to a mean heating season temperature at or above 22°C. The proportions alter slightly for the zone 2 areas, which a slightly higher proportion of households maintain in the lower temperature range.
10.0
12.0
14.0
16.0
18.0
20.0
22.0
24.0
26.0
28.0
30.0
Living Room Hallway Bedroom Zone 2 Dwelling
Tem
pera
ture
(deg
rees
C)

20
Table 7: Mean heating season room temperatures (banded) for the Living Room and Zone 2
Mean room temperature range
Living Room (%) Zone 2 (%) Sample size % 95% C.I. Sample size % 95% C.I.
<12°C 0 0.0 0 0.0
12°C - <18°C 194 25.9 (22.6,29.2)
249 30.4 (26.9,33.9)
18°C - <22°C 529 63.9 (60.3,67.5)
526 65.0 (61.4,68.6)
22+°C 75 7.5 (5.5,9.4) 46 4.5 (2.9,6.0) Missing* 25 2.7 (1.5,4.0) 2 0.1 (0,0.4) Total 823 100.0 823 100.0
Base: All households in EFUS 2011 temperature sub-sample (n=823) * Average heating season temperatures have not been calculated for households with missing information for 1 or more of the months
3.3.1 Weekdays and weekend days Processing of the data also provides the average temperatures for weekdays and weekend days separately. BREDEM and SAP differentiate between these days by assigning different heating hours (specifically defined hours in SAP, with the option to define different hours on different days in BREDEM) and so it is of interest to investigate whether the temperatures do, in fact, differ. Comparison of the 95% confidence intervals (see Table 8) show that there were no statistically significant differences between weekday and weekend day mean heating season temperatures in the living room, bedroom, zone 2 or the dwelling as a whole.
Table 8: Weekday and weekend mean room temperatures during the heating season
Weekday Weekend
Mean room temperature °C
95% C.I. Mean room temperature °C
95% C.I.
Living Room (N=798)
19.2 (19.0 , 19.3) 19.4 (19.2 , 19.5)
Hallway (N=801)
18.8 (18.5 , 18.9) 18.9 (18.7 , 19.1)
Bedroom (N=801)
18.8 (18.6 , 18.9) 19.0 (18.8 , 19.1)
Zone 2 (N=821)
18.8 (18.6 , 18.9) 19.0 (18.8 , 19.1)
Dwelling (N=823)
18.9 (18.7 , 19.0) 19.1 (18.9 , 19.2)
Base: All households in EFUS 2011 temperature sub-sample (n=823): unweighted sample
3.4 Variation of mean heating season temperatures by dwelling and household characteristics
It is of interest to energy efficiency policymakers to investigate whether mean room dwelling temperatures vary for different household and dwelling groups. Characteristics relating to the

21
physical properties of the dwelling, (e.g. type of heating system, insulation, dwelling age and type) and also to the households living within those dwellings (e.g. pensioner present, household income level, tenure) have been examined. The mean temperatures in the living room, hallway, bedroom, zone 2 (the average of hallway and bedroom), the overall dwelling average (from the three locations) are shown in Table 9. Table 10 shows the 95% confidence intervals of the mean temperatures for the living room and zone 2. The 95% confidence intervals show the significance of the differences across categories. Detailed descriptions of the variables used or derived from the EHS and EFUS data can be found in the Glossary.
The results show that dwellings that are fully double-glazed, those with someone in during the day during a weekday and those in which the occupants are not under-occupying have both living room and zone 2 mean heating season temperatures that are significantly higher than their alternative category. Other significant differences that can be seen include dwellings built pre-1919 having lower mean heating season temperatures in both zones than dwellings built between 1945 and 1990; dwellings with a floor area <50m2 having higher mean heating season temperatures in both zones than the largest dwellings with floor areas >140m2; owner-occupied dwellings having lower living room and zone 2 mean heating season temperatures than local authority or RSL dwellings; and dwellings in which the HRP is older than 75 years having higher living room and zone 2 mean heating season temperatures than dwellings with the HRP aged between 45-64 years.
There were also some groups of dwellings that have significant differences in the mean heating season room temperatures in one or other of the zones but not both. For example, flats are seen to have higher mean heating season living room temperatures than detached or semi-detached dwellings but no difference is seen between dwelling types in the zone 2 mean heating season temperatures. Dwellings in rural locations tend to have lower mean heating season zone 2 temperatures than those in urban areas, and dwellings in London tend to have higher mean heating season zone 2 temperatures than dwellings in the North West and Yorkshire and Humber regions, although no differences are seen between the living room mean heating season temperatures for either characteristic. Dwellings with no insulation measures have lower living room mean heating season temperatures than dwellings with at least one or more insulation measures, but no differences are seen in the zone 2 mean heating season temperatures for this characteristic. In terms of household characteristics, households with a pensioner living in the dwelling typically have higher living room mean heating season temperatures than households without a pensioner present; similarly households with one or more persons retired have higher living room mean heating season temperatures than households with one or more persons working full time. No differences in the mean heating season temperatures in zone 2 are seen for any of these groups.
Finally there were some groups for which there are no significant (or very small) differences in mean heating season temperatures: centrally heated versus non-centrally heated dwellings, dwellings using different fuels for their main heating; cavity insulated walls versus non-insulated walls, differing levels of loft insulation, households of differing sizes, households with and without children present, households in all income quintiles and households in fuel poverty under the Low Income High Costs (LIHC) indicator.
The mean external temperature has also been included in the table as it was noted that there was a difference in the external temperature for some of the groups, which could have been an influencing factor. Regression of the mean dwelling temperatures on external temperatures for the heating

22
season months shows that a 1°C rise in external temperature corresponds to a 0.24°C rise in dwelling temperature. If the fully double glazed/not fully double glazed comparison is taken as an example, standardisation of the living room temperatures to the stock mean heating season external temperature of 8.4°C results in virtually no change in temperatures. The only impact of standardisation was found to be for the regions, where standardisation resulted in a decrease in the mean heating season temperatures in London such that there was no real difference between London and the NW and Yorkshire and Humber for the zone 2 mean heating season temperatures.

23
Table 9: Mean temperatures (°C) during the nominal heating season by dwelling and household characteristics
Dwelling characteristic Characteristic category
Mean temperature (°C) Living Room Hallway Bedroom Zone 2 Dwelling External
Dwelling type End terrace 19.0 18.7 19.0 18.8 18.9 8.5 Mid terrace 19.5 19.1 19.0 19.0 19.2 8.5 Semi detached 19.0 18.4 18.9 18.6 18.8 8.4 Detached 18.7 18.4 18.6 18.5 18.6 8.4 Bungalow 19.4 19.3 18.6 18.9 19.1 8.2 Flat 20.0 19.5 18.9 19.3 19.5 8.8
Dwelling type House or bungalow 19.1 18.7 18.8 18.7 18.9 8.4 Flat 20.0 19.5 18.9 19.3 19.5 8.8
Dwelling Age Pre 1919 18.3 18.1 18.0 18.0 18.1 8.5 1919-1944 19.2 18.7 18.8 18.7 18.9 8.6 1945-1964 19.6 18.8 19.1 19.0 19.2 8.4 1965-1974 19.3 19.0 19.0 19.0 19.1 8.5 1975-1980 20.1 19.7 19.6 19.7 19.8 8.6 1981-1990 19.5 19.2 19.2 19.2 19.3 8.5 Post 1990 19.2 19.2 19.1 19.1 19.2 8.5
Useable floor area
< 50 m2 20.1 19.8 19.2 19.5 19.7 8.9 50 to 69 m2 19.4 18.9 18.9 18.9 19.1 8.4 70 to 89 m2 19.1 18.6 18.9 18.7 18.8 8.5 90 to 109 m2 19.5 18.9 19.0 18.9 19.1 8.5 110 to 139 m2 18.9 18.6 18.7 18.7 18.8 8.5 ≥140 m2 18.7 18.4 18.4 18.4 18.5 8.3
Region - EHS order
North East 19.1 18.2 18.5 18.4 18.6 7.3 North West 18.7 18.4 18.5 18.5 18.6 8.2 Yorkshire and the Humber
18.8 18.3 18.2 18.3 18.5 7.6
East Midlands 19.5 18.5 19.0 18.7 19.0 8.3 West Midlands 19.0 18.4 18.8 18.5 18.7 8.2 East 19.5 19.3 19.1 19.1 19.3 8.4 London 19.9 19.9 19.4 19.7 19.8 9.6 South East 19.5 19.2 19.2 19.2 19.3 8.8 South West 19.1 18.5 18.6 18.6 18.8 9.1
Urban or rural location?
Urban 19.3 18.9 18.9 18.9 19.0 8.5 Rural 19.0 18.2 18.3 18.3 18.5 8.4
Type of heating system
Central Heating 19.2 18.8 18.9 18.9 19.0 8.5 Non-Central Heating 19.6 18.7 18.2 18.5 18.8 8.5
Main heating fuel Mains gas 19.2 18.8 18.9 18.8 19.0 8.5 Electricity 19.5 18.7 18.2 18.5 18.8 8.4 Other (bottled/bulk gas,solid,oil,communal)
19.8 19.0 19.2 19.1 19.3 8.6
Are the walls of the dwelling insulated?
Insulated 19.4 18.9 19.1 19.0 19.1 8.3 Not insulated 19.1 18.8 18.7 18.8 18.9 8.6
Loft insulation <50mm 18.7 18.6 18.8 18.8 18.8 8.6 50-149mm 19.2 18.7 18.9 18.8 18.9 8.5 150+ mm 19.2 18.7 18.8 18.7 18.9 8.3
Is dwelling fully double glazed?
Yes 19.5 18.9 19.0 19.0 19.1 8.5 No 18.7 18.5 18.4 18.4 18.5 8.6
Dwelling insulation
All 3 insulation measures 19.2 18.7 18.8 18.8 18.9 8.2 2 insulation measures 19.5 18.8 19.1 19.0 19.2 8.4 1 insulation measure 19.3 18.8 18.9 18.9 19.0 8.6 No insulation measures 17.9 18.2 18.2 18.1 18.1 8.6
Energy efficiency (SAP09) rating
less than 30* 18.0 18.1 17.4 17.7 17.8 8.5 30 to 50 18.9 18.3 18.6 18.5 18.6 8.5 51 to 70 19.4 18.9 19.0 18.9 19.1 8.5 more than 70 19.9 19.8 19.3 19.6 19.7 8.6
Table continued on next page

24
Table 9 continued: Mean room temperatures during the Heating Season (Oct – April, all days in month) by dwelling and household characteristics
Household characteristic
Characteristic category
Mean temperature (°C) Living Room Hallway Bedroom Zone 2 Dwelling External
Tenure Owner Occupied 19.0 18.7 18.8 18.7 18.8 8.5 Private rented 19.3 18.6 18.7 18.7 18.9 8.6 Local Authority 20.3 19.4 19.3 19.4 19.7 8.4 RSL 20.0 19.7 19.1 19.4 19.6 8.5
Household size 1 19.0 18.5 18.3 18.4 18.6 8.4 2 19.3 18.9 19.0 19.0 19.1 8.5 3 19.4 19.2 19.0 19.1 19.2 8.6 4 19.2 18.7 19.2 19.0 19.1 8.4 5 or more 19.3 19.0 19.1 19.0 19.1 8.5
Pensioner Present?
At least one person of pensionable age
19.8 19.2 19.0 19.1 19.3 8.4
No persons of pensionable age
19.0 18.6 18.8 18.7 18.8 8.5
Children Present? At least one child 19.3 19.0 19.2 19.1 19.2 8.5 No children 19.2 18.8 18.7 18.8 18.9 8.5
Age HRP 16 - 34 19.2 18.8 19.4 19.0 19.1 8.6 35 - 44 19.0 18.7 18.7 18.7 18.8 8.6 45 - 54 18.9 18.4 18.7 18.5 18.6 8.4 55 - 64 19.1 18.7 18.6 18.7 18.8 8.6 65 - 74 19.7 19.0 19.0 19.0 19.2 8.3 75 or more 20.4 19.9 19.4 19.7 19.9 8.6
Employment status of HRP and partner combined
1 or more work full time
19.0 18.7 18.8 18.7 18.8 8.6
1 or more work part time
19.3 18.8 18.5 18.6 18.9 8.3
none working, one or more retired
19.9 19.2 19.0 19.1 19.4 8.4
none working and none retired
19.1 18.7 18.7 18.7 18.8 8.3
Annual gross income of the HRP and partner weighted quintiles
1st quintile (lowest)
19.5 19.1 18.8 18.9 19.1 8.4
2nd quintile 19.4 18.6 18.5 18.6 18.8 8.4 3rd quintile 19.4 18.8 18.9 18.9 19.1 8.5 4th quintile 19.2 19.0 19.3 19.1 19.2 8.5 5th quintile (highest)
18.7 18.6 18.8 18.6 18.7 8.6
Is anyone in the household at home during the day on a weekday?
No 18.7 18.5 18.5 18.5 18.6 8.6 Yes 19.6 19.0 19.1 19.1 19.2 8.5
Under-occupying Not under-occupying
19.6 19.1 19.2 19.2 19.3 8.5
Under-occupying 18.7 18.3 18.3 18.3 18.4 8.4 Fuel Poverty Low Income High Cost indicator (LIHC)
Not in fuel poverty - LIHC
19.3 18.9 18.9 18.9 19.0 8.5
In fuel poverty - LIHC
18.7 18.3 18.3 18.2 18.4 8.2
Base: All households in EFUS 2011 temperature sub-sample (n=823) * Sample responses are very small and subject to large sampling errors

25
Table 10: Confidence intervals for mean room temperatures during the Heating Season (Oct – April, all days in month) by dwelling and household characteristics
Dwelling characteristic Characteristic category
Living Room Zone 2
Sample size
95% CI mean temp (°C)
95% CI of mean temp (°C)
Dwelling type End terrace 83 18.3, 19.5 18.3, 19.3 Mid terrace 124 19.1, 19.9 18.7, 19.3 Semi detached 244 18.6, 19.3 18.3, 18.9 Detached 143 18.3, 19 18.2, 18.8 Bungalow 101 18.9, 19.8 18.4, 19.3 Flat 128 19.5, 20.5 18.7, 19.8
Dwelling type House or bungalow 695 18.9, 19.2 18.5, 18.9 Flat 128 19.5, 20.5 18.7, 19.8
Dwelling Age Pre 1919 127 17.9, 18.7 17.6, 18.4 1919-1944 127 18.7, 19.6 18.3, 19.1 1945-1964 209 19.2, 19.8 18.6, 19.2 1965-1974 138 18.9, 19.7 18.5, 19.3 1975-1980 68 19.4, 20.8 19, 20.3 1981-1990 79 19, 20 18.7, 19.5 Post 1990 75 18.7, 19.7 18.7, 19.5
Useable floor area < 50 m2 89 19.5, 20.6 18.9, 20 50 to 69 m2 197 19, 19.8 18.5, 19.3 70 to 89 m2 213 18.7, 19.4 18.4, 19 90 to 109 m2 119 19, 19.8 18.5, 19.2 110 to 139 m2 95 18.4, 19.2 18.3, 19 ≥140 m2 110 18.2, 19.1 18, 18.8
Region - EHS order North East 57 18.4, 19.6 17.8, 19 North West 130 18.3, 19.1 18, 18.8 Yorkshire and the Humber
106 18.3, 19.2 17.7, 18.7
East Midlands 79 19, 19.9 18.2, 19.1 West Midlands 71 18.4, 19.6 17.9, 19 East 112 19.1, 19.9 18.7, 19.5 London 62 19.1, 20.6 19.1, 20.2 South East 125 19, 19.8 18.8, 19.5 South West 81 18.6, 19.6 18.1, 19
Urban or rural location? Urban 722 19.1, 19.4 18.7, 19 Rural 101 18.4, 19.4 17.8, 18.6
Type of heating system Central Heating 754 19, 19.4 18.7, 19 Non-Central Heating 69 18.8, 20.2 17.8, 19
Main fuel Mains gas 687 18.9, 19.3 18.6, 19 Electricity 66 18.8, 20.1 17.8, 19.1 Other (bottled/bulk gas,solid,oil,communal)
70 18.9, 20.5 18.3, 19.8
Are the walls of the dwelling insulated?
Insulated 383 19.2, 19.6 18.7, 19.2 Not insulated 440 18.8, 19.3 18.5, 18.9
Loft insulation <50mm 48 17.8, 19.5 18, 19.5 50-149mm 335 18.8, 19.4 18.5, 19 150+ mm 355 18.9, 19.4 18.5, 18.9
Is dwelling fully double glazed?
Yes 639 19.2, 19.6 18.8, 19.1 No 184 18.2, 19 18, 18.7
Dwelling insulation All 3 insulation measures 139 18.7, 19.5 18.3, 19.1 2 insulation measures 246 19.2, 19.8 18.6, 19.2 1 insulation measure 265 19, 19.5 18.6, 19.1 No insulation measures 88 17.3, 18.5 17.6, 18.6
Energy efficiency (SAP09) rating
less than 30 20* 16.7, 19.2 16.8, 18.6 30 to 50 192 18.4, 19.2 18, 18.8 51 to 70 545 19.1, 19.5 18.7, 19.1 more than 70 66 19.4, 20.4 19, 20.1

26
Table 10 continued: Confidence intervals for mean room temperatures during the Heating Season (Oct – April, all days in month) by dwelling and household characteristics
Household characteristic Characteristic category
Living Room Zone 2 Sample
size 95% CI mean temp
(°C) 95% CI of mean temp
(°C) Tenure Owner Occupied 524 18.7, 19.2 18.5, 18.8
Private rented 64 18.6, 19.8 18, 19.2 Local Authority 128 19.6, 20.8 18.8, 20 RSL 107 19.5, 20.4 18.9, 19.8
Household size 1 237 18.6, 19.3 18, 18.8 2 303 19, 19.6 18.7, 19.1 3 123 19, 19.8 18.7, 19.3 4 114 18.7, 19.6 18.6, 19.3 5 or more 46 18.6, 19.9 18.4, 19.6
Pensioner Present?
At least one person of pensionable age
337 19.4, 20 18.8, 19.3
No persons of pensionable age
486 18.7, 19.1 18.5, 18.9
Children Present? At least one child 222 18.9, 19.5 18.8, 19.3 No children 601 19, 19.4 18.5, 18.9
Age of HRP 16 - 34 70 18.5, 19.7 18.5, 19.5 35 - 44 125 18.6, 19.3 18.3, 19.1 45 - 54 187 18.5, 19.1 18.2, 18.8 55 - 64 181 18.6, 19.4 18.3, 18.9 65 - 74 171 19.3, 20 18.6, 19.3 75 or more 89 19.8, 20.9 19, 20.2
Employment status of HRP and partner combined
1 or more work full time 373 18.7, 19.2 18.5, 18.9 1 or more work part time 71 18.7, 19.7 18.1, 19.1 none working, one or more retired
283 19.5, 20.1 18.8, 19.4
none working and none retired
96 18.5, 19.6 18.1, 19.2
Annual gross income of the HRP and partner weighted quintiles
1st quintile (lowest) 185 19.1, 19.9 18.5, 19.3 2nd quintile 192 18.9, 19.7 18.2, 18.9 3rd quintile 158 19, 19.7 18.5, 19.2 4th quintile 155 18.8, 19.5 18.8, 19.4 5th quintile (highest) 133 18.3, 19.1 18.2, 18.9
Is anyone in the household at home during the day on a weekday?
No 285 18.4, 18.9 18.2, 18.7 Yes 538 19.4, 19.8 18.8, 19.2
Under-occupying?
Not under-occupying 524 19.3, 19.7 18.9, 19.3 Under-occupying 299 18.4, 18.9 18, 18.5
In Fuel Poverty? LIHC definition
Not in fuel poverty 741 19.1, 19.4 18.7, 19 In fuel poverty 82 18.1, 19.2 17.7, 18.7
Base: All households in EFUS 2011 temperature sub-sample (n=823)
Further investigation into the influence of different levels of control on mean heating season room temperatures in centrally heated households indicates that there is no statistical significant difference in mean heating season temperatures in either the living room or zone 2 (Table 11).

27
Table 11: Mean heating season room temperatures during the heating season for centrally heated households with differing level of control
Living room Zone 2
N Mean room
temperature °C
95% CI of mean room
temperature °C
Mean room temperature
°C
95% CI of mean room
temperature °C Do you have a working thermostat on the wall?
Yes 568 19.2 19.0, 19.4
18.8 18.6, 19.0
No 183 19.3 18.8, 19.6
19.0 18.5, 19.3
Does household use timer for central heating control?
Yes 355 19.1 18.9, 19.3
18.9 18.6, 19.0
No 213 19.3 18.9, 19.6
18.8 18.4, 19.1
Base: All households with a working thermostat or a central heating timer in EFUS 2011 temperature sample
3.5 Summary of temperatures achieved during extreme external conditions
Analysis of the average external temperatures for the months under consideration in this report show that the coldest days over most of the country were a period at the end of January 2011 and a period at the beginning of March 201110. Table 12 shows the mean temperatures measured in each of the rooms for the subset of dwellings (9.8 million) for which three days in January were the coldest prolonged conditions experienced, along with the standard deviation and 95% confidence intervals. Also shown for comparison is the mean and 95% confidence intervals of the heating season temperatures for the same subset of dwellings. By comparing the confidence intervals it can be seen that for all rooms, the mean temperatures during the cold period are significantly lower than the mean heating season temperature.
Table 12: Mean room temperatures achieved during cold conditions on 29-31 January 2011 and comparison with the heating season average
Mean temperature °C
(3 day mean, n=373)
95% Confidence Intervals
Mean heating season
temperature °C (n=373)
95% Confidence Intervals
External -5.5 -5.6, -5.2 8.3 8.2, 8.4 Living room 17.8 17.4, 18.2 19.0 18.7, 19.3 Hallway 16.7 16.3, 17.0 18.4 18.1, 18.6 Bedroom 17.0 16.6, 17.4 18.6 18.3, 18.8 Zone 2 16.9 16.5, 17.2 18.5 18.2, 18.7 Dwelling 17.2 16.8, 17.5 18.7 18.4, 18.8
Base: Households in EFUS 2011 temperature sample for which three days in January 2011 were the coldest prolonged conditions experienced
10 Almost the entire month of December in 2010 saw temperatures considerably below the 1971-2000 average, but there were very few temperature loggers installed at this time.

28
A further subset of dwellings (7.2 million) experienced their coldest conditions during the first week of March and the results for these dwellings are shown in Table 13. The mean temperatures recorded during this cold period are statistically significantly lower for the hallway, but not for the living room or bedroom, compared to the mean temperature for the entire heating season for the same subset of dwellings. Further investigation of the external and room temperatures for the period preceding the cold snaps is required to explain these findings.
Table 13: Mean room temperatures achieved during cold conditions on 3,5,7 and 8 March 2011
Mean temperature °C
(4 day mean, n=239)
95% Confidence Intervals
Mean heating season
temperature °C (n=239)
95% Confidence Intervals
External -3.3 -3.4, -3 8.9 8.7, 8.9 Living room 19.0 18.6, 19.3 19.6 19.2, 19.9 Hallway 18.7 18.3, 19 19.4 19.1, 19.7 Bedroom 18.7 18.3, 19 19.3 19, 19.6 Zone 2 18.7 18.3, 19 19.4 19, 19.6 Dwelling 18.8 18.5, 19 19.4 19.1, 19.7
Base: Households in EFUS 2011 temperature sample for which the first week in March 2011 were the coldest prolonged conditions experienced
There was a period of extreme hot conditions that occurred across most of the country on the 26-27 June 2011. Table 14 shows the mean (and the 95% confidence intervals) of the temperatures recorded in the dwellings during these 2 days as well as the ‘summer average’ temperature (calculated as the mean temperature in June, July and August). It can be seen that the temperatures recorded in the dwellings during the hot spell are significantly higher than the summer average.
Table 14: Mean room temperatures achieved during hot conditions on 26-27 June 2011
Mean temperature °C
(2 day mean, n=639)
95% Confidence
Intervals
Mean ‘Summer’*
temperature
95% Confidence
Intervals
External 29.1 28.9, 29.2 9.2 15.1, 15.2 Living room 23.9 23.7, 24 3.0 21.1, 21.4 Hallway 24.1 23.9, 24.2 3.1 21, 21.3 Bedroom 25.0 24.8, 25.1 2.7 21.4, 21.7 Zone 2 24.5 24.3, 24.6 2.9 21.3, 21.5 Dwelling 24.3 24.1, 24.4 2.9 21.2, 21.5
Base: Households in EFUS 2011 temperature sample for which the 26-27 June 2011 were the hottest conditions experienced * calculated as the mean temperature in June, July and August

29
4 Conclusions The results of the analysis of mean room temperatures collected over a period of 12 months from a subset of 823 dwellings of the EFUS 2011 are presented in this report. Monthly mean temperatures in the living room, hallway and bedroom have been calculated from raw data files containing temperatures logged at 20-minute intervals. From these, a ‘zone 2’ temperature has been calculated from the mean of the hallway and bedroom temperatures, and a ‘dwelling’ temperature has been calculated from the mean of the living room, hallway and bedroom temperatures. The predominant focus of this report has been the heating season months, and so for this purpose the mean temperatures during the heating season (October to April inclusive) for each room have been calculated. Relationships between the temperatures in each room, between zone 1 and zone 2, between weekdays and weekend days and the variation in mean heating season temperatures by various dwelling and household characteristics have then been investigated. Finally, the room temperatures recorded during a cold and hot ‘extreme’ weather event have been examined and compared to the average recorded for the whole heating season (cold weather event) and the summer months (hot weather event).
The main findings of the analysis are:
§ Mean monthly temperatures for the whole dwelling range from 18.1°C in December to 21.5°C in July and August.
§ The mean monthly temperatures calculated from the EFUS data for the whole stock are between 0.1°C and 0.8°C higher for the months of heating than those calculated by SAP for a typical semi-detached house (using 2011 mean external temperatures), although the difference was negligible for November, December and January as the SAP values are within the bounds of the sampling error for the EFUS data.
§ On an individual room level, mean monthly temperatures in the living room are higher than in either the hallway or bedroom for the months of October through to March; while for the remaining months, mean monthly temperatures in the bedroom are typically the highest.
§ In the winter months, mean monthly temperatures in zone 1 are approximately 0.6°C higher than in zone 2. During the summer months the difference in temperature between zone 1 and zone 2 is not significant. In SAP, the calculated zone 1/zone 2 difference is between 0.7°C and 1°C higher than the mean difference determined from the EFUS data for the winter months.
§ In approximately 30% of households the mean monthly temperatures in zone 1 are lower than those in zone 2 (although the majority of households have zone 1 warmer than zone 2).
§ The mean room temperatures recorded during the heating season (October to April) are 19.3°C for the living room, 18.8°C for the hallway and 18.9°C for the bedroom, from which a mean temperature of 18.8°C for zone 2 and 19.0°C for the dwelling has been derived.
§ Approximately 65% of households maintain their living rooms and zone 2 areas within the range of 18-22°C during the heating season. However 26% of households maintain their living rooms at temperatures below 18°C, while a further 7% of households heat their living rooms to temperatures at or above 22°C.

30
§ There are no statistically significant differences between weekday and weekend day mean heating season temperatures in the living room, bedroom, zone 2 or the dwelling as a whole.
§ The variations in mean heating season temperatures for different dwelling and household characteristics have been investigated. Dwellings that were fully double glazed, those with someone in during the day during a weekday, and those in which the occupants are not under-occupying have both living room and zone 2 mean heating season temperatures that are significantly higher than their alternative category.
§ Other significant differences that could be seen include dwellings built pre-1919 having lower mean heating season temperatures in both zones than dwellings built between 1945 and 1990; dwellings with a floor area <50m2 having higher mean heating season temperatures in both zones than the largest dwellings with floor areas >140m2; owner-occupied dwellings having lower living room and zone 2 mean heating season temperatures than local authority or RSL dwellings and dwellings in which the HRP is older than 75 years having higher living room and zone 2 mean heating season temperatures than dwellings with the HRP aged between 45-64 years.
§ Some groups of dwellings have significant differences in the mean heating season temperatures in one or other of the zones but not both:
o Flats are seen to have higher living room mean heating season temperatures than detached or semi-detached dwellings but no difference is seen between dwelling types for zone 2 mean heating season temperatures.
o Dwellings in rural locations tend to have lower zone 2 mean heating season temperatures than those in urban areas and dwellings in London tend to have higher zone 2 mean heating season temperatures than dwellings in the North West and Yorkshire and Humber regions but no differences are seen between the living room mean heating season temperatures for either characteristic.
o Dwellings with no insulation measures have lower living room mean heating season temperatures than dwellings with at least one or more insulation measure, but no differences are seen in the zone 2 mean heating season temperatures for this characteristic.
o Households with a pensioner living in the dwelling typically have higher living room mean heating season temperatures than households without a pensioner present; similarly households with one or more persons retired have higher living room mean heating season temperatures than households with one or more persons working full time. No differences in the mean heating season temperatures in zone 2 are seen for any of these groups.
§ For some groups there are no significant (or very small) differences in mean heating season temperatures: these are centrally heated versus non-centrally heated dwellings, dwellings using different fuels for their main heating; cavity insulated walls versus non-insulated walls, differing levels of loft insulation, households of differing sizes, households with and without children present, households in all income quintiles and households in fuel poverty under the Low Income High Costs (LIHC) indicator.

31
§ The coldest days over most of the country were a period at the end of January 2011 and a period at the beginning of March 2011. Analysis of the EFUS data shows that temperatures collected during the January cold period are significantly lower than the average heating season temperature in all rooms. However the difference significance is not apparent for all rooms during the March period.
§ The hottest conditions occurred across most of the country on the 26-27 June 2011. Temperatures recorded in the dwellings during the hot spell are significantly higher than the summer average.
The key implications for the energy modelling methodologies of SAP/BREDEM are as follows:
§ The typical difference in the zone 1/zone 2 mean temperature calculated in the models may be an over-estimate. The results from the temperature monitoring suggest that zone 2 temperatures may be closer to the zone 1 temperatures than currently predicted by these models. Additional work in this area, however, required to fully understand what might cause these differences.
§ The difference between weekday/weekend day mean dwelling temperatures currently implemented in SAP may not be necessary. This supports the results presented in the Main Heating report, in that householders report little change in the number of hours that their heating is on between weekdays and weekends.
§ The monthly mean dwelling temperatures recorded during the EFUS 2011 match relatively well with the values calculated in SAP. The EFUS provides evidence for higher temperatures in summer compared to those used in SAP (due to a cap set in SAP) which, although not relevant to heating costs, may have implications for cooling costs in the future.

32
Glossary Age of dwelling: This is the date of construction of the oldest part of the dwelling.
Recorded by surveyors in the EHS physical survey.
Age of HRP: The Household Reference Person (HRP) is the person in whose name the dwelling is owned or rented or who is otherwise responsible for the accommodation. In the case of joint owners and tenants, the person with the highest income is taken as the HRP. Where incomes are equal, the older is taken as the HRP. This procedure increases the likelihood that the HRP better characterises the household’s social and economic position. The age of the HRP is derived from householder responses to q167/168/169/170 in the EFUS 2011 Interview survey for new households and from variables obtained from the EHS Interview survey for households that had not changed since the earlier EHS interview.
Annual gross income of the HRP and partner weighted quintiles:
This is the annual income of the Household Reference Person and (any) partner. This includes income from private sources (regular employment, self-employment, government schemes, occupational pensions, private pensions and other private income), state benefits/allowances and tax credits, as collected on the EHS survey (this includes housing benefit/Local Housing Allowance but excludes council tax benefit and Support for Mortgage Interest) and interest from savings. It is a gross measure i.e. income before Income Tax or National Insurance deductions.
Children Present: Anyone in the household who is 16 years old or younger. Derived from householder responses to q167/168/169/170 in the EFUS 2011 Interview survey for new households and from variables obtained from the EHS Interview survey for household that had not changed since the EHS interview.
Dwelling insulation: The number of insulation measures where positive responses for ‘Fully double glazed’, ‘Insulated walls’ and having loft insulation greater than 200mm count as insulation measures.
Dwelling type: Classification of dwelling on the basis of the surveyors’ inspections during the EHS physical survey.
Employment status of HRP and Partner combined:
Information on employment status was not re-collected as part of the EFUS and is as reported in the EHS interview survey (and some households may have changed status in the period between the two interviews).
Fuel Poverty – LIHC definition:
Under the Low Income High Cost definition a household is considered to be fuel poor where:
• They have required fuel costs that are above average (the national median level)
• Were they to spend that amount, they would be left with a residual income below the official poverty line.
Please refer to the following documents for more information. https://www.gov.uk/government/uploads/system/uploads/attachment_data/file/66570/6406-fuel-poverty-changing-the-framework-for-

33
measureme.pdf https://www.gov.uk/government/uploads/system/uploads/attachment_data/file/226988/fuel_poverty_stats_methodology_handbook_2013.pdf
Fully double glazed: Derived from the ‘dblglaz4’ variable as measured by surveyors in the EHS physical survey. Fully double glazed is ‘entire house double glazed’. Not fully double glazed is anything less than fully double glazed.
Household size: Number of persons in the household, banded into 5 groups, derived from the ‘hhsizex’ variable from the EHS Interview survey.
In during the day: See the EHS interview documentation for full details of occupancy questions asked as part of the EHS (question ‘Hmwtht’). A household has been classified as being ‘in during a weekday’ if they indicate being generally in the house on weekdays during the winter, for any period between 9am and 5pm. It should be noted that this information was not re-collected as part of the EFUS, and some households occupancy patterns may have changed in the interval between the two interview surveys.
Insulated walls: Derived from the ‘wallinsx’ variable as measured by surveyors in the EHS physical survey. ‘Insulated’ are ‘cavity with insulation’; ‘Not insulated’ includes ‘cavity without insulation’ and ‘other’ wall types.
Loft insulation: Banded variable of ‘loftinsx’, the level of loft insulation recorded by surveyors in the EHS physical survey.
Main fuel: As determined by surveyors in the EHS physical survey. Grouped into ‘mains gas’, ‘electricity’ and ‘other’, which includes bottled gas, bulk gas, solid fuels, oil and community schemes.
Pensioner Present: Anyone in the household who is 65 or over (male) or 60 or over (female). Derived from householder responses to q167/168/169/170 in the EFUS 2011 Interview survey for new households and from variables obtained from the EHS Interview survey for households that had not changed since the EHS interview.
Region: Government Office Region that the dwelling is located in. Obtained from the EHS.
Rurality: Is the dwelling in a rural (village or isolated hamlet) or urban (urban or town or fringe) location. Derived from the ‘rumorph’ variable in the EHS.
SAP rating: The energy cost rating as determined by Government’s Standard Assessment Procedure (SAP) and is used to monitor the energy efficiency of dwellings. It is an index based on calculated annual space and water heating costs for a standard heating regime and is expressed on a scale of 1 (highly inefficient) to 100 (highly efficient with 100 representing zero energy cost).
Tenure: Derived from householder responses to q01 in the EFUS 2011 Interview

34
survey.
Type of heating: Central heating or non-central heating. Determined from householder responses to Q06 in EFUS 2011 interview survey. Non-central heating includes storage radiators, gas fires, electric heaters, coal/wood/ smokeless fuel fires or stoves and other.
Under-occupying: A household is considered to be under-occupying if the dwelling is more than large enough for the number (and type) of occupants living there. For the full definition of under occupancy, see the fuel poverty methodology handbook, which is available at: http://www.decc.gov.uk/assets/decc/Statistics/fuelpoverty/614-fuel-poverty-methodologyhandbook.pdf
Useable floor area: The total usable internal floor area of the dwelling as measured by the surveyor in the EHS physical survey, rounded to the nearest square metre. It excludes integral garages, balconies, stores accessed from the outside only and the area under partition walls. Grouped into 5 categories.

35
Appendix A: Summary statistics for monthly mean temperature data
1. External temperature
a. All days in month mean temperature (°C)
Mean Median Standard Deviation Minimum Maximum
Percentile 25
Percentile 75
Feb 2011 6.6 6.5 .8 .6 8.4 6.2 7.1 Mar 2011 6.7 6.7 .7 1.6 11.8 6.3 7.1 Apr 2011 11.9 11.9 1.0 6.1 14.2 11.4 12.2 May 2011 12.4 12.4 1.1 5.5 14.7 11.9 13.1 Jun 2011 14.3 14.3 1.0 7.3 16.4 13.8 14.9 Jul 2011 15.4 15.5 .9 9.5 17.9 15.0 15.9 Aug 2011 15.6 15.6 1.1 9.2 17.7 15.0 16.2 Sep 2011 15.1 15.1 .9 9.9 17.1 14.7 15.7 Oct 2011 12.6 12.6 .9 6.1 14.6 12.2 13.1 Nov 2011 9.7 9.6 .8 4.4 12.6 9.2 10.2 Dec 2011 6.2 6.1 1.0 -.3 11.0 5.6 7.0 Jan 2012 5.6 5.5 1.0 -.6 11.0 5.0 6.3
b. Weekdays only in month mean temperature (°C)
Mean Median Standard Deviation Minimum Maximum
Percentile 25
Percentile 75
Feb 2011 6.5 6.5 .8 .7 8.5 6.0 7.1 Mar 2011 6.9 6.8 .7 2.0 11.8 6.4 7.3 Apr 2011 11.7 11.7 1.0 5.9 13.8 11.2 12.1 May 2011 12.2 12.1 1.1 5.5 14.4 11.7 12.8 Jun 2011 14.3 14.3 1.0 7.4 16.5 13.7 14.9 Jul 2011 15.4 15.4 .9 9.4 17.5 15.1 15.9 Aug 2011 15.6 15.7 1.1 9.5 17.8 15.0 16.1 Sep 2011 15.1 15.1 1.0 9.9 17.2 14.7 15.8 Oct 2011 12.2 12.2 1.0 5.5 14.3 11.7 12.8 Nov 2011 9.8 9.6 .8 4.4 12.6 9.3 10.3 Dec 2011 6.3 6.1 1.0 -.3 11.0 5.6 7.1 Jan 2012 5.7 5.5 1.0 -.6 11.0 5.1 6.3
c. Weekend days only in month mean temperature (°C)
Mean Median Standard Deviation Minimum Maximum
Percentile 25
Percentile 75
Feb 2011 6.8 6.9 1.0 .3 8.7 6.4 7.6 Mar 2011 6.3 6.2 .7 .3 8.7 5.8 6.7 Apr 2011 12.3 12.3 1.1 6.4 15.6 11.6 12.8 May 2011 13.1 13.1 1.1 5.5 15.6 12.6 13.9 Jun 2011 14.3 14.2 1.0 7.0 16.3 13.8 14.8 Jul 2011 15.5 15.6 1.0 9.8 18.7 15.0 16.0 Aug 2011 15.5 15.5 1.1 8.5 17.8 14.8 16.1 Sep 2011 15.1 15.1 .9 9.9 16.9 14.7 15.6 Oct 2011 13.5 13.5 .8 7.4 15.7 13.1 13.9 Nov 2011 9.5 9.4 1.0 4.4 12.4 8.9 10.2 Dec 2011 6.1 5.9 .9 -.1 11.0 5.4 6.7 Jan 2012 5.4 5.3 1.1 -.7 11.0 4.8 6.1

36
2. Dwelling temperatures
a. All days in month
Living room mean temperature (°C)
Mean Median Standard Deviation Minimum Maximum
Percentile 25
Percentile 75
Feb 2011 19.0 19.2 2.4 9.7 27.1 17.4 20.6 Mar 2011 19.0 19.1 2.4 11.1 27.0 17.4 20.5 Apr 2011 20.0 20.1 1.9 14.3 27.9 18.8 21.3 May 2011 20.0 20.1 1.9 14.7 28.1 18.8 21.2 Jun 2011 20.9 20.9 1.7 15.8 28.1 19.7 21.9 Jul 2011 21.4 21.4 1.6 17.0 29.7 20.4 22.3 Aug 2011 21.5 21.5 1.5 17.2 28.5 20.5 22.5 Sep 2011 20.8 20.8 1.6 16.0 28.0 19.7 21.8 Oct 2011 20.1 20.3 1.8 14.4 27.8 18.9 21.3 Nov 2011 19.3 19.5 2.1 12.9 27.7 17.9 20.7 Dec 2011 18.6 18.8 2.6 9.9 27.5 16.9 20.3 Jan 2012 18.7 18.9 2.6 9.6 27.5 17.1 20.4
Hallway mean temperature (°C)
Mean Median Standard Deviation Minimum Maximum
Percentile 25
Percentile 75
Feb 2011 18.5 18.6 2.4 8.8 27.3 17.1 20.0 Mar 2011 18.6 18.6 2.3 10.6 27.3 17.0 20.1 Apr 2011 19.7 19.7 1.8 14.1 28.0 18.6 20.9 May 2011 19.7 19.7 1.8 14.7 28.2 18.4 20.8 Jun 2011 20.7 20.7 1.6 15.9 28.1 19.7 21.8 Jul 2011 21.3 21.3 1.4 16.8 28.5 20.3 22.2 Aug 2011 21.3 21.3 1.4 16.8 27.8 20.4 22.3 Sep 2011 20.5 20.5 1.5 15.8 27.3 19.5 21.5 Oct 2011 19.8 19.7 1.7 13.7 27.8 18.7 21.0 Nov 2011 18.9 19.0 2.1 12.0 28.4 17.6 20.2 Dec 2011 18.0 18.2 2.6 9.5 29.4 16.5 19.7 Jan 2012 18.2 18.4 2.6 9.6 29.4 16.7 19.9
Bedroom mean temperature (°C)
Mean Median Standard Deviation Minimum Maximum
Percentile 25
Percentile 75
Feb 2011 18.5 18.5 2.4 10.4 27.4 17.0 19.9 Mar 2011 18.8 18.9 2.3 11.6 28.0 17.4 20.2 Apr 2011 20.2 20.1 1.7 16.0 28.5 19.0 21.3 May 2011 20.1 20.1 1.7 15.4 28.0 18.9 21.1 Jun 2011 21.2 21.2 1.4 17.1 27.9 20.2 22.1 Jul 2011 21.7 21.7 1.3 18.2 28.5 20.8 22.6 Aug 2011 21.6 21.6 1.4 17.7 28.5 20.7 22.5 Sep 2011 20.7 20.7 1.5 15.8 28.0 19.7 21.7 Oct 2011 19.8 19.8 1.7 14.0 27.6 18.7 21.0 Nov 2011 18.8 18.8 2.1 11.7 27.1 17.5 20.1 Dec 2011 17.8 18.0 2.6 9.0 27.8 16.3 19.5 Jan 2012 18.1 18.2 2.6 9.0 28.0 16.5 19.7

37
Zone 2 mean temperature (°C)
Mean Median Standard Deviation Minimum Maximum
Percentile 25
Percentile 75
Feb 2011 18.5 18.6 2.3 9.7 26.8 17.3 19.9 Mar 2011 18.7 18.7 2.2 11.5 26.8 17.4 20.0 Apr 2011 20.0 20.0 1.7 14.1 27.8 18.9 21.0 May 2011 19.9 19.9 1.7 14.7 28.1 18.8 21.0 Jun 2011 21.0 21.0 1.4 16.2 28.0 20.0 21.9 Jul 2011 21.5 21.5 1.3 17.3 28.5 20.6 22.3 Aug 2011 21.5 21.5 1.3 17.4 28.2 20.7 22.3 Sep 2011 20.6 20.7 1.4 16.1 27.7 19.6 21.5 Oct 2011 19.8 19.8 1.6 13.8 27.4 18.8 20.9 Nov 2011 18.8 18.9 2.0 11.9 27.1 17.7 20.0 Dec 2011 17.9 18.1 2.5 9.5 27.8 16.5 19.5 Jan 2012 18.1 18.3 2.5 9.4 27.9 16.7 19.7
Dwelling mean temperature (°C)
Mean Median Standard Deviation Minimum Maximum
Percentile 25
Percentile 75
Feb 2011 18.7 18.7 2.2 9.8 26.9 17.3 20.1 Mar 2011 18.8 18.9 2.1 11.8 26.9 17.5 20.1 Apr 2011 20.0 20.0 1.7 14.3 27.9 18.9 21.1 May 2011 19.9 19.9 1.7 14.7 28.1 18.8 20.9 Jun 2011 20.9 21.0 1.4 16.2 28.0 20.0 21.9 Jul 2011 21.5 21.5 1.3 17.4 28.5 20.6 22.3 Aug 2011 21.5 21.5 1.3 17.4 28.3 20.5 22.3 Sep 2011 20.7 20.7 1.4 16.2 27.8 19.7 21.6 Oct 2011 19.9 20.0 1.6 14.0 27.5 18.8 20.9 Nov 2011 19.0 19.1 1.9 12.3 27.3 17.7 20.2 Dec 2011 18.1 18.2 2.4 9.7 27.1 16.7 19.7 Jan 2012 18.3 18.4 2.4 9.5 27.2 17.0 19.8
b. Weekdays only in month
Living room mean temperature (°C)
Mean Median Standard Deviation Minimum Maximum
Percentile 25
Percentile 75
Feb 2011 18.9 19.1 2.5 9.4 27.0 17.3 20.5 Mar 2011 19.0 19.1 2.4 10.9 27.0 17.4 20.4 Apr 2011 19.9 20.0 1.9 14.1 27.7 18.6 21.2 May 2011 19.9 20.0 1.9 14.7 28.2 18.7 21.1 Jun 2011 20.9 21.0 1.7 16.0 28.2 19.8 21.9 Jul 2011 21.4 21.5 1.6 17.0 29.9 20.5 22.4 Aug 2011 21.5 21.6 1.5 17.1 28.5 20.5 22.5 Sep 2011 20.7 20.7 1.6 15.9 28.0 19.6 21.7 Oct 2011 20.1 20.2 1.8 14.5 27.7 18.8 21.2 Nov 2011 19.3 19.4 2.1 12.8 27.6 17.8 20.6 Dec 2011 18.5 18.8 2.6 9.5 27.5 16.8 20.3 Jan 2012 18.6 18.9 2.6 9.5 27.5 17.0 20.3

38
Hallway mean temperature (°C)
Mean Median Standard Deviation Minimum Maximum
Percentile 25
Percentile 75
Feb 2011 18.4 18.6 2.5 8.8 27.3 16.9 19.9 Mar 2011 18.6 18.6 2.3 10.7 27.3 17.0 20.1 Apr 2011 19.6 19.5 1.8 14.0 27.7 18.4 20.8 May 2011 19.7 19.6 1.8 14.7 28.1 18.4 20.8 Jun 2011 20.8 20.7 1.6 16.0 28.2 19.7 21.8 Jul 2011 21.3 21.3 1.4 16.8 28.4 20.4 22.2 Aug 2011 21.4 21.4 1.4 16.8 27.9 20.4 22.3 Sep 2011 20.5 20.5 1.5 15.8 27.2 19.4 21.4 Oct 2011 19.7 19.7 1.7 13.8 27.8 18.6 20.9 Nov 2011 18.8 18.9 2.1 12.0 28.3 17.6 20.2 Dec 2011 18.0 18.3 2.6 9.7 29.5 16.4 19.7 Jan 2012 18.1 18.3 2.6 9.6 29.4 16.6 19.8
Bedroom mean temperature (°C)
Mean Median Standard Deviation Minimum Maximum
Percentile 25
Percentile 75
Feb 2011 18.4 18.5 2.4 10.3 27.4 17.0 19.8 Mar 2011 18.8 18.9 2.3 11.6 27.9 17.4 20.3 Apr 2011 20.0 20.0 1.7 15.8 28.3 18.9 21.1 May 2011 20.0 20.0 1.7 15.6 28.0 18.8 21.0 Jun 2011 21.3 21.3 1.5 17.2 27.9 20.3 22.2 Jul 2011 21.8 21.7 1.3 18.2 28.4 20.8 22.6 Aug 2011 21.7 21.7 1.4 17.8 28.5 20.7 22.6 Sep 2011 20.7 20.7 1.5 15.8 28.0 19.6 21.6 Oct 2011 19.7 19.7 1.7 14.0 27.5 18.7 20.9 Nov 2011 18.7 18.8 2.1 11.7 27.1 17.4 20.1 Dec 2011 17.8 17.9 2.6 9.1 27.8 16.3 19.5 Jan 2012 18.0 18.2 2.6 9.1 28.1 16.5 19.7
Zone 2 mean temperature (°C)
Mean Median Standard Deviation Minimum Maximum
Percentile 25
Percentile 75
Feb 2011 18.4 18.5 2.3 9.5 26.7 17.1 19.8 Mar 2011 18.7 18.7 2.2 11.6 26.8 17.4 20.0 Apr 2011 19.8 19.8 1.7 14.0 27.6 18.7 20.8 May 2011 19.8 19.8 1.7 14.7 28.1 18.7 20.9 Jun 2011 21.0 21.1 1.4 16.2 28.1 20.1 21.9 Jul 2011 21.6 21.5 1.3 17.3 28.4 20.7 22.3 Aug 2011 21.5 21.5 1.3 17.4 28.2 20.7 22.4 Sep 2011 20.6 20.6 1.4 16.1 27.6 19.6 21.4 Oct 2011 19.7 19.7 1.7 13.9 27.3 18.7 20.8 Nov 2011 18.8 18.8 2.0 11.9 27.0 17.6 20.0 Dec 2011 17.9 18.1 2.5 9.1 27.8 16.5 19.5 Jan 2012 18.1 18.2 2.5 9.3 27.9 16.6 19.7

39
Dwelling mean temperature (°C)
Mean Median Standard Deviation Minimum Maximum
Percentile 25
Percentile 75
Feb 2011 18.6 18.6 2.2 9.5 26.8 17.2 19.9 Mar 2011 18.8 18.9 2.1 11.9 26.8 17.4 20.1 Apr 2011 19.8 19.8 1.7 14.2 27.6 18.7 20.9 May 2011 19.9 19.9 1.7 14.7 28.1 18.7 20.9 Jun 2011 21.0 21.1 1.4 16.2 28.1 20.1 21.9 Jul 2011 21.5 21.5 1.3 17.4 28.5 20.6 22.3 Aug 2011 21.5 21.6 1.3 17.4 28.3 20.6 22.4 Sep 2011 20.6 20.7 1.4 16.1 27.7 19.6 21.5 Oct 2011 19.8 19.9 1.6 14.1 27.4 18.7 20.8 Nov 2011 19.0 19.1 1.9 12.2 27.2 17.7 20.1 Dec 2011 18.1 18.3 2.4 9.3 27.1 16.7 19.6 Jan 2012 18.3 18.4 2.4 9.4 27.2 16.8 19.7
c. Weekend days only in month
Living room mean temperature (°C)
Mean Median Standard Deviation Minimum Maximum
Percentile 25
Percentile 75
Feb 2011 19.3 19.4 2.4 10.4 27.1 17.8 20.9 Mar 2011 19.0 19.2 2.4 10.5 27.3 17.5 20.6 Apr 2011 20.3 20.4 1.9 14.6 28.5 19.1 21.5 May 2011 20.1 20.2 1.9 14.8 28.1 18.9 21.3 Jun 2011 20.7 20.8 1.7 15.5 28.0 19.6 21.7 Jul 2011 21.4 21.4 1.6 17.0 29.5 20.4 22.3 Aug 2011 21.4 21.4 1.5 17.1 28.3 20.4 22.3 Sep 2011 20.9 20.9 1.6 16.2 28.1 19.9 22.0 Oct 2011 20.3 20.4 1.8 14.1 28.0 19.1 21.4 Nov 2011 19.5 19.7 2.1 13.3 27.9 18.1 20.8 Dec 2011 18.6 18.8 2.6 10.7 27.4 17.0 20.4 Jan 2012 18.8 19.1 2.6 9.9 27.6 17.3 20.5
Hallway mean temperature (°C)
Mean Median Standard Deviation Minimum Maximum
Percentile 25
Percentile 75
Feb 2011 18.8 18.9 2.4 8.9 27.4 17.3 20.3 Mar 2011 18.6 18.7 2.4 10.4 27.2 17.0 20.1 Apr 2011 20.0 20.0 1.8 14.4 28.6 18.9 21.2 May 2011 19.8 19.8 1.8 14.9 28.2 18.6 21.0 Jun 2011 20.6 20.5 1.6 15.8 27.9 19.6 21.6 Jul 2011 21.3 21.3 1.4 16.8 28.6 20.3 22.1 Aug 2011 21.2 21.2 1.4 16.7 27.6 20.3 22.2 Sep 2011 20.7 20.7 1.5 15.8 27.5 19.6 21.7 Oct 2011 19.9 19.9 1.7 13.6 27.8 18.8 21.1 Nov 2011 19.0 19.2 2.1 12.2 28.7 17.7 20.3 Dec 2011 18.0 18.2 2.6 9.0 29.3 16.6 19.8 Jan 2012 18.3 18.5 2.6 9.6 29.3 16.8 19.8

40
Bedroom mean temperature (°C)
Mean Median Standard Deviation Minimum Maximum
Percentile 25
Percentile 75
Feb 2011 18.7 18.8 2.3 10.5 27.6 17.4 20.2 Mar 2011 18.8 18.8 2.4 11.3 28.2 17.3 20.4 Apr 2011 20.6 20.6 1.7 16.2 29.0 19.4 21.7 May 2011 20.2 20.2 1.7 14.8 27.9 19.0 21.2 Jun 2011 21.0 21.0 1.5 16.7 27.7 20.0 21.9 Jul 2011 21.7 21.7 1.4 18.0 28.5 20.8 22.5 Aug 2011 21.5 21.4 1.4 17.3 28.3 20.5 22.3 Sep 2011 20.9 20.9 1.5 15.7 28.0 19.9 21.9 Oct 2011 20.1 20.1 1.7 13.9 27.8 19.0 21.2 Nov 2011 18.9 19.0 2.1 11.8 27.3 17.6 20.3 Dec 2011 17.8 18.0 2.7 8.3 27.8 16.3 19.6 Jan 2012 18.2 18.4 2.6 8.8 28.0 16.7 19.8
Zone 2 mean temperature (°C)
Mean Median Standard Deviation Minimum Maximum
Percentile 25
Percentile 75
Feb 2011 18.7 18.9 2.2 10.3 26.9 17.6 20.0 Mar 2011 18.7 18.8 2.2 11.2 26.9 17.3 20.0 Apr 2011 20.3 20.3 1.6 14.4 28.4 19.2 21.3 May 2011 20.0 20.0 1.7 14.9 28.1 18.9 21.1 Jun 2011 20.8 20.8 1.4 16.0 27.8 19.8 21.7 Jul 2011 21.5 21.5 1.3 17.3 28.5 20.6 22.3 Aug 2011 21.3 21.3 1.3 17.3 27.9 20.5 22.2 Sep 2011 20.8 20.9 1.4 16.2 27.8 19.8 21.7 Oct 2011 20.0 20.0 1.6 13.8 27.6 19.0 21.0 Nov 2011 19.0 19.1 2.0 12.0 27.3 17.8 20.2 Dec 2011 17.9 18.1 2.5 9.2 27.7 16.5 19.5 Jan 2012 18.2 18.4 2.5 9.8 27.8 16.8 19.8
Dwelling mean temperature (°C)
Mean Median Standard Deviation Minimum Maximum
Percentile 25
Percentile 75
Feb 2011 18.9 19.0 2.1 10.4 27.0 17.6 20.3 Mar 2011 18.8 18.9 2.2 11.5 27.0 17.4 20.1 Apr 2011 20.3 20.3 1.6 14.6 28.4 19.2 21.4 May 2011 20.0 20.1 1.7 14.9 28.1 18.9 21.0 Jun 2011 20.8 20.8 1.5 16.0 27.9 19.8 21.7 Jul 2011 21.5 21.5 1.3 17.3 28.6 20.6 22.2 Aug 2011 21.3 21.4 1.4 17.3 28.1 20.4 22.2 Sep 2011 20.8 20.9 1.5 16.3 27.9 19.9 21.8 Oct 2011 20.1 20.1 1.6 13.9 27.7 19.0 21.1 Nov 2011 19.2 19.2 1.9 12.6 27.5 17.9 20.4 Dec 2011 18.1 18.3 2.4 9.7 27.0 16.7 19.7 Jan 2012 18.4 18.6 2.4 9.9 27.2 17.2 19.8

41
Scatter plot of mean room temperatures (°C) between rooms in January 2012
Base: All households in the EFUS 2011 temperature sample (n = 823)
Scatter plot of mean room temperatures (°C) between rooms in July 2011
Base: All households in the EFUS 2011 temperature sample (n = 823) Correlation coefficients of mean room temperatures between rooms in January 2012
Living Room Hallway Bedroom
Living room 1 0.699** 0.681**
Hallway 1 0.748**
Bedroom 1
Base: All households in the EFUS 2011 temperature sample. Unweighted sample (n=823). **. Correlation is significant at the 0.01 level (2-tailed).
Correlation coefficients of mean room temperatures between rooms in July 2011
Living Room Hallway Bedroom
Living room 1 0.807** 0.697**
Hallway 1 0.722**
Bedroom 1
Base: All households in the EFUS 2011 temperature sample. Unweighted sample (n=823). **. Correlation is significant at the 0.01 level (2-tailed).