Embed Size (px)
Citation preview

Notice of Intent Copperton Concentrator Projects
Prepared for
Kennecott Utah Copper LLC
Prepared by
March 2011
FINAL REPORT

F i n a l R e p or t
Notice of Intent for Copperton Concentrator Projects
Prepared for
Kennecott Utah Copper LLC
March 2011

\\SNOWBIRD\PROJ\KENNECOTTUTAHCOPPER\411826COPPERTON\NOI\FINAL iii
Contents
Acronyms and Abbreviations ................................................................................................... v
1.0 Introduction .................................................................................................................. 1-1
2.0 Process Description ..................................................................................................... 2-1 2.1 Ore Sorting Plant ............................................................................................. 2-1 2.2 Fifth Ore Grinding Line and Flotation Circuit ............................................ 2-1
3.0 Emissions Information ............................................................................................... 3-1 3.1 Ore Sorting Plant ............................................................................................. 3-1 3.2 Fifth Ore Grinding Line and Flotation Circuit ............................................ 3-2
3.2.1 Cold Solvent Degreasers ................................................................... 3-2 3.2.2 Conveyor Belt Transfer Points .......................................................... 3-2 3.2.3 Pebble Crusher .................................................................................... 3-3 3.2.4 Lime Bins ............................................................................................. 3-4 3.2.5 Diesel Dispensing ............................................................................... 3-4 3.2.6 Cooling Tower .................................................................................... 3-4
3.3 Emissions Summary ........................................................................................ 3-5
4.0 Regulatory Review ...................................................................................................... 4-1 4.1 State of Utah Air Permitting Requirements ................................................. 4-1
4.1.1 Notice of Intent and Approval Order (UAC R307-401) ................ 4-1 4.1.2 Enforceable Offsets (UAC R307-403-5, UAC R307-420,
and UAC R307-421) ............................................................................ 4-1 4.1.3 Emissions Impact Analysis (UAC R307-410) .................................. 4-2 4.1.4 Monitoring and Reporting ................................................................ 4-2
4.2 Federal Air Quality Permitting Requirements—New Source Performance Standards (40 CFR 60) ............................................................. 4-2 4.2.1 General Provisions for Standards of Performance for New
Sources (40 CFR 60, Subpart A) ........................................................ 4-2 4.2.2 Standards for Particulate Matter (40 CFR 60,
Subpart LL, 60.382) ............................................................................. 4-2 4.2.3 Monitoring and Testing (40 CFR 60,
Subpart LL, 60.384, 60.386) ................................................................ 4-3 4.2.4 Recordkeeping and Reporting (40 CFR 60,
Subpart LL, 60.385) ............................................................................. 4-3 4.2.5 Test Methods and Procedures (40 CFR 60,
Subpart LL, 60.386) ............................................................................. 4-3
5.0 Best Available Control Technology ......................................................................... 5-1 5.1 Ore Sorting Plant ............................................................................................. 5-1
5.1.1 Ore Sorting Plant ................................................................................ 5-1 5.1.2 Sample Preparation Building ............................................................ 5-2
CONTENTS (CONTINUED)
iv IS030211202228SLC\KUC - COPPERTON_NOI_FINAL.DOCX
5.2 Fifth Ore Grinding Line and Flotation Circuit ............................................ 5-2 5.2.1 Cooling Tower .................................................................................... 5-2 5.2.2 Lime Silos ............................................................................................ 5-3 5.2.3 Transfer Points .................................................................................... 5-3 5.2.4 Pebble Crusher .................................................................................... 5-4
6.0 References ..................................................................................................................... 6-1
Tables 3-1 Proposed Emissions from the Ore Sorting Plant 3-2 Proposed Emissions from the Sample Preparation Building 3-3 Proposed Emissions from Maintenance Degreasers 3-4 Proposed Emissions from Conveyor Belt Transfer Points 3-5 Proposed Emissions from the New Pebble Crusher 3-6 Proposed Emissions from the Lime Bins 3-7 Proposed Emissions from Diesel Dispensing 3-8 Proposed Emissions from Cooling Tower 3-9 Emissions Summary Figures 2-1 Site Location Map 2-2 Copperton Concentrator: Process Flow Diagram Appendix A Emissions Calculations

IS030211202228SLC\KUC - COPPERTON_NOI_FINAL.DOCX v
Acronyms and Abbreviations
AO Approval Order
BACT best available control technology
BCM Bingham Canyon Mine
CFR Code of Federal Regulations
EPA United States Environmental Protection Agency
ESP electrostatic precipitator
KUC Kennecott Utah Copper LLC
mg/L milligram per liter
N/A not applicable
NOI Notice of Intent
NOx nitrogen oxide
NSPS New Source Performance Standards
NSR New Source Review
PM particulate matter
PM10 particulate matter less than 10 micrometers in aerodynamic diameter
PM2.5 particulate matter less than 2.5 micrometers in aerodynamic diameter
PSD Prevention of Significant Deterioration
PTE potential to emit emissions
RBLC Reasonable Available Control Technology/Best Available Control Technology/Lowest Achievable Emission Rate Clearinghouse
SAG semiautogenous grinding
SO2 sulfur dioxide
tpy ton per year
UAC Utah Administrative Code
UDAQ Utah Division of Air Quality
VOC volatile organic compound

ACRONYMS AND ABBREVIATIONS (CONTINUED)
vi IS030211202228SLC\KUC - COPPERTON_NOI_FINAL.DOCX
THIS PAGE INTENTIONALLY LEFT BLANK

IS030211202228SLC\KUC - COPPERTON_NOI_FINAL.DOCX 1-1
1.0 Introduction
Kennecott Utah Copper LLC (KUC) is submitting this Notice of Intent (NOI) to modify an Approval Order (AO) for the Copperton Concentrator facility, located in Salt Lake County, Utah. Existing operations at the Copperton Concentrator are permitted under DAQE-AN0571029-10.
Through this NOI, KUC is proposing to add two new projects at the Copperton Concentrator facility:
• An ore sorting plant • A fifth ore grinding line and flotation circuit
This NOI document contains a process description for the proposed projects, emissions information, regulatory review, and control technology analysis. For additional information or questions, please contact Cassady Kristensen at (801) 204-2129.

NOTICE OF INTENT FOR COPPERTON CONCENTRATOR PROJECTS
1-2 IS030211202228SLC\KUC - COPPERTON_NOI_FINAL.DOCX
THIS PAGE INTENTIONALLY LEFT BLANK

IS030211202228SLC\KUC - COPPERTON_NOI_FINAL.DOCX 2-1
2.0 Process Description
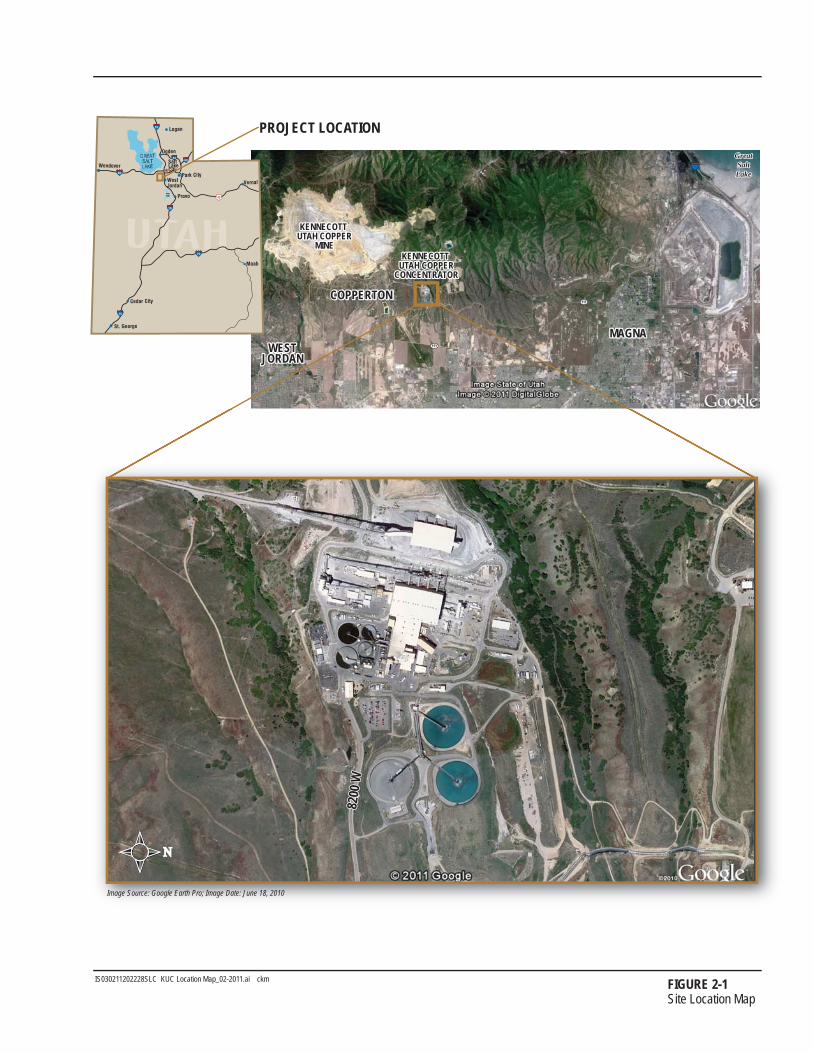
The Copperton Concentrator is located in Salt Lake County, Utah, near the town of Copperton. The concentrator is currently operating under AO DAQE-AN0571029-10, issued by the Utah Division of Air Quality (UDAQ). A location map is provided in Figure 2-1.
Through this NOI, KUC is proposing to add two new projects at the Copperton Concentrator facility:
• An ore sorting plant • A fifth ore grinding line and flotation circuit
2.1 Ore Sorting Plant KUC is proposing the installation of a new ore sorting plant at the Copperton Concentrator, as a pilot study. Ore crushed in the existing pebble crusher will be used as a feed for this pilot study. The wet material will be fed by a temporary conveyor belt from the existing pebble crushing system to a wet interim stockpile. The material will then be manually fed into a state-of-the-art proprietary sorter, located inside a building. Emissions from the sorting plant will be controlled with a baghouse. The sorter will sort the ore based on its size and create an “accepts” pile and a “rejects” pile. Emissions from the storage piles will be minimal, as they will be continuously sprayed with water and moved as necessary to the A-frame located at the Copperton Concentrator.
KUC is also proposing to add a new sample preparation building at the Copperton Concentrator. The sample preparation building will be used to “generate” samples for further testing by a laboratory. Small-scale operations such as grinding, crushing, and screening will result in emissions. Emissions from the sample preparation building will be controlled with a baghouse.
2.2 Fifth Ore Grinding Line and Flotation Circuit The existing Copperton Concentrator facility will be modified to accommodate ore throughput increasing from 160,000 tons per day to 232,900 tons per day, for a planned increase of 72,900 tons per day. Numerous modifications are required for the facility to handle the additional capacity. These modifications include the following:
• Extending the coarse ore storage pile
• Adding a fifth grinding line consisting of a semiautogenous grinding (SAG) mill and two ball mills complete with two cyclone clusters for separating the ore slurry
• Adding a new concentrator building
• Increasing the pebble crushing capacity of aggregate exiting the SAG mills
• Adding a new rougher-scavenger flotation circuit
NOTICE OF INTENT FOR COPPERTON CONCENTRATOR PROJECTS
2-2 IS030211202228SLC\KUC - COPPERTON_NOI_FINAL.DOCX
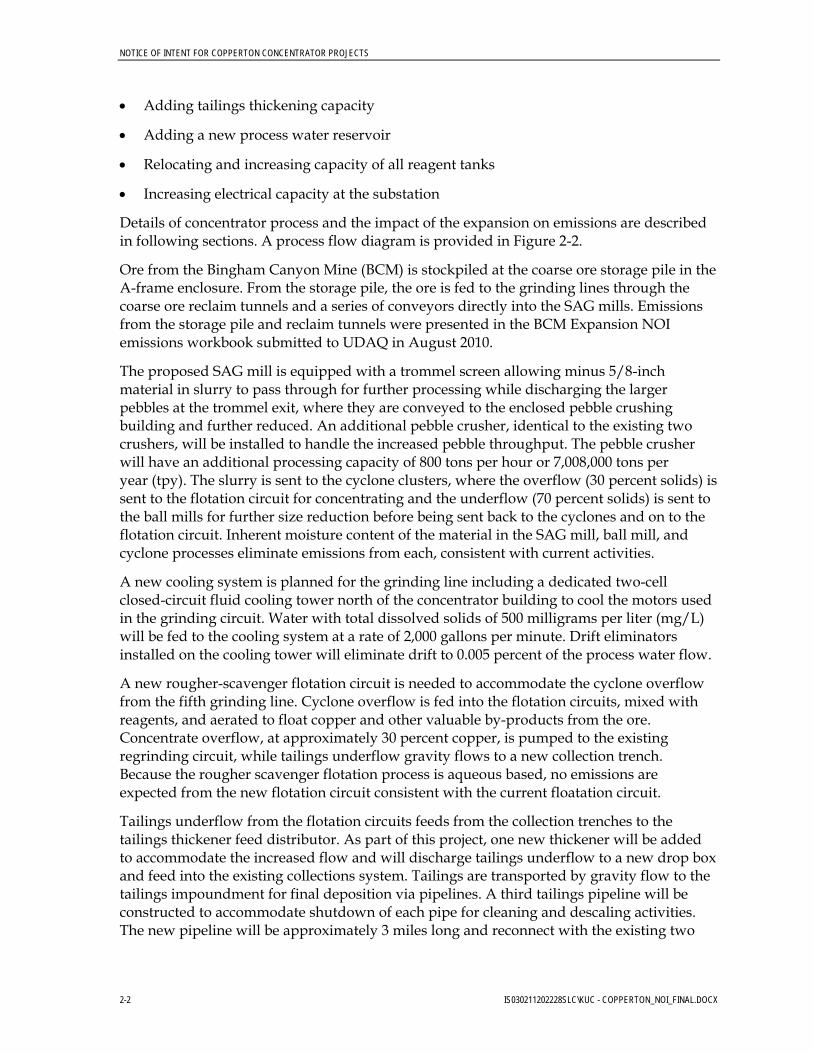
• Adding tailings thickening capacity
• Adding a new process water reservoir
• Relocating and increasing capacity of all reagent tanks
• Increasing electrical capacity at the substation
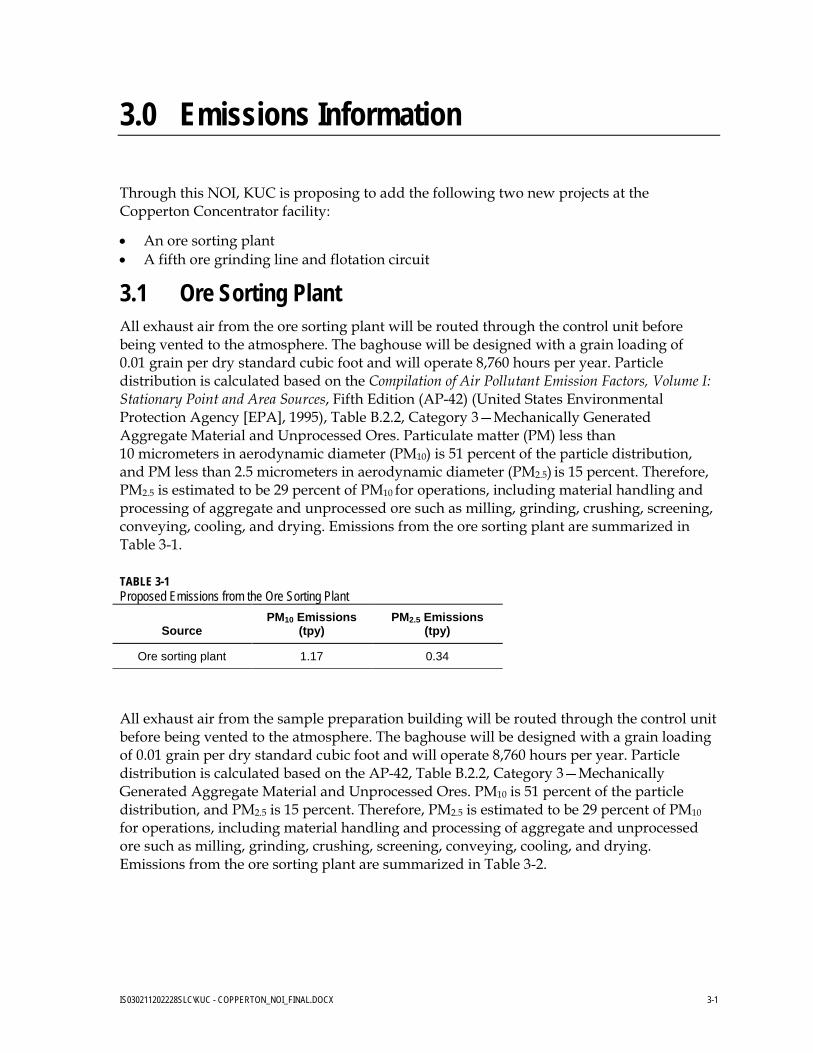
Details of concentrator process and the impact of the expansion on emissions are described in following sections. A process flow diagram is provided in Figure 2-2.
Ore from the Bingham Canyon Mine (BCM) is stockpiled at the coarse ore storage pile in the A-frame enclosure. From the storage pile, the ore is fed to the grinding lines through the coarse ore reclaim tunnels and a series of conveyors directly into the SAG mills. Emissions from the storage pile and reclaim tunnels were presented in the BCM Expansion NOI emissions workbook submitted to UDAQ in August 2010.
The proposed SAG mill is equipped with a trommel screen allowing minus 5/8-inch material in slurry to pass through for further processing while discharging the larger pebbles at the trommel exit, where they are conveyed to the enclosed pebble crushing building and further reduced. An additional pebble crusher, identical to the existing two crushers, will be installed to handle the increased pebble throughput. The pebble crusher will have an additional processing capacity of 800 tons per hour or 7,008,000 tons per year (tpy). The slurry is sent to the cyclone clusters, where the overflow (30 percent solids) is sent to the flotation circuit for concentrating and the underflow (70 percent solids) is sent to the ball mills for further size reduction before being sent back to the cyclones and on to the flotation circuit. Inherent moisture content of the material in the SAG mill, ball mill, and cyclone processes eliminate emissions from each, consistent with current activities.
A new cooling system is planned for the grinding line including a dedicated two-cell closed-circuit fluid cooling tower north of the concentrator building to cool the motors used in the grinding circuit. Water with total dissolved solids of 500 milligrams per liter (mg/L) will be fed to the cooling system at a rate of 2,000 gallons per minute. Drift eliminators installed on the cooling tower will eliminate drift to 0.005 percent of the process water flow.
A new rougher-scavenger flotation circuit is needed to accommodate the cyclone overflow from the fifth grinding line. Cyclone overflow is fed into the flotation circuits, mixed with reagents, and aerated to float copper and other valuable by-products from the ore. Concentrate overflow, at approximately 30 percent copper, is pumped to the existing regrinding circuit, while tailings underflow gravity flows to a new collection trench. Because the rougher scavenger flotation process is aqueous based, no emissions are expected from the new flotation circuit consistent with the current floatation circuit.
Tailings underflow from the flotation circuits feeds from the collection trenches to the tailings thickener feed distributor. As part of this project, one new thickener will be added to accommodate the increased flow and will discharge tailings underflow to a new drop box and feed into the existing collections system. Tailings are transported by gravity flow to the tailings impoundment for final deposition via pipelines. A third tailings pipeline will be constructed to accommodate shutdown of each pipe for cleaning and descaling activities. The new pipeline will be approximately 3 miles long and reconnect with the existing two

NOTICE OF INTENT FOR COPPERTON CONCENTRATOR PROJECTS
IS030211202228SLC\KUC - COPPERTON_NOI_FINAL 2-3
tailings pipelines, allowing tailings to be diverted to any of the three lines. Thickener overflow is pumped back to the process water reservoir. No emissions are anticipated from the tailings thickening operations consistent with current activities.
All of the existing reagent storage tanks will be demolished, and new larger tanks will be installed. Three 25,000-gallon tanks for the frother, collector, and fuel oil will be erected to the north of the existing tanks. A new lime slaking facility with two 1,250-ton lime bins, two 18.9-ton-per-hour vertical lime slaking mills, and four lime holding tanks will be installed further north of the existing lime slaking facility. The proposed lime bins will replace the current bins permitted under the BCM operating permit. The lime bins will have emissions associated with filling and loadout, as well as volatile organic compound (VOC) emissions that may exit the fuel oil tank. No emissions are expected from the other reagent tanks consistent with current activities.
Emission sources ancillary to the grinding line and flotation circuit include additional cold solvent degreasers for equipment maintenance.
In conclusion, emission sources associated with the new fifth grinding line and flotation circuit include cold solvent degreasers, a fuel oil tank, conveyor belt transfer points, a pebble crusher, two lime bins, and a cooling tower.

NOTICE OF INTENT FOR COPPERTON CONCENTRATOR PROJECTS
2-4 IS030211202228SLC\KUC - COPPERTON_NOI_FINAL.DOCX
THIS PAGE INTENTIONALLY LEFT BLANK
KENNECOTT KENNECOTT UTAH COPPERUTAH COPPER
CONCENTRATORCONCENTRATOR
KENNECOTT UTAH COPPER
CONCENTRATOR
KENNECOTT KENNECOTT UTAH COPPERUTAH COPPER
MINEMINE
KENNECOTT UTAH COPPER
MINE
GreatGreatSaltSaltLakeLake
GreatSaltLake
MAGNAMAGNAMAGNAWESTWEST
JORDANJORDANWEST
JORDAN
COPPERTONCOPPERTONCOPPERTON
FIGURE 2-1Site Location Map
Image Source: Google Earth Pro; Image Date: June 18, 2010
IS030211202228SLC KUC Location Map_02-2011.ai ckm
80
111
111
8200
W82
00 W
8200
W
UTAH
GREATSALTLAKE
UTAHLAKE
8084
80
15
15
40
15
70
Moab
Logan
Ogden
VernalPark City
Provo
WestJordan
WendoverSalt Lake City
Cedar City
St. George
PROJECT LOCATION

SAG Mills
Vibrating Screens
Pebble Crusher
Primary Ball Mills RougherCleaner Columns
2nd Cleaner Columns
1st Cleaner Columns
RegrindTower Mill
Rougher Scavenger Flotation
Tailings Thickeners
Copper - Moly Thickener
Moly RougherFlotation
Moly 1stCleanerFlotation
Tower Mills
Moly 2ndCleaner Columns
Moly 3rdCleaner Columns
Moly MechanicalScavenger Flotation
Moly Filteringand Drying
OreConcentrateTailings
IS030211202228SLC KUC Copperton Flowsheet_v1.ai MAR-11 ckm
LEGENDMoly Shipping
Pump Station
Moly 4thCleaner Columns
Moly 5thCleaner Columns
To TailingsImpoundment
Copper to Filtering, DryingSmelting and Refining
Tailings Line
RegrindBall Mill
MechanicalScavengers
FIGURE 2-2Copperton Concentrator: Process Flow Diagram
Ore Stockpile
GRINDING
BULK FLOTATION
MOLY PLANT
IS030211202228SLC\KUC - COPPERTON_NOI_FINAL.DOCX 3-1
3.0 Emissions Information
Through this NOI, KUC is proposing to add the following two new projects at the Copperton Concentrator facility:
• An ore sorting plant • A fifth ore grinding line and flotation circuit
3.1 Ore Sorting Plant All exhaust air from the ore sorting plant will be routed through the control unit before being vented to the atmosphere. The baghouse will be designed with a grain loading of 0.01 grain per dry standard cubic foot and will operate 8,760 hours per year. Particle distribution is calculated based on the Compilation of Air Pollutant Emission Factors, Volume I: Stationary Point and Area Sources, Fifth Edition (AP-42) (United States Environmental Protection Agency [EPA], 1995), Table B.2.2, Category 3—Mechanically Generated Aggregate Material and Unprocessed Ores. Particulate matter (PM) less than 10 micrometers in aerodynamic diameter (PM10) is 51 percent of the particle distribution, and PM less than 2.5 micrometers in aerodynamic diameter (PM2.5) is 15 percent. Therefore, PM2.5 is estimated to be 29 percent of PM10 for operations, including material handling and processing of aggregate and unprocessed ore such as milling, grinding, crushing, screening, conveying, cooling, and drying. Emissions from the ore sorting plant are summarized in Table 3-1.
TABLE 3-1 Proposed Emissions from the Ore Sorting Plant
Source PM10 Emissions
(tpy) PM2.5 Emissions
(tpy)
Ore sorting plant 1.17 0.34
All exhaust air from the sample preparation building will be routed through the control unit before being vented to the atmosphere. The baghouse will be designed with a grain loading of 0.01 grain per dry standard cubic foot and will operate 8,760 hours per year. Particle distribution is calculated based on the AP-42, Table B.2.2, Category 3—Mechanically Generated Aggregate Material and Unprocessed Ores. PM10 is 51 percent of the particle distribution, and PM2.5 is 15 percent. Therefore, PM2.5 is estimated to be 29 percent of PM10 for operations, including material handling and processing of aggregate and unprocessed ore such as milling, grinding, crushing, screening, conveying, cooling, and drying. Emissions from the ore sorting plant are summarized in Table 3-2.

NOTICE OF INTENT FOR COPPERTON CONCENTRATOR PROJECTS
3-2 IS030211202228SLC\KUC - COPPERTON_NOI_FINAL.DOCX
TABLE 3-2 Proposed Emissions from the Sample Preparation Building
Source PM10 Emissions
(tpy) PM2.5 Emissions
(tpy)
Sample preparation building 1.88 0.55
3.2 Fifth Ore Grinding Line and Flotation Circuit The fifth ore grinding line and flotation circuit will result in particulate emissions from material handling sources and VOC emissions from solvents and fuel oil.
Emission sources from the proposed project will include the following:
• Cold solvent parts washers • Conveyor belt transfer points • Pebble crusher • Lime bin • Diesel dispensing • Cooling tower
3.2.1 Cold Solvent Degreasers Two cold solvent degreasing units will be added to the Copperton Concentrator facility. The units will be housed in the new maintenance shop, with others placed strategically where logistics dictate frequent access to the parts cleaning machines. Approximately 500 gallons of cold solvent will be used annually for maintenance degreasing in the new units. As a conservative estimate, it is assumed that the cold solvent has a VOC content of 100 percent. For purposes of estimating emissions, a conservative estimate of one solvent change-out lost per year is assumed. The VOC emissions resulting from maintenance degreasing were estimated based on the solvent properties and a material balance. Emissions from the cold solvent degreasers are summarized in Table 3-3.
TABLE 3-3 Proposed Emissions from Maintenance Degreasers
Emission Source VOC Emissions
(tpy)
Maintenance degreasers 1.69
3.2.2 Conveyor Belt Transfer Points Additional conveyor belt transfer points are needed to move material from the reclaim tunnels into the new SAG mill. Two new transfer points (transfer from the pebble crusher onto the conveyor and transfer from the conveyor belt onto the SAG conveyor) are needed to accommodate the additional material flow, with emissions controlled by enclosures and/or water sprays as necessary. Based on preliminary design, the annual process rate for

NOTICE OF INTENT FOR COPPERTON CONCENTRATOR PROJECTS
IS030211202228SLC\KUC - COPPERTON_NOI_FINAL.DOCX 3-3
the transfer points described will be approximately 7,008,000 tpy and 34,675,000 tpy, respectively. Particulate emissions from the conveyor transfer points are estimated using emissions factors from Table 11.19.2-2 of AP-42. AP-42, Table B.2.2, Category 3—Mechanically Generated Aggregate Material and Unprocessed Ores, shows PM10 to be 51 percent of the particle distribution and PM2.5 to be 15 percent. Therefore PM2.5 is estimated to be 29 percent of PM10 for operations, including material handling and processing of aggregate and unprocessed ore such as milling, grinding, crushing, screening, conveying, cooling, and drying. Consistent with discussion in AP-42, Chapter 11.19.2, the moisture of the material will be greater than 2.88 percent to allow the use of controlled emission factors from this section.
In addition to transfer points feeding the SAG mill, transfer points within the pebble crushing building will need to increase in size and a new transfer point added upstream and downstream of the new pebble crusher to accommodate the increased material flow. All material exiting the SAG mill is completely saturated; therefore, no emissions are expected from the increased material throughput in any other transfer points at the facility. Emissions from the transfer points leading up to the SAG mill are summarized in Table 3-4.
TABLE 3-4 Proposed Emissions from Conveyor Belt Transfer Points
Source PM10 Emissions
(tpy) PM2.5 Emissions
(tpy)
Transfers 0.96 0.27
3.2.3 Pebble Crusher A third cone crusher is proposed to handle pebbles exiting the SAG mill that are greater than 5/8-inch diameter and require further size reduction before they can be pumped to the cyclone circuits. The pebbles are conveyed to a separate crushing building adjacent to the grinding building, as described previously. Particulate emissions from the pebble crusher are estimated using emissions factors from AP-42, Table 11.19.2-2. AP-42, Table B.2.2, Category 3—Mechanically Generated Aggregate Material and Unprocessed Ores, shows PM10 to be 51 percent of the particle distribution and PM2.5 to be 15 percent. Therefore, PM2.5 is estimated to be 29 percent of PM10 for operations, including material handling and processing of aggregate and unprocessed ore such as milling, grinding, crushing, screening, conveying, cooling, and drying. Consistent with the existing pebble crushers, a control efficiency of 90 percent is assumed for the building enclosure around the crusher. Material flow through the additional pebble crusher is projected to be 7,008,000 tpy or 800 tons per hour. Emissions from the new pebble crusher are summarized in Table 3-5.
TABLE 3-5 Proposed Emissions from the New Pebble Crusher
Source PM10 Emissions
(tpy) PM2.5 Emissions
(tpy)
Pebble crusher 7.57 2.23

NOTICE OF INTENT FOR COPPERTON CONCENTRATOR PROJECTS
3-4 IS030211202228SLC\KUC - COPPERTON_NOI_FINAL.DOCX
3.2.4 Lime Bins A new lime slaking facility with two 1,250-ton lime bins, two 18.9-ton-per-hour vertical lime slaking mills, and four lime holding tanks will be installed north of the existing lime slaking facility. The lime bins will be pneumatically loaded from tanker trucks on an ongoing basis, and particulate emissions will be controlled via fabric bin vent control units. All exhaust air from the lime silos is routed through the control units before being vented to the atmosphere. The two lime bins will have either two bin vent filters with an air flow of 2,000 dry standard cubic feet per minute each or a single bin vent filter with an air flow of 4,000 dry standard cubic feet per minute. The vent fabric filter will be designed with a grain loading of 0.01 grain per dry standard cubic foot and will operate 8,760 hours per year. The EPA’s AP-42, Table B.2.2, Category 4—Mechanically Processed Ores and Nonmetallic Minerals, shows PM10 to be 85 percent of the particle distribution and PM2.5 to be 30 percent. Therefore, PM2.5 is estimated to be 35 percent of PM10 for operations, including material handling and processing of processed ores and nonmetallic minerals such as lime. Emissions from the lime bins are summarized in Table 3-6.
TABLE 3-6 Proposed Emissions from the Lime Bins
Source PM10 Emissions
(tpy) PM2.5 Emissions
(tpy)
Lime bins 1.50 0.53
3.2.5 Diesel Dispensing The proposed modification will add a diesel dispensing station with approximately 500,000 gallons of diesel fuel per year. Volatile organic compound emissions from diesel fueling stations are estimated using emission factors from Colorado Department of Public Health and Environment’s guidance on Gasoline and Diesel Fuel Dispensing Stations in the absence of an EPA AP-42 factor. Volatile organic compound emissions from the fueling stations are summarized in Table 3-7.
TABLE 3-7 Proposed Emissions from Diesel Dispensing
Emission Source VOC Emissions
(tpy)
Diesel dispensing 0.01
3.2.6 Cooling Tower A new cooling system is planned to cool the engines employed at the grinding mills. The cooling tower will be a dedicated two-cell closed-circuit evaporative fluid cooler tower located to the north of the concentrator building. Water with total dissolved solids of 500 mg/L will be fed to the cooling system at a rate of 2,000 gallons per minute. The cooling tower will be equipped with drift eliminators capable of controlling drift to 0.005 percent of

NOTICE OF INTENT FOR COPPERTON CONCENTRATOR PROJECTS
IS030211202228SLC\KUC - COPPERTON_NOI_FINAL.DOCX 3-5
the process water flow. Particulate emissions from the cooling tower are estimated using factors from AP-42, Section 13.4-1, and from the article “Calculating Realistic PM10 Emissions from Cooling Towers” by J. Reisman and G. Frisbie (2002). Annual emissions from the cooling tower are summarized in Table 3-8.
TABLE 3-8 Proposed Emissions from Cooling Tower
Source PM10 Emissions
(tpy) PM2.5 Emissions
(tpy)
Cooling tower 0.09 0.09
3.3 Emissions Summary Table 3-9 summarizes the currently permitted Copperton Concentrator potential to emit emissions (PTE), the proposed modification PTEs, and pertinent emission rates and thresholds. Emissions from the proposed modification are below the modeling thresholds; therefore, no ambient air quality modeling is submitted with this NOI.
TABLE 3-9 Emissions Summary
Current PTEs (tpy)
Add: Ore Sorting Plant (tpy)
Add: Fifth Line (tpy)
Future Copperton
Concentrator PTEs (tpy)
PSD/NSR Significant Emission
Rates (tpy)
Modeling Thresholds
(UAC R307-410-4)
Nitrogen oxides 11.03 11.03 40 40
Carbon monoxide 10.18 10.18 100 100
Sulfur oxides 0.1 0.10 40 40
VOCs 2.36 1.70 4.06 40 40
Total PM10 21.58 3.05 10.12 34.74 15 –
Total PM2.5 21.85 0.90 3.11 25.86 N/A N/A
NOTES: N/A = Not Applicable NSR = New Source Review PSD = Prevention of Significant Deterioration UAC = Utah Administrative Code
NOTICE OF INTENT FOR COPPERTON CONCENTRATOR PROJECTS
3-6 IS030211202228SLC\KUC - COPPERTON_NOI_FINAL.DOCX
THIS PAGE INTENTIONALLY LEFT BLANK
IS030211202228SLC\KUC - COPPERTON_NOI_FINAL.DOCX 4-1
4.0 Regulatory Review
This section provides a regulatory review of the applicability of state and federal air quality permitting requirements for the Copperton Concentrator facility.
4.1 State of Utah Air Permitting Requirements The State of Utah has been granted authority to implement and enforce the permitting requirements specified by the federal Clean Air Act. The general requirements for permits and permit revisions are codified under the state environmental protection regulations, UAC R307-401.
4.1.1 Notice of Intent and Approval Order (UAC R307-401) The KUC Copperton Concentrator modification will result in an increase of emissions, necessitating the issuance of an AO pursuant to UAC R307-401, Permits. The KUC concentrator modification will not trigger Title V or major source NSR permitting. KUC is required by UAC R307-401 to submit to UDAQ this NOI application and obtain a UDAQ-issued AO prior to initiation of construction activities associated with concentrator modification.
According to UAC R307-401-5, the NOI must include the following:
• A description of the project (provided in Section 1.0 of the NOI)
• A description and characteristics of emissions and control equipment (provided in Sections 2.0 and 3.0 of the NOI)
• An analysis of the best available control technology (BACT) for the proposed source or modification (provided in Section 5.0 of the NOI)
• Location map (provided in Section 2.0 of the NOI)
4.1.2 Enforceable Offsets (UAC R307-403-5, UAC R307-420, and UAC R307-421) Utah Administrative Code R307-403-5(1)(b) states that enforceable offsets of 1.2:1 are required for new sources or modifications that would produce an emission increase greater than or equal to 50 tpy of any combination of PM10, sulfur dioxide (SO2), and nitrogen oxide (NOx).
Utah Administrative Code R307-403-5(1)(c) states that enforceable offsets of 1.1:1 are required for new sources or modifications that would produce an emissions increase greater than or equal to 25 tpy but less than 50 tpy of any combination of PM10, SO2, and NOx.
Utah Administrative Code R307-403-5(2) specifically states that for offset determinations, PM10, SO2, and NOx will be considered on an equal basis.

NOTICE OF INTENT FOR COPPERTON CONCENTRATOR PROJECTS
4-2 IS030211202228SLC\KUC - COPPERTON_NOI_FINAL.DOCX
The net change in the combined total emissions of PM10, SO2, and NOx from stationary point sources from the proposed modification, as indicated in Table 3-9, is less than 25 tpy. Therefore, this project will not require any offsets.
4.1.3 Emissions Impact Analysis (UAC R307-410) The Copperton Concentrator is not subject to UAC R307-410, which describes the emissions impact analysis requirements, since the emissions increases from the project do not trigger any modeling thresholds. Since the facility is located in a nonattainment area for PM10 and PM2.5, modeling is not required for these pollutants.
4.1.4 Monitoring and Reporting After UDAQ issues an AO, KUC will be required to submit emissions reports and conduct other activities as UDAQ requests. Some of these requirements include the following:
Meet the reporting requirements specified in UAC R307-107-2 in the event of an unavoidable breakdown
Submit and retain an air emission inventory as required in UAC R307-150-6, based on its applicability under UAC R307-150-3(3)
4.2 Federal Air Quality Permitting Requirements—New Source Performance Standards (40 CFR 60)
KUC’s Copperton Concentrator is a metallic mineral processing plant, one of the source categories subject to the New Source Performance Standards (NSPS), specifically 40 Code of Federal Regulations (CFR) 60, Subpart LL. The NSPS apply to any apparatus to which a standard is applicable that initiates construction or modification after August 24, 1982 (40 CFR 60, 60.380[b]). The new pebble crusher and conveyor belt transfer points are apparatuses to which Subpart LL standards are applicable.
4.2.1 General Provisions for Standards of Performance for New Sources (40 CFR 60, Subpart A)
Subpart A describes general provisions that are applicable to any source that is subject to NSPS. The KUC concentrator modification is subject to 40 CFR 60, Subpart LL, Standards of Performance for Metallic Mineral Processing Plants, and therefore subject to 40 CFR 60, Subpart A, the General Provisions for Standards of Performance for New Sources.
4.2.2 Standards for Particulate Matter (40 CFR 60, Subpart LL, 60.382) Particulate matter emissions resulting from the concentrator modification include process fugitive emissions from the new conveyor belt transfer points, storage bins, and pebble crushers. This equipment will be housed inside a building that will have a nonpassive building vent (that is, a vent with a fan). Process fugitive emissions are defined in 40 CFR 60.381 as PM emissions that are not collected by a capture system. A capture system is defined in 40 CFR 60.381 as equipment used to capture and transport PM to a control device. The fugitive emissions inside the building will not be captured and transported to a control device but will be vented to the atmosphere through the building vent. Therefore,

NOTICE OF INTENT FOR COPPERTON CONCENTRATOR PROJECTS
IS030211202228SLC\KUC - COPPERTON_NOI_FINAL.DOCX 4-3
the process fugitive emissions from the building vent will be subject to 40 CFR 60.382(b), which limits opacity of fugitive emissions to 10 percent.
Stack emissions are defined in 40 CFR 60.381 as PM captured and released to the atmosphere through a stack, chimney, or flue. The building vent of the building housing the crusher and transfer points will not have a stack, chimney, or flue. Therefore, 40 CFR 60 NSPS 60.382(a)(1) and (2), which restrict affected facility stack PM emissions to 0.05 gram per dry standard cubic meter and 7 percent opacity, do not apply to the concentrator modification.
4.2.3 Monitoring and Testing (40 CFR 60, Subpart LL, 60.384, 60.386) 40 CFR 60.384 describes requirements for the installation, operation, and continuous monitoring of the change in pressure of the gas stream through a scrubber and scrubbing liquid flow rates for any affected facility using a wet scrubbing emission control device. The concentrator modification will not include wet scrubbing emission control devices but instead bin vent filters on the lime bins; therefore, this rule does not apply.
4.2.4 Recordkeeping and Reporting (40 CFR 60, Subpart LL, 60.385) 40 CFR 60.385 requires affected facilities to conduct performance tests and submit written reports of the results of the tests to UDAQ as specified by 40 CFR 60, Subpart A, 60.8(a). KUC must comply with 40 CFR 60, Subpart A, 60.8 (a), which requires performance tests and a written report of the results of the performance tests be sent to UDAQ within 60 days after achieving the maximum production rate at which the affected facility will be operated, but not later than 180 days after initial startup of such facility.
4.2.5 Test Methods and Procedures (40 CFR 60, Subpart LL, 60.386) 40 CFR 60.386 requires that KUC determine compliance with the PM standard from 40 CFR 60.382, which restricts process fugitive emissions opacity to 10 percent, using Method 9.

NOTICE OF INTENT FOR COPPERTON CONCENTRATOR PROJECTS
4-4 IS030211202228SLC\KUC - COPPERTON_NOI_FINAL.DOCX
THIS PAGE INTENTIONALLY LEFT BLANK

IS030211202228SLC\KUC - COPPERTON_NOI_FINAL.DOCX 5-1
5.0 Best Available Control Technology
This section describes the BACT analysis for the new emissions sources that will be added as part of the proposed modification.
According to UAC R307-401-8, “The Executive Secretary will issue an approval order if the following conditions have been met: The degree of pollution control for emissions, to include fugitive emissions and fugitive dust, is at least best available control technology.”
5.1 Ore Sorting Plant 5.1.1 Ore Sorting Plant Particulate emissions will be emitted from the ore sorting plant. A BACT analysis for the proposed ore sorting plant is presented as follows:
• Step 1—Identify All Control Technologies. Three control technologies have been identified for particulate control:
– Electrostatic precipitators (ESPs) – Wet scrubbers – Fabric filters
• Step 2—Eliminate Technically Infeasible Options. All three control technologies are feasible to control particulate emissions from this source.
• Step 3—Rank Remaining Control Technologies by Control Effectiveness. The fabric filter is more effective at capturing fine particulate than an ESP because ESPs tend to collect larger particles selectively. Wet scrubbers, although effective at capturing fine particulate, produce a wet sludge requiring disposal. Also, wet scrubbers have higher operating costs and lower removal efficiencies than fabric filters. Based on their control effectiveness, the fabric filter ranks at the top, followed by an ESP and then by wet scrubbers.
• Step 4—Evaluate Most Effective Controls and Document Results. Since fabric filters represent the most effective particulate control technique, and since these fabric filters are proposed, no further evaluation is warranted.
• Step 5—Select BACT. In addition to this analysis, the EPA’s Reasonable Available Control Technology/BACT/Lowest Achievable Emission Rate Clearinghouse (RBLC) database was reviewed. Consequently, the BACT selected for this project is fabric filter/baghouse achieving an outlet grain loading 0.01 grain per dry cubic foot.

NOTICE OF INTENT FOR COPPERTON CONCENTRATOR PROJECTS
5-2 IS030211202228SLC\KUC - COPPERTON_NOI_FINAL.DOCX
5.1.2 Sample Preparation Building Particulate emissions will be emitted from the sample preparation building. A BACT analysis for the proposed sample preparation building is presented as follows:
• Step 1—Identify All Control Technologies. Three control technologies have been identified for particulate control:
– ESPs – Wet scrubbers – Fabric filters
• Step 2—Eliminate Technically Infeasible Options. All three control technologies are feasible to control particulate emissions from this source.
• Step 3—Rank Remaining Control Technologies by Control Effectiveness. The fabric filter is more effective at capturing fine particulate than an ESP because ESPs tend to collect larger particles selectively. Wet scrubbers, although effective at capturing fine particulate, produce a wet sludge requiring disposal. Also, wet scrubbers have higher operating costs and lower removal efficiencies than fabric filters. Based on their control effectiveness, the fabric filter ranks at the top, followed by an ESP and then by wet scrubbers.
• Step 4—Evaluate Most Effective Controls and Document Results. Since fabric filters represent the most effective particulate control technique, and since these fabric filters are proposed, no further evaluation is warranted.
• Step 5—Select BACT. In addition to this analysis, the EPA’s RBLC database was reviewed. Consequently, the BACT selected for this project is fabric filter/baghouse achieving an outlet grain loading 0.01 grain per cubic foot.
5.2 Fifth Ore Grinding Line and Flotation Circuit 5.2.1 Cooling Tower The following describes the BACT analysis for the proposed conventional design, draft force cooling tower system:
• Step 1—Identify All Control Technologies. The only control method for reducing particulate emissions from cooling towers is the use of drift eliminators.
• Steps 2, 3, and 4—Eliminate Technically Infeasible Options, Rank, and Evaluate. Drift eliminators were the only control technology identified. They are technically feasible and effective. Because there were no other control technologies identified, Steps 3 and 4 were not necessary.
• Step 5—Select BACT. Drift eliminators are the only control method identified for control of particulate emissions from cooling towers. Based on this analysis and the EPA’s RBLC database, drift eliminators with a control efficiency of 0.005 percent (gallons of drift per gallon of cooling water flow) are chosen as BACT for the cooling tower in this project.

NOTICE OF INTENT FOR COPPERTON CONCENTRATOR PROJECTS
IS030211202228SLC\KUC - COPPERTON_NOI_FINAL.DOCX 5-3
5.2.2 Lime Silos Particulate emissions will be emitted from the lime silos. A BACT analysis for the proposed lime silos is presented as follows:
• Step 1—Identify All Control Technologies. Three control technologies have been identified for particulate control:
– ESPs – Wet scrubbers – Fabric filters
• Step 2—Eliminate Technically Infeasible Options. All three control technologies are feasible to control particulate emissions from these sources.
• Step 3—Rank Remaining Control Technologies by Control Effectiveness. The fabric filter is more effective at capturing fine particulate than an ESP because ESPs tend to collect larger particles selectively. Wet scrubbers, although effective at capturing fine particulate, produce a wet sludge requiring disposal. Also, wet scrubbers have higher operating costs and lower removal efficiencies than fabric filters. Based on their control effectiveness, the fabric filter ranks at the top, followed by an ESP and then by wet scrubbers.
• Step 4—Evaluate Most Effective Controls and Document Results. Since fabric filters or bin vent filters represent the most effective particulate control technique, and since these bin vent filters are proposed, no further evaluation is warranted.
• Step 5—Select BACT. Based on this analysis and review of the EPA’s RBLC database, bin vent filters achieving an outlet grain loading 0.01 grain per dry standard cubic foot are selected as BACT for this project.
5.2.3 Transfer Points Particulate emissions will be emitted from the material transfer points from one conveyor to another. The following presents a BACT analysis for the proposed transfer points:
• Step 1—Identify All Control Technologies. Five control technologies have been identified for particulate control:
– ESPs – Wet scrubbers – Fabric filters – Water sprays – Enclosures
• Step 2—Eliminate Technically Infeasible Options. Because the emissions from the transfer points are fugitive in nature, ESPs, wet scrubbers, and fabric filters are not technically feasible.
• Step 3—Rank Remaining Control Technologies by Control Effectiveness. Both the enclosures and water sprays are effective in minimizing emissions from the transfer points.
NOTICE OF INTENT FOR COPPERTON CONCENTRATOR PROJECTS
5-4 IS030211202228SLC\KUC - COPPERTON_NOI_FINAL.DOCX
• Step 4—Evaluate Most Effective Controls and Document Results. Since both of the remaining control technologies are proposed, no further evaluation is warranted.
• Step 5—Select BACT. Based on this analysis and review of the EPA’s RBLC database, enclosures and/or water sprays are selected as BACT for this project.
5.2.4 Pebble Crusher Particulate emissions will be emitted from the pebble crusher, and this section presents a BACT analysis for the proposed pebble crusher.
• Step 1—Identify All Control Technologies. Five control technologies have been identified for particulate control:
– ESPs – Wet scrubbers – Fabric filters – Water sprays – Enclosures
• Step 2—Eliminate Technically Infeasible Options. Because the emissions will be vented from the building, ESPs, wet scrubbers, and fabric filters are not technically feasible. Water sprays are not feasible as the water makes the material too wet to crush.
• Step 3—Rank Remaining Control Technologies by Control Effectiveness. Enclosure, or placing the source inside the building, is effective in minimizing emissions from the crusher.
• Step 4—Evaluate Most Effective Controls and Document Results. Since the remaining control technologies are proposed, no further evaluation is warranted.
• Step 5—Select BACT. Based on this analysis and review of the EPA’s RBLC database, enclosures, or placing the emission source inside the building, is selected as BACT for this project.
IS030211202228SLC\KUC - COPPERTON_NOI_FINAL.DOCX 6-1
6.0 References
Colorado Department of Public Health and Environment. A Guide to Air Regulations for: Gasoline and Fuel Dispensing Stations. Small Business Assistance Program. Available at www.cdphe.state.co.us/ap/sbap/sbap_gasoline_guidance.pdf. Accessed January 21, 2011.
Reisman, J., and G. Frisbie. 2002. “Calculating Realistic PM10 Emissions from Cooling Towers.” Environmental Progress. Vol. 21, No. 2. pp. 127–130.
United States Environmental Protection Agency (EPA). 1995. Compilation of Air Pollutant Emission Factors, Volume I: Stationary Point and Area Sources. Fifth Edition. Office of Air Quality Planning and Standards; Office of Air and Radiation. January.

NOTICE OF INTENT FOR COPPERTON CONCENTRATOR PROJECTS
6-2 IS030211202228SLC\KUC - COPPERTON_NOI_FINAL.DOCX
THIS PAGE INTENTIONALLY LEFT BLANK

APPENDIX A
Emissions Calculations

Tables TitlesA-1 Copperton Concentrator Emissions SummaryA-2 Emissions Summaries for the Fifth Line Expansion Project and Ore Sorting ProjectA-3 Project: Fifth Line Expansion; Source: Cold Solvent Degreasing PartsA-4 Project: Fifth Line Expansion; Source: Pebble CrushersA-5 Project: Fifth Line Expansion; Source: Transfer PointsA-6 Project: Fifth Line Expansion; Source: Lime BinsA-7 Project: Fifth Line Expansion; Source: Diesel FuelingA-8 Project: Fifth Line Expansion; Source: Cooling TowerA-9 Project: Ore Sorting; Source: Ore Sorting Plant
A-10 Project: Ore Sorting; Source: Sample Preparation BuildingA-11 Facilitywide GHG Emissions
Units Definitionstpy ton per yeardscf dry standard cubic feet
dscfm dry standard cubic feet per minute
ft3 cubic feetgal gallongr grainhr hourkg kilogramlb pound
m3 cubic metermg/L milligram per liter
MMBtu million British thermal unitsppmw part per million by weight
yr year
Acronyms DefinitionsCO2 carbon dioxide
CO2e carbon dioxide equivalent
AP-42 Compilation of Air Pollutant Emission Factors, Volume I: Stationary Point and Area Sources , Fifth Edition (EPA, 1995)
GHG greenhouse gasHAP hazardous air pollutantKUC Kennecott Utah Copper LLC
MSDS material safety data sheetCH4 methane
NSR New Source ReviewN2O nitrous oxide
N/A not applicablePM particulate matter
PM10 particulate matter less than 10 micrometers in aerodynamic diameter
PM2.5 particulate matter less than 2.5 micrometers in aerodynamic diameter
PTE potential to emit emissionsPSD Prevention of Significant DeteriorationSAG semiautogenous grindingTDS total dissolved solids
TP Transfer PointEPA United States Environmental Protection Agency
UAC Utah Administrative Code
APPENDIX A INDEX
IS030211202228SLC\KUC - Concentrator5thLineEmissionCalcs_rev9.xlsx PAGE 1 OF 2

APPENDIX A INDEX
Acronyms DefinitionsUDAQ Utah Division of Air QualityVOC volatile organic compound
References
United States Environmental Protection Agency (EPA). 1995. Compilation of Air Pollutant Emission Factors, Volume I: Stationary Point and Area Sources . Fifth Edition. Office of Air Quality Planning and Standards; Office of Air and Radiation. January.
Colorado Department of Public Health and Environment. A Guide to Air Regulations for: Gasoline and Fuel Dispensing Stations . Small Business Assistance Program. Available at www.cdphe.state.co.us/ap/sbap/sbap_gasoline_guidance.pdf. Accessed January 21, 2011.Reisman, J., and G. Frisbie. 2002. “Calculating Realistic PM10 Emissions from Cooling Towers.” Environmental Progress . Vol. 21, No. 2. pp. 127–130.
IS030211202228SLC\KUC - Concentrator5thLineEmissionCalcs_rev9.xlsx PAGE 2 OF 2
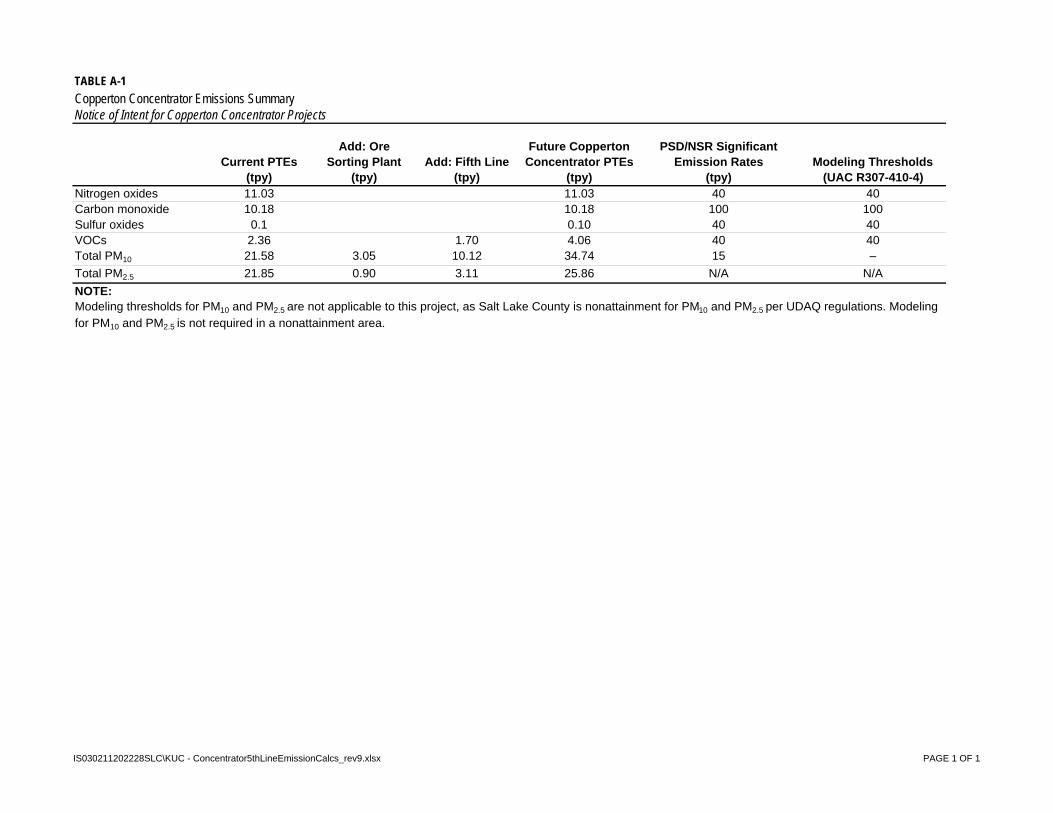
TABLE A-1
Copperton Concentrator Emissions SummaryNotice of Intent for Copperton Concentrator Projects
Current PTEs(tpy)
Add: Ore Sorting Plant
(tpy)Add: Fifth Line
(tpy)
Future Copperton Concentrator PTEs
(tpy)
PSD/NSR Significant Emission Rates
(tpy)Modeling Thresholds
(UAC R307-410-4)Nitrogen oxides 11.03 11.03 40 40Carbon monoxide 10.18 10.18 100 100Sulfur oxides 0.1 0.10 40 40VOCs 2.36 1.70 4.06 40 40Total PM10 21.58 3.05 10.12 34.74 15 –
Total PM2.5 21.85 0.90 3.11 25.86 N/A N/A
Modeling thresholds for PM10 and PM2.5 are not applicable to this project, as Salt Lake County is nonattainment for PM10 and PM2.5 per UDAQ regulations. Modeling for PM10 and PM2.5 is not required in a nonattainment area.
NOTE:
IS030211202228SLC\KUC - Concentrator5thLineEmissionCalcs_rev9.xlsx PAGE 1 OF 1

TABLE A-2
Emissions Summaries for the Fifth Line Expansion Project and Ore Sorting ProjectNotice of Intent for Copperton Concentrator Projects
Fifth Line Expansion Project
Source
PM10
(tpy)
PM2.5
(tpy)VOC(tpy)
Degreasers 1.69Pebble crusher 7.57 2.23SAG mill TPs 0.96 0.27Lime bin 1.50 0.53Fuel oil tank 0.01Cooling towers 0.09 0.09Total 10.12 3.11 1.70
Emissions Summary for the Ore Sorting Project
Source
PM10
(tpy)
PM2.5
(tpy)Ore sorting plant 1.17 0.34Sample preparation building 1.88 0.55Total 3.05 0.90
IS030211202228SLC\KUC - Concentrator5thLineEmissionCalcs_rev9.xlsx PAGE 1 OF 1
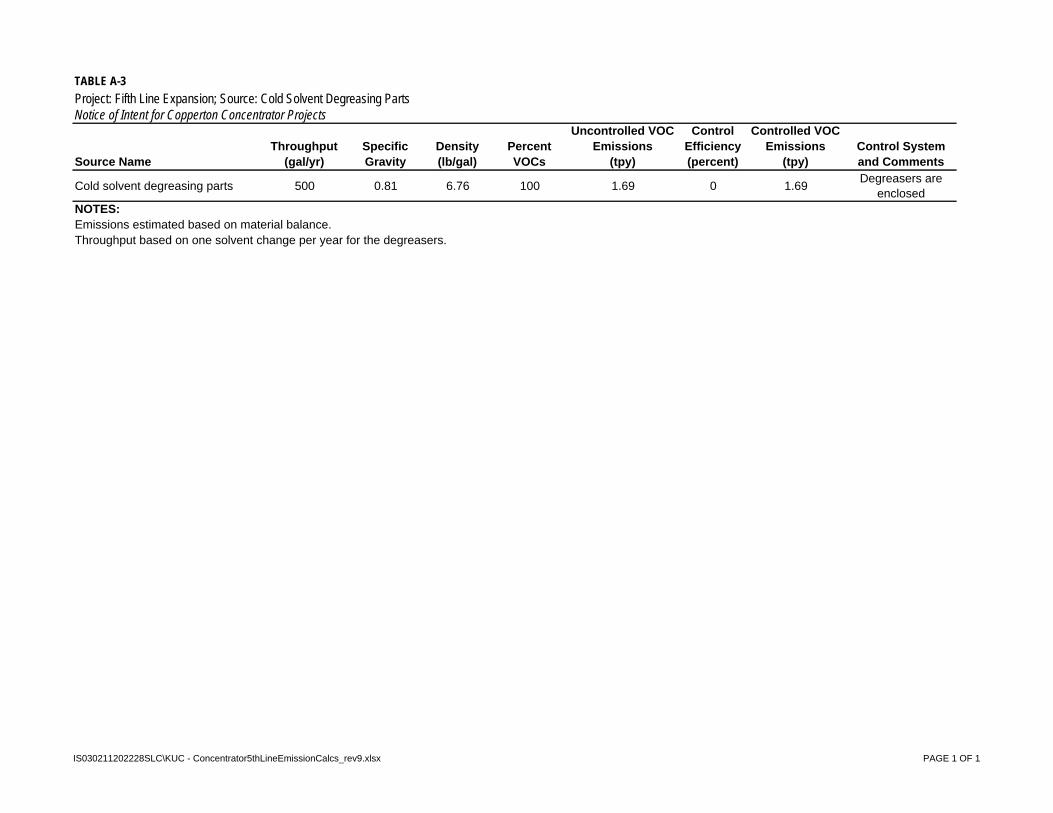
TABLE A-3
Project: Fifth Line Expansion; Source: Cold Solvent Degreasing PartsNotice of Intent for Copperton Concentrator Projects
Source NameThroughput
(gal/yr)Specific Gravity
Density(lb/gal)
Percent VOCs
Uncontrolled VOC Emissions
(tpy)
Control Efficiency(percent)
Controlled VOC Emissions
(tpy)Control System and Comments
Cold solvent degreasing parts 500 0.81 6.76 100 1.69 0 1.69Degreasers are
enclosedNOTES:Emissions estimated based on material balance.Throughput based on one solvent change per year for the degreasers.
IS030211202228SLC\KUC - Concentrator5thLineEmissionCalcs_rev9.xlsx PAGE 1 OF 1

TABLE A-4
Project: Fifth Line Expansion; Source: Pebble CrushersNotice of Intent for Copperton Concentrator Projects
Source Name
Number of New Pebble
Crushers
PM10 Emission
Factor(lb/ton)
PM2.5
Scaling Factor
PM2.5 Emission
Factor(lb/ton)
Process Flow Rate
(tpy)Control
Efficiency
PM10
Emissions(tpy)
PM2.5
Emissions(tpy)
Control System and Comments
Pebble crushers 1 0.0024 0.29 0.00071 7,008,000 90% 7.57 2.23The process is fully enclosed within a
buildingNOTES:Emissions for PM2.5 based on factors from AP-42, Table B.2.2, Category 3—Mechanically Generated Aggregate and Unprocessed Ores.
Wet suppression emission factors for PM10 and PM2.5 taken from AP-42, Chapter 11, Table 11.19.2-2 .
IS030211202228SLC\KUC - Concentrator5thLineEmissionCalcs_rev9.xlsx PAGE 1 OF 1

TABLE A-5
Project: Fifth Line Expansion; Source: Transfer PointsNotice of Intent for Copperton Concentrator Projects
Source Name
Number of Transfer Points
Annual Process Rate(tpy)
PM10 Emission
Factor(lb/ton)
PM2.5 Emission
Factor(lb/ton)
Enclosure PM10
Emissions(tpy)
Enclosure PM2.5
Emissions(tpy)
Control System and Comments
Transfer from crusher onto CNV-4
1 7,008,000 0.00005 0.00001 0.16 0.05Enclosures and water
spraysTransfer points leading to SAG mill
1 34,675,000 0.00005 0.00001 0.80 0.23Enclosures and water
spraysNOTES:Emission factors for controlled transfer points taken from AP-42, Chapter 11, Table 11.19.2-2
PM10 Emission Factor 4.60E-05 lb/ton
PM2.5 Emission Factor 1.30E-05 lb/tonWith the added water, the moisture of the material will be greater than 2.88 percent as referenced in AP-42, Chapter 11.19-2.
IS030211202228SLC\KUC - Concentrator5thLineEmissionCalcs_rev9.xlsx PAGE 1 OF 1
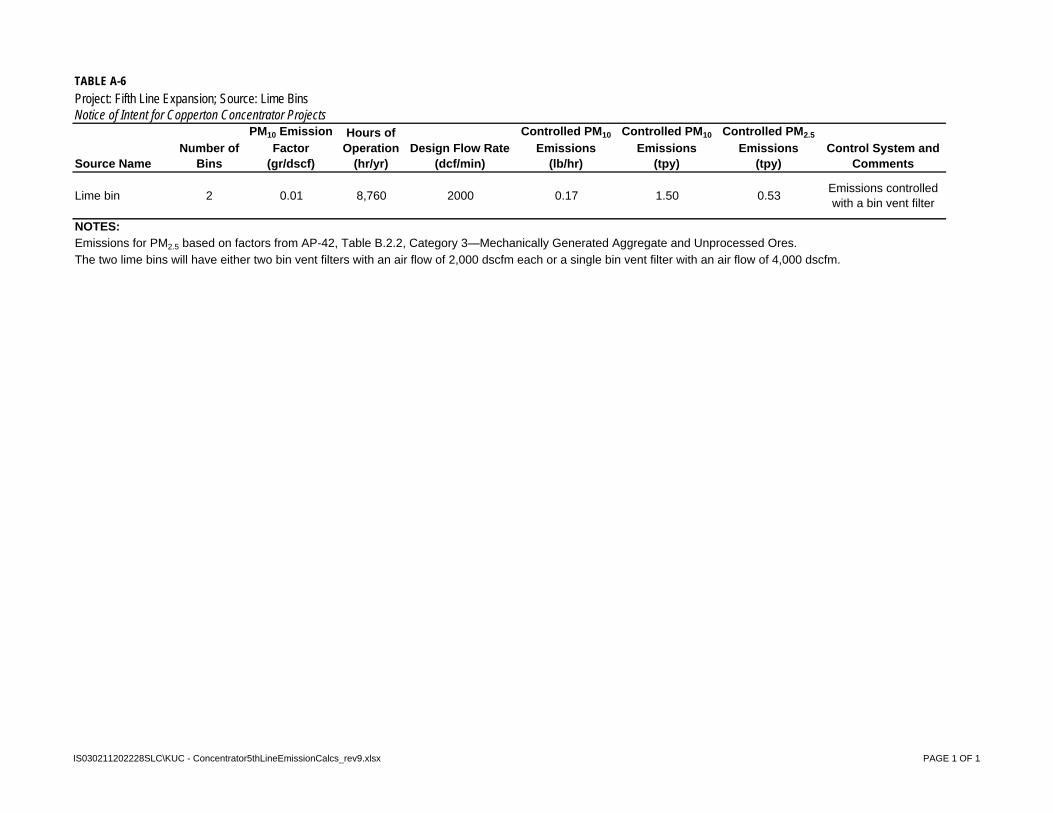
TABLE A-6
Project: Fifth Line Expansion; Source: Lime BinsNotice of Intent for Copperton Concentrator Projects
Source NameNumber of
Bins
PM10 Emission
Factor(gr/dscf)
Hours of Operation
(hr/yr)Design Flow Rate
(dcf/min)
Controlled PM10
Emissions(lb/hr)
Controlled PM10
Emissions(tpy)
Controlled PM2.5
Emissions(tpy)
Control System and Comments
Lime bin 2 0.01 8,760 2000 0.17 1.50 0.53Emissions controlled with a bin vent filter
NOTES:Emissions for PM2.5 based on factors from AP-42, Table B.2.2, Category 3—Mechanically Generated Aggregate and Unprocessed Ores.The two lime bins will have either two bin vent filters with an air flow of 2,000 dscfm each or a single bin vent filter with an air flow of 4,000 dscfm.
IS030211202228SLC\KUC - Concentrator5thLineEmissionCalcs_rev9.xlsx PAGE 1 OF 1

TABLE A-7
Project: Fifth Line Expansion; Source: Diesel FuelingNotice of Intent for Copperton Concentrator Projects
Source Name
Annual Throughput(1,000 gal/yr)
VOC Emissions(tpy)
Primary Control System and Comments
Diesel fueling 500 0.01 Submerged Pipe
NOTES:
VOC Emission Factor (lb/103
gal) 0.029
HAP Calculations
HAP ConcentrationEmissions
(tpy)
Toluene 0.5% 0.00004Naphthalene 0.5% 0.00004Total HAP emissions 0.00007NOTE:HAP concentration data obtained from the MSDS for diesel.
In the absence of an applicable AP-42 emission factor, the Colorado Department of Public Health and Environment guidance on emissions from service stations was used for estimating diesel dispensing emissions.
IS030211202228SLC\KUC - Concentrator5thLineEmissionCalcs_rev9.xlsx PAGE 1 OF 1

TABLE A-8
Project: Fifth Line Expansion; Source: Cooling TowerNotice of Intent for Copperton Concentrator ProjectsEmissionsWater flow rate (gal/minute) 2,000Flow of cooling water (lb/hr) 1,000,800 Calculated
TDS(1) of blowdown (mg/L or ppmw) 500Flow of dissolved solids (lb/hr) 500 Calculated
Fraction of flow producing PM10 drift(2) 0.800 See Note 2
Control efficiency(3) of drift eliminators (gal drift/gal flow) 0.00005PM emissions from tower (lb/hr) 0.025 CalculatedPM10 emissions from tower (lb/hr) 0.020 CalculatedPM emissions from tower (tpy) 0.110 CalculatedPM10 emissions from tower (tpy) 0.088 Calculated
PM2.5 emissions from tower (tpy) 0.088 CalculatedNOTES:Method from AP-42, Section13.4-1.
(3) Control efficiency taken from vendor supplied data for this type of cooling tower.
(1) TDS obtained from plant data.(2) From Reisman, and Frisbie, 2002.
IS030211202228SLC\KUC - Concentrator5thLineEmissionCalcs_rev9.xlsx PAGE 1 OF 1

TABLE A-9
Project: Ore Sorting; Source: Ore Sorting PlantNotice of Intent for Copperton Concentrator Projects
Source Name
PM10
Emission Factor
(gr/ft3)
Hours of Operation
(hr/yr)
Design Flow Rate
(m3/hr)
Design Flow Rate
(m3/minute)
Design Flow Rate
(ft3/minute)
PM10 Emissions
with Primary Control(lb/hr)
PM10 Emissions
with Primary Control
(tpy)
PM2.5 Emissions
with Primary Control
(tpy)Control System and
Comments
Ore sorting baghouse
0.01 8,760 5,292 88.2 3,115 0.27 1.17 0.34Emissions controlled
with a baghouse
NOTES:Grain loading based on engineering estimates and other air permitting work at KUC.
Emissions for PM2.5 based on factors from AP-42, Table B.2.2, Category 3—Mechanically Generated Aggregate and Unprocessed Ores.
Unit Conversion:
1 ft3/minute = 35.315 m3/minute
Air flow for the baghouse obtained from: Jan. 24, 2011 Revision A report from GR Engineering titled Kennecott Pilot Plant (Excluding Crushing and Stockpile) – Preliminary Design and Scoping Study (E-mailed 2/11/2010).
IS030211202228SLC\KUC - Concentrator5thLineEmissionCalcs_rev9.xlsx PAGE 1 OF 1

TABLE A-10
Project: Ore Sorting; Source: Sample Preparation BuildingNotice of Intent for Copperton Concentrator Projects
Source Name
PM10 Emission
Factor
(gr/ft3)
Hours of Operation
(hr/yr)
Design Flow Rate
(ft3/min)
PM10 Emissions
with Primary Control(lb/hr)
PM10 Emissions
with Primary Control
(tpy)
PM2.5 Emissions
with Primary Control
(tpy)Control System and
Comments
Sample preparation building baghouse
0.01 8,760 5,000 0.43 1.88 0.55Emissions controlled
with a baghouse
NOTES:Grain loading based on engineering estimates and other air permitting work at KUC.The proposed sample preparation building will be similar in size to that at the Bingham Canyon Mine.Emissions for PM2.5 based on factors from AP-42, Table B.2.2, Category 3—Mechanically Generated Aggregate and Unprocessed Ores.
IS030211202228SLC\KUC - Concentrator5thLineEmissionCalcs_rev9.xlsx PAGE 1 OF 1

TABLE A-11
Facilitywide GHG EmissionsNotice of Intent for Copperton Concentrator Projects
Fuel Type ConsumptionConsumption
UnitsCO2 Emission Factor(1)
(kg CO2/MMBtu)
CO2 Emissions
(metric tons/year)CH4 Emission Factor(2)
(kg CH4/MMBtu)
CH4 Emissions
(metric tons/year)N2O Emission Factor(2)
(kg N2O/MMBtu)
N2O Emissions
(metric tons/year)
CO2e Emissions
(metric tons/year)
CO2e Emissions
(short tons/year)
Natural gas 221,196 MMBtu 53.02 11,728 0.0011 0 0.00010 0 11,740 12,941Propane 2,872 gallons 61.46 16 0.003 0 0.0006 0 16 18
Total 11,756 12,959NOTES:Conversion factor for kg to metric tons: 0.001Global warming potentials:
CO2 1
CH4 21
N2O 310Default diesel heating value: 0.138 MMBtu/galDefault propane heating value: 0.091 MMBtu/galEmissions for GHGs are estimated for stationary sources from direct combustion of previously mentioned fuels at the concentrator.(1) CO2 Emission Factors from Table C-1 of the EPA's Mandatory Reporting Rule.(2) CH4 and N2O Emission Factors from Table C-2 of the EPA's Mandatory Reporting Rule.
IS030211202228SLC\KUC - Concentrator5thLineEmissionCalcs_rev9.xlsx PAGE 1 OF 1