Embed Size (px)
Citation preview
HispanicDemographics
Prepared by:
© 2012 Command Spanish®, Inc., 1

Hispanics are persons whose speech, customs or cultural
heritage pertain to, or derive from, any of the nineteen
Spanish-speaking countries in the world, and Puerto Rico.
Hispanics may speak only Spanish, be bilingual, speak only
minimal Spanish or English, or speak no Spanish at all.
Hispanics may be of any single or mixed racial origin. The
primary Hispanic groups in the U.S. are: Mexican, Mexican-
American, Cuban, Cuban-American, Puerto Rican, Dominican,
and Central American. The civil status of Hispanics may be:
U.S. born citizens, legal residents, visitors/tourists, or illegal
aliens (undocumented workers).
Who are Hispanics?
© 2012 Command Spanish®, Inc.
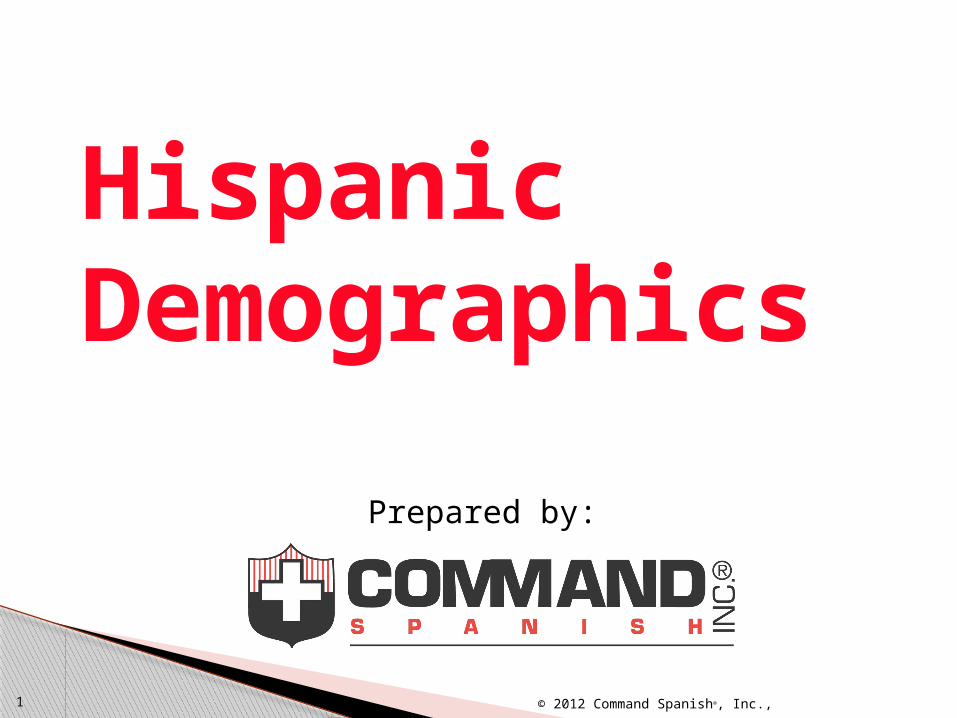
Mexican31,798,258
Central & South American 6,767,714Cuban 1,785,547Puerto Rican 4,623,716Dominican
1,414,703Other Hispanics
4,087,656TOTAL 50,477,594
The Hispanic Community:An Overview
Primary Hispanic Groups in the United States
SOURCE: U.S. CENSUS (2010)
2 3© 2012 Command Spanish®, Inc.

Hispanic Populations by State
Source: U.S. Census (2010)
CA 14,013,719
TX 9,460,921
NY 3,416,922
FL 4,223,806
IL 2,027,578
NJ 1,555,144
AZ 1,895,149
NM 953,403
CO 1,038,687
WA 755,790
GA 853,689
MA 627,654
PA 719,660
NV 716,501
NC 800,120
VA 631,825
MI 436,358
CT 479,087
OR 450,062
MD 470,632
OH 354,674
IN 389,707
UT 358,340
WI 336,056
KS 300,042
OK 332,007
MN 250,258
TN 290,059
MO 212,470
LA 192,560
ID 175,901
SC 235,682
NE 167,405
RI 130,655
AR 186,050
IA 151,544
AL 185,602
KY 132,836
D.C. 54,749
MS 81,481
4© 2012 Command Spanish®, Inc.

Source: U.S. Census (2010)
Metro Area Total Population Hispanic Population
New York, NY 8,175,133 2,336,076 Los Angeles, CA 3,792,621 1,838,822 Chicago, IL 2,695,598 778,862 Houston, TX 2,099,451 919,668 San Antonio, TX 1,327,407 838,952 Phoenix, AZ 1,445,632 589,877 Dallas, TX 1,197,816 507,309 San Diego, CA 1,307,402 376,020 San Jose, CA 945,942 313,636 El Paso, TX 649,121
523,7215© 2012 Command Spanish®, Inc.
Hispanic PopulationsBy U. S. Cities
(10 largest)

Source: U.S. Census (2010)
County Hispanic Population
Los Angeles County, CA 4.7 Million Miami-Dade County, FL 1.6 Million Harris County, TX 1.7 Million Cook County, IL 1.2 Million
Hispanic Populationsby U.S. Counties
(4 Largest)
6© 2012 Command Spanish®, Inc.

Sources: U.S. Census (2000) and the CIA - The World Factbook 2010
• Argentina
The Top 5 Spanish-SpeakingCountries
7© 2012 Command Spanish®, Inc.
• Colombia
• United States of
America
• Spain
• Mexico

Hispanic Populationsby Region
Source: U.S. Census (2010)
West (Hispanic Population -- 20,596,439)◦ Alaska, Arizona, California, Colorado, Hawaii, Idaho, Montana,
Nevada, New Mexico, Oregon, Utah, Washington, and Wyoming
South (Hispanic Population -- 18,227,508)◦ Alabama, Arkansas, Delaware, the District of Columbia, Florida,
Georgia, Kentucky, Louisiana, Maryland, Mississippi, North Carolina, Oklahoma, South Carolina, Tennessee, Texas, Virginia, and West Virginia
Northeast (Hispanic Population -- 6,991,969)◦ Connecticut, Maine, Massachusetts, New Hampshire, New Jersey,
New York, Pennsylvania, Rhode Island, and Vermont
Midwest (Hispanic Population -- 4,661,678)◦ Illinois, Indiana, Iowa, Kansas, Michigan, Minnesota, Missouri,
Nebraska, North Dakota, Ohio, South Dakota, and Wisconsin
8© 2012 Command Spanish®, Inc.

• In 2000, the Hispanic population was 35.3 million.
• In 2010, the Hispanic population was 50.5 million.
In the last decade,the Hispanic populationhas grown 43%…
Source: U.S. Census (2010)
9© 2012 Command Spanish®, Inc.
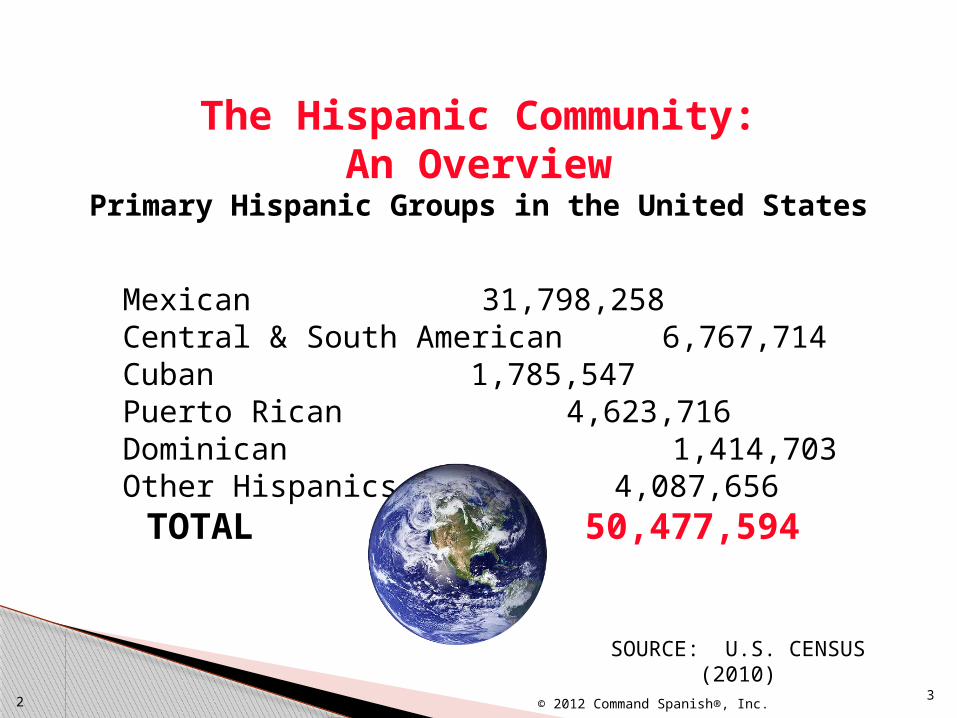
California
Texas
Florida
Over half of all Hispanicsin the United Stateslive in just three states…
Source: U.S. Census (2010)
10© 2012 Command Spanish®, Inc.

46.3%
New Mexico is the state with the highest concentration of Hispanics…
Source: U.S. Census (2010)
11© 2012 Command Spanish®, Inc.

White European
Indian
Mestizo
Black
Mulatto
Asian
Hispanic Racial Typesin the United States
6 12© 2012 Command Spanish®, Inc.

Hispanic Populations by Origin
Source: U.S. Census (2010)
13© 2012 Command Spanish®, Inc.

Hispanics in the Heartland
Number of Hispanics in Midwestern states in 2000 compared to 2010STATE 2000 2010 Increase
Illinois 1,530,262 2,027,578 32.5%
Michigan 323,877 436,358 34.7%
Ohio 217,123 354,674 63.4%
Indiana 214,536 389,707 81.7%
Wisconsin 192,921 336,056 74.2%
Kansas 188,252 300,042 59.4%
Missouri 118,592 212,470 79.2%
Minnesot a 143,382 250,258 74.5%
Nebraska 94,425 167,405 77.3%
Iowa 82,473 151,544 83.7%
Midwest 3,105,843 4,661,678 49.2%
Source: U.S. Census (2010)
14© 2012 Command Spanish®, Inc.

• In Washington state, 52,000 are needed to pick apples in September and October.
• In Florida, about 60,000 are used in citrus orchards and 30,000 are needed for winter vegetables.
• In California, 55,000 harvest table grapes and 20,000 pick strawberries.
• In Michigan, 50,000 harvest apples, cherries, sugar beets and other crops.
15© 2012 Command Spanish®, Inc.
Migrant Laborers in U.S. Agriculture

The DHS estimates that there are currently
13 million un-authorized immigrants
from Latin America residing in the United
States.
16© 2012 Command Spanish®, Inc.

Each day1,000,000 people
cross the U.S./Mexican border
legally.
17© 2012 Command Spanish®, Inc.

• 1,952 miles long
• Longest border between 1st World and 3rd World countries
• 9 U.S. Border Patrol sectors
• 40 Ports of Entry (POEs)
• 20,000 active Border Patrolmen
• Busiest border crossing in the world for illegal immigrants
Facts about theU.S./Mexican Border
18© 2012 Command Spanish®, Inc.

19© 2012 Command Spanish®, Inc.

The end!¡Fin!
© 2012 Command Spanish®, Inc.
![Introductory video [click here] Black Hispanics? “Hispanics come in all colors and shapes. There are Asian Hispanics, white Hispanics, black Hispanics](https://img.pdfslide.us/doc/110x75/56649c825503460f9493a192/introductory-video-click-here-black-hispanics-hispanics-come-in-all-colors.jpg)