Embed Size (px)
Citation preview
REPUBLIC OF THE PHILIPPINES DEPARTMENT OF PUBLIC WORKS AND HIGHWAYS (DPWH)
PREPARATORY SURVEY FOR EXPRESSWAY PROJECTS
IN MEGA MANILA REGION
NAIA EXPRESSWAY PROJECT (Phase II)
FINAL REPORT
APPENDIX-III NAIA EXPRESSWAY CORRIDR ALTERNATIVE STUDY
NOVEMBER 2012
JAPAN INTERNATIONAL COOPERATION AGENCY (JICA)
CTI ENGINEERING INTERNATIONAL CO., LTD
MITSUBISHI RESEARCH INSTITUTE, INC.
ORIENTAL CONSULTANTS CO., LTD
METROPOLITAN EXPRESSWAY CO., LTD EI
CR(3)
12-144(4)
NLEX Configuration
1. How NAIAx will be used? 2. Other Alternatives for NAIAx Corridor
2.1. Scheme-1: Grade Separation (or Flyover) Scheme of Critical Intersection 2.1.1. Roxas Blvd./MIA (NAIA) Road Intersection
1) Existing Intersection Traffic 2) Grade Separation Scheme
2.1.2. MIA Road/Domestic Road/Sucat Road Intersection 1) Existing Intersection Traffic 2) Comparison of Alternatives
2.1.3. Andrews Ave./Tramo Road (Aurora Ave.) Intersection 1) Existing Intersection Traffic 2) Grade Separation Scheme
2.1.4. Summary 2.2. Traffic Condition Comparison (NAIAx vs.Grade Separation)
2.2.1. Traffic Volume of NAIAx Corridor At-grade Road without NAIAx 2.2.2. NAIAx Corridor Traffic Volume: With/Without NAIAx 2.2.3. Travel Time, Travel Speed, and Travel Time Saving: Year 2015
2.3. Other NAIAx Alignment Alternatives 2.3.1. Paranaque River and Airport Road Scheme 2.3.2. Crossing MIAA Compound Scheme
3. NAIAx vs. C-5 Extension 3.1. Present Condition of C-5 Extension Corridor 3.2. Traffic Impacts of C-5 Extension to NAIAx or Vis-a-Vis
3.2.1. Traffic Volume on NAIAx and C-5 Extension 3.2.2. Traffic Impacts of C-5 Extension to NAIAx or Vis-a-Vis
3.3. C-5 Extension as Toll Road 3.3.1. C-5 Extension Alternative Alignments (Toll Road) 3.3.2. Connection with Skyway 3.3.3. Issues at the Connection Between C-5 Extension and Skyway
3.4. C-5 Extension as National Road 3.4.1. C-5 Extension Alternative Alignments
3.5. Comparison of Three Alternatives 4. Summary and Recommendation
4.1. How NAIAx will be used? 4.2. Grade Separation of Major Intersections Along NAIAx Corridor 4.3. Traffic Efficiency (Grade Separation vs. NAIAx) 4.4. C-5 Extension 4.5. Comparison of Cost and Implementation Schedule

Page 1
NAIAX CONFIGURATION
1. How NAIAX Will Be Used?
EAST + WEST Bound Total
Total Traffic Volume : 54,445 (100%) Through Traffic Volume : 14,188 (26.1%)
Terminal Related Traffic : 20,555 (37.8%)Megaworld and other related Traffic: 19,702 (36.5%)
TRAFFIC ON NAIAX
Page 2
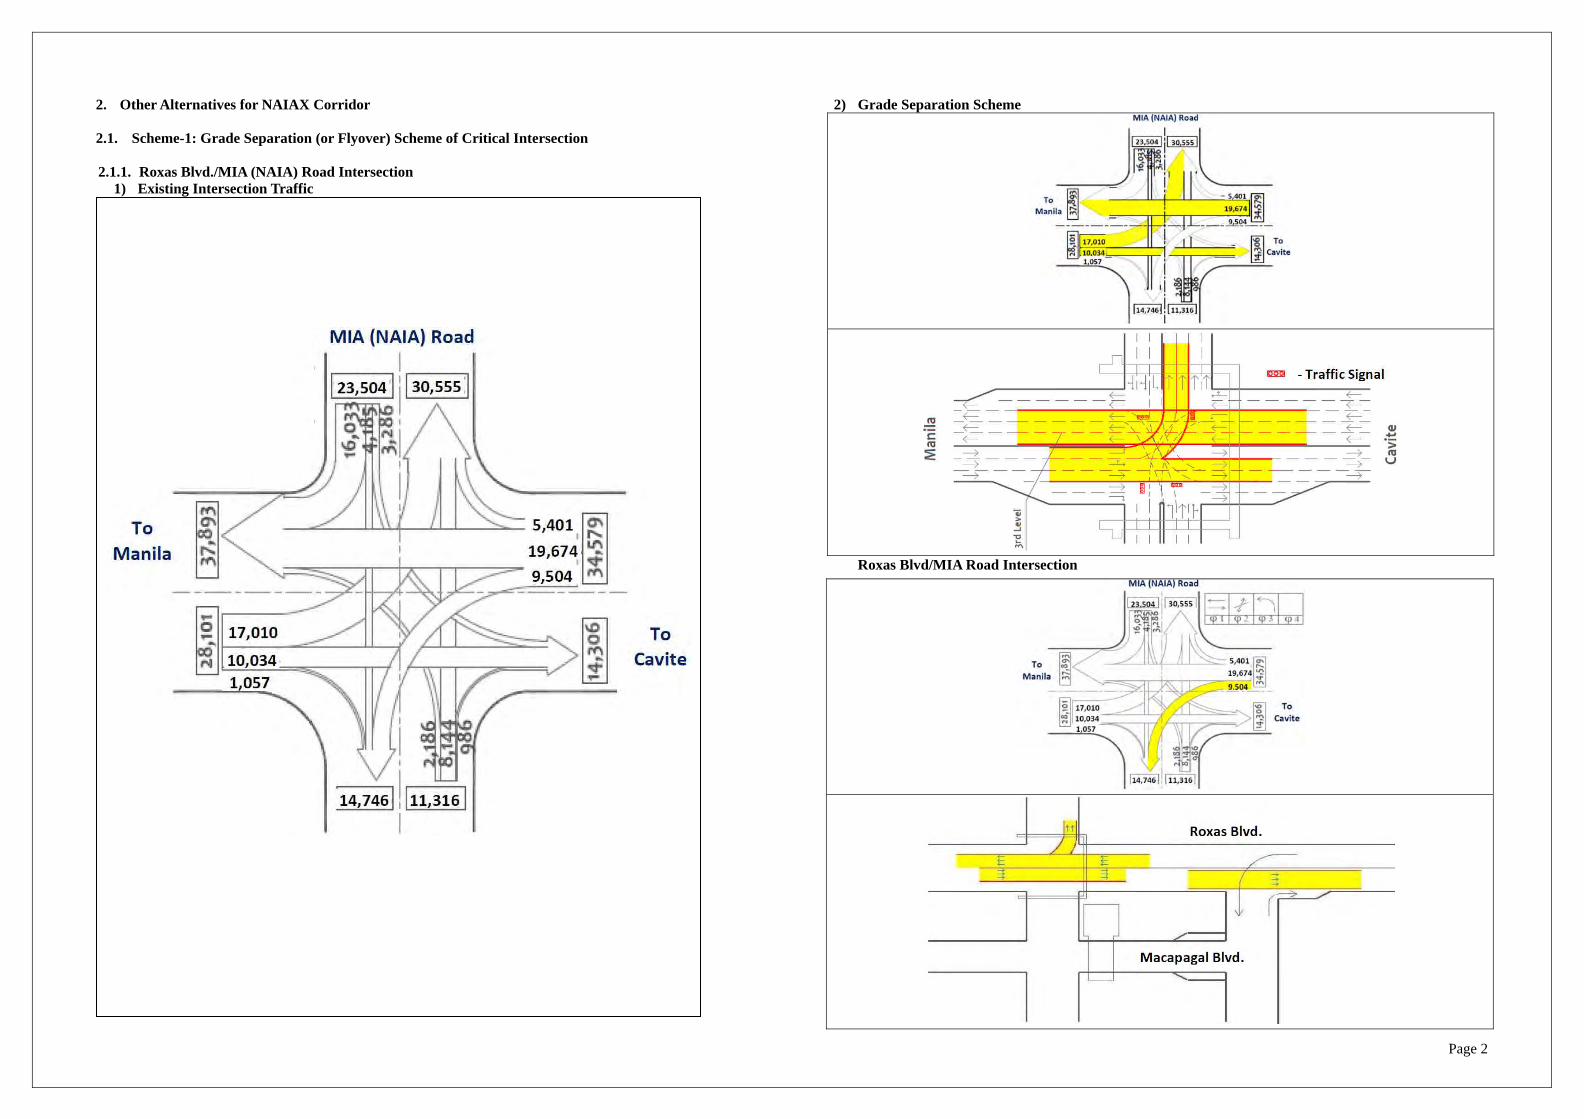
2. Other Alternatives for NAIAX Corridor
2.1. Scheme-1: Grade Separation (or Flyover) Scheme of Critical Intersection
2.1.1. Roxas Blvd./MIA (NAIA) Road Intersection 1) Existing Intersection Traffic
2) Grade Separation Scheme
Roxas Blvd/MIA Road Intersection
Page 3
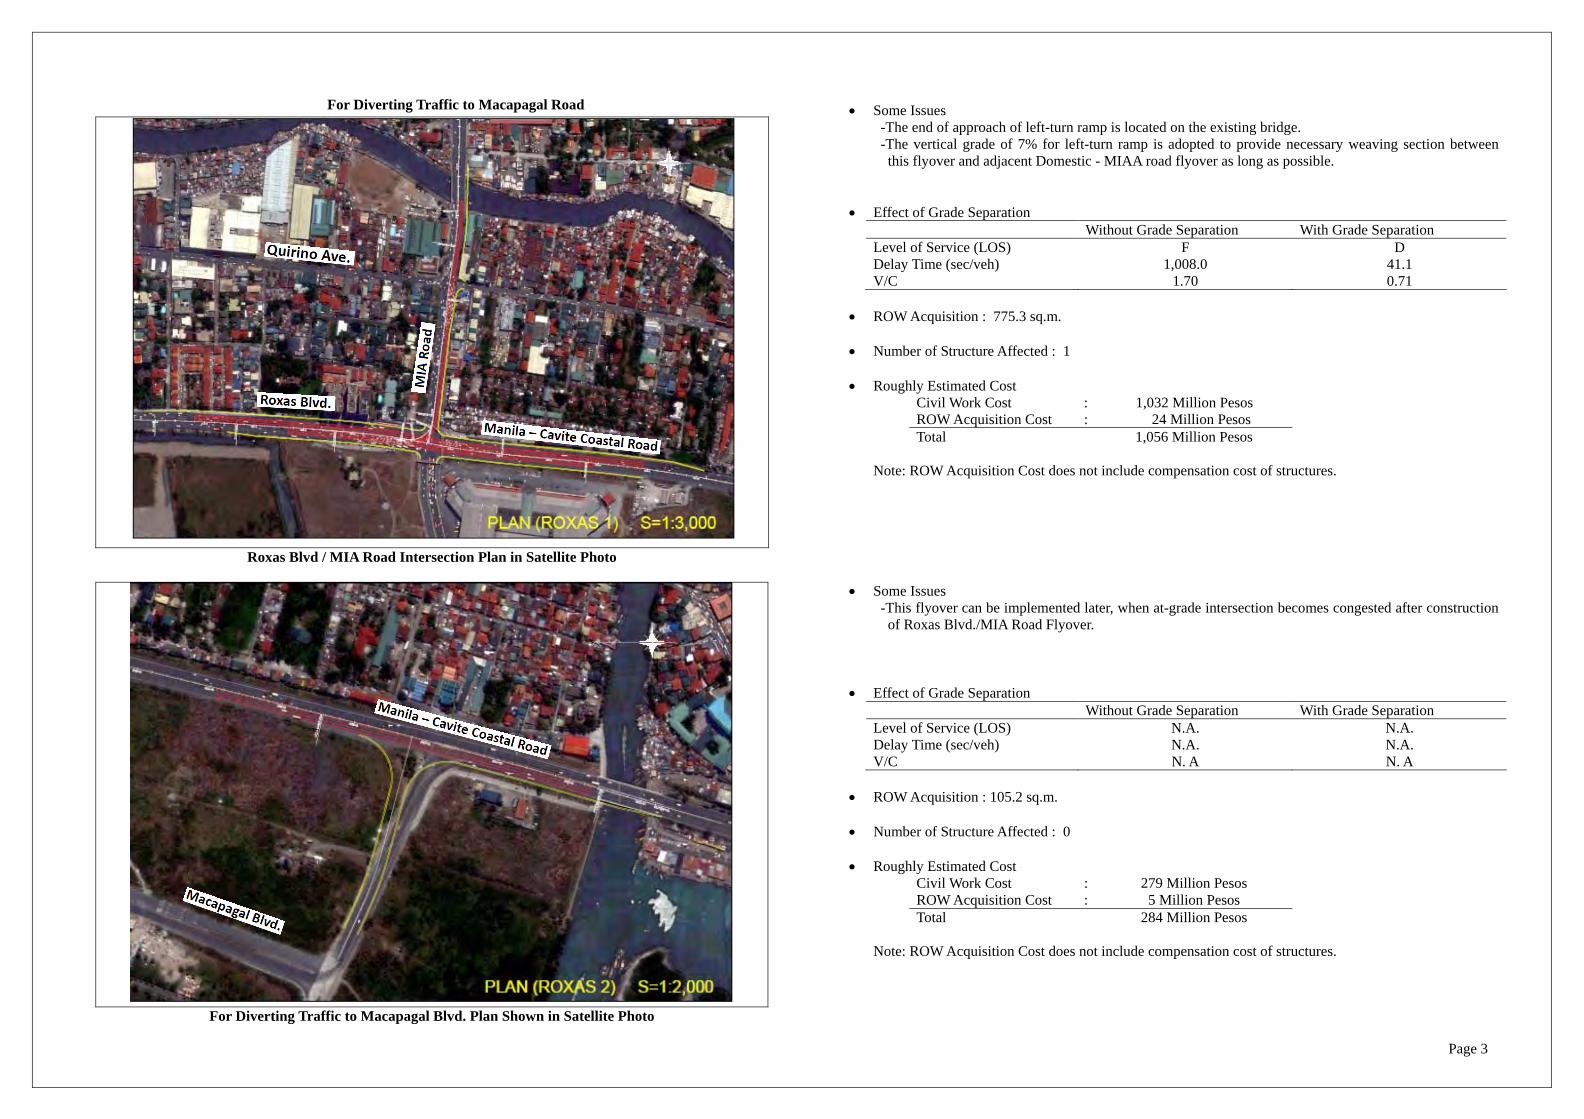
For Diverting Traffic to Macapagal Road
Roxas Blvd / MIA Road Intersection Plan in Satellite Photo
For Diverting Traffic to Macapagal Blvd. Plan Shown in Satellite Photo
Some Issues
-This flyover can be implemented later, when at-grade intersection becomes congested after construction of Roxas Blvd./MIA Road Flyover.
Effect of Grade Separation Without Grade Separation With Grade Separation Level of Service (LOS) N.A. N.A. Delay Time (sec/veh) V/C
N.A. N. A
N.A. N. A
ROW Acquisition : 105.2 sq.m.
Number of Structure Affected : 0
Roughly Estimated Cost
Civil Work Cost : 279 Million Pesos ROW Acquisition Cost : 5 Million Pesos Total 284 Million Pesos
Note: ROW Acquisition Cost does not include compensation cost of structures.
Some Issues -The end of approach of left-turn ramp is located on the existing bridge. -The vertical grade of 7% for left-turn ramp is adopted to provide necessary weaving section between this flyover and adjacent Domestic - MIAA road flyover as long as possible.
Effect of Grade Separation Without Grade Separation With Grade Separation Level of Service (LOS) F D Delay Time (sec/veh) V/C
1,008.0 1.70
41.1 0.71
ROW Acquisition : 775.3 sq.m.
Number of Structure Affected : 1
Roughly Estimated Cost
Civil Work Cost : 1,032 Million Pesos ROW Acquisition Cost : 24 Million Pesos Total 1,056 Million Pesos
Note: ROW Acquisition Cost does not include compensation cost of structures.
Page 4
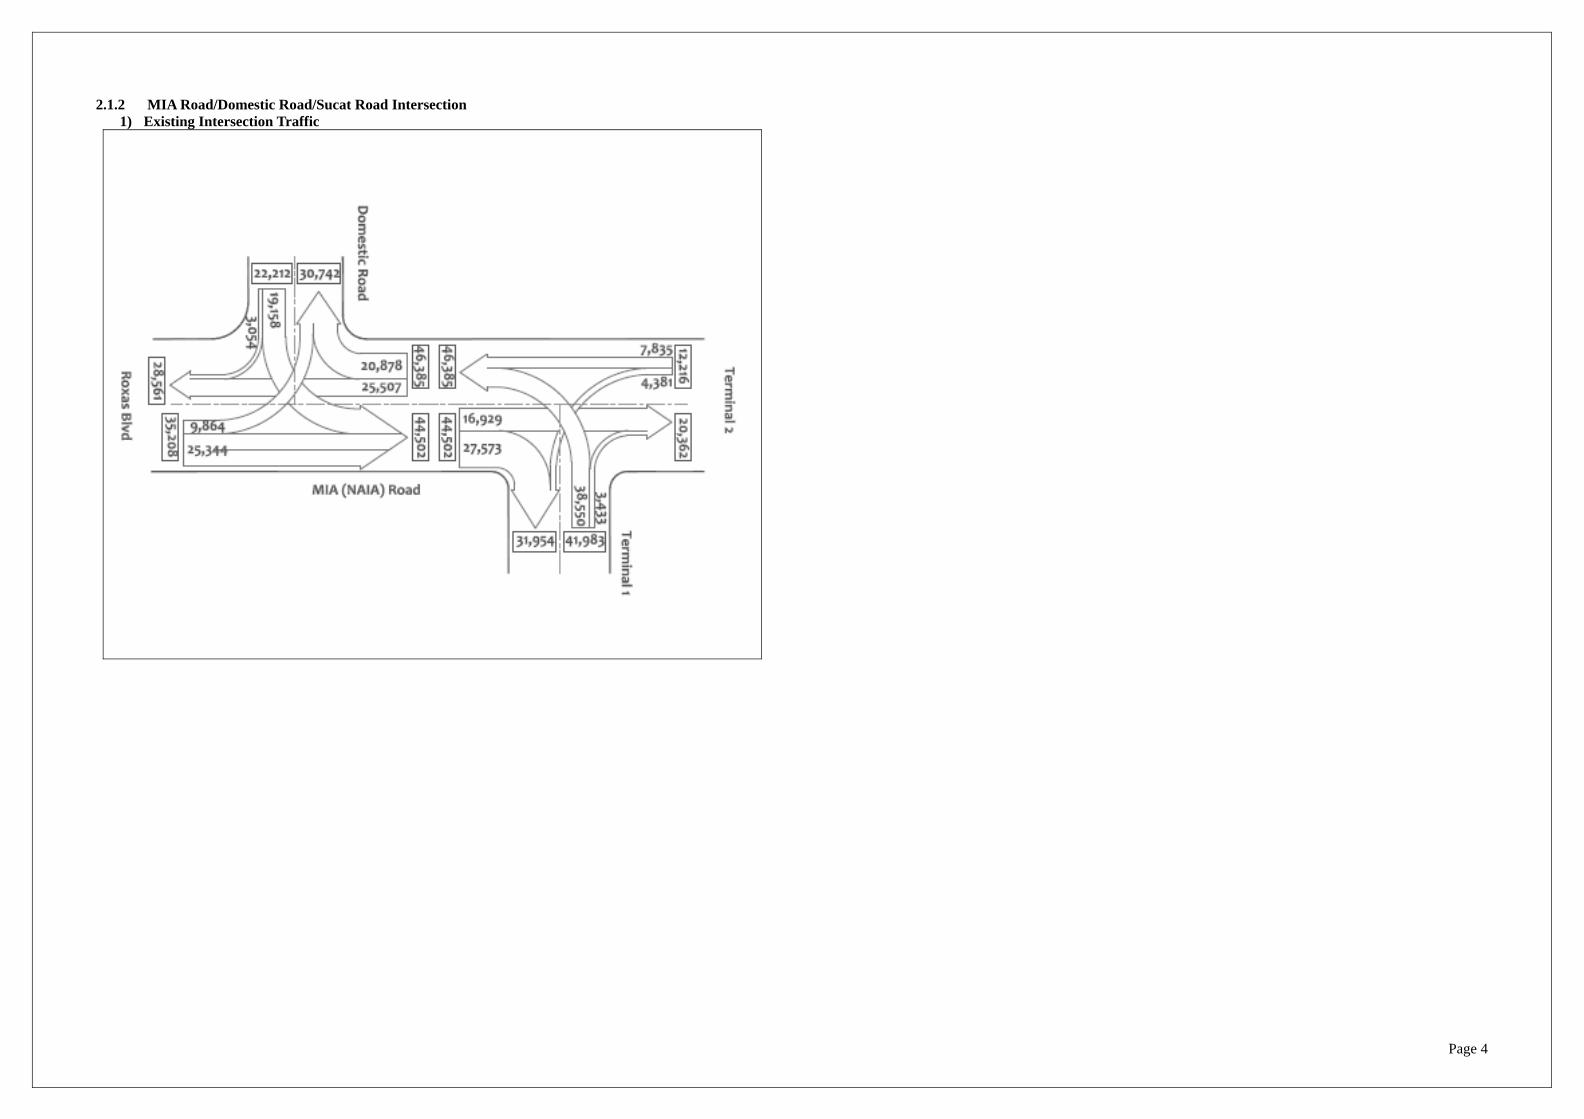
2.1.2 MIA Road/Domestic Road/Sucat Road Intersection 1) Existing Intersection Traffic

Page 5
Effect of Grade Separation
Without Grade Separation With Grade Separation Domestic Ninoy Aquino Domestic Ninoy Aquino Level of Service (LOS) F F C C Delay Time (sec/veh) V/C
541.0 1.41
479.5 1.32
34.4 0.85
31.4 0.89
ROW Acquisition: 1,460.0 sq.m. Number of Structure Affected : 10 Roughly Estimated Cost
Civil Work Cost : 965 Million Pesos ROW Acquisition Cost : 5 Million Pesos Total 970 Million Pesos
Note: ROW Acquisition Cost does not include compensation cost of structures
Alternative-1
Effect of Grade Separation
Without Grade Separation With Grade Separation Domestic Ninoy Aquino Domestic Ninoy Aquino Level of Service (LOS) F F D D Delay Time (sec/veh) V/C
541.0 1.41
479.5 1.32
49.3 0.87
50.9 0.82
ROW Acquisition: 53,750.0 sq.m. Number of Structure Affected : 1 Roughly Estimated Cost
Civil Work Cost : 1,157 Million Pesos ROW Acquisition Cost : 76 Million Pesos Total 1,233 Million Pesos
Note: ROW Acquisition Cost does not include compensation cost of structures
Alternative-2

Page 6
Effect of Grade Separation
Without Grade Separation With Grade Separation Domestic Ninoy Aquino Domestic Ninoy Aquino Level of Service (LOS) F F A F Delay Time (sec/veh) V/C
541.0 1.41
479.5 1.32
0.0 0.00
122.5 1.02
ROW Acquisition : 315.1 sq.m. Number of Structure Affected : 10 Roughly Estimated Cost
Civil Work Cost : 802 Million Pesos ROW Acquisition Cost : 9 Million Pesos Total 811 Million Pesos
Note: ROW Acquisition Cost does not include compensation cost of structures.
Alternative-3
Effect of Grade Separation
Without Grade Separation With Grade Separation Domestic Ninoy Aquino Domestic Ninoy Aquino Level of Service (LOS) F F C F Delay Time (sec/veh) V/C
541.0 1.41
479.5 1.32
34.2 0.83
111.9 0.94
ROW Acquisition : 633.4 sq.m. Number of Structure Affected : 10 Roughly Estimated Cost
Civil Work Cost : 726 Million Pesos ROW Acquisition Cost : 17 Million Pesos Total 743 Million Pesos
Note: ROW Acquisition Cost does not include compensation cost of structures.
Alternative-4

Page 7
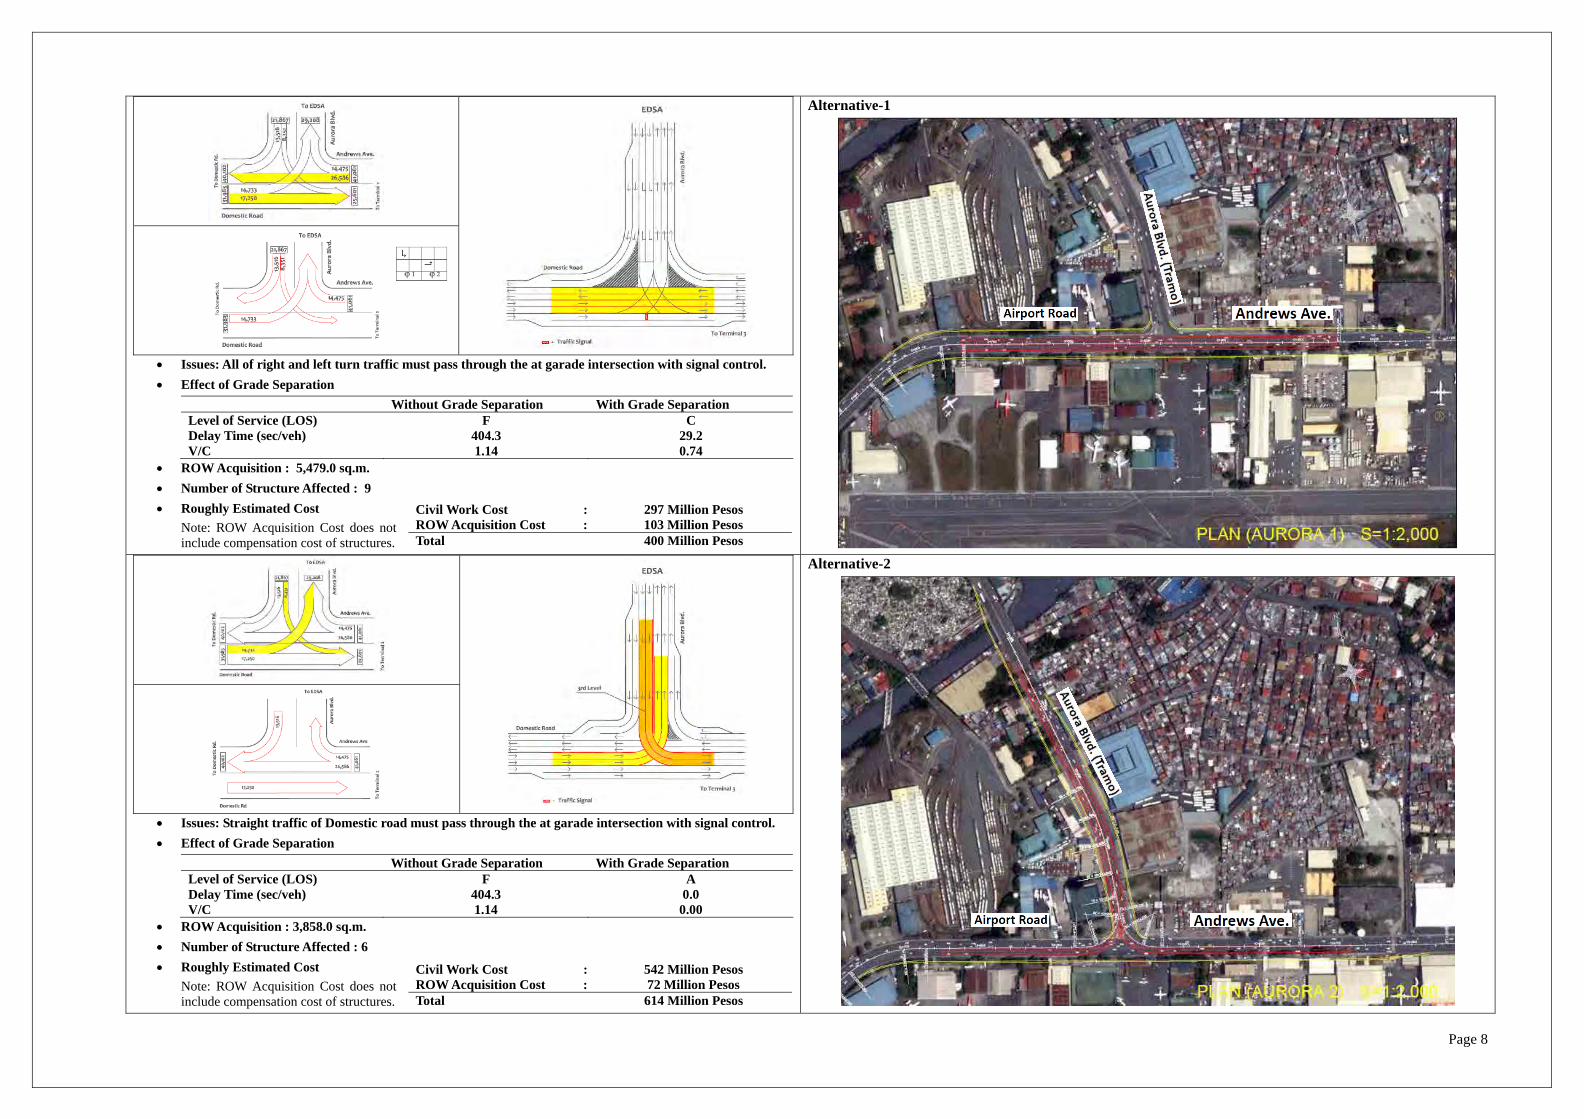
2.1.3. Andrews Ave./Tramo Road (Aurora Blvd.) Intersection 1) Existing Intersection Traffic
(Tramo Ro
ad)
Page 8
Issues: All of right and left turn traffic must pass through the at garade intersection with signal control. Effect of Grade Separation
Without Grade Separation With Grade Separation Level of Service (LOS) F C Delay Time (sec/veh) V/C
404.3 1.14
29.2 0.74
ROW Acquisition : 5,479.0 sq.m. Number of Structure Affected : 9 Roughly Estimated Cost
Note: ROW Acquisition Cost does not include compensation cost of structures.
Civil Work Cost : 297 Million Pesos ROW Acquisition Cost : 103 Million Pesos Total 400 Million Pesos
Alternative-1
Issues: Straight traffic of Domestic road must pass through the at garade intersection with signal control. Effect of Grade Separation
Without Grade Separation With Grade Separation Level of Service (LOS) F A Delay Time (sec/veh) V/C
404.3 1.14
0.0 0.00
ROW Acquisition : 3,858.0 sq.m. Number of Structure Affected : 6 Roughly Estimated Cost
Note: ROW Acquisition Cost does not include compensation cost of structures.
Civil Work Cost : 542 Million Pesos ROW Acquisition Cost : 72 Million Pesos Total 614 Million Pesos
Alternative-2
Page 9
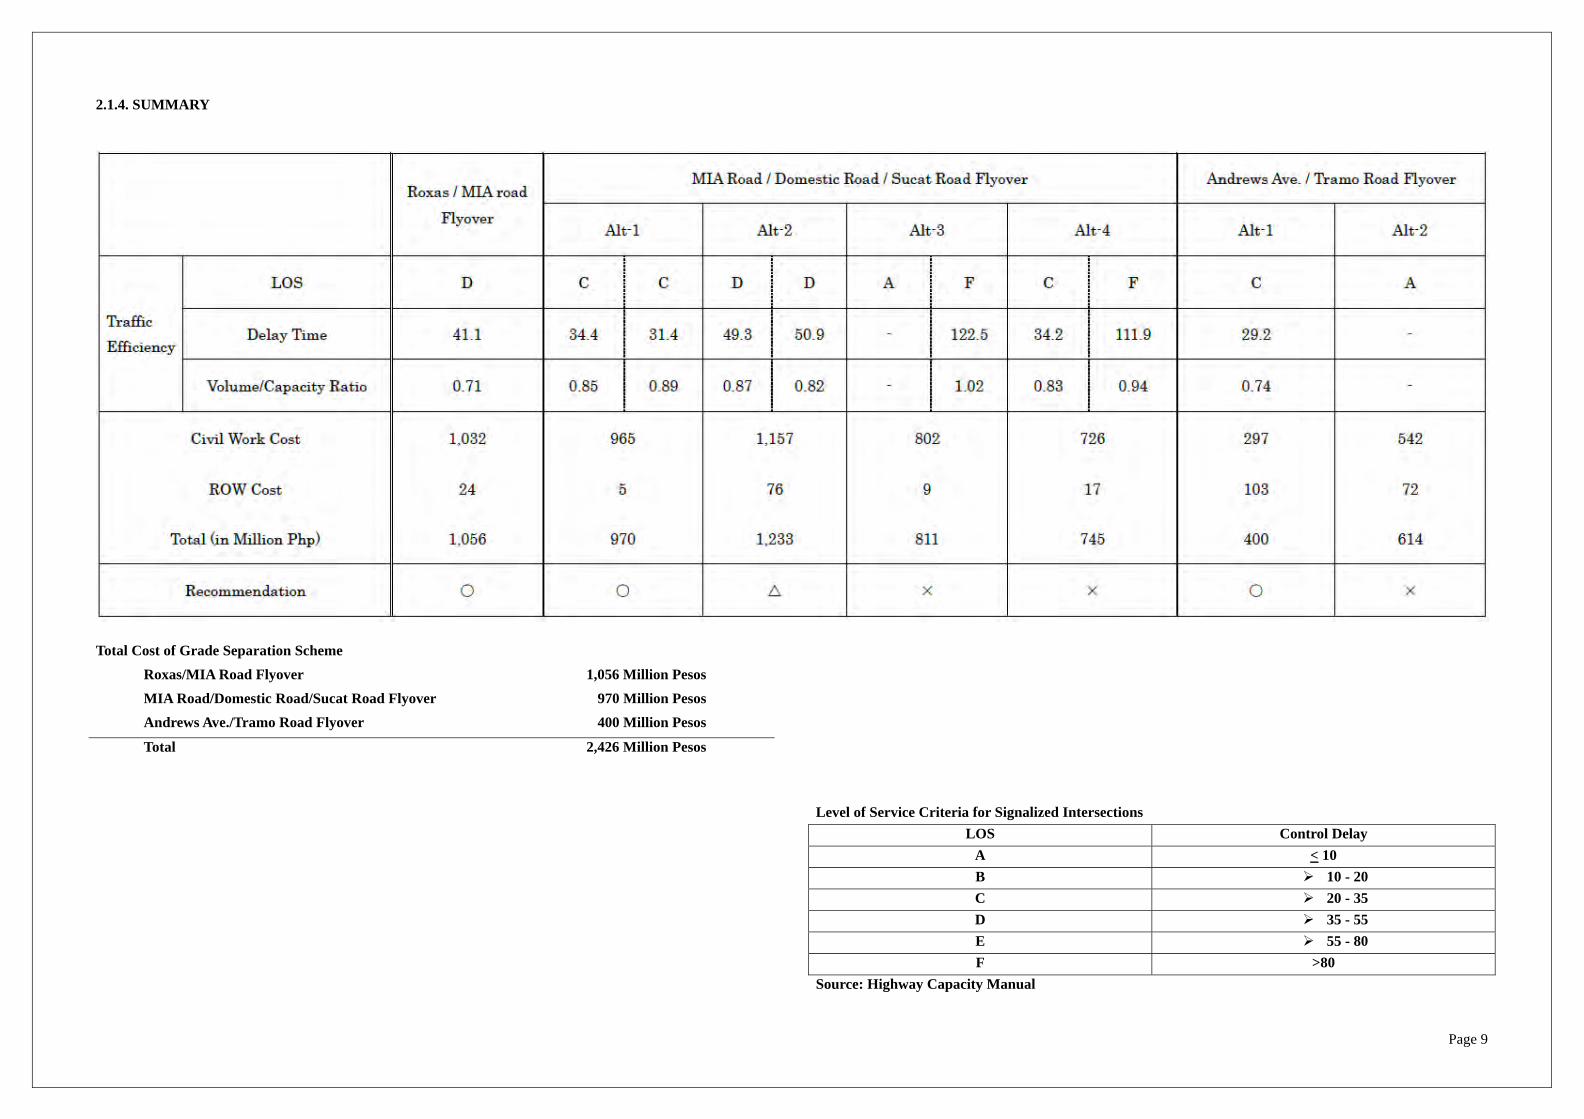
2.1.4. SUMMARY
Total Cost of Grade Separation Scheme
Roxas/MIA Road Flyover 1,056 Million Pesos MIA Road/Domestic Road/Sucat Road Flyover 970 Million Pesos Andrews Ave./Tramo Road Flyover 400 Million Pesos
Total 2,426 Million Pesos
Level of Service Criteria for Signalized Intersections
LOS Control Delay A < 10 B 10 - 20 C 20 - 35 D 35 - 55 E 55 - 80 F >80
Source: Highway Capacity Manual

Page 10
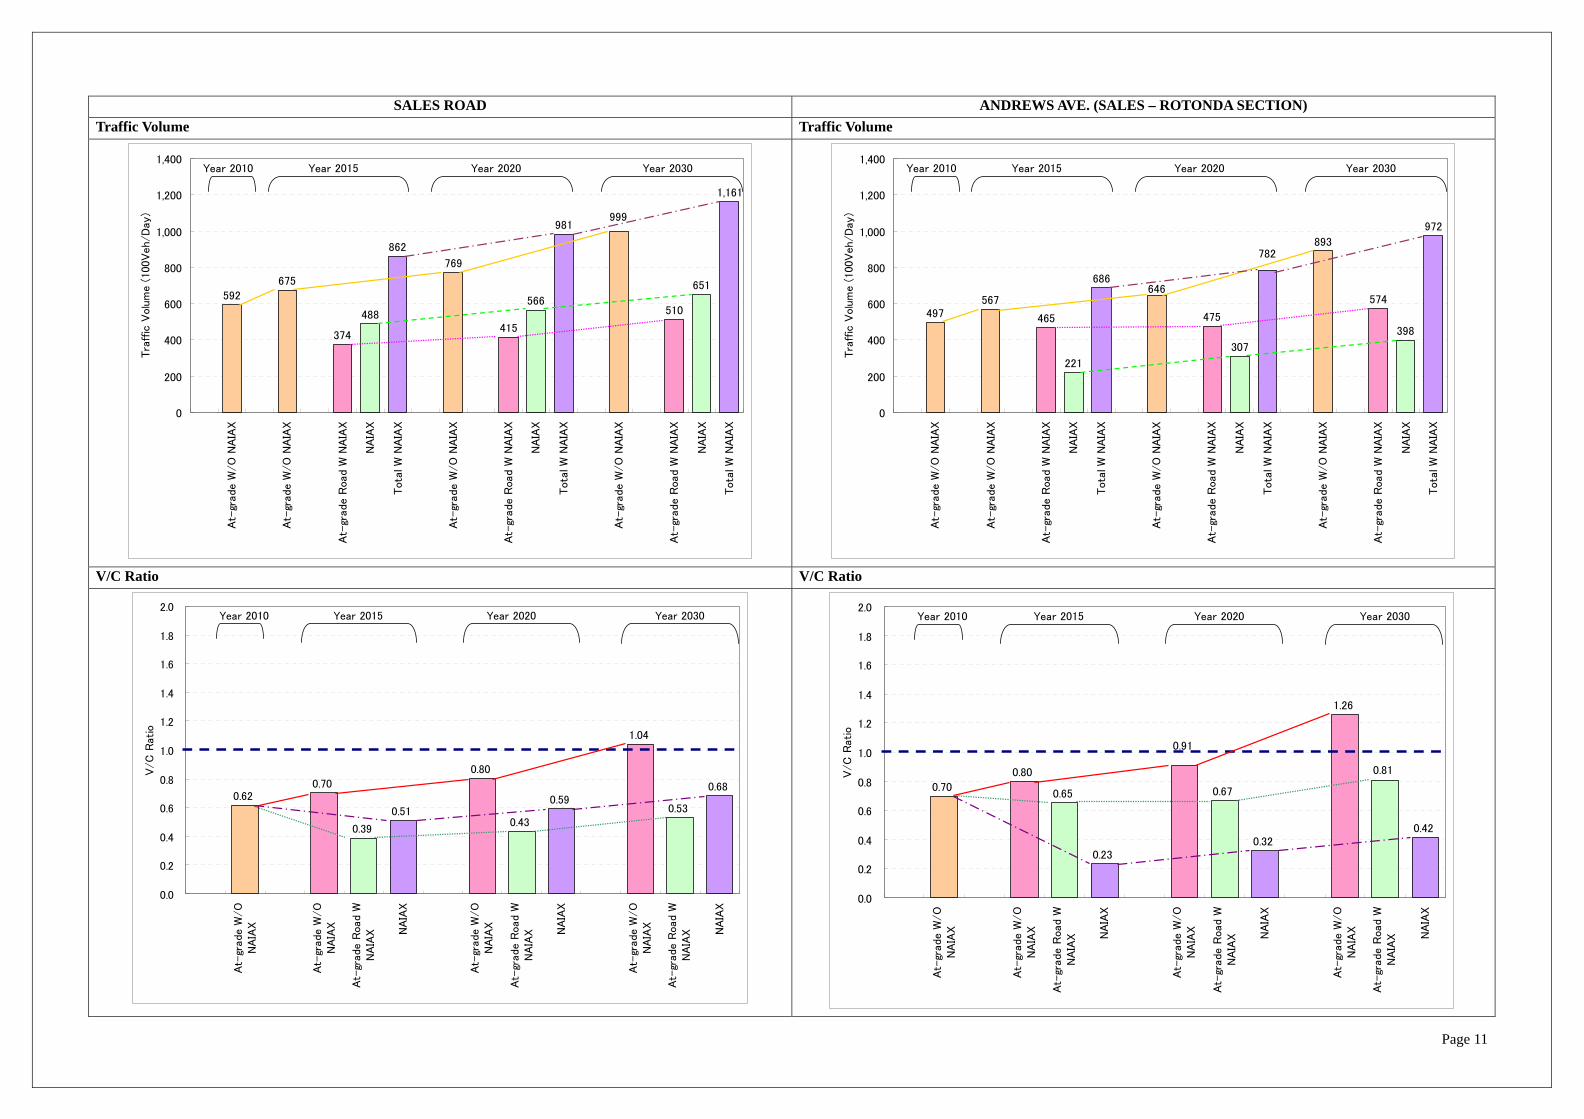
2.2 TRAFFIC CONDITION COMPARISON NAIAX VS. GRADE SEPRATION 2.2.1. Traffic Volume of NAIAx Corridor At-grade Road without NAIAx
2.2.2. NAIAx Corridor Traffic Volume: With/Without NAIAx
(30,100) 45% (10,200) 18% (11,600) 20% (1,800) 5% (8,600) 12% (1,500) 2%
18,700 128% 11,900 121% 16,200 128% 26,000 170% 100 100% 7,200 108%
(35,400) 46% (17,100) 26% (14,700) 22% (6,500) 15% (4,100) 5% (5,700) 5%
21,200 128% 13,600 121% 25,400 138% 33,600 179% 5,800 107% 4,200 104%
(48,900) 49% (31,900) 36% (23,100) 27% (18,200) 33% (10,900) 10% (15,900) 10%
16,200 116% 7,900 109% 30,700 136% 35,600 165% 14,600 114% 9,600 106%
Year CaseSection
Sales RdAndrews Ave.(Sales ‐ Circle)
Andrews Ave.(Circle ‐ Domestic)
Domesic RoadNAIA (MIA) Road
(Domesic ‐ Quirino)NAIA (MIA) Road(Quirino ‐ Roxas)
2010 (Present at‐grade Road)59,200 49,700 51,100 32,600 62,000 81,300
(V/C=0.62) (V/C=0.70) (V/C=0.95) (V/C=0.61) (V/C=0.84) (V/C=1.13)
2015
AAt‐grade Road Without NAIAX
67,500 56,700 58,200
B NAIAX48,800 22,100
37,200 70,700 94,100
(V/C=0.70) (V/C=0.80) (V/C=1.09) (V/C=.69) (V/C=0.96) (V/C=1.30)
27,800 27,800 8,700 8,700
(V/C=0.51) (V/C=0.23) (V/C=0.29) (V/C=0.29) (V/C=0.09) (V/C=0.09)
CAt‐grade Road With NAIAX
37,400 46,500 46,600 35,400 62,100 92,600
(V/C=0.39) (V/C=0.65) (V/C=0.87) (V/C=0.66) (V/C=0.85) (V/C=1.28)
D Total With NAIAX 86,200 68,600 74,400 63,200 70,800 101,300
C‐A (A/C)
D‐A (D/A)
2020
AAt‐grade Road Without NAIAX
76,900 64,600 66,300 42,400 80,600 112,400
(V/C=0.80) (V/C=0.91) (V/C=1.24) (V/C=0.79) (V/C=1.10) (V/C=1.56)
B NAIAX56,600 30,700 40,100 40,100 9,900 9,900
(V/C=0.59) (V/C=0.32) (V/C=0.42) (V/C=0.42) (V/C=0.10) (V/C=0.10)
CAt‐grade Road With NAIAX
41,500 47,500 51,600 35,900 76,500 106,700
(V/C=0.43) (V/C=0.67) (V/C=0.96) (V/C=0.67) (V/C=1.04) (V/C=1.48)
D Total With NAIAX 98,100 78,200 91,700 76,000 86,400 116,600
C‐A (A/C)
D‐A (D/A)
2030
AAt‐grade Road Without NAIAX
99,900 89,300 86,100 55,100 104,700 153,200
(V/C=1.04) (V/C=1.26) (V/C=1.61) (V/C=1.03) (V/C=1.43) (V/C=2.12)
B NAIAX65,100 39,800 53,800 53,800 25,500 25,500
(V/C=0.68) (V/C=0.42) (V/C=0.56) (V/C=0.56) (V/C=0.27) (V/C=0.27)
CAt‐grade Road With NAIAX
51,000 57,400 63,000 36,900 93,800 137,300
(V/C=0.53) (V/C=0.81) (V/C=1.18) (V/C=0.69) (V/C=1.28) (V/C=1.90)
D Total With NAIAX 116,100 97,200 116,800 90,700 119,300 162,800
C‐A (A/C)
D‐A (D/A)
* Traffic Volume: Vehicle/Day
Page 11
SALES ROAD ANDREWS AVE. (SALES – ROTONDA SECTION) Traffic Volume Traffic Volume
592
675
374
488
862
769
415
566
981
510
651
1,161
999
0
200
400
600
800
1,000
1,200
1,400
At-
grade W
/O N
AIA
X
At-
grade W
/O N
AIA
X
At-
grade
Roa
d W
NA
IAX
NA
IAX
Tota
l W
NA
IAX
At-
grade W
/O N
AIA
X
At-
grade
Roa
d W
NA
IAX
NA
IAX
Tota
l W
NA
IAX
At-
grade W
/O N
AIA
X
At-
grade
Roa
d W
NA
IAX
NA
IAX
Tota
l W
NA
IAX
Tra
ffic
Volu
me (
100
Veh/D
ay)
Year 2010 Year 2015 Year 2020 Year 2030
497567
465
221
686
475
307
574
398
972
646
893782
0
200
400
600
800
1,000
1,200
1,400
At-
grade W
/O N
AIA
X
At-
grade W
/O N
AIA
X
At-
grade
Roa
d W
NA
IAX
NA
IAX
Tota
l W
NA
IAX
At-
grade W
/O N
AIA
X
At-
grade
Roa
d W
NA
IAX
NA
IAX
Tota
l W
NA
IAX
At-
grade W
/O N
AIA
X
At-
grade
Roa
d W
NA
IAX
NA
IAX
Tota
l W
NA
IAX
Tra
ffic
Volu
me (
100
Veh/D
ay)
Year 2010 Year 2015 Year 2020 Year 2030
V/C Ratio V/C Ratio
0.620.70
0.39
0.51
0.80
0.43
0.59
1.04
0.53
0.68
0.0
0.2
0.4
0.6
0.8
1.0
1.2
1.4
1.6
1.8
2.0
At-
grade
W/O
NA
IAX
At-
grade
W/O
NA
IAX
At-
grade R
oad W
NA
IAX N
AIA
X
At-
grade
W/O
NA
IAX
At-
grade R
oad W
NA
IAX N
AIA
X
At-
grade
W/O
NA
IAX
At-
grade R
oad W
NA
IAX N
AIA
X
V/C
Ratio
Year 2010 Year 2015 Year 2020 Year 2030
0.70
0.80
0.65
0.23
0.67
0.32
1.26
0.42
0.91
0.81
0.0
0.2
0.4
0.6
0.8
1.0
1.2
1.4
1.6
1.8
2.0
At-
grade W
/O
NA
IAX
At-
grade W
/O
NA
IAX
At-
grade
Roa
d W
NA
IAX N
AIA
X
At-
grade W
/O
NA
IAX
At-
grade
Roa
d W
NA
IAX N
AIA
X
At-
grade W
/O
NA
IAX
At-
grade
Roa
d W
NA
IAX N
AIA
X
V/C
Ratio
Year 2010 Year 2015 Year 2020 Year 2030
Page 12
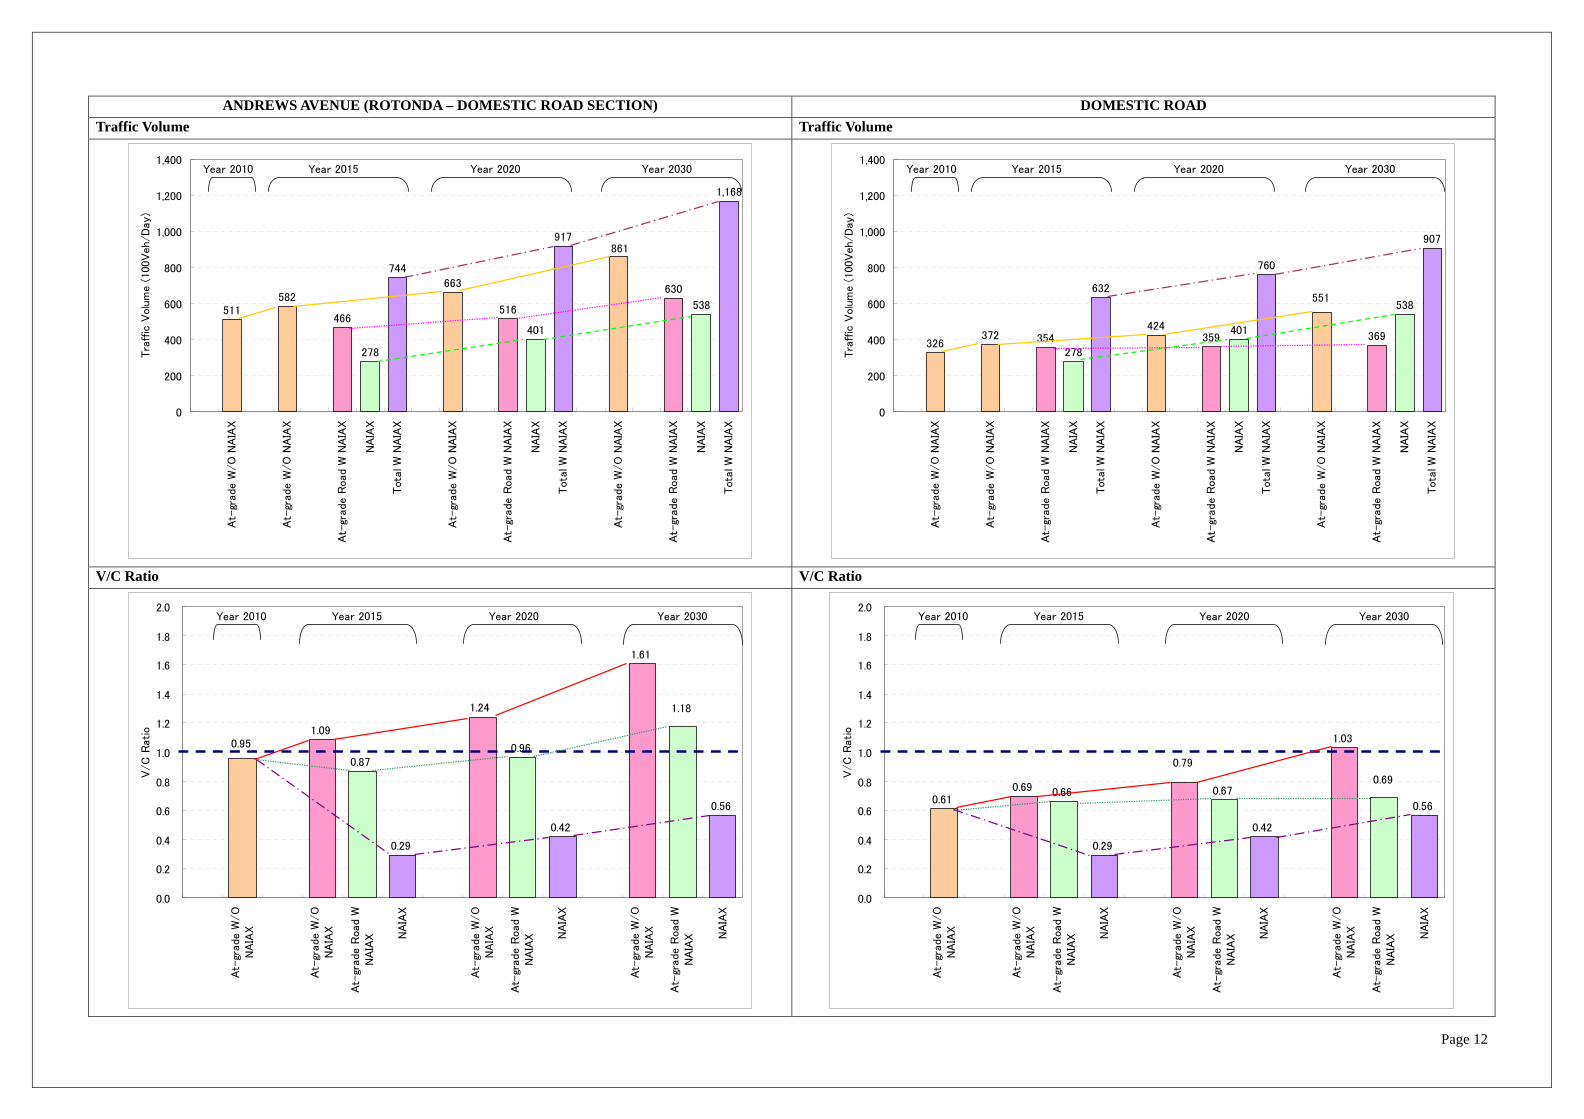
ANDREWS AVENUE (ROTONDA – DOMESTIC ROAD SECTION) DOMESTIC ROAD Traffic Volume Traffic Volume
511582
466
278
744
663
516
401
917
630
538
1,168
861
0
200
400
600
800
1,000
1,200
1,400
At-
grad
e W
/O
NA
IAX
At-
grad
e W
/O
NA
IAX
At-
grade R
oad
W N
AIA
X
NA
IAX
Tot
al W
NA
IAX
At-
grad
e W
/O
NA
IAX
At-
grade R
oad
W N
AIA
X
NA
IAX
Tot
al W
NA
IAX
At-
grad
e W
/O
NA
IAX
At-
grade R
oad
W N
AIA
X
NA
IAX
Tot
al W
NA
IAX
Tra
ffic
Volu
me (
100
Veh/D
ay)
Year 2010 Year 2015 Year 2020 Year 2030
326372 354
278
632
424359
401
760
369
538
907
551
0
200
400
600
800
1,000
1,200
1,400
At-
grad
e W
/O
NA
IAX
At-
grad
e W
/O
NA
IAX
At-
grade R
oad
W N
AIA
X
NA
IAX
Tot
al W
NA
IAX
At-
grad
e W
/O
NA
IAX
At-
grade R
oad
W N
AIA
X
NA
IAX
Tot
al W
NA
IAX
At-
grad
e W
/O
NA
IAX
At-
grade R
oad
W N
AIA
X
NA
IAX
Tot
al W
NA
IAX
Tra
ffic
Volu
me (
100
Veh/D
ay)
Year 2010 Year 2015 Year 2020 Year 2030
V/C Ratio V/C Ratio
1.09
0.87
0.29
0.96
0.42
1.61
0.56
0.95
1.181.24
0.0
0.2
0.4
0.6
0.8
1.0
1.2
1.4
1.6
1.8
2.0
At-
grade W
/O
NA
IAX
At-
grade W
/O
NA
IAX
At-
grade
Roa
d W
NA
IAX N
AIA
X
At-
grade W
/O
NA
IAX
At-
grade
Roa
d W
NA
IAX N
AIA
X
At-
grade W
/O
NA
IAX
At-
grade
Roa
d W
NA
IAX N
AIA
X
V/C
Ratio
Year 2010 Year 2015 Year 2020 Year 2030
0.610.69 0.66
0.29
0.67
0.42
1.03
0.56
0.79
0.69
0.0
0.2
0.4
0.6
0.8
1.0
1.2
1.4
1.6
1.8
2.0
At-
grade W
/O
NA
IAX
At-
grade W
/O
NA
IAX
At-
grade
Roa
d W
NA
IAX N
AIA
X
At-
grade W
/O
NA
IAX
At-
grade
Roa
d W
NA
IAX N
AIA
X
At-
grade W
/O
NA
IAX
At-
grade
Roa
d W
NA
IAX N
AIA
X
V/C
Ratio
Year 2010 Year 2015 Year 2020 Year 2030
Page 13
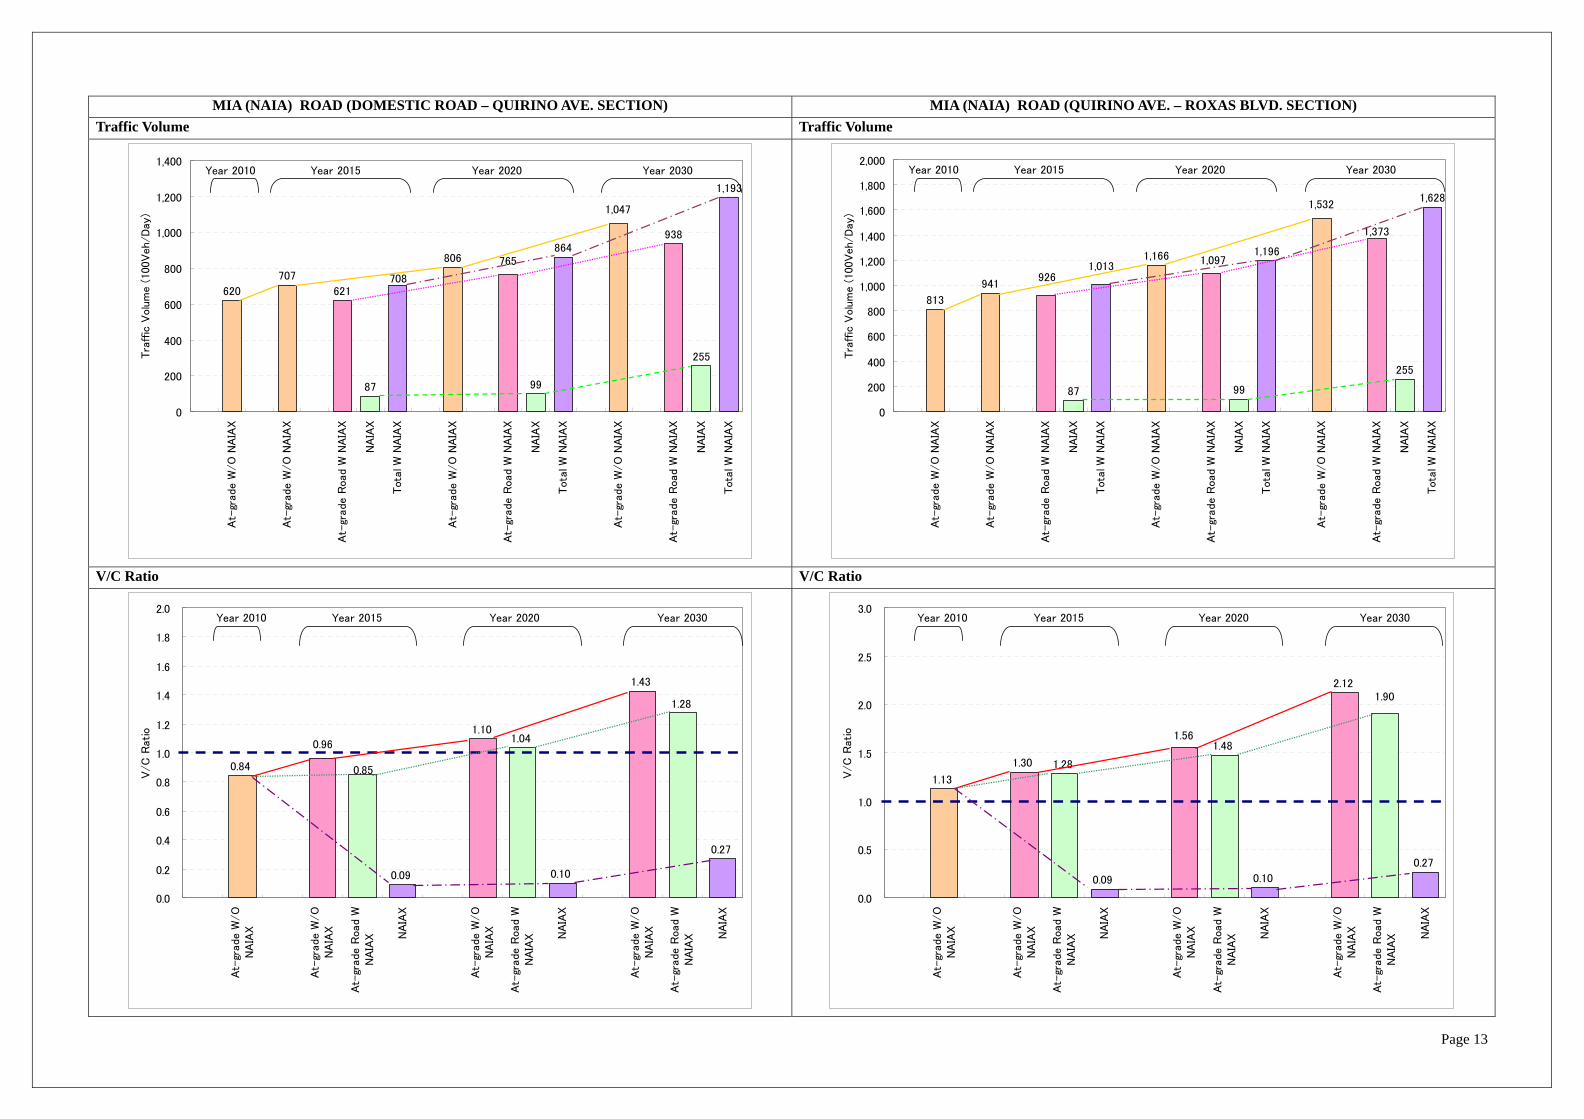
MIA (NAIA) ROAD (DOMESTIC ROAD – QUIRINO AVE. SECTION) MIA (NAIA) ROAD (QUIRINO AVE. – ROXAS BLVD. SECTION) Traffic Volume Traffic Volume
620
707
621
87
806
99
864938
255
1,193
708
765
1,047
0
200
400
600
800
1,000
1,200
1,400
At-
grad
e W
/O
NA
IAX
At-
grad
e W
/O
NA
IAX
At-
grade R
oad
W N
AIA
X
NA
IAX
Tot
al W
NA
IAX
At-
grad
e W
/O
NA
IAX
At-
grade R
oad
W N
AIA
X
NA
IAX
Tot
al W
NA
IAX
At-
grad
e W
/O
NA
IAX
At-
grade R
oad
W N
AIA
X
NA
IAX
Tot
al W
NA
IAX
Tra
ffic
Volu
me
(100V
eh/D
ay)
Year 2010 Year 2015 Year 2020 Year 2030
813
941
87
1,166
99
1,196
255
1,628
1,373
1,0971,013
926
1,532
0
200
400
600
800
1,000
1,200
1,400
1,600
1,800
2,000
At-
grad
e W
/O
NA
IAX
At-
grad
e W
/O
NA
IAX
At-
grade R
oad
W N
AIA
X
NA
IAX
Tot
al W
NA
IAX
At-
grad
e W
/O
NA
IAX
At-
grade R
oad
W N
AIA
X
NA
IAX
Tot
al W
NA
IAX
At-
grad
e W
/O
NA
IAX
At-
grade R
oad
W N
AIA
X
NA
IAX
Tot
al W
NA
IAX
Tra
ffic
Volu
me
(100V
eh/D
ay)
Year 2010 Year 2015 Year 2020 Year 2030
V/C Ratio V/C Ratio
0.84
0.09 0.10
1.43
0.27
0.96
0.85
1.041.10
1.28
0.0
0.2
0.4
0.6
0.8
1.0
1.2
1.4
1.6
1.8
2.0
At-
grade W
/O
NA
IAX
At-
grade W
/O
NA
IAX
At-
grade
Roa
d W
NA
IAX N
AIA
X
At-
grade W
/O
NA
IAX
At-
grade
Roa
d W
NA
IAX N
AIA
X
At-
grade W
/O
NA
IAX
At-
grade
Roa
d W
NA
IAX N
AIA
X
V/C
Rat
io
Year 2010 Year 2015 Year 2020 Year 2030
1.13
1.30 1.28
0.09
1.48
0.10
2.12
0.27
1.90
1.56
0.0
0.5
1.0
1.5
2.0
2.5
3.0
At-
grade W
/O
NA
IAX
At-
grade W
/O
NA
IAX
At-
grade
Roa
d W
NA
IAX N
AIA
X
At-
grade W
/O
NA
IAX
At-
grade
Roa
d W
NA
IAX N
AIA
X
At-
grade W
/O
NA
IAX
At-
grade
Roa
d W
NA
IAX N
AIA
X
V/C
Rat
io
Year 2010 Year 2015 Year 2020 Year 2030

Page 14
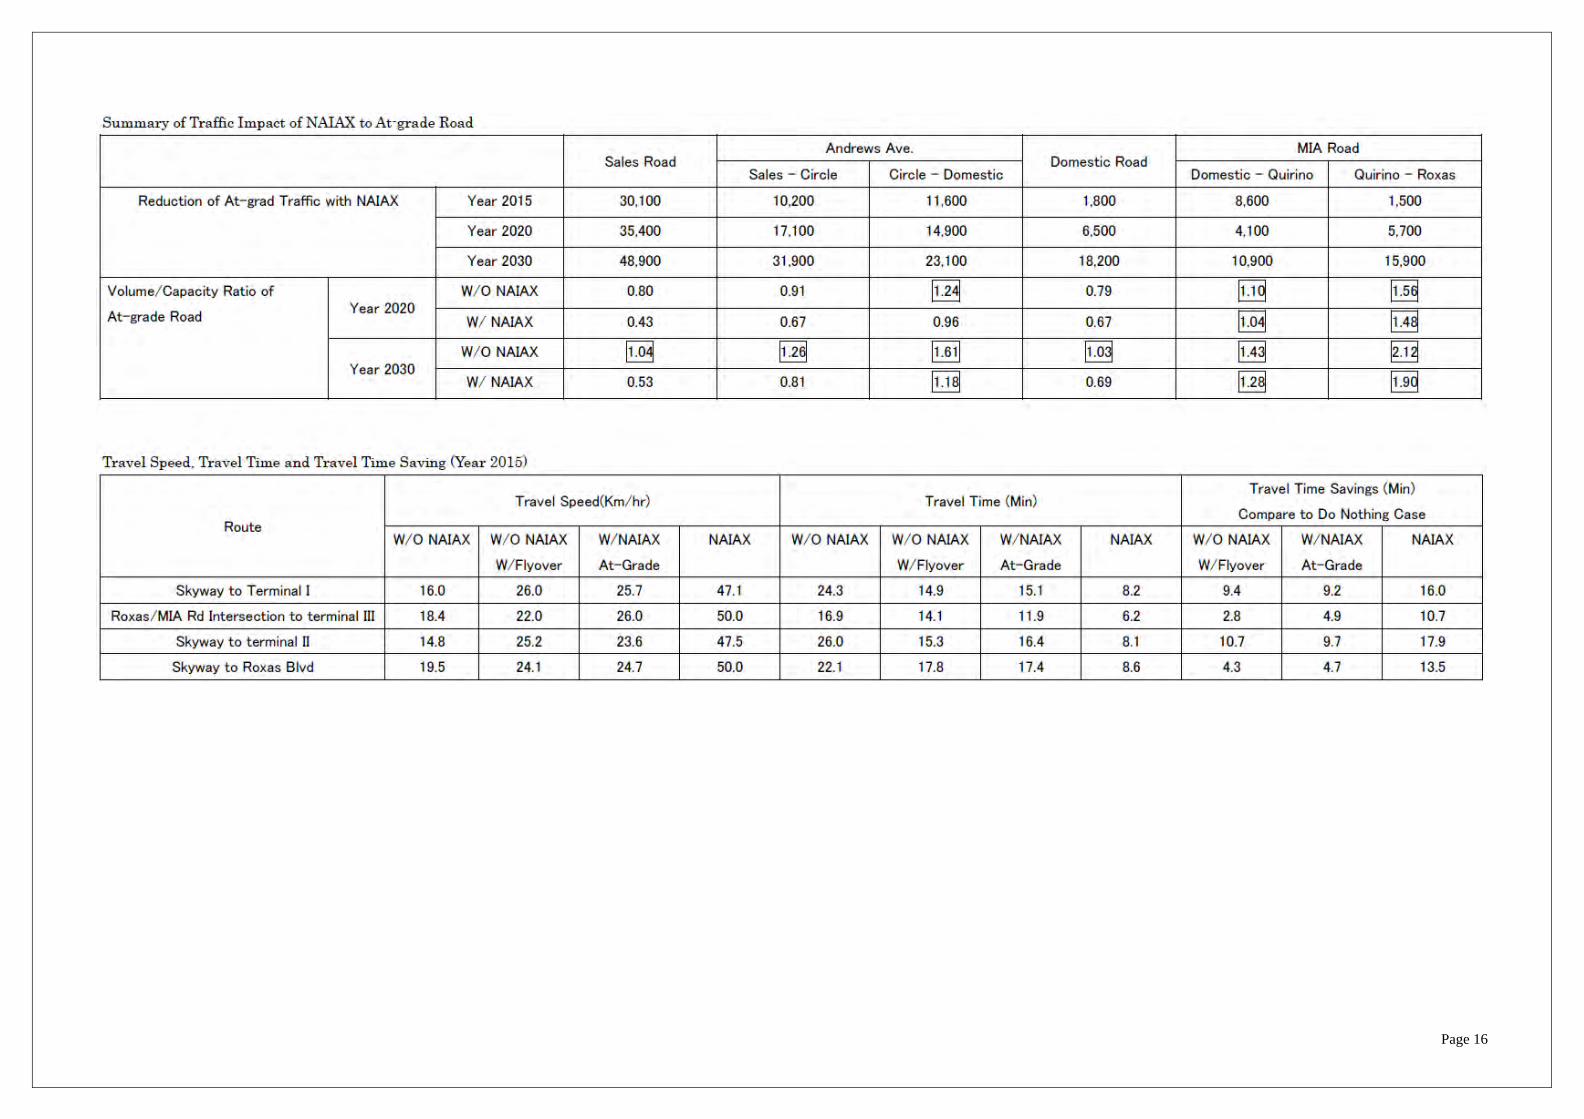
2.2.3 Travel Time, Travel Speed, and Travel Time Saving: Year 2015
Travel Speed (km/h) Difference Travel Time
(min) Difference
W/O Case 16.0 - 24.3 - Flyover 26.0 10.1 14.9 -9.4 NAIAX (At-Grade) 25.7 9.8 15.1 -9.2 (Expressway) 47.1 31.1 8.2 -16.0
Travel Speed (km/h) Difference Travel Time
(min) Difference
W/O Case 14.8 - 26.0 - Flyover 25.2 10.4 15.3 -10.7
NAIAX (At-Grade) 23.6 8.7 16.4 -9.7
(Expressway) 47.5 32.7 8.1 -17.9
Travel Speed (km/h) Difference Travel Time
(min) Difference
W/O Case 18.4 - 16.9 - Flyover 22.0 3.6 14.1 -2.8
NAIAX (At-Grade) 26.0 7.6 11.9 -4.9
(Expressway) 50.0 31.6 6.2 -10.7
Travel Speed (km/h) Difference Travel Time
(min) Difference
W/O Case 19.5 - 22.1 - Flyover 24.1 4.6 17.8 -4.3
NAIAX (At-Grade) 24.7 5.3 17.4 -4.7
(Expressway) 50.0 30.5 8.6 -13.5
Distance = 6.47 km.
Distance = 3.42 km.
Distance = 6.43 km.
Distance = 5.89 km.

Page 15
Traffic Efficiency Improvement by NAIAX
[ Skyway – Terminal I Route ] [ Skyway – Terminal II Route ]
16.0
26.0 25.7
47.1
0.0
10.0
20.0
30.0
40.0
50.0
W/O
Cas
e
With
Fly
ove
rC
ase
At-
Gra
dew
ith
NA
IAX
NA
IAX
Tra
vel Spe
ed
(km
/h)
Travel Speed
24.3
14.9 15.1
8.2
0.0
10.0
20.0
30.0
W/O
Cas
e
With
Fly
ove
rC
ase
At-
Gra
dew
ith
NA
IAX
NA
IAX
Tra
vel Tim
e (
min
)
Travel Time
0
9.4 9.2
16.0
0.0
5.0
10.0
15.0
20.0
W/O
Cas
e
With
Fly
ove
rC
ase
At-
Gra
dew
ith
NA
IAX
NA
IAX
Tra
vel Tim
e S
avin
g (m
in)
Travel Time Saving
14.8
25.2 23.6
47.5
0.0
10.0
20.0
30.0
40.0
50.0
W/O
Cas
e
With
Fly
ove
rC
ase
At-
Gra
dew
ith
NA
IAX
NA
IAX
Tra
vel Spe
ed
(km
/h)
Travel Speed
26.0
15.316.4
8.1
0.0
10.0
20.0
30.0
W/O
Cas
e
With
Fly
ove
rC
ase
At-
Gra
dew
ith
NA
IAX
NA
IAX
Tra
vel Tim
e (
min
)
Travel Time
0
10.79.7
17.9
0.0
5.0
10.0
15.0
20.0
W/O
Cas
e
With
Fly
ove
rC
ase
At-
Gra
dew
ith
NA
IAX
NA
IAX
Tra
vel Tim
e S
avin
g (m
in)
Travel Time Saving
[ Roxas Blvd. – Terminal III Route ] [ Skyway – Roxas Blvd. Route ]
18.422.0
26.0
50.0
0.0
10.0
20.0
30.0
40.0
50.0
60.0
W/O
Cas
e
With
Fly
ove
rC
ase
At-
Gra
dew
ith
NA
IAX
NA
IAX
Tra
vel Spe
ed
(km
/h)
Travel Speed
16.9
14.1
11.9
6.2
0.0
10.0
20.0
W/O
Cas
e
With
Fly
ove
rC
ase
At-
Gra
dew
ith
NA
IAX
NA
IAX
Tra
vel Tim
e (
min
)
Travel Time
0
2.8
4.9
10.7
0.0
5.0
10.0
15.0
W/O
Cas
e
With
Fly
ove
rC
ase
At-
Gra
dew
ith
NA
IAX
NA
IAX
Tra
vel Tim
e S
avin
g (m
in)
Travel Time Saving
19.5
24.1 24.7
50.0
0.0
10.0
20.0
30.0
40.0
50.0
60.0
W/O
Cas
e
With F
lyove
rC
ase
At-
Gra
de w
ith
NA
IAX
NA
IAX
Tra
vel Spe
ed
(km
/h)
Travel Speed
22.1
17.8 17.4
8.6
0.0
10.0
20.0
30.0
W/O
Cas
e
With F
lyove
rC
ase
At-
Gra
de w
ith
NA
IAX
NA
IAX
Tra
vel Tim
e (
min
)
Travel Time
0
4.3 4.7
13.5
0.0
10.0
20.0
W/O
Cas
e
With F
lyove
rC
ase
At-
Gra
de w
ith
NA
IAX
NA
IAX
Tra
vel Tim
e S
avin
g (m
in)
Travel Time Saving
Page 16
Page 17
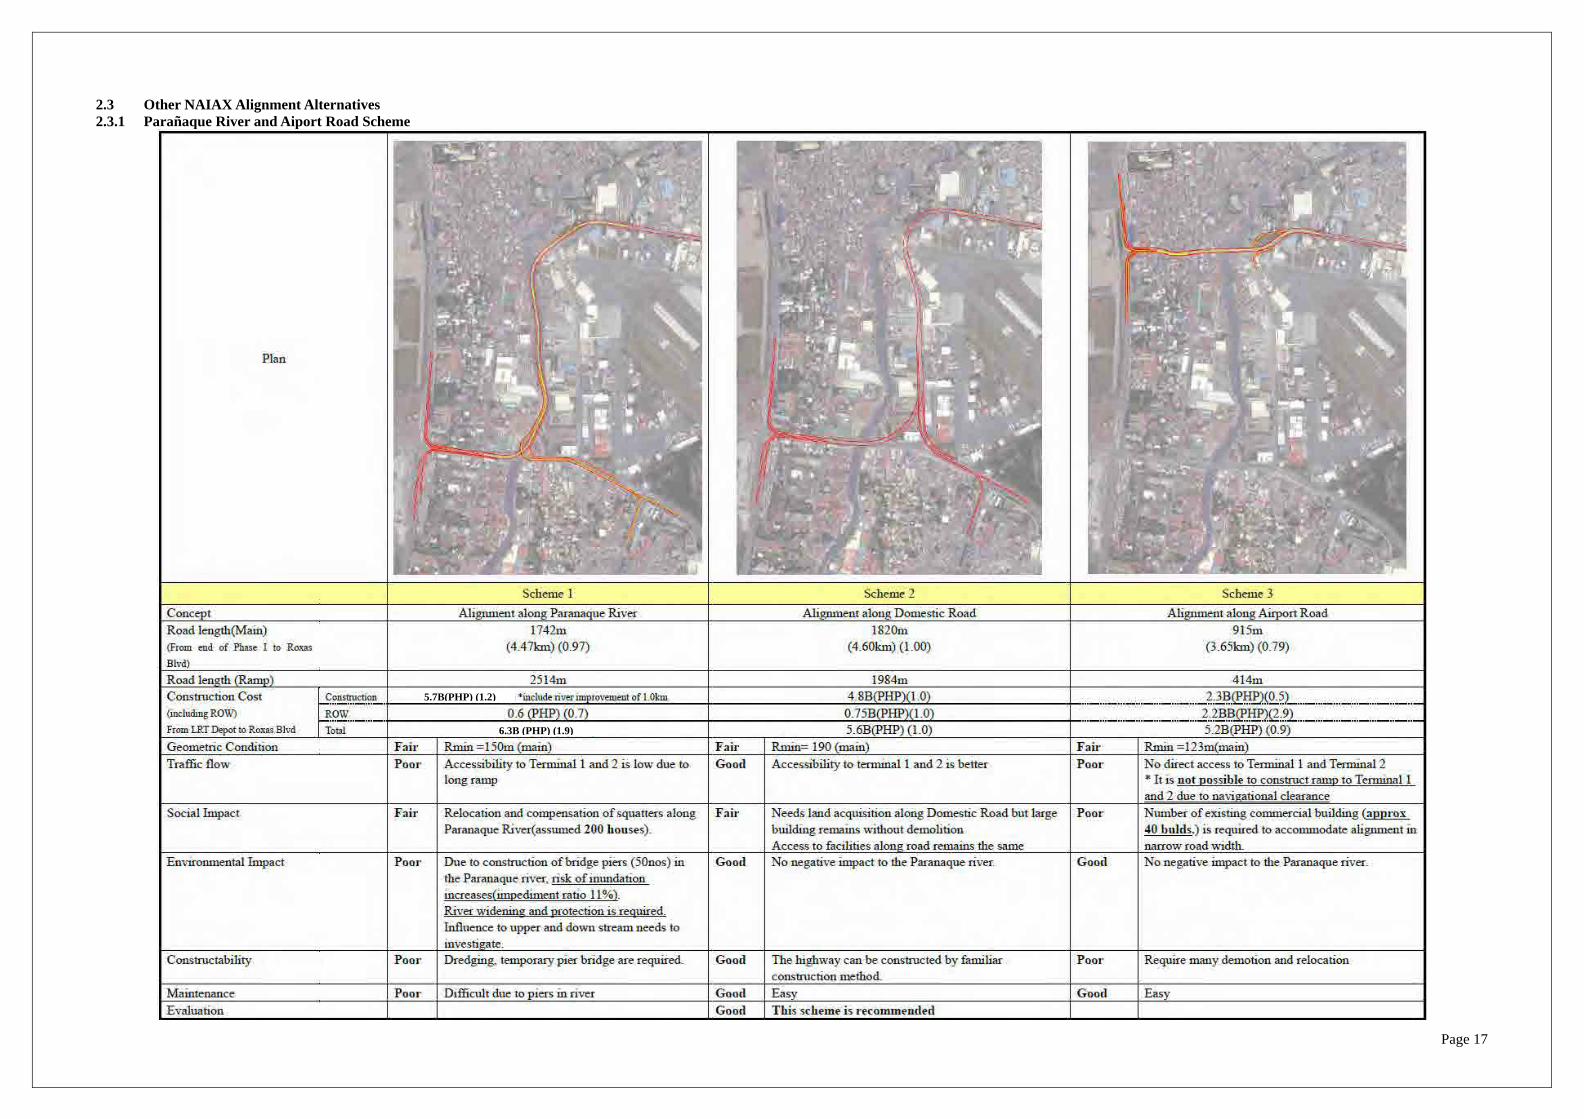
2.3 Other NAIAX Alignment Alternatives 2.3.1 Parañaque River and Aiport Road Scheme
5.7B(PHP) (1.2)
6.3B (PHP) (1.9)

Page 18
2.3.2 Crossing MIAA Compound Scheme
Roughly Estimated Civil Work Cost = 9.6 Billion Pesos (without Physical Contingency)
Issues:
(5) From Roxas Blvd. side, no access to Terminal III. (6) Vertical grade of 5% is required (standard is 4%)
(1) Airport Security Problem (2) Existing toll booth needs to be relocated
(3) Additional ROW acquisition of 19.5 m. in width along Villamor Air Base is required.
Page 19
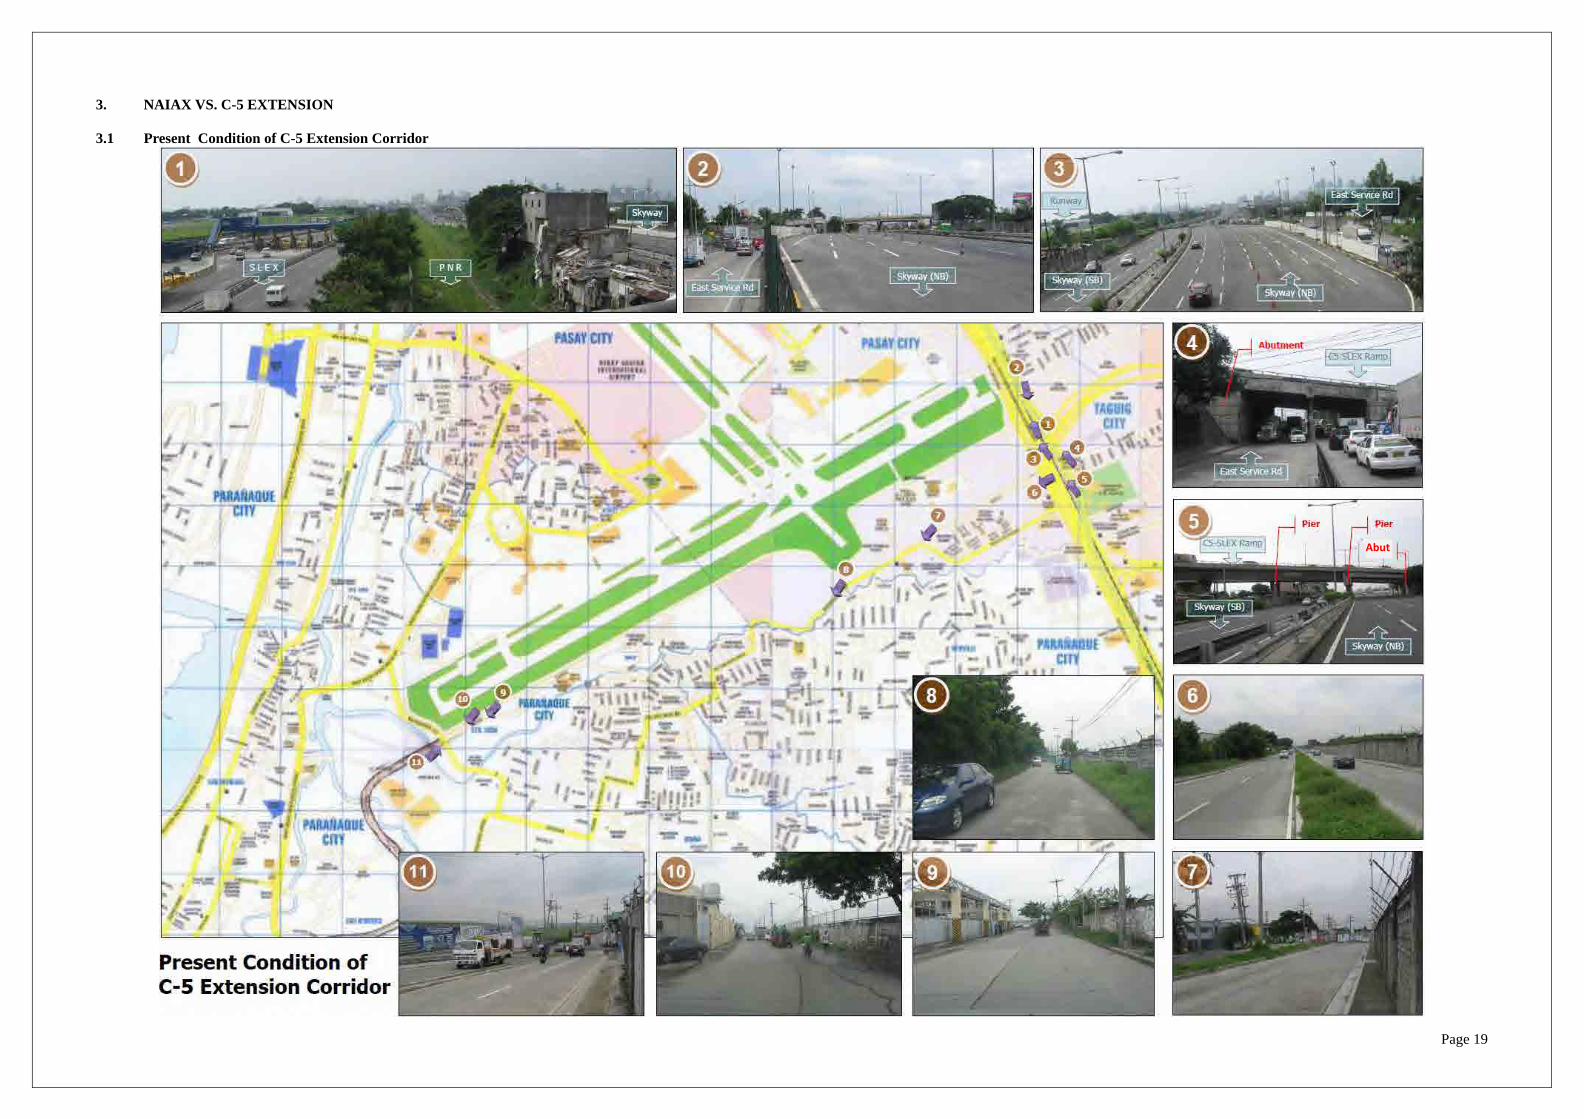
3. NAIAX VS. C-5 EXTENSION 3.1 Present Condition of C-5 Extension Corridor
Abut
Page 20
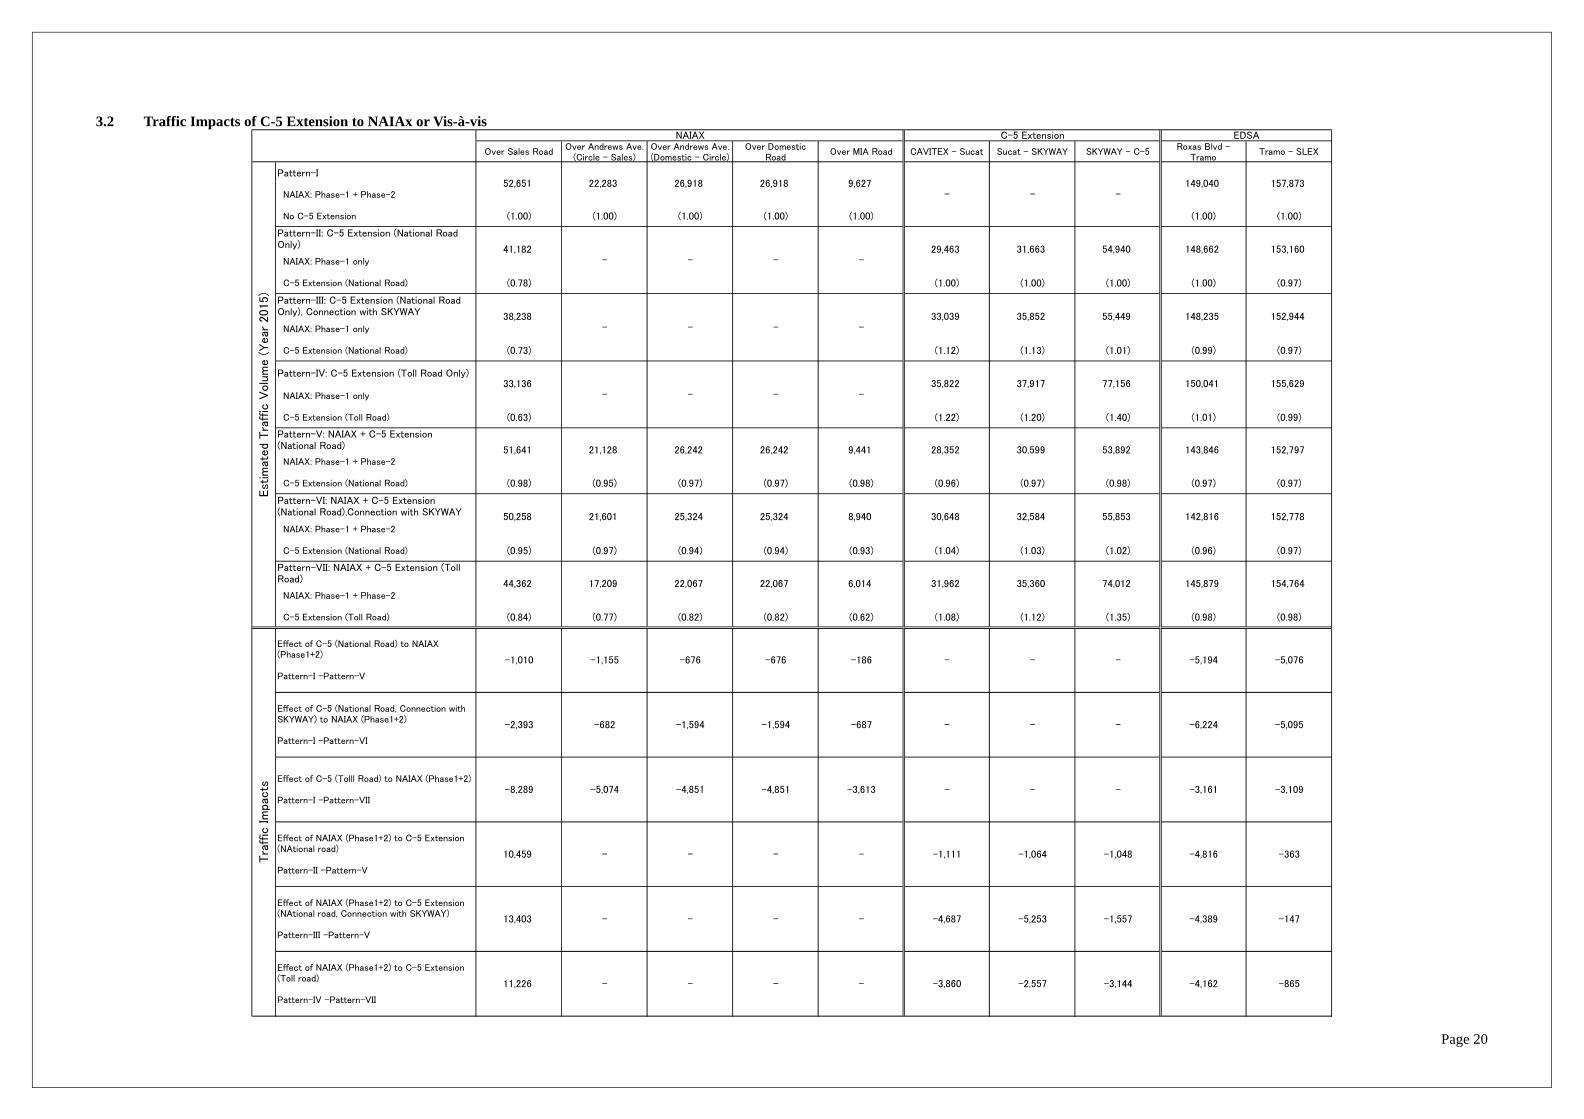
3.2 Traffic Impacts of C-5 Extension to NAIAx or Vis-à-vis
Over Sales RoadOver Andrews Ave.
(Circle - Sales)Over Andrews Ave. (Domestic - Circle)
Over Domestic Road
Over MIA Road CAVITEX - Sucat Sucat - SKYWAY SKYWAY - C-5Roxas Blvd -
TramoTramo - SLEX
Pattern-I
NAIAX: Phase-1 + Phase-2
No C-5 Extension (1.00) (1.00) (1.00) (1.00) (1.00) (1.00) (1.00)
Pattern-II: C-5 Extension (National Road Only)
NAIAX: Phase-1 only
C-5 Extension (National Road) (0.78) (1.00) (1.00) (1.00) (1.00) (0.97)
Pattern-III: C-5 Extension (National Road Only), Connection with SKYWAY
NAIAX: Phase-1 only
C-5 Extension (National Road) (0.73) (1.12) (1.13) (1.01) (0.99) (0.97)
Pattern-IV: C-5 Extension (Toll Road Only)
NAIAX: Phase-1 only
C-5 Extension (Toll Road) (0.63) (1.22) (1.20) (1.40) (1.01) (0.99)
Pattern-V: NAIAX + C-5 Extension (National Road)
NAIAX: Phase-1 + Phase-2
C-5 Extension (National Road) (0.98) (0.95) (0.97) (0.97) (0.98) (0.96) (0.97) (0.98) (0.97) (0.97)
Pattern-VI: NAIAX + C-5 Extension (National Road),Connection with SKYWAY
NAIAX: Phase-1 + Phase-2
C-5 Extension (National Road) (0.95) (0.97) (0.94) (0.94) (0.93) (1.04) (1.03) (1.02) (0.96) (0.97)
Pattern-VII: NAIAX + C-5 Extension (Toll Road)
NAIAX: Phase-1 + Phase-2
C-5 Extension (Toll Road) (0.84) (0.77) (0.82) (0.82) (0.62) (1.08) (1.12) (1.35) (0.98) (0.98)
Est
imat
ed T
raff
ic V
olu
me (
Year
2015)
Tra
ffic
Im
pac
ts
-5,253
Effect of NAIAX (Phase1+2) to C-5 Extension (NAtional road, Connection with SKYWAY)
Pattern-III -Pattern-V
13,403 - - - - -1,557 -4,389 -147
- -6,224 -5,095
145,879
-682 -1,594
-4,687
-1,594 -687 -
--3,613
-
25,324 25,324 32,584 55,853
152,944
8,940 30,648
- - -
31,962
53,89230,599
35,360
9,441 28,352
74,012 154,764
148,662 153,160
150,041 155,629
143,846 152,797
142,816 152,778
148,235
157,873149,040
-4,162 -865
-363
EDSA
-5,076
Effect of NAIAX (Phase1+2) to C-5 Extension (NAtional road)
Pattern-II -Pattern-V
Effect of NAIAX (Phase1+2) to C-5 Extension (Toll road)
Pattern-IV -Pattern-VII
-4,816-1,111 -1,064 -1,048
-3,860 -2,557 -3,144-
Effect of C-5 (National Road) to NAIAX (Phase1+2)
Pattern-I -Pattern-V
Effect of C-5 (Tolll Road) to NAIAX (Phase1+2)
Pattern-I -Pattern-VII
-1,010
-8,289
Effect of C-5 (National Road, Connection with SKYWAY) to NAIAX (Phase1+2)
Pattern-I -Pattern-VI
-2,393
-3,109-3,161
- - - -5,194
-
-
C-5 Extension
-
31,663 54,940
- -
33,039 35,852 55,449
NAIAX
-
-
52,651 22,283 26,918 26,918
-
-
-
77,15637,91735,822
26,242
9,627
-1,155
6,014
-186
29,463
-
41,182
33,136
51,641
44,362
-
-
21,128
38,238
50,258 21,601
11,226
22,067
-676
-4,851
-
17,209
10,459
-5,074
-
--
-
-
26,242
22,067
-676
-4,851
-
-
Page 21
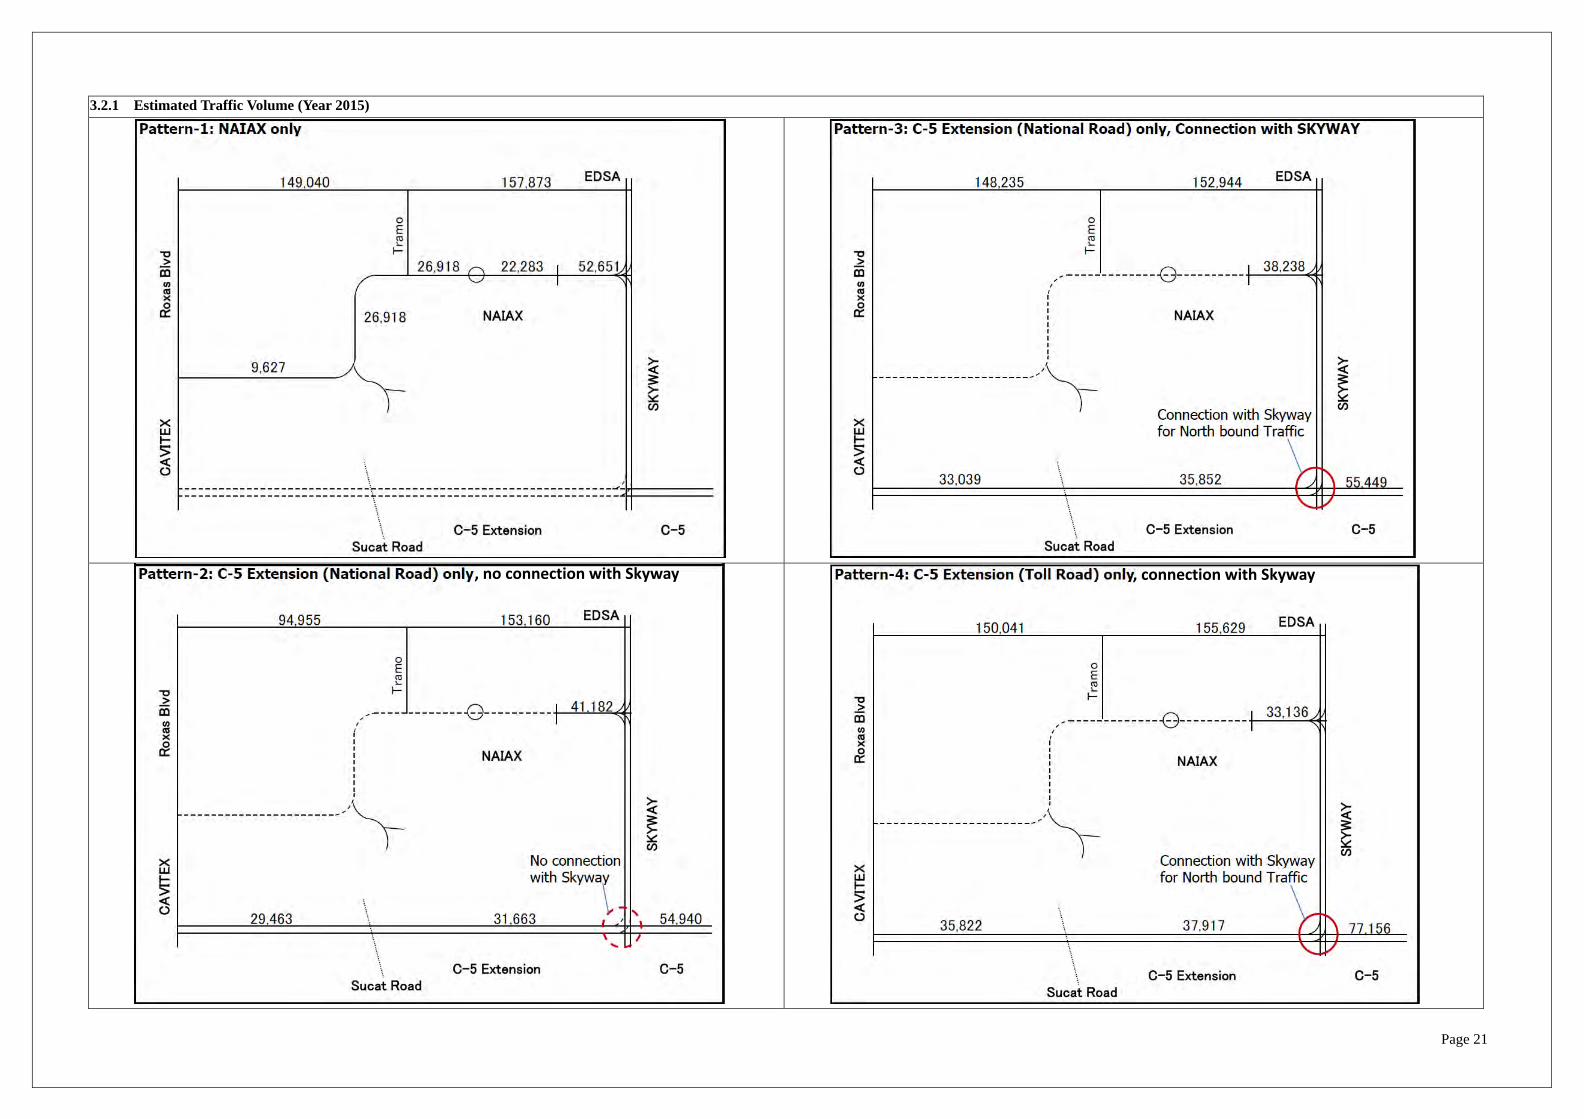
3.2.1 Estimated Traffic Volume (Year 2015)
, no connection with Skyway , connection with Skyway

Page 22
Page 23
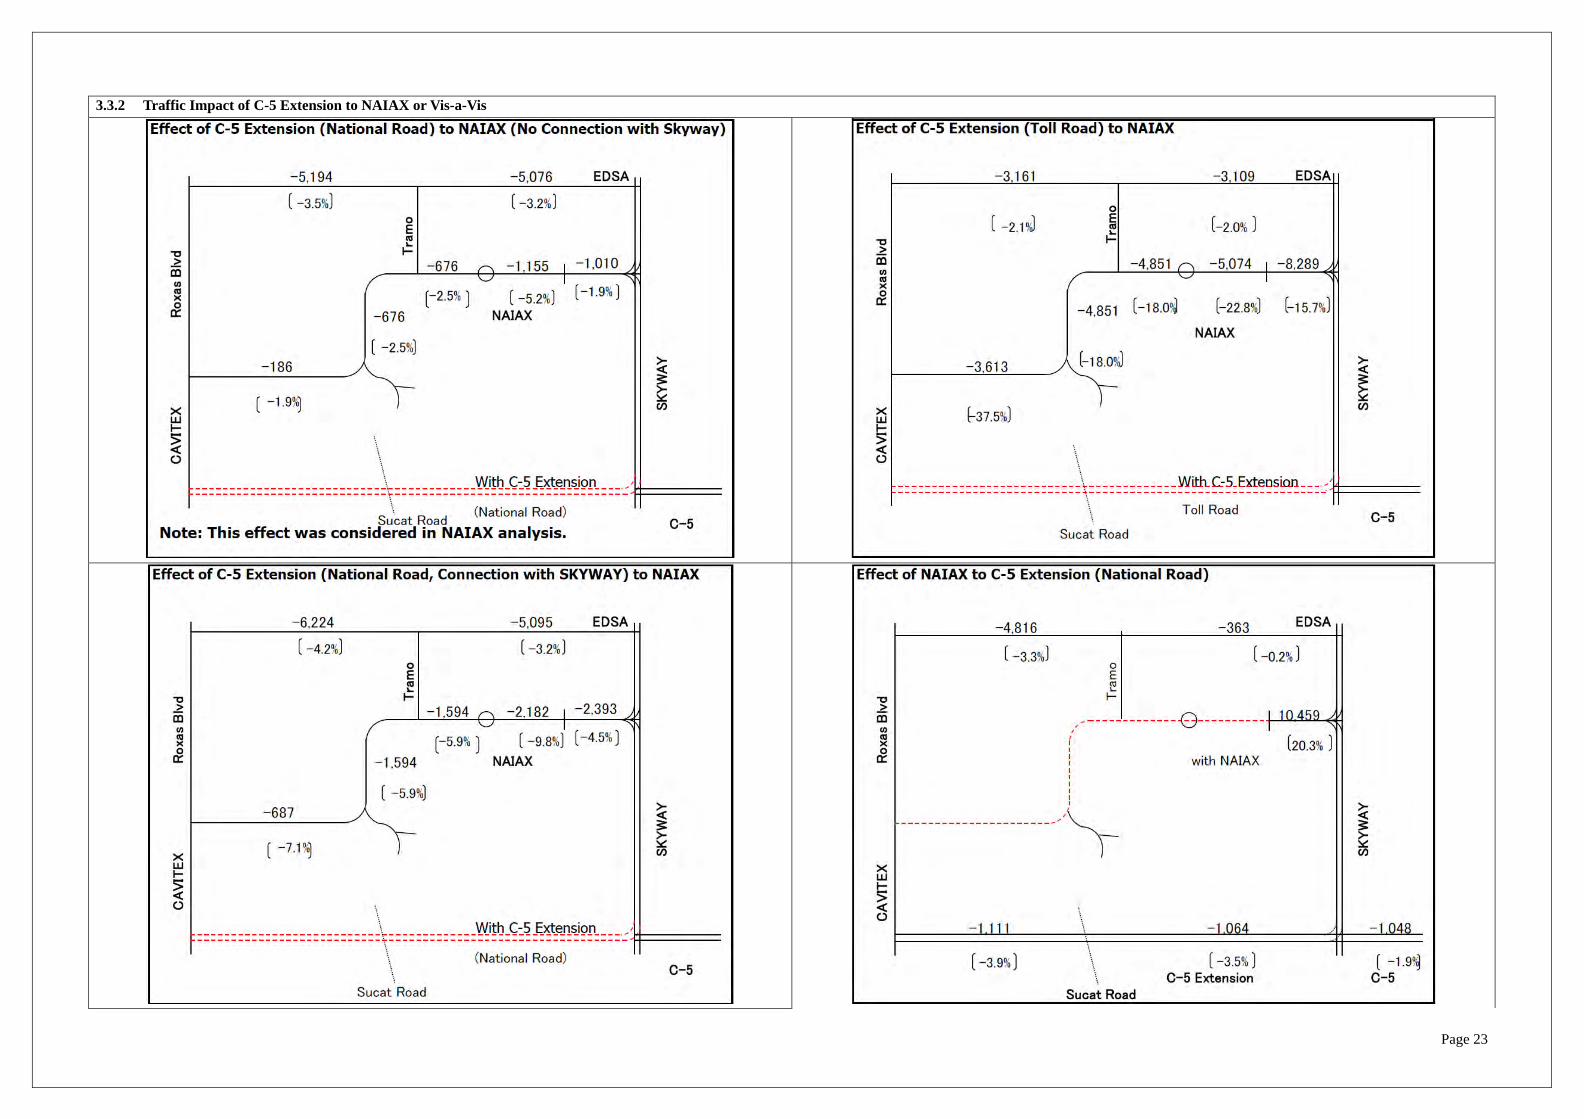
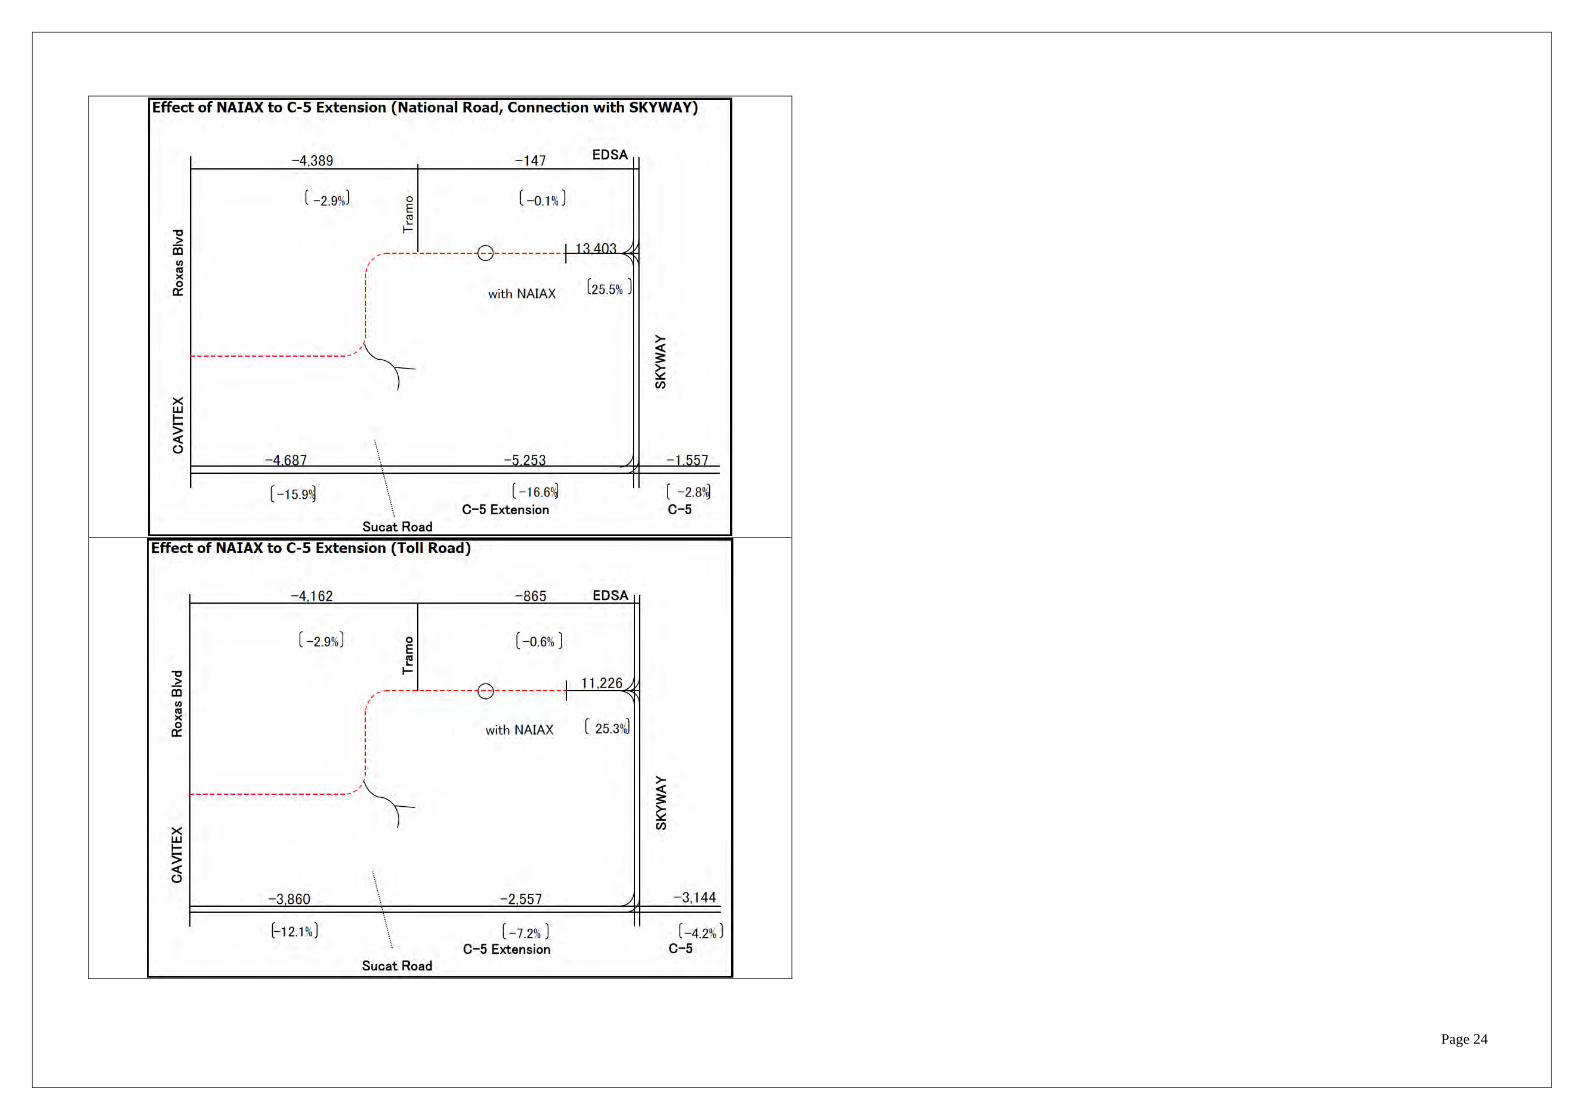
3.3.2 Traffic Impact of C-5 Extension to NAIAX or Vis-a-Vis
Page 24

Page 25
3.3 C-5 Extension as Toll Road 3.3.1 C-5 Extension Alternative Alignments (Toll Road)

Page 26
3.3.2 Connection with Skyway
Page 27
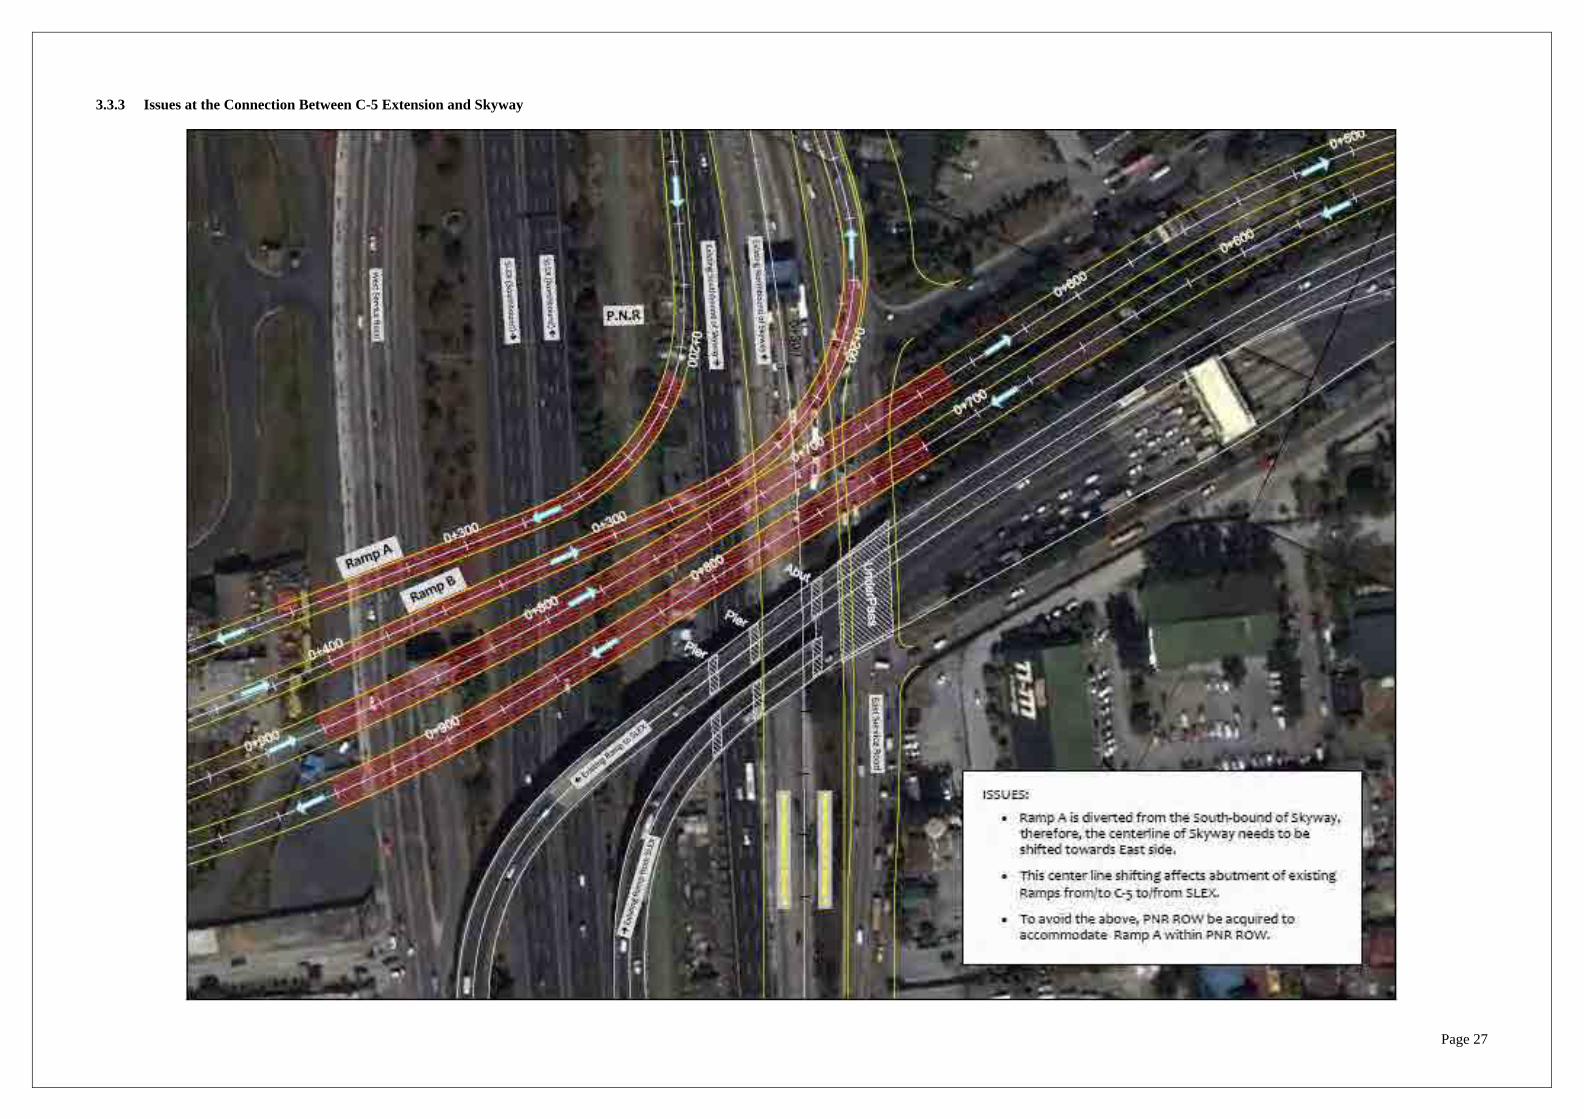
3.3.3 Issues at the Connection Between C-5 Extension and Skyway
Page 28
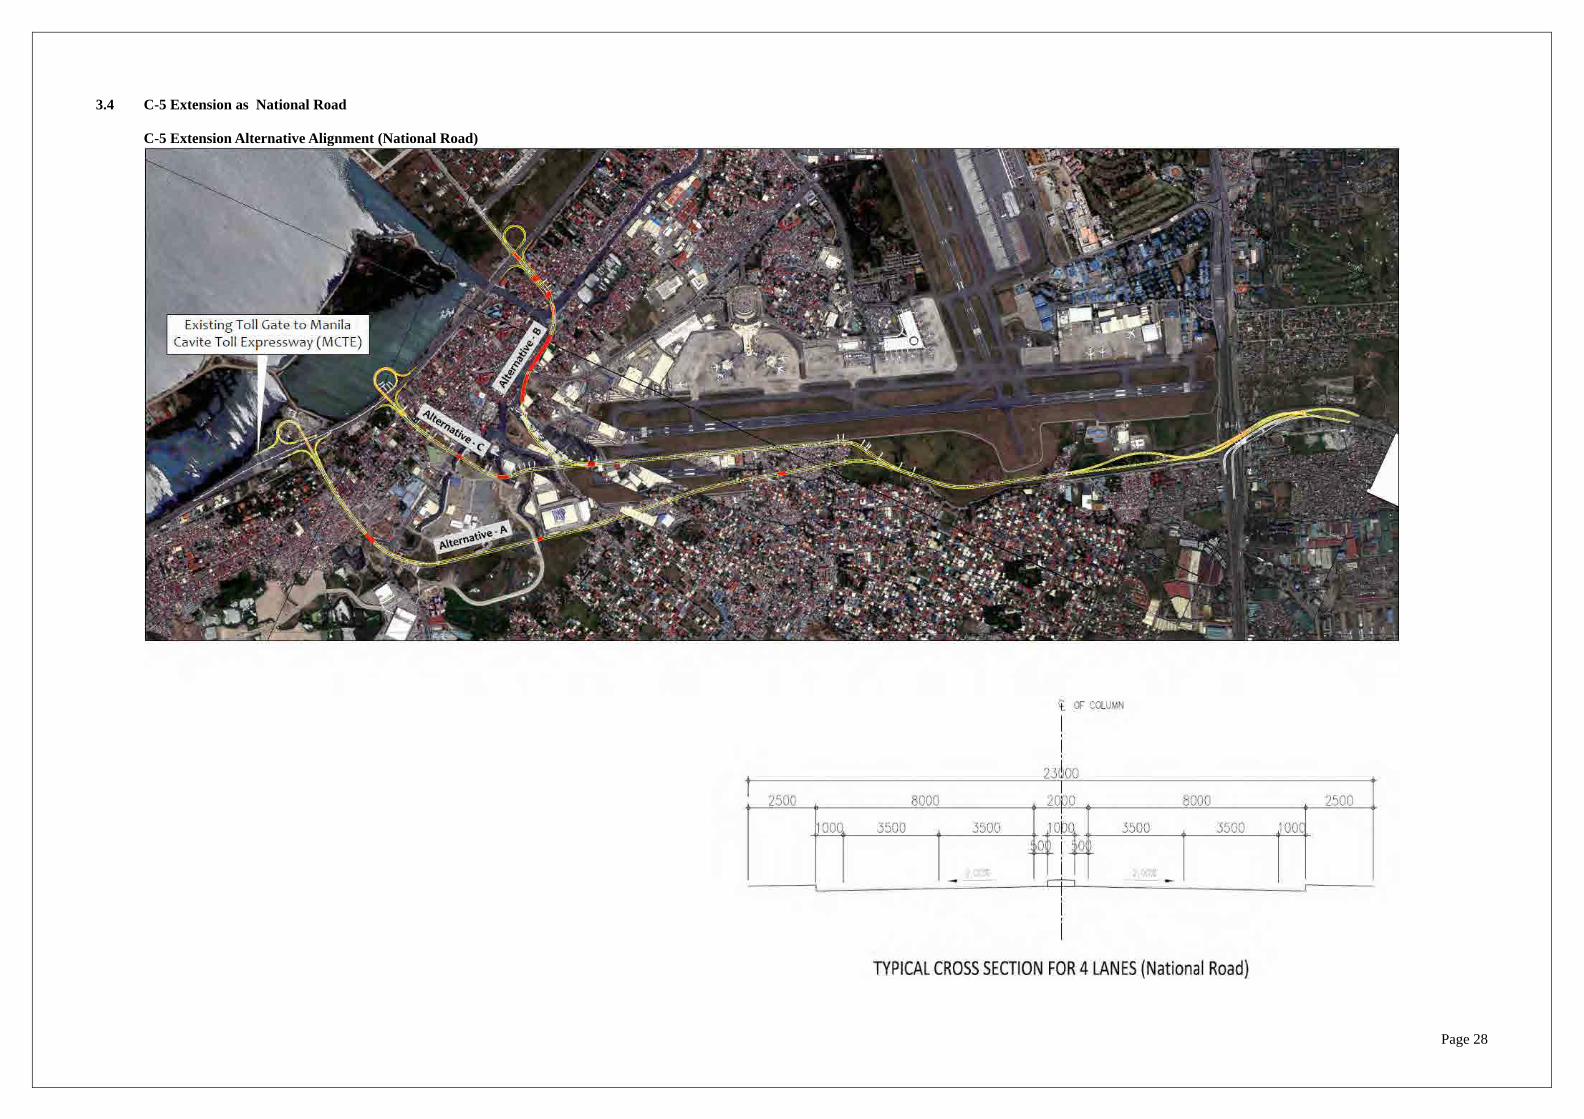
3.4 C-5 Extension as National Road
C-5 Extension Alternative Alignment (National Road)
Page 29
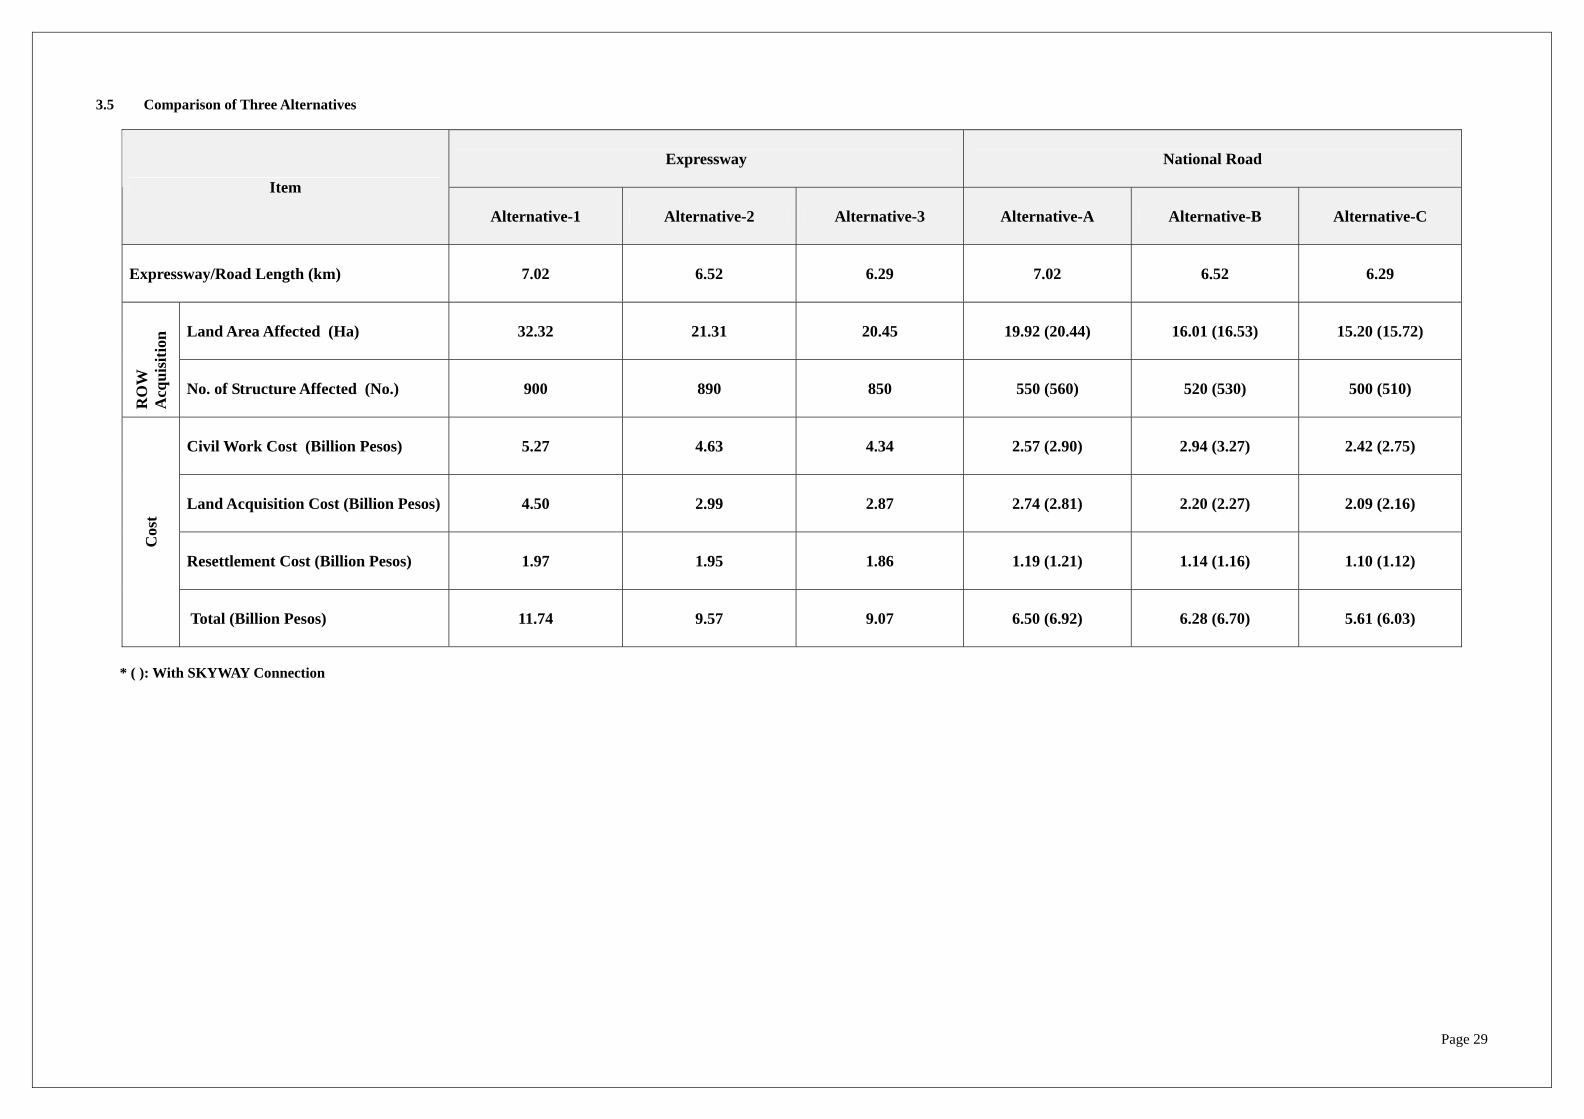
3.5 Comparison of Three Alternatives
Expressway National Road
Item
Alternative-1 Alternative-2 Alternative-3 Alternative-A Alternative-B Alternative-C
Expressway/Road Length (km) 7.02 6.52 6.29 7.02 6.52 6.29
Land Area Affected (Ha) 32.32 21.31 20.45 19.92 (20.44) 16.01 (16.53) 15.20 (15.72)
RO
W
Acq
uisi
tion
No. of Structure Affected (No.) 900 890 850 550 (560) 520 (530) 500 (510)
Civil Work Cost (Billion Pesos) 5.27 4.63 4.34 2.57 (2.90) 2.94 (3.27) 2.42 (2.75)
Land Acquisition Cost (Billion Pesos) 4.50 2.99 2.87 2.74 (2.81) 2.20 (2.27) 2.09 (2.16)
Resettlement Cost (Billion Pesos) 1.97 1.95 1.86 1.19 (1.21) 1.14 (1.16) 1.10 (1.12)
Cos
t
Total (Billion Pesos) 11.74 9.57 9.07 6.50 (6.92) 6.28 (6.70) 5.61 (6.03)
* ( ): With SKYWAY Connection

Page 30
4. Summary and Recommendation 4.1 How NAIAX will be used? Year 2015
Total Traffic Volume : 54,445 (100%) Through Traffic : 14,188 (26.1%) Terminal Related Traffic : 20,555 (37.8%) Mega Manila & Other Traffic : 19,702 (36.1%)
4.2 Grade Separation of Major Intersections Along NAIAX Corridor
Unit: Million Pesos
Cost of Civil Work
ROW Acquisition
Cost Total
Roxas Blvd./MIA Intersection 1,032 24 1,056 MIA Road/Domestic Road/Sucat Road Intersection 965 5 970 Andrews Ave./Tramo Road Intersection 297 103 400
Sub-total 2,294 132 2,426
CAVITEx/Macapagal (Note-1) 279 5 284
Total 2,573 137 2,710
Note-1: This grade separation can be implemented later. 4.3 Traffic Efficiency (Grade Separation vs. NAIAX)
1) At-grade Traffic Volume Reduction
In case of With NAIAX Case, at-grade traffic volume will be reduced by 35,400 to 5,700 veh./day (or 46% - 5% in 2020 depending on road section.
2) Total Traffic Volume Carried (in 2020)
w/o NAIAX : 76,900 ~ 112,400 veh/day (1.00) (1.00) `
w/ NAIAX : 98,100 ~ 116,600 veh/day (1.28) (1.04)
With NAIAX Case, about 1.28 to 1.04 times of traffic is attracted to the NAIAX corridor.
3) Year At-grade Road Traffic Volume Exceeds Traffic Capacity
NAIAX Corridor Section W/O NAIAX
W/ Grade Separation
W/ NAIAX
Sales Road Between 2020 – 2030 After 2030 Andrews Ave. (Sales Road – Circle) Between 2020 – 2030 After 2030 Andrews Ave. (Circle – Domestic Road) 2015 Between 2020 - 2030 Domestic Road Between 2020 – 2030 After 2030 MIA Road (Domestic Road – Quirino Ave.) Between 2015 – 2020 Between 2015 - 2020 MIA Road (Quirino Ave. – Roxas Road) 2015 2015
NAIAX V/C Ratio will be 0.3 to 0.6 in Year 2030, thus there is possibility that more traffic will be attracted to NAIAX to avoid congested at-grade road.
4) Travel Speed & Travel Time Improvement and Travel Time Saving Travel Speed (km/hr)
Skyway – Terminal I Route
Roxas Blvd – Terminal III Route
Skyway – Roxas Blvd Route
w/o Grade Separation 16.0 (1.00) 18.4 (1.00) 19.5 (1.00) At-grade Road w/o NAIAX w/ Grade Separation 26.0 (1.63) 22.0 (1.20) 24.1 (1.24)
At-grade Road 25.7 (1.60) 26.0 (1.40) 24.7 (1.27) w/ NAIAX
NAIAX 47.1 (2.94) 50.0 (27.2) 50.0 (2.56)
At-grade Road w/o NAIAX and w/Grade Separation
Travel speed will be improved by about 1.2 times.
At-grade Road w/ NAIAX
Travel speed of at-grade road will be almost the same as at-grade road with Grade Separation Case.
High travel speed will be enjoyed on NAIAX and travel time to NAIA Terminals will be greatly
saved
With the increase of travel speed, travel time will be reduced and travel time saving will be increased accordingly with grade separation case and with NAIAX Case.
Page 31
4.4 C-5 Extension
1) Three Alignment Alternatives and Expressway Standard or National Road Standard
Standard Alternative Distance No. of L
Width Alternative -1 L = 7.02 km. Alternative -2 L = 6.29 km. Expressway
Standard Alternative -3 L = 6.52 km.
4 - laneW = 38.0 m (Service Road on both sides)W = 28.5 m (Service Road on 1 side) W = 19.0 m (No Service Road)
Alternative - A L = 7.02 km. Alternative - B L = 6.29 km.
National Road Standard Alternative - C L = 6.52 km.
4 - lane W = 23.0 m (with Sidewalk)
2) Connection with Skyway For north-bound traffic: possible, provided that PNR ROW will be acquired, otherwise existing
C-5/SLEx ramps need to be reconstructed.
For south-bound traffic: difficult due to existing C-5/SLEx Ramps unless huge investment is made.
3) Cost of Recommended Alternative
C-5 Extension
Unit: Billion Pesos
Expressway Standard (Alternative-3)
National Road Standard (Alternative-C) (Note-1)
Civil Work 4.34 2.75
ROW Acquisition/Relocation Cost 4.73 3.28
Total 9.07 6.03
Note-1: with Skyway connection
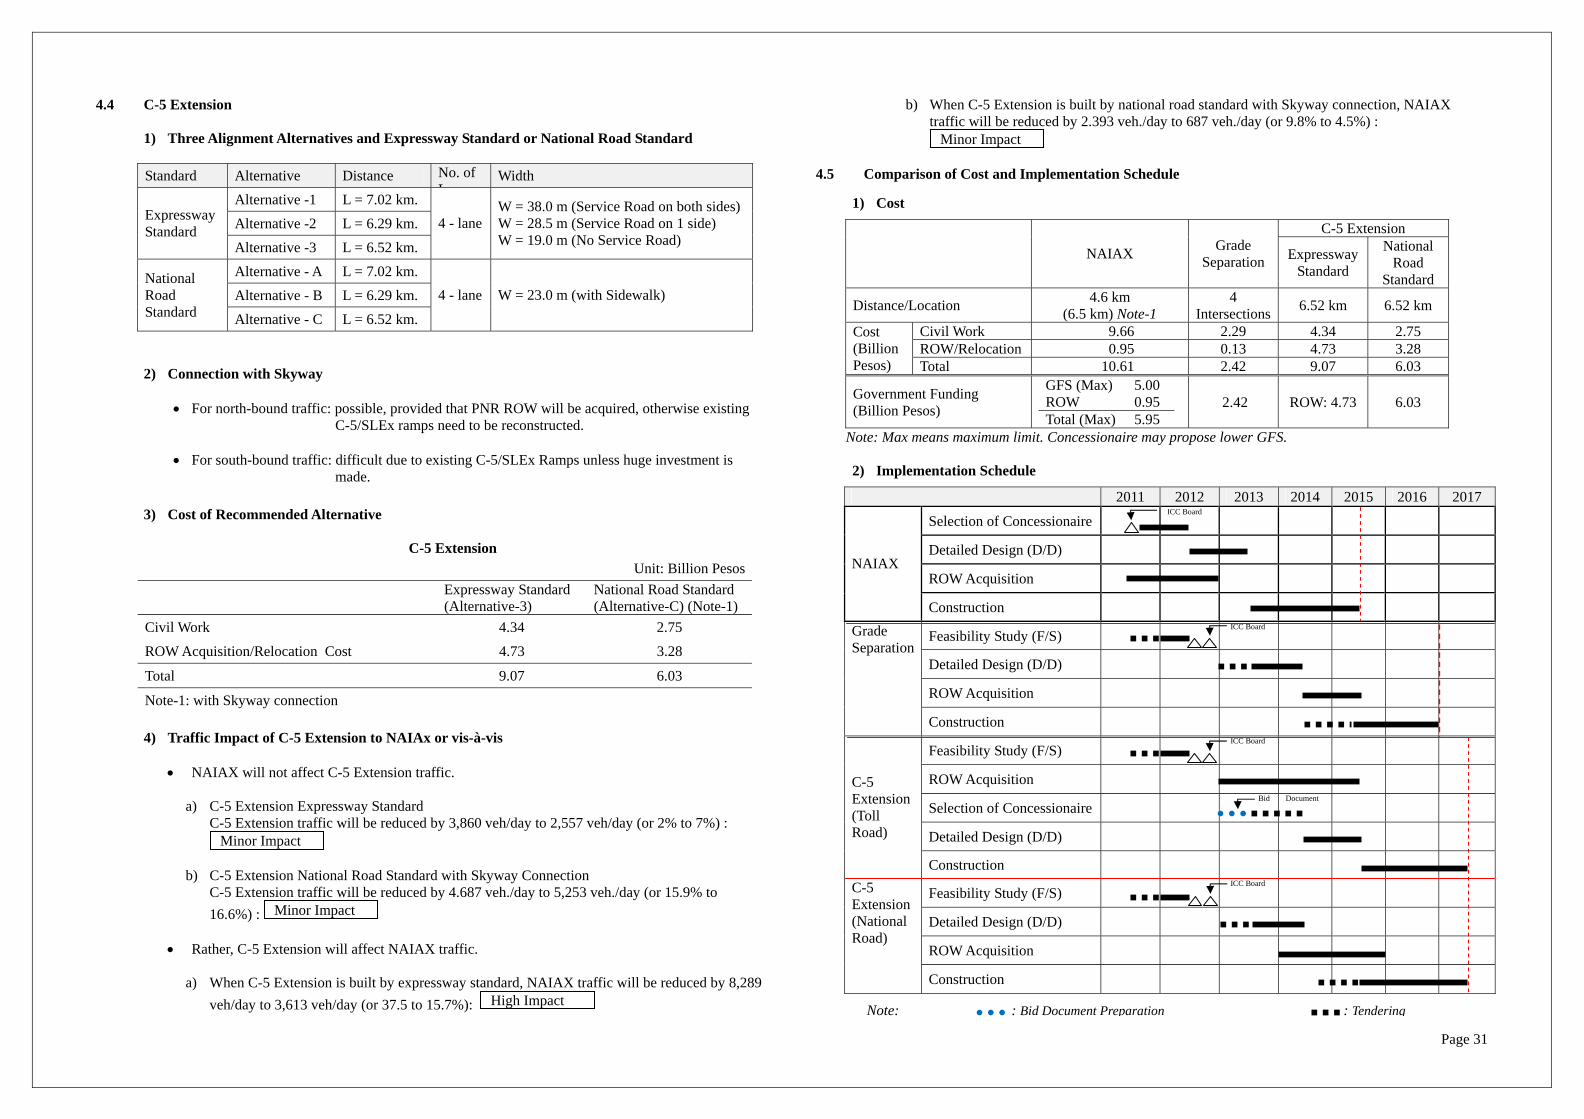
4) Traffic Impact of C-5 Extension to NAIAx or vis-à-vis NAIAX will not affect C-5 Extension traffic.
a) C-5 Extension Expressway Standard
C-5 Extension traffic will be reduced by 3,860 veh/day to 2,557 veh/day (or 2% to 7%) :
b) C-5 Extension National Road Standard with Skyway Connection
C-5 Extension traffic will be reduced by 4.687 veh./day to 5,253 veh./day (or 15.9% to 16.6%) :
Rather, C-5 Extension will affect NAIAX traffic.
a) When C-5 Extension is built by expressway standard, NAIAX traffic will be reduced by 8,289
veh/day to 3,613 veh/day (or 37.5 to 15.7%):
b) When C-5 Extension is built by national road standard with Skyway connection, NAIAX traffic will be reduced by 2.393 veh./day to 687 veh./day (or 9.8% to 4.5%) :
4.5 Comparison of Cost and Implementation Schedule
1) Cost
C-5 Extension
NAIAX Grade Separation Expressway
Standard
National Road
Standard
Distance/Location 4.6 km (6.5 km) Note-1
4 Intersections 6.52 km 6.52 km
Civil Work 9.66 2.29 4.34 2.75 ROW/Relocation 0.95 0.13 4.73 3.28
Cost (Billion Pesos) Total 10.61 2.42 9.07 6.03
Government Funding (Billion Pesos)
GFS (Max) 5.00 ROW 0.95 Total (Max) 5.95
2.42 ROW: 4.73 6.03
Note: Max means maximum limit. Concessionaire may propose lower GFS. 2) Implementation Schedule
2011 2012 2013 2014 2015 2016 2017
Selection of Concessionaire ICC Board
Detailed Design (D/D)
ROW Acquisition NAIAX
Construction
Feasibility Study (F/S) ICC Board
Detailed Design (D/D)
ROW Acquisition
Grade Separation
Construction
Feasibility Study (F/S) ICC Board
ROW Acquisition
Selection of Concessionaire Bid Document
Detailed Design (D/D)
C-5 Extension (Toll Road)
Construction
Feasibility Study (F/S) ICC Board
Detailed Design (D/D)
ROW Acquisition
C-5 Extension (National Road)
Construction
Note: : Bid Document Preparation : Tendering
Minor Impact
Minor Impact
Minor Impact
High Impact

Page 32
(1) Franchise Issue
UEM –MARA has a franchise for the R-1 (Manila-Cavite Coastal Expressway) to R-3 (Skyway/SLEX)
section.
Citra Metro Manila Tollways Corp. has a franchise of Skyway/SLEX.
Proposed C-5 Extension will connect Manila –Cavite Coastal Expressway with Skyway.
When C-5 Extension is planned to be implemented under PPP Scheme, will open bidding be done, or the present franchise holder be granted the right for construction and O & M?
When C-5 Extension is planned to be implemented by DPWH under conventional public work project, what would be the reaction of the franchise holder.
It may take time to conclude what to do for the above issues, since it involves legal interpretation. Implementation of the project may be delayed.
(2) ROW Acquisition and Relocation of Project Affected Persons (PAPs) Quite high “negative social impact”
In case of Expressway standard, about 850 houses (or over 5,000 people) will be affected.
In case of National Road Standard, about 510 houses (or over 3,000 people) will be affected.
Quite high RPW acquisition cost which is higher than civil work cost.
(3) Uncertainty of Implementation Schedule
Above two (2) big issues, franchise issue and ROW acquisition/resettlement issues will cause unexpected delay in project implementation.
NAIAX is recommended to be implemented;
NAIAX is a long-term solution for drastic increase of traffic carrying capacity along NAIAX Corridor.
It mainly serves for NAIA Terminals related traffic.
NAIA is the gateway of international/domestic investors, businessmen, and tourists.
With NAIAX, image of the country will be improved and more investors will be attracted for investment, which will contribute to improvement of international competitiveness.
NAIAX will reduce traffic congestion of at-grade roads.
The project is ready for tendering as soon as NEDA Board approval is made.
Grade-separation Alternative
Although this alternative is efficient solution at congested intersection, but does not improve the traffic condition at the sections before and after the intersection, it will not be a long-term solution.
Once grade-separation structures will be built, construction of an expressway later on will be practically impossible.
C-5 Extension
Franchise issue should be firstly concluded.
Assuming that above franchise issues are solved at an appropriate timing, completion of C-5 Extension will be middle of 2017 at the earliest (or 2 years later of NAIAX completion.
All kinds of efforts should be made to reduce “negative social impact.”
Recommendation Major Issues of C-5 Extension Implementation