Embed Size (px)
Citation preview

PREPARATORY STUDY ON ACCRA PLAIN
IRRIGATION DEVELOPMENT PROJECT
Pre-Feasibility Study Final Report
December 2012
Japan International Cooperation Agency (JICA)
RD
JR 12-106

- 0 -

- 1 -
75km 0 25 50
UPPER EAST UPPER WEST
NORTHERN
VOLTA
COTE D'IVORE
GREAT ACCRA
BRONG-AHAFO
EASTERN
Bongatanga
ASHANTI
CENTRAL
WESTERN
TOGO
Tamale
Wa
Accra
Awaso
Cape Coast
Ho
Koforidua
Kumasi
Suntani
BENIN
BURKINA FASO
Project Site
Tema
Dodowa
Weija Accra
Koforidua
Aveyime
Ashaiman
Kpong
Akuse
0 30km
Volta River
To Akosombo Dam
Kpong Dam
Project Area (APGIP)
Dangme West Dangme East
Ga East
Ama
Tema Municipal
Ga West
Yilo Krobo
North Tongu
Akwapim South
Akwapim North
Manya Krobo
Asuogyaman
Suhum Kraboa Coaltar
New Juaben Municipal
East Akim
Volta Region
Great Accra Region
Eastern Region
South Tongu
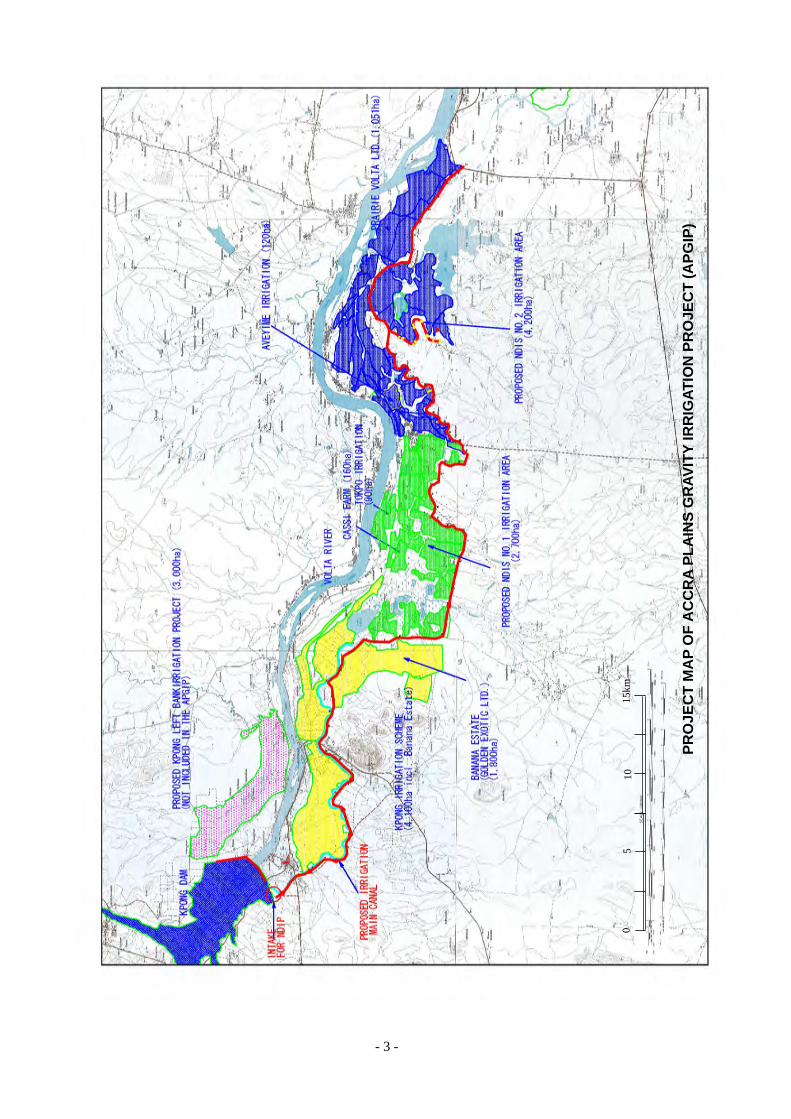
LOCATION MAP OF THE PROJECT SITE

- 2 -
EXIS
TIN
G C
ON
DIT
ION
OF
AC
CR
A PL
AIN
S G
RAV
ITY
IRR
IGAT
ION
PR
OJE
CT
AR
EA
05
15km
10
- 3 -
05
15km
10
PRO
JEC
T M
AP
OF
AC
CR
A PL
AIN
S G
RAV
ITY
IRR
IGAT
ION
PR
OJE
CT
(APG
IP)

- 4 -
Summary of Accra Plains Gravity Irrigation Project
1. Introduction 1.1 Objectives of the Project At this study stage, a pre-feasibility study is required on the basis of establishing a gravitational irrigation system in Accra plains in the right bank area of Volta River. The scope of the work required for the study is explained in the following items:
- Technical study of gravity irrigation systems. - Operation, maintenance and management of the project - Project cost estimation - Benefit estimation - Economic analysis - Financial analysis - Environmental and social consideration
1.2 Activities of the Study Team The study team focuses on five areas, namely irrigation development, infrastructure planning and design, organization and irrigation system management, agronomy agro-economy, and environment and social consideration. The study period for the pre-feasibility study for the Accra Plains Gravity Irrigation Project is from January 2011 to May 2011. 2. Project Area 2.1 Project Background The Accra plains extend about 156,000 ha (approximately 200,000 ha) along the right bank of the lower Volta River. The feasibility study for the whole Accra plains area for irrigation development has been conducted from the year 2008 to 2010 with assistance provided by the Kuwait Fund (a grant of US$1.4 million). In June 2010, the feasibility study on the first prioritized area (relatively flat with 5,000 ha) in the Accra plains with a pump irrigation system was completed. 2.2 Hydro-meteorological Conditions The country's warm, humid climate has an annual mean temperature of between 26°C and 29°C. Variations in the principal elements like temperature, rainfall, and humidity that govern the climate are influenced by the movement and interaction of the dry tropical continental air mass, or the harmattan, which blows from the northeast across the Sahara, and the opposing tropical maritime or moist equatorial system. Meteorological stations are located in Akuse and Aveyime in the project area at an elevation of 5 to 10 m above sea level. The mean monthly maximum temperature in March and August is 30.2°C in Akuse and 30.6°C in Aveyime, while the monthly minimum temperature is 26.7°C in both places. The annual rainfall in the Accra plains ranges from 850 to 1,400 mm as observed at the Akuse and Aveyime stations. The average annual rainfall is 1,046.8 mm in Akuse (1990–2010). The command area is located along the Volta River, with its stretch of about 86 km from immediately

- 5 -
downstream of the Kpong dam to the river mouth. Akosombo dam is located at 25km upstream of the Kpong dam site. The river discharge is dominant, with enough released water for hydro power generation. Both the Akosombo and Kpong dams release about the same volume of water, enough to efficiently generate electric power. As for the water level of the Kpong dam reservoir, the highest level is 16.97 m (2010) and the lowest is 13.92 m (1998). The water level of the Volta River constantly fluctuated from 2.5 to 4.0 m during the observation period of 1984 to 2010. A higher water level, 6.28 m, was observed in November 4, 2010. The rise was mainly caused by flood inflow to the Akosombo dam as well as to the Kpong dam. Study for the Formulation for Irrigation Project in Africa was conducted by JICA in August 2010. During the course of the study in Ghana, the study team proposed a potential gravity irrigation project in the Accra plains, by taking irrigation water from the existing Kpong dam. 2.3 Water Resources The major water resources in the area are the Volta River and several small rivers. The Volta River has two major water reservoirs: the Akosombo dam reservoir and the Kpong dam reservoir. The main function of the two dams is to generate hydro electric power. The Akosombo dam is 111 m tall, with a crest length of 660m, a reservoir storage volume of 148 km3, and a surface area of 8,502 km2. The dam utilizes 1,200 m3/sec of water discharge to generate 1,020 MW of hydro electric power. The water is released into the Volta River and reaches the Kpong dam. The Kpong dam utilizes the same amount of water as Akosombo dam to generate 160 MW of hydro power. The storage capacity of the Kpong reservoir is 160 million m3. The discharge for hydropower generation of 1,200 m3/sec corresponds to 103.7 million m3/day, which is about 65% of the Kpong reservoir storage capacity. The storage capacity of the Kpong reservoir can be filled up within about one and half days using the maximum water discharge from the Akosombo dam. The water level in the Kpong dam fluctuates according to the balancing of water inflow from the Akosombo dam and water release from the Kpong dam for hydroelectric power generation. The water level of the Kpong dam for the normal operation head pond is 14.75 m, whereas that of the high head pond is 17.7 m. The dam crest elevation is 18.75 m and that of the normal tail water downstream is 3.0 m. There are two existing intake structures for irrigation purposes: on at the right bank of the Kpong dam for the existing Kpong irrigation scheme, and one at the left bank for the Kpong left bank irrigation scheme, the construction of which has just begun under MiDA in March 2011 and covers an area of 2,000 ha. The intake capacity of each scheme is designed to be 7.2 m3/sec.
2.4 Socio-economy The project area extends mainly across three districts, i.e., Dangme West and Dangme East of the Greater Accra Region, and North Tongu of the Volta Region, the population of which is estimated at 126,450, 117,544, and 208,442 respectively as of 2010. The share of agriculture, animal husbandry, fishing and forestry in the economically active population is 50–52% in Dangme West and East, and 70% in North Tongu. The number of small-scale farmers living in the project area is estimated to be approximately 2,500 for the Kpong Irrigation Scheme (KIS) and 2,720 for the New Development

- 6 -
Irrigation Scheme (NDIS).
2.5 Soils The major soils distributed in the project area extending along the right bank of the Volta River, are i) Gleyic Cambisols (Amo Series), ii) Eutric Vertisols (Tefle Series) and iii) Calcic Vertisols (Akuse Series). According to the FAO land evaluation system, the Amo Series and Tefle Series are assessed as highly suitable for rice cultivation, and the Akuse Series is assessed as moderately suitable.
2.6 Infrastructure The roads are broadly classified into primary, secondary and feeder roads. The three districts covered by the project have a fair distribution of the road network, with almost every settlement connected to one of the roads. The primary roads are constructed of asphalt pavement and connect, Akuse, Aveyime and Mepe, the major towns in the project area. Gravel and sand materials are used for the secondary roads, but some of the feeder roads, with their clay pavement, are in a bad condition as they become slippery during the wet season. The Danish International Development Agency (DANIDA) in cooperation with the Community Water and Sanitation Agency (CWSA) is supporting the provision and service of water and sanitation facilities to rural communities in the Greater Accra Region. The water supply scheme for the related districts of Dangme East, Dangme West, and North Tongu is located in some rural and small towns in the eastern part of the Great Accra Region. That water system takes its source from the Volta River and covers most of the project area with a conduit network. The water tap is located at a minimum walking distance to the standpipe, 500 m. The major towns and villages in the project area are linked to the national electricity grid. At present, the major communities in the project area are connected to electricity under Self-Help Electrification Programmes (SHEP) 1, 2, 3 2.7 Agriculture The gross area of APGIP is 11,570 ha and the existing irrigated rice fields account for 2,342 ha, 20% of the project area. The banana farm of Golden Exotics Ltd. is 1,200 ha in area, accounting for 10% of the project area. The largest land use category in the area is upland fields, occupying 4,441 ha or 38% of the project area, while the 2nd largest land use category is grassland, representing 3,061 ha and covering 26.5% of the project area. The primary crops in the project area are irrigated rice and bananas. Crop productivity in upland fields is very limited under the traditional and unstable rain-fed cultivation system.
2.8 Existing Irrigation System In the project area, there are three existing irrigation systems managed by GIDA. Kpong Irrigation Scheme (KIS) was constructed to supply irrigation water to 1,955 ha in the Asutsuare area utilizing gravity and contribute to new development of 1,073 ha in the Akuse area. The Aveyime Irrigation


- 9 -
Water Intake Capacity from Kpong Dam Irrigation scheme Net
irrigation area (ha)
Peak discharge (m3/sec)
Annual average. intake volume
(1000 m3)
Annual average
discharge (m3/sec)
Reducing hydropower generation
(MWH/year)
Opportunity cost (GHC 1000/year)
KIS 4,100 7.151 79,739. 2.528 2,370 78.2
NDIS 6,900 11.382 158,603. 5.029 4,714 155.6
Total (APGIP) 11,000 18.533 238,342. 7.558 7,084 233.8
3.3.2 Potential of the Norboyita Dam According to the latest obtained DTM topographic map surveyed in the year 2010, the narrowest point at the elevation level of 15.0 becomes very wide—about 4 km—as shown in the above figure. The height of the dam would be about 12 meters. Accordingly the dam construction is much more costly than the river training work, hence, the dam construction plan is not recommended. The siphon method can be applied to cross the Norboyita River, since the irrigation water from the Kpong dam is very clear and the main canal is lined by concrete so that no sediment load will be expected in the siphon area.
3.3.3 Alternative Study of the Irrigation Schemes (1) New Intake Capacity and Alternative Study The following 3 alternative studies have each been compared with the case of the existing KIS both with and without improvement of the existing main canal and the new development area of NDIS. Case 1: New development area (NDIS) only, excluding existing KIP Case 2: New development area (NDIS) and improvement of KIS by concrete lining of the main
canals. Case 3: Combined plan of new development area (NDIS) and KIS as one new main canal and
existing KIP intake and canal are abundant. Case-2 was selected for rehabilitation and development of KIS and NDIS from the economic point of view.
3.3.4 Water Requirement Analysis Irrigation acreage of each irrigation scheme is shown in the following table. In KIS, a 20 ha fish pond has been considered to require the same amount of water as upland crops.
Irrigation Acreage in Irrigation Schemes
Irrigation Scheme Paddy fields
(ha)
Upland fields
(ha)
Banana Farm
(ha)
Total
(ha)
KIS 2,259 41 (20) 1,800 4,100
NDIS 6,738 163 0 6,900
Total (APGIP) 8,997 203 (20) 1,800 11,000
Note: A 20 ha fish pond is included in the upland field. Banana farm irrigation is carried out for 12 hours.

- 10 -
Peak and Average Discharge of Irrigation Schemes
Irrigation
scheme
Peak discharge
(m3/sec)
Volume
(1000 m3)
Discharge
(m3/sec)
Increment
discharge
KIS 7.151 79,739. 2.528 0.240
NDIS 11.382 158,603. 5.029
Total 18.533 238,342. 7.558 0.240
3.3.5 Water Availability from Kpong Reservoir Based on the analysed half monthly water level data, available water intake capacity was estimated adopting the approximation equation. Several severe years are selected to compare water availability from the Kpong dam and necessary water intake capacity as shown in Table B.2. As a result, available water will not be sufficient to intake due to a low water level for about one month in April or May in 1998 and 2007. The frequency of the water deficit is estimated at two times in the duration of twenty eight years, which corresponds to a 2/28 return period. The abnormal drought condition is estimated to occur once every fourteen years. 3.3.6 Reducing Hydro Power Generation In order to estimate the negative benefit of power generation capacity caused by APGIP, the average discharge on the basis of the annual volume of intake has been calculated. The opportunity cost of water has been estimated as follows:
Reducing Hydropower generation caused by APGIP Irrigation scheme
Average power generation loss (MWH)
Negative benefit (GHC × 1000)
Negative benefit (US$1000)
KIS improve 1,875 244 164
KIS increment 178 23 16
NDIS 3,730 485 326
Total (APGIP) 5,605 729 490
3.4 Environmental and Social Considerations Related policies and regulations for the environmental and social considerations provided by the government of Ghana (GOG) are “The Ghana Environmental Assessment (EA) Regulations,” “The State Lands Act (Act 125) of 1963,” and “Environmentally Sensitive Areas” (ESAs). The policy of the JICA’s Guidelines for Environmental and Social Considerations (April 2010), hereinafter referred to as the “JICA Environmental Guideline” is explained in Paragraph 3.5.2. in the main text. An outline of the “World Bank (Safeguards Policies)” is provided in Paragraph 3.5.3.
3.5 Organization and Management Plan A possible organization and management structure is discussed as a sample in the Study. A private scheme management company (SMC) is expected to be deployed for managing NDIS, while KIS would be operated by KIP striving to enhance its performance. SMC would operate and maintain

- 11 -
NDIS effectively and efficiently by self financing based on ISC collection so that farmers and farm enterprises in the project area would receive the full benefit, under the concession contract with GIDA/MoFA. SMC would provide paid services of agricultural support to small and medium-scale farmers as well as promoting a market-oriented mindset among farmers in the project area.
4. Facilities Plan 4.1 NDIS Facilities Plan Irrigation water is supplied to farmland by gravity. The intake is installed in the right bank of the Kpong dam in consideration to the dam location and the alignment of the Akuse main canal of KIS. Irrigation blocks are broadly divided into two areas: NDIS No. 1 area and No. 2 area, which are bounded by Sege-Aveyime road. Appropriate diversion points are selected to supply irrigation water to each farm block or the most upstream block in a series of farm blocks.
Structures Canal length 1. 2. 3. 4.
Main canal Secondary canal Pipeline (dia. 600 – 900 mm) Appurtenant structures, siphon, drainage culvert, check gate, spillway, emergency outlet, etc.
69.1 km 115.5 km 9.95 km
Upstream of the hilly terrain along the right bank of the Volta River, swamp areas and ponds have been developed along the approximately 50 km distance between Akuse to the Prairie farm. The very gentle slope along the hilly area has been accelerating sediment deposition flowing out from the upstream drainage area. That is why arable areas with an elevation level lower than 5m have poor drainage, causing water logging that hinders agricultural farming, including rice cultivation. The drainage improvement work is implemented at several sites in the command area and outlets to the Volta River.
Area in NDIS Location Length 1. No. 1 area Irrigation block 8-11 10 km No. 1 area outlet drainage 15 km 2. No. 2 area Lac Aklamador outlet 30 km
4.2 KIS Facilities Plan The NIS irrigation system consists of gravity and pump lifting systems. The main features of KIS rehabilitation work are lining canals with concrete and adding more check gates, spillways, emergency outlets, etc.
Irrigation canal Discharge Length 1. Akuse main canal 7.2 – 4.1 m3/sec 16.2 km 2. South lower level canal 3.88 m3/sec - end
(1.46 m3/sec downstream of pump station) 5.3 km
3. North lower level canal 0.46 m3/sec - end 5.1 km 4. Distributary Z 8.1 km 5. Distributary Y 3.0 km 6. High level canal 2.42 m3/sec 5.6 km

- 12 -
The insufficient drainage canal slope causes water logging in farmland in KIS. In addition, heavy weeding in the drainage canal also causes insufficient flow capacity of the canal. It is therefore necessary to improve the drainage condition.
Location Length 1. Lupu main drain 5.0 km 2. Lupu-Klebwe outfall 1.0 km 3. Klebwe outfall 1.5 km 4. Sopa drain 2.5 km 5. Sopa- Kasu link drain 2.0 km 6. Kasu outfall drain 1.5 km 7. Kasu drain outlet 2.0 km 8. 10.0 km 9. 9.0 km
4.3 On Farm Development Paddy fields are developed in 10 ha (200m × 500m) blocks in principle. Farm roads 4.0 m wide, as well as 0.5m × 0.5m on-farm canals and drainage canals are provided by the project. Top soil shall be repeatedly moved to the vicinity field. 4.4 Workshops for Agricultural Support and OMM The proposed plants and equipment are shown in Table G.3 and G.4 in Annex G. The plants and equipment for agricultural support are to be progressively installed as rice production increases thanks to the progress of the project. The plants and equipment for OMM deployed for the project would be operated and maintained in the mechanical workshop of each project. The existing KIS workshop would be used as it is and a new workshop would be developed for NDIS.
5. Initial Environmental Examination (IEE) 5.1 Comparative Examination of Alternatives The cases of adopting the project and of not adopting it are compared. Adopting the project may be one way to enhance food security and develop agro-based industries. However, the project area is a plain, and there may be adverse impacts on the environment. If the project is not adopted, there may be no adverse impacts on the environment, but deciding to not adopt the project may not be in line with Ghana’s agricultural policy on food security and the millennium development goal for reduction of hunger. 5.2 Possible Adverse Environmental and Social Impact The possible adverse environmental and social impact that may be caused by adopting the project is reviewed. At the present stage, no serious impact is expected. This is because no involuntary resettlement is expected at the present stage since the dam reservoir is not constructed, and irrigation canals don’t pass by existing communities. A new irrigation water intake from the Kpong Dam might not have the serious problem of salt intrusion downstream of the Volta River, but some effects are expected, such as soil erosion and water pollution.

- 13 -
5.3 Mitigation and Monitoring for Key Impacts Assumed mitigation measures for possible adverse environmental and social impacts are reviewed. They are shown in Annex F, Table F.2. These possible adverse impacts can be avoided, minimized and mitigated, if the proponent can implement timely action and take proper measures at the planning phase, construction phase, and operation phase. 5.4 Additional Study for Next Feasibility Study An additional study on environmental and social considerations leading up to the next Feasibility Study is proposed, covering: (1) an environmental impact assessment study covering the whole project area, (2) public consultation meetings, (3) an environmental study on the value and importance of wetlands, and (4) consideration of an effective and feasible monitoring plan.
6. Possible Options of Organization and Management Possible options for organizing and managing APGIP were examined, and a scenario based on the option was applied in this study in order to provide some materials for starting discussion. 6.1 Land Ownership Land of the existing KIP area is owned by GIDA/GOG and allocated to farmers under the lease contract. For NDIS, there are two options, i.e., one is following the same process as KIS, and the other is that GIDA will acquire long-term land-lease holdings with exclusive attorneyship by paying premiums and arranging land-lease contracts between land owners and users. 6.2 Irrigation Users There will be no changes in irrigation users or the land allocation agreement of KIP. The irrigation users invited to NDIS will be categorized into three farmer types, i.e., small-scale, medium-scale, and large-scale farm.
NDIS Irrigation Users: Farmer Types Object Self consumption and commercial Commercial
Farmer Type Small-scale Medium-scale Large-scale Farming Type Self consumption / local market
or functioning as out-grower of agribusiness
Domestic market Domestic/ export agribusiness
Size 1–2 ha Represented by 1.5 ha
10–30 ha Represented by 20 ha
One unit: 50–100 ha
Support Services Full or partial support services are necessary Not necessary/ individual 6.3 Development of Land and Irrigation Infrastructure The land for NDIS will be divided into a number of secondary blocks, of which the size is expected to be 100–300 ha depending on the geographical and irrigation network conditions. Each secondary

- 14 -
block would be categorized as either a Private Development Block or Public Development Block depending on the type of development. Private Development Blocks: to be developed through the initiative and investment of the private sector, such as the agribusiness enterprise (large-scale farm). Within a block, large-scale farms will occupy 70% of the land for their own farming, and the remaining 30% will be allocated to small-scale farmers, which are expected to perform as out-grower farmers or contract farmers under the large-scale farms. Public Development Block: to be developed by the government (GIDA). Of the land, 70% will be allocated to small-scale farmers and 30% will be allocated to medium-scale farmers. 6.4 Scenario Applied in the Study The overall land distribution to each farmer type will be decided by the allocation of public and private blocks, which shall be decided in consideration of marketability and the business plans of the invited large-scale farms as well as the government policy. In the study, the scenario that 50% of secondary blocks would be allocated to private development blocks and the remaining 50% would be allocated to public development blocks, was applied. The allocation of agricultural land to each category in the scenario is summarized as shown below:
Agricultural Area Allocated to Categories in the Scenario Farm Type NDIS Newly
Developed (ha)
NDIS Existing Large Farms (ha)
KIS (ha)
Total (ha)
Small-scale 2,800 - 2,300 5,100 Medium-scale 900 - - 900 Large-scale 2,000 1,200 1,800 5,000

- 15 -
7. Cost Estimation 7.1 Project Implementation The construction site is composed of NDIS and KIS areas. The construction work is broadly classified into the construction of the intake, canal construction and land development in NDIS, and concrete lining work in KIS. In addition, both projects include drainage improvement work. The construction of the project office, workshop, garage for OM machinery and equipment, rice dryers and rice storage is categorized as architectural work. The procurement of OM and agricultural machinery and equipment is also included in the project. 7.2 Implementation Plan and Schedule The original contracts are divided into several packages, including one for building work, and another for procurement of OM, agricultural machinery, and equipment. Considering the urgent need to rehabilitate the existing KIS irrigation systems, the packages are recommended to be carried out in parallel with the main canal construction of NDIS in the extent of the Akuse main canal and the south low level canal. As to the canal construction work, including the secondary canal of NDIS, there is no obstructive factor for the construction. The contracts of three to four packages are recommended considering the management capacity of the local contractors. Considering the appropriate construction capacity of the heavy machinery for the earth work, mainly the compaction of the embankment and concrete production capacity of the mixing plant, three years and two years are required to complete the work of NDIS and KIS rehabilitation works respectively, including the period for mobilization and demobilization. Bidding for the procurement of OM, agricultural machinery and equipment shall be announced at an earlier time to ensure an assembly and shipping period for the machinery of at least eight months. 7.3 Project Cost The construction cost is composed of the direct construction cost, indirect cost, OM facility and equipment, agricultural equipment, land acquisition and compensation, administration, engineering services, physical contingency, and price contingency, as well as the tax. Project cost is summarized below.

- 16 -
Project Cost (NDIS) Description Amount Remarks (GHC × 1000)
I. Construction Cost 1. Main irrigation canal construction 31,507.4 2. Secondary canal construction 19,772.8 3. Drainage work 361.8 4. Land development 19,223.2 5. Warehouse, building work 2,467.1 Total (1+2+3+4+5) 73,332.3 6. Temporary cost 1,466.6 2 % of (1+2+3+4+5) 7. Site expense 7479.9 10 % of (1+2+3+4+5+6) 8. Overheads and profit 6,582.3 8 % of (1+2+3+4+5+6+7) Total I. 88,861.1
II. Procurement cost for OM equipment 4,976.0 Total (I+II) 93,837.1
III. Administration cost 938.4 1 % of (I+II) IV. Engineering services 4,691.9 5 % of (I+II)
Total (I+II+III+IV) 99,467.4V. Physical contingency 4,973.4 5 % of (I+II+III+IV) VI. Price contingency 10,428.7 2 % per year of (I+II+III+IV)
Total project cost 114,869.5Note: The cost of agricultural machinery/equipment (GHC 3,542,700) and land acquisition is excluded from the table.
Project Cost (KIS) Description Amount Remarks (GHC × 1000) I. Construction Cost 1. Akuse main canal 6,035.2 2. South lower level canal work (by pump station) 658.6 3. South lower level canal work (downstream of pump
station) 649.8
4. North lower level canal work 525.1 5. Distributary Y canal work 251.9 6. Distributary Z canal work 762.6 7. High level canal work 1,373.7 8. Gate installation, including concrete work 581.6 9. Drainage work 977.1 10. Dryer, rice storage work 1,313.7 Total (1 to 10) 13,129.3 11. Temporary cost 262.6 2 % of (sum of 1 to 10) 12. Site expense 1,339.2 10 % of (sum of 1 to 11) 13. Overheads and profit 1,178.5 8 % of (sum of 1 to 12) Total I. 15,909.6 II. Procurement cost for equipment 1. Procurement of OM equipment 2326.7 2. Procurement of agricultural machinery 2339.0 Total II. 4,665.7 Total (I+II) 20,575.3 III. Administration cost 364.7 2 % of (I+II) IV. Engineering services 911.8 5 % of (I+II) Total (I+II+III+IV) 21,851.8 V. Physical contingency 975.6 5 % of (I+II+III+IV) VI. Price contingency 1,747.5 2% of (I+II+III+IV) Total project cost 24,574.9
Note: Land acquisition cost is excluded from the table.

- 17 -
7.4 Annual Operation and Maintenance Cost, and Replacement Cost (1) OM cost The cost for annual operation and maintenance at the full development stage are estimated at about GHC 1.40 million (Direct cost) for NDIS and GHC 0.71 million (Direct cost) for KIS, but the cost of machinery and equipment depreciation is excluded. The OM cost is comprised of the costs for salaries and wages of project staff, and running and maintenance costs such as fuel and lubricant for the irrigation facilities. OM cost for the irrigation facilities consists of rehabilitation of the concrete lining, gravel pavement repair, weeding, etc. Annual OM costs above are equivalent to about 1.6% and 4.5% of the construction cost of each project. (2) Replacement cost Intake and division gates require replacement within the project’s useful life because the facilities have a shorter useful life than civil works. The cost is estimated at about GHC 1.23 million for replacement after ten years for the small gates and GHC 0.36 million for the large gates of NDIS. Similarly, the cost is estimated at GHC 0.27 million for replacement for the small gates after ten years, and GHC 0.04 million for the large gates of KIS. OM, agricultural machinery, and equipment are also replaced after ten consecutive years of use. 7.5 Preliminary Estimation of Irrigation Service Charges (ISC) ISC comprises three components, i.e., the land rent fee, water fee, and development fee. ISC is to be set to cover the necessary OM cost of the irrigation system. The expected price level of ISC was estimated preliminarily in the study, as well as the on-farm OM cost and required development cost of farmland as shown in Table 7.6.6. The estimated price levels of ISC are 243 GHC/ha-year in KIS and 276 GHC/ha-year in NDIS for small and medium-scale farms, and 322 GHC/ha-year in KIS and 431GHC/ha-year in NDIS for large-scale farms. 8. Project Evaluation 8.1 Economic & Financial Evaluation The results of economic evaluation of the Project are summarized as follows:
Economic/Financial Evaluation & Sensitivity Analysis Economic Analysis Sensitivity Analysis (EIRR %)
Project/Scheme EIRR (%) B/C Ratio Case 1 Case 2 Case 3 Case 4 KIS 20.8 1.8 20.1 18.9 20.3 18.3NDIS 19.3 1.7 17.9 17.7 18.1 17.0APGIP 19.8 1.7 18.6 18.1 18.8 17.4
Case 1: Construction cost 10% up, Case 2: Irrigation & drainage benefit (crop production benefit) 10% down, Case 3: Irrigation water supply (construction work) 1 year delay Case 4: Target yields for paddies about 10% down
On the basis of the estimated irrigation service charges under the project, the capacity-to-pay of small-scale farms (KIS: 1.0 ha/farm & NDIS: 1.5 ha/farm) is examined. Net surpluses of GHC 4,510 (92% of net return) in KIS and GHC 5,280 (88% of net return) in NDIS are expected under the project.

- 18 -
This reveals that beneficiary farmers can fully shoulder the annual irrigation service charges (OMM cost & others) and interest levied on farm credit services. 8.2 Socio-economic Impact In addition to the huge impact of the incremental production of paddies (i.e. 75,300 tons/year) or rice (i.e. 48,900 tons/year) and the impact of savings of foreign exchange of some US$ 25.6 million at the full-development stage and onward to the national economy, the creation of employment opportunities of about 393,000 man-days/year is anticipated under the project. 9. Conclusion and Recommendations 9.1 Conclusion The proposed gravitational irrigation system of the Accra Plains Gravity Irrigation Scheme taking water from the Kpong Dam has strong potential for development and will be technically and economically feasible for the pre-feasibility-level study. Construction costs as well as operation and maintenance costs will be almost half of the pump irrigation scheme. 9.2 Recommendations The development of Accra plains for irrigated agriculture will be the flagship project in the GOG as mentioned in important policies. We recommend that a full feasibility study be performed as soon as possible together with the implementation of the project. 10. Summary Table of the APGIP The following pages show the summary of the Accra Plains Gravity Irrigation Project. The unit of construction costs and other related costs and benefits shown in the table is U.S. dollars.


- 20 -
No.1 Area No.2 Area Total6 Irrigation Management System
Irrigation Management Body KIP Scheme Management Company (SMC)
Farmers Cooperative OsudokuCooperative
New Farmer's Cooperative
Secondary Groups under Farmer's Cooperative in Public Development BlockWUAs in Private Development Block
7 Construction Cost Exchange Rate 1.0 US$ = 1.49 GHC
I. Construction Cost1. Main irrigation canal construction 7,274.2 21,145.9 28,420.12. Secondary canal construction 0.0 13,270.3 13,270.33. Drainage works 655.8 242.8 898.64. Land development 0.0 12,901.5 12,901.55. Warehouse, building works 881.7 1,655.8 2,537.5
Total (1+2+3+4+5) 8,811.6 49,216.3 58,027.96. Temporary cost 176.2 984.3 1,160.57. Site expense 898.8 5,020.1 5,918.98. Overhead and profit 790.9 4,417.7 5,208.6Total I. 10,677.6 59,638.3 70,315.9
II. Procurement cost for O&M equipment 3,131.3 3,339.6 6,470.9Total (I+II) 13,808.9 62,977.9 76,786.8
III. Administration cost 244.8 629.8 874.6IV. Engineering services 611.9 3,148.9 3,760.9
Total (I+II+III+IV) 14,665.6 66,756.6 81,422.3V. Physical contingency 654.8 3,337.9 3,992.6
Total Project Cost 15,320.4 70 ,094 .5 85,414.9
Unit Construction Costs per hectareI. Construction Cost
1. Main irrigation canal construction 1,774.2 3,064.6 2,583.62. Secondary canal construction 0.0 1,932.2 1,206.43. Drainage works 159.9 35.2 81.74. Land development 0.0 1,869.8 1,172.95. Warehouse, building works 215.0 240.0 230.7
Total (1+2+3+4+5) 2,149.2 7,132.8 5,275.36. Temporary cost 43.0 142.7 105.57. Site expense 219.2 727.5 538.18. Overhead and profit 192.9 640.2 473.5Total I. 2,604.3 8,643.2 6,392.4
II. Procurement cost for O&M equipment 763.7 484.0 588.3Total (I+II) 3,368.0 9,127.2 6,980.6
III. Administration cost 59.7 91.3 79.5IV. Engineering services 149.3 456.4 341.9
Total (I+II+III+IV) 3,577.0 9,674.9 7,402.0V. Physical contingency 159.7 483.7 363.0
Total Project Cost 3,736.7 10 ,158 .6 7,765.0
8 Operation and Maintenance Costs per Year
Operation & Mnaintenance CostsIrrigation Area (ha) 4,100 6,900 11,000Main Canal 306.2 513.4 819.6Secondary Canal Included above 258.0 258.0Project Staff 167.8 167.8 335.6Total 474.0 939 .2 1,413.2
Operation and Maintenance Costs per hectare per Year
Operation & Mnaintenance CostsIrrigation Area (ha) 4100 6900 11000Main Canal 74.7 74.4 74.5Secondary Canal 0.0 37.4 23.5Project Staff 40.9 24.3 30.5Total 115.6 136 .1 128.5
No.
1000 US$
US$/ha
Summary Table of the APGIP
Items Sub-items KISNDIS
APGIP
(US$/ha)
(1000 US$)

- 21 -
No.1 Area No.2 Area Total9 Economic Evaluation
Without-project 14,044 1,545 5,688 7,233 21,277With-project 24,579 12,208 18,847 31,055 55,634
(Incremental Net Production Value) Increment 10,535 10,663 13,159 23,822 34,357
Economic EvaluationEIRR 20.8% - - 19.3% 19.8%B/C B/C = 1.8 B/C = 1.7 B/C = 1.7
Financial EvaluationFIRR 21.6% 14.7% 16.8%B/C B/C = 1.9 B/C = 1.3 B/C = 1.4
10 Comparison of Construction Costs between Pump Irrigation (APIP) and Gravity Irrigation (APGIP) Systems
Summary Table of the APGIP
No. Items Sub-items KISNDIS
APGIP
Annual Financial Incremental Benefit at FullDevelopment (GHC 000)
Construction Cost
Note: Items for Pump is derived from the F/S Report of APIP 5,000ha in 2010 Unit Construction Costs per hectare Items Pump APGIP KIS NDIS Total Area (ha) 5,000 11,000 4,100 6,900Total Direct Cost (US$/ha) 19,828 6,981 3,368 9,127Engineering (US$/ha) 397 342 149 456Administration (US$/ha) 99 80 60 91Construction Environmental (US$/ha) 314 - - -Physical Contingency (US$/ha) 496 363 160 484Grand Total (US$/ha) 21,161 7,765 3,737 10,159Ratio to the Pump Irrigation 1.000 0.367 0.177 0.480Ratio to APGIP 2.725 1.000 0.481 1.308
Items Pump APGIP KIS NDIS Total Area (ha) 5,000 11,000 4,100 6,900Total Direct Cost (1000 US$) 99,140 76,787 13,809 62,978Engineering (1000 US$) 1,983 3,761 612 3,149Administration (1000 US$) 496 875 245 630Construction Environmental (1000 US$) 1,707 - - -Physical Contingency (1000 US$) 2,479 3,338 655 3,993Grand Total (1000 US$) 105,804 85,415 15,320 70,095
Operation and Maintenance Cost Items Pump APGIP KIS NDIS
Total Area (ha) 5,000 11,000 4,100 6,900O & M Cost (1000 US$) 1,070 1,078** 306** 772**Energy Cost of Pumping (1000 US$) 925 - - -Labour Cost (1000 US$) 18* 336 168 168
Total O&M Cost (1000 US$)*** 2,013 1,414 474 940Depreciation cost of O&M machinery/equipment - 490 156 334
Total O&M Cost (1000 US$) 2,013 1,904 630 1,274* Labour cost for pumping plan is estimated 10 labours with 150$/month manpower costs. ** Maintenance cost of road maintenance by gravel pave is included.
Unit O & M Cost per hectare Items Pump APGIP KIS NDIS
Total Area (ha) 5,000 11,000 4,100 6,900O & M Cost (US$/ha) 214 98 75 74Energy Cost of Pumping (US$/ha) 185 - - -Labour Cost (US$/ha) 4 31 41 24
Total O & M Cost (US$/ha) 403 129 116 136Ratio to Pump Irrigation 1.00 0.32 0.29 0.34Ratio to APGIP 3.12 1.00 0.90 1.05
Depreciation cost of O&M machinery/equipment - 86 38 48Total O & M Cost (US$/ha) 403 215 154 184Ratio to Pump Irrigation 1.00 0.53 0.38 0.46Ratio to APGIP 1.87 1.00 0.72 0.86
Economic Evaluation (EIRR) Items Pump APGIP KIS NDIS
Normal EIRR (%) 21.1 19.8 20.8 19.3
10% cost increased (%) 18.2 18.6 20.1 17.9
10% benefit decreased (%) 18.1 18.1 18.9 17.7
Note: “Construction Environmental ($1000)” in the tables above means the costs of mitigation, such as educational campaigns regarding public health, distributing insecticide treated nets in the project-affected communities, undertaking screening and treatment of bilharzias, and distributing 2,000 boxes of free condoms. This is derived from the F/S Report of APIP 5,000 ha in 2010.

- 22 -
PREPARATORY STUDY ON ACCRA PLAIN IRRIGATION DEVELOPMENT PROJECT
PRE-FEASIBILITY STUDY FINAL REPORT
TABLE OF CONTENTS
Location Map of the Project Site .................................................................................................................. -1- Existing Condition of Accra Plains Gravity Irrigation Project Area ............................................................. -2- Project Map of Accra Plains Gravity Irrigation Project (APGIP) ................................................................. -3- Summary of Accra Plains Gravity Irrigation Project .................................................................................... -4- Table of Contents ........................................................................................................................................ -22- List of Tables .............................................................................................................................................. -27- List of Figures ............................................................................................................................................. -30- Glossary of Acronyms ................................................................................................................................ -31- Terminology ................................................................................................................................................ -33-
Chapter 1 Introduction 1.1 Background .............................................................................................................. 1 1.1.1 National Development Plan ..................................................................... 1 1.1.2 TICAD-IV ............................................................................................... 3 1.1.3 National Strategy and Plan Related to Irrigation ..................................... 4 1.1.4 Agriculture in Ghana ............................................................................... 4 1.2 Objectives of the Project .......................................................................................... 7 1.3 Scope of Works ........................................................................................................ 7 1.3.1 Irrigation Development ............................................................................ 8 1.3.2 Infrastructure Design and Planning ......................................................... 8 1.3.3 Farmer’s Organization and Enterprises / Management of Irrigation System 9 1.3.4 Environmental and Social Considerations ............................................... 10 1.3.5 Agricultural Economy & Agricultural Development Plan ...................... 11 1.3.6 Expected Output ...................................................................................... 11 1.4 Activities of the Study Team .................................................................................... 11 Chapter 2 Present Condition of the Project Area 2.1 Project Background .................................................................................................. 12 2.1.1 Former Study of the Project ..................................................................... 12 2.1.2 Study for the Formulation for Irrigation Project in Africa by JICA ........ 12 2.2 Hydro-Meteorological Conditions ........................................................................... 12 2.2.1 Climatic Conditions ................................................................................. 12 2.2.2 Meteorological Conditions ...................................................................... 13

- 23 -
2.2.3 Hydrological Conditions .......................................................................... 15 2.3 Water Resources ....................................................................................................... 16 2.3.1 Existing Reservoirs .................................................................................. 16 2.3.2 Rivers in the Project Area ........................................................................ 17 2.4 Socio-economy ........................................................................................................ 17 2.4.1 Population ................................................................................................ 17 2.4.2 Land Tenure ............................................................................................. 19 2.5 Soils ................................................................................................................. 20 2.5.1 Soil Distributions ..................................................................................... 20 2.5.2 Land Suitability ....................................................................................... 21 2.6 Infrastructure ............................................................................................................ 22 2.6.1 Road ......................................................................................................... 22 2.6.2 Water supply ............................................................................................ 22 2.6.3 Electricity ................................................................................................ 25 2.7 Agriculture ............................................................................................................... 25 2.7.1 General .................................................................................................... 25 2.7.2 Present Agricultural Land Use ................................................................. 25 2.7.3 Prevailing Cropping Calendar ................................................................. 28 2.7.4 Crop Production ....................................................................................... 28 2.7.5 Prevailing Farming Practices ................................................................... 30 2.7.6 Net Production Value (NPV) under Present Conditions .......................... 31 2.7.7 Farm Economy ........................................................................................ 32 2.7.8 Agricultural Support Services ................................................................. 32 2.7.9 Major Agricultural Facilities ................................................................... 37 2.7.10 Marketing ................................................................................................ 37 2.7.11 Agricultural Mechanization ..................................................................... 39 2.8 Existing Irrigation Systems ...................................................................................... 39 2.8.1 Irrigation Systems .................................................................................... 39 2.8.2 Farmers Organization and WUA ............................................................. 43 2.9 Social and Environmental Conditions ..................................................................... 46 2.9.1 Social Environment ................................................................................. 46 2.9.2 Natural Environment ............................................................................... 49 2.9.3 Pollution .................................................................................................. 50 Chapter 3 Project Planning 3.1 Constraints for Development ................................................................................... 52 3.2 Basic Development Policy ....................................................................................... 52 3.3 Agricultural Development Plan ............................................................................... 52 3.3.1 Land Use Plan .......................................................................................... 52 3.3.2 Subject Crop & Planned Cropping Pattern .............................................. 54 3.3.3 Proposed Farming Systems ..................................................................... 55

- 24 -
3.3.4 Crop Production Plan ............................................................................... 56 3.3.5 Net Production Value (NPV) in Case of Adopting the Project .............. 57 3.4 Irrigation and Drainage Plan .................................................................................... 58 3.4.1 Water Resources Development Plan ........................................................ 58 3.4.2 Potentiality of Norboyita Dam ................................................................ 60 3.4.3 Alternative Study of the Irrigation Schemes ............................................ 61 3.4.4 Improvement of Kpong Irrigation Scheme (KIS) .................................... 65 3.4.5 New Development Irrigation Scheme (NDIS) ........................................ 65 3.4.6 Water Requirement Analysis ................................................................... 65 3.4.7 Water Availability from Kpong Reservoir ............................................... 68 3.4.8 Reducing Hydro Power Generation ......................................................... 69 3.5 Environmental and Social Considerations ............................................................... 70 3.5.1 Environmental and Social Considerations in Ghana ............................... 70 3.5.2 JICA’s Guidelines for Environmental and Social Considerations (Apr. 2010) 74 3.5.3 World Bank (Safeguard Policy) ............................................................... 75 3.6 Organization and Management Plan ........................................................................ 76 3.6.1 Project Management Organization .......................................................... 76 3.6.2 Farmers and Users Participation .............................................................. 83 Chapter 4 Facilities Plan 4.1 Facilities Plan of NDIS ............................................................................................ 86 4.1.1 Intake Facility at Kpong Dam ................................................................. 86 4.1.2 Irrigation System ..................................................................................... 86 4.1.3 Drainage System ...................................................................................... 86 4.1.4 Irrigation Canal ........................................................................................ 87 4.1.5 Flow Control Facilities ............................................................................ 88 4.1.6 Drainage Canal ........................................................................................ 88 4.1.7 Road Networks ........................................................................................ 89 4.1.8 Rural Development Facilities .................................................................. 89 4.2 Facilities Plan of KIS ............................................................................................... 89 4.2.1 Intake Facility from Kpong Dam ............................................................. 89 4.2.2 Irrigation System ..................................................................................... 89 4.2.3 Drainage System ...................................................................................... 90 4.2.4 Irrigation Canal ........................................................................................ 90 4.2.5 Flow Control Device ............................................................................... 92 4.2.6 Drainage Canal ........................................................................................ 92 4.3 Land Development ................................................................................................... 93 4.4 Workshops for Agricultural Support and OMM ...................................................... 93 4.4.1 Plant and Equipment for Agricultural Support Services .......................... 93 4.4.2 Plant and Equipment for Maintenance Work ........................................... 97

- 25 -
Chapter 5 Initial Environmental Examination (IEE) 5.1 Comparative Examination of Alternatives ............................................................... 98 5.2 Possible Adverse Environmental and Social Impact ................................................ 99 5.3 Mitigation and Monitoring for Key Impact ............................................................. 102 5.4 Proposed additional Study for EIA during F/S ........................................................ 102 Chapter 6 Possible Options of Organization and Management 6.1 Introduction .............................................................................................................. 104 6.2 Land Ownership ....................................................................................................... 104 6.3 Irrigation Users ........................................................................................................ 105 6.4 Development of Land and Irrigation Infrastructure ................................................. 105 6.5 Irrigation System Management ................................................................................ 109 6.6 Agricultural Support Service ................................................................................... 111 Chapter 7 Cost Estimation 7.1 Project Facility Plan ................................................................................................. 114 7.1.1 General .................................................................................................... 114 7.1.2 Salient Features of the Project ................................................................. 114 7.2 Implementation Plan and Schedule .......................................................................... 115 7.3 Project Cost Estimate ............................................................................................... 116 7.3.1 Assumptions ............................................................................................ 116 7.3.2 Project Cost ............................................................................................. 116 7.3.3 Cost Estimates ......................................................................................... 117 7.4 Annual Operation and Maintenance Cost and Replacement Cost ........................... 120 7.4.1 Annual Operation and Maintenance Cost ................................................ 120 7.4.2 Replacement Cost .................................................................................... 120 7.5 Disbursement Schedule ............................................................................................ 120 7.6 Preliminary Estimation of Irrigation Service Charge ............................................... 123 Chapter 8 Project Evaluation 8.1 Objectives ................................................................................................................ 127 8.2 Proposed Project for Evaluation .............................................................................. 127 8.3 Economic Evaluation ............................................................................................... 127 8.3.1 Economic Evaluation Procedures ............................................................ 127 8.3.2 Economic Benefit .................................................................................... 128 8.3.3 Negative Benefit ...................................................................................... 130 8.3.4 Economic Cost ......................................................................................... 130 8.3.5 Economic Evaluation and Sensitivity Analysis ....................................... 131 8.3.6 Comparison with the Previous FS Study ................................................. 132 8.4 Financial Evaluation ................................................................................................ 132

- 26 -
8.5 Socio-economic Impact , Indirect Benefit and Intangible Benefit ........................... 133 8.5.1 Socio-economic Impact ........................................................................... 133 8.5.2 Indirect Benefits ...................................................................................... 134 8.5.3 Intangible Benefits ................................................................................... 134
Chapter 9 Conclusion and Recommendations
9.1 Conclusion ............................................................................................................... 135 9.2 Recommendations .................................................................................................... 135
ANNEXES
Annex A Hydro-Meteorological Information Annex B Irrigation and Drainage Development Annex C Infrastructure Planning/Design Annex D Agriculture Annex E Farmer's Organization, Enterprises / Management of Irrigation System Annex F Environment and Social Considerations Annex G Project Cost and Implementation Plan Annex H Project Evaluation Annex I Photographs of the APGIP Annex J List of Collected Data and Document

- 27 -
LIST OF TABLES
Table 1.1.1 Agricultural Land Use in Ghana (2010) .................................................. 5 Table 1.1.2 Cropped Area and Production of Major Food Crops in Ghana (2007–2009) ............................................................................................ 5 Table 1.1.3 Production of Major Industrial Crops in Ghana (2003–2009) ................. 5 Table 1.1.4 Livestock Population in Ghana (2009) .................................................... 6 Table 1.1.5 Food Balance Sheet of Rice and Maize (2009/10) .................................. 6 Table 1.1.6 Cereal Imports in Ghana from 2005–2009 .............................................. 6 Table 1.1.7 Per-capita Consumption of Rice in Ghana .............................................. 6 Table 2.2.1 Monthly Mean Temperature .................................................................... 13 Table 2.2.2 Monthly Average Rainfall ........................................................................ 13 Table 2.2.3 Average of the Annual Pan-Evaporation ................................................. 14 Table 2.2.4 Average of the Daily Sunshine Duration ................................................. 15 Table 2.2.5 Average of the Annual Mean Related Humidity ...................................... 15 Table 2.2.6 Average of the Annual Mean Wind Speed ............................................... 15 Table 2.4.1 Population of Each District ...................................................................... 17 Table 2.4.2 Population in NDIS Area by Community ................................................ 18 Table 2.4.3 Estimated Number of Small-scale Farmers in NDIS Area ...................... 18 Table 2.4.4 Ethnicity of Related Regions and Districts .............................................. 19 Table 2.4.5 Economic Activity Population and Related Features .............................. 19 Table 2.5.1 Major Soils in the Project Area ................................................................ 20 Table 2.5.2 Chemical Properties of Major Soils in the Project Area .......................... 21 Table 2.5.3 Land Suitability of Major Soils in the Project Area ................................ 21 Table 2.7.1 Production of Major Crops in Project Districts (average of 2006 to 2009) 25 Table 2.7.2 Present Land Use of KIS Area ................................................................. 26 Table 2.7.3 Present Land Use of NDIS Area .............................................................. 27 Table 2.7.4 Present Land Use of the Project Area ...................................................... 27 Table 2.7.5 Present Crop Production in KIS Area ...................................................... 29 Table 2.7.6 Present Crop Production in NDIS Area ................................................... 29 Table 2.7.7 Present Crop Production in the Project Area ........................................... 30 Table 2.7.8 Prevailing Rice Farming Practices in KIS Area ...................................... 30 Table 2.7.9 Prevailing Farming Practices in Upland Field in NDIS Area .................. 31 Table 2.7.10 Annual NPV by Land Use Category under Present Condition ................ 32 in the Project Area Table 2.7.11 Agricultural Research Institute in Ghana ................................................ 32 Table 2.7.12 Deployment of Extension Staff................................................................ 33 Table 2.7.13 Field Extension Services Coverage in & around the Project Area .......... 34 Table 2.7.14 Subsidized Prices of Fertilizers & Fertilizer Import ................................ 35 Table 2.7.15 Terms & Conditions of ADB Agricultural Credit .................................... 36

- 28 -
Table 2.7.16 Farmers Access to Farm Credit in & around the Project Area ................. 36 Table 2.7.17 Agricultural Facilities in & around the Project Area ............................... 37 Table 2.7.18 Monthly Average Wholesale Prices of Local and Imported Rice ............ 38 Table 2.9.1 Population of Each District ...................................................................... 47 Table 2.9.2 Location of Culturally Sensitive Areas Within Project Zone .................. 48 Table 3.3.1 KIS Land Use in Case of Project Implentation........................................ 53 Table 3.3.2 NDIS Land Use in Case of Project Implentation ..................................... 53 Table 3.3.3 Land Use of the Project Area in Case of Project Implentation ............... 54 Table 3.3.4 Proposed Farming System ....................................................................... 56 Table 3.3.5 Reference Yield Levels of Irrigated Rice ................................................ 56 Table 3.3.6 Target Yields in Case of Project Implentation ......................................... 56 Table 3.3.7 Crop Production Plan in the Project Area ................................................ 57 Table 3.3.8 Incremental Crop Production in Case of Project Implentation ................ 57 Table 3.3.9 Incremental Financial NPV between W/P & W/O .................................. 58 Table 3.4.1 Water Intake Capacity from Kpong Dam ................................................ 60 Table 3.4.2 Irrigation Acreage of APGIP (ha) ............................................................ 65 Table 3.4.3 Proposed Cropping Calendar for Paddies ................................................ 66 Table 3.4.4 Irrigation Efficiency table for Irrigation Schemes ................................... 66 Table 3.4.5 Irrigation Acreage in Irrigation Schemes ................................................. 67 Table 3.4.6 Peak and Average Discharge of Irrigation Schemes ................................ 67 Table 3.4.7 Reducing Hydropower generation caused by APGIP .............................. 69 Table 4.1.1 Intake Facility .......................................................................................... 86 Table 4.1.2 Salient Feature of the Project (NDIS) ...................................................... 87 Table 4.1.3 Drainage Improvement Works (NDIS) .................................................... 89 Table 4.2.1 Intake Facility .......................................................................................... 89 Table 4.2.2 Canal System of KIS ............................................................................... 90 Table 4.2.3 Canal Lining Works of KIS ..................................................................... 91 Table 4.2.4 Drainage Improvement Works ................................................................. 92 Table 4.4.1 Agricultural Support Service Necessary to be provided by the Project ... 95 Table 5.1.1 Summary of Alternatives ......................................................................... 98 Table 5.2.1 Extent of Possible Adverse Impacts at each phase of the Project ............ 101 Table 6.3.1 Irrigation Users: Farmer Types ................................................................ 105 Table 6.4.1 Options for Demarcation of Rehabilitation of KIS .................................. 106 Table 6.4.2 Options for Demarcation of Construction of NDIS ................................. 109 Table 6.5.1 Options for Demarcation of Operation and Maintenance ........................ 110 Table 7.1.1 Salient Feature of the Project (NDIS) ...................................................... 114 Table 7.1.2 Salient Feature of the Project (KIS)......................................................... 115 Table 7.3.1 Project Cost (NDIS) ................................................................................. 118 Table 7.3.2 Project Cost (KIS) ................................................................................... 119 Table 7.4.1 Annual Operation and Maintenance Cost ................................................ 120 Table 7.5.1 Cost Schedule (NDIS) ............................................................................. 121
- 29 -
Table 7.5.2 Cost Schedule (KIS) ................................................................................ 122 Table 7.6.1 Billing Structure of ISC by Farm Type .................................................... 123 Table 7.6.2(1) Preliminary Estimation of ISC Price of KIS ............................................ 124 Table 7.6.2(2) Preliminary Estimation of ISC Price of NDIS ......................................... 124 Table 7.6.3 Ratio of ISC to Production Cost in Financial Crop Budget per ha of Rice 124 in Case of Project Implentation Table 7.6.4 Ratio of ISC to Net Return in Financial Crop Budget per ha of Rice ... 124 in Case of Project Implentation Table 7.6.5 Ratio of On-farm OM Cost to Net Return in Financial Crop Budget ...... 125 per ha of Rice in Case of Project Implentation Table 7.6.6 ISC, On-farm OM and Land Development Cost and Ratio to Net Return 125 Table 8.2.1 List of Evaluated Irrigation Schemes & Projects .................................... 127 Table 8.3.1 Economic Irrigation and Drainage Benefits ............................................ 128 Table 8.3.2 Assumptions on Full Development Stage and Build-up Period Assumed 129 Table 8.3.3 Build-up of Irrigation & Drainage Benefits in Proportion ...................... 129 Table 8.3.4 Other Project Benefits ............................................................................. 129 Table 8.3.5 Annual Increases in Project Benefits ....................................................... 129 Table 8.3.6 Estimation of Project’s Annual Tangible Negative Benefits .................... 130 Table 8.3.7 Disbursement Schedule of Project’s Investment Cost ............................. 130 Table 8.3.8 Results of Economic Evaluation .............................................................. 131 Table 8.3.9 Results of Sensitivity Analysis of the Project .......................................... 131 Table 8.3.10 Comparison of Economic Evaluation Results ......................................... 132 Table 8.4.1 Assumptions for Financial Analysis on Small-scale Farms (Typical Farm) 132 Table 8.4.2 Results of Financial Analysis on Small-scale Farms ............................... 132 (Incremental Net Return) Table 8.4.3 Examination of Capacity-to-Pay in Case of Project Implentation ........... 133 Table 8.4.4 FIRR (Financial Internal Rate of Return) of the Project ......................... 133 Table 8.5.1 Increased Employment Opportunities in Case of Project Implentation .. 134

- 30 -
LIST OF FIGURES
Fig. 2.2.1 Location of Meteorological Observation Stations and Annual Rainfall .. 14 Fig. 2.5.1 Soil Map of the 200,000ha ...................................................................... 20 Fig. 2.6.1 Road and Water Supply Networks in the Project Area of APGIP ........... 24 Fig. 2.7.1 Present Prevailing Cropping Calendar in the Project Area ...................... 28 Fig. 2.7.2 Organization of Dangme West District Agriculture Office ...................... 34 Fig. 2.7.3 Grain & Legume Seed Production & Distribution System in Ghana ...... 35 Fig. 2.7.4 Prevailing Marketing Channel of Rice .................................................... 37 Fig. 2.8.1 Structure of Water Management by Farmer’s Participation .................... 45 Fig. 3.3.1 Planned Cropping Patterns ...................................................................... 55 Fig. 3.4.1 Location Map of Norboyita Potential Dam Site ...................................... 60 Fig. 3.4.2 Alternative Study of Combination of KIS and NDIS .............................. 62 Fig. 3.4.3 Irrigation System Networks of APGIP .................................................... 68 Fig. 3.5.1 Procedure of EIA ..................................................................................... 72 Fig. 3.6.1 Organization Diagram of Administration and Implementation ............... 77 Fig. 3.6.2 Sample of Organization Chart of Scheme Management Company ......... 82 Fig. 3.6.3 Organization Diagram of Water Management in Farmers/Farms Level .. 85 Fig. 4.3.1 Plan of Land Development ...................................................................... 93 Fig. 6.5.1 Conceptual Diagrams of Irrigation Management Organization ............... 110 Fig. 6.6.1 Conceptual Diagram of Public and Private Demarcation of .................... 113 Irrigation System Management

- 31 -
Glossary of Acronyms Acronyms Orthography
ADB Agriculture Development Bank
AEA Agricultural Extension Agent
AESD Agricultural Engineering Services Directorate
AfDB African Development Bank
AgSSIP Agriculture Sector Services Improvement Project
APGIP Accra Plains Gravity Irrigation Project (by JICA)
APIP Accra Plains Irrigation Project (by Study for Pump Irrigation)
CAADP The Comprehensive Africa Agriculture Development Programme
CARD Coalition for African Rice Development
CSIR Council for Scientific and Industrial Research
EA Environmental Assessment
EIA Environmental Impact Assessment
EIRR Economic Internal Rate of Return
EMP Environmental Management Plan
EPA Environmental Protection Agency
EP Environmental Permit
EPP Emergency Preparedness Plan
ESAs Environmentally Sensitive Areas
FAO Food and Agriculture Organization
FAPIM Farmers’ Participation in Irrigation Management
FASDEP II Food and Agriculture Sector Development Policy
FBOs Farmer-based Organizations
FIRR Financial Internal Rate of Return
GDP Gross Domestic Product
GHC Ghana Cedi (Currency Unit)
GIDA Ghana Irrigation Development Authority
GOG Government of Ghana
GPRS Ghana/Growth Poverty Reduction Strategy
GSGDA (Medium-term National Development Policy Framework: ) Ghana Shared Growth and Development Agenda, 2010–2013
GSS Ghana Statistical Services
GWCL Ghana Water Company Limited
IAIA International Association for Impact Assessment
ICOUR Irrigation Company of Upper Region
IDA Irrigation Development Authority (Same as GIDA)

- 32 -
Acronyms Orthography
IEE Initial Environmental Examination
IFAD International Fund for Agricultural Development
ISC Irrigation Service Charge
JICA Japan International Co-operation Agency
KIP Kpong Irrigation Project Office (Right Bank)
KIS Kpong Irrigation Scheme
KLIP Kpong Left Bank Irrigation Project
LI Legislative Instrument
MDAs Ministries, Departments and Agencies
METASIP Medium Term Agriculture Sector Investment Plan, 2011–2015
MiDA Millennium Development Authority
MFEP Ministry of Finance and Economic Planning
MoEST Ministry of Environment, Science and Technology
MoFA Ministry of Food and Agriculture
NDIS New Development Irrigation Scheme
NEPAD New Partnership for African Development
NHIL National Health Insurance Levy
NPV Net Production Value
NWP National Water Policy
ODA Official Development Assistance
OMM (OM) Operation, Maintenance and Management (Operation and Maintenance)
OM&R Operation Maintenance and Repair
PIC Project Implementation Committee
PPP Public Private Partnership
PMU Project Management Unit
SFIP Small Farms Irrigation Project
SMC Scheme Management Company
SRID Statistics, Research and Information Directorate, MoFA
SSIDP Small-scale Irrigation Development Project
TV Training & Visit
VAT Value Added Tax
VBA Volta Basin Authority
VRA Volta River Authority
WB World Bank
WRC Water Resources Commission

- 33 -
Terminology Name of Irrigation Schemes The project name is “Accra Plains Gravity Irrigation Project (APGIP).” The project consists of
two separate irrigation schemes for improvement of the existing Kpong Irrigation Scheme (KIS) and New Development Irrigation Scheme (NDIS). The name of the project has been selected to distinguish it from the former feasibility study on the pump irrigation scheme of the Accra Plains Irrigation Project (APIP) by Studi Consultants.
The NDIS consists of the No. 1 and No. 2 Areas. The No. 1 Area includes Cassi Farm, Tokpo,
and the Norboyita area, which is the 2nd priority area studied by APIP F/S and covers 200,000 ha. The No. 2 Area includes the 1st priority area studied by APIP F/S (5,000 ha covered by pump irrigation) and the Prairie Volta Ltd. rice farm area.
The report title utilized has been “Preparatory Study on Accra Plain Irrigation Development Project,” which is the name of the contract with JICA.
STUDI Report 200,000 ha: Detailed Feasibility Study of Accra Plains Irrigation Project 200,000 ha, Final Report, June 2010
STUDI Report 5,000 ha: Feasibility Study of the Accra Plains Irrigation Project
Detailed Feasibility Study for the 5000 ha Final Report, June 2010
1US$ = 1.49 GHC


Chapter 1
Introduction

- 1 -
Chapter 1 Introduction 1.1 Background 1.1.1 National Development Plan Agriculture and Irrigation development policies and strategies under the National Development Plan are as follows. (1) Medium-term National Development Policy Framework:
Ghana Shared Growth and Development Agenda (GSGDA), 2010–2013 A phased irrigation plan of the Accra plains is mentioned as the flagship irrigation project within the period, subject to the results of on-going technical studies being undertaken by a team of experts. Also, as CAADP of NEPAD recommends, the allocation of at least 10% of government expenditure and the provision of selective subsidies for the agricultural sector for the procurement of inputs were also mentioned. (2) CAADP Compact The CAADP Compact was signed on October 28, 2009. The government of Ghana aims to implement a mid-term investment plan in the agricultural sector based on the FASDEPII with the Economic Community of West African States (ECOWAS) within the framework of CAADP. In 2007, the Ministry of Food and Agriculture formulated FASDEP II, with the following targets:
1) Capacity building of MFA staff and strengthening of the MFA organization, 2) Promotion of agricultural credit, 3) Development, spread, and utilization of suitable agricultural techniques, 4) Improvement of social infrastructures, 5) Promotion of selected crops, and 6) Improvement of access to markets
(3) Medium-term Agriculture Sector Investment Plan (METASIP) 2011–2015 Output 1.6.1: The irrigation schemes' productivity has increased by 25%, and intensification by 50% will be achieved by 2015 In order to increase the efficiency of irrigation schemes, the following set of activities have been planned for implementation:
1) To rehabilitate 50 breached dams in the Greater Accra and Volta Region. 2) To enhance the skills of GIDA staff for consultative participatory project identification,
planning, implementation, monitoring and evaluation. 3) To train extension workers on irrigation and water management techniques and skills so as
to enable them to undertake irrigation extension, and also train them on participatory methods in dealing with farmers as well as market extension.
4) To build the capacity of water user associations in agricultural water management and their obligations as major beneficiaries (group formation and benefits, irrigation methods and maintenance, multiple use of water-culture-based fisheries, business management skills,
- 1 -

- 2 -
etc). 5) To undertake comprehensive management needs assessment for existing large irrigation
schemes. 6) To establish participatory management systems in large-scale irrigation schemes.
Output 1.6.4: Feasibility studies for large-scale irrigation projects in the country will be updated by 2012 and funds for implementation sourced by 2012. The following activities are planned to accelerate the pace of scheme development:
1) To update the feasibility study of 500,000 ha of large-scale irrigation projects and undertake detailed studies and design for 200,000 ha.
2) To conduct studies into mapping irrigation potential and prepare bankable projects for the country.
3) To prepare investment plans for irrigation of the Accra Plains Irrigation Project. 4) To source funds for implementation of the projects by 2012. 5) To start construction of projects by 2013.
It is, however, necessary to also plan in the long-term to develop large-scale irrigation systems in large irrigable areas such as the Afram Plains, several valleys in the northern and southern savannas, and accelerate the ongoing development efforts in the Accra Plains. The estimated incremental cost of implementation for all six programmes of the agricultural sector investment plan for both MoFA and other agriculture related MDAs for the five years is GHC 1,532.4 million. (4) The Coordinated Programme of Economic and Social Development Policies, 2010–2016 The agriculture sector is expected to be a major driver of growth in the economy in the medium term. Growth and development of the sector is expected to lead to structural transformation of the economy through the modernization evident in food security, employment and reduced poverty. This will be achieved through the implementation of the Food and Agriculture Sector Development Policy (FASDEP II) and the corresponding Medium Term Agriculture Sector Investment Plan (METASIP). Major planned agriculture initiatives for the medium term include: • Promotion of irrigation-based agriculture with the rehabilitation of existing schemes, other water management technologies, and phased development of the Accra Plains, which is the “Flagship” project. (5) President John Evans Atta Mills’ delivered the State of the Nation Address on 17th February 2011 President John Evans Atta Mills on February 17 delivered his third State of the Nation Address to
- 2 -

- 3 -
Parliament, which dealt with his government’s achievements. The president’s address was in accordance with Articles 2 and 36 (5) of the 1992 Constitution, which mandate the President to deliver a State of the Nation Address. President Mills’ address was titled, “Raising Ghana to the Next level,” and he gave the nation a thumbs-up, saying “The state of the nation is good.” The president focused on the economy, agriculture, employment, youth development, education, health, housing, security, governance, corruption, and other national and international matters. President Mills said his government would continue to invest in human resources, key infrastructure, and development of the oil and gas sector, as well as in the modernisation of agriculture and related processing activities. Modernization of agriculture, enhanced food security and creating job opportunities along the entire agricultural value chain are priorities of this Administration. There have been notable increases of maize, rice, sorghum, plantain and yam production. The goal of this Administration—to make locally produced food more abundant and affordable—is on course. The implementation plan for the National Irrigation Policy will be completed and launched during 2011. The first phase of the Accra Plains Irrigation Project, covering an area of about 5000 hectares will be implemented to promote double, and where possible, triple cropping of vegetables and cereals. The Youth in Agriculture Programme has chalked up some degree of success, and its scope will be expanded this year. 1.1.2 TICAD-IV “The Yokohama Declaration” has been adopted to provide a road map for support of African growth and development under the TICAD IV (4th Tokyo International Conference on African Development) on May, 2008. In the sector of agriculture and rural development, the development, rehabilitation and maintenance of water resources management infrastructure has been promoted, aiming at expanding the irrigated area within five years. The Government of Japan has proposed construction and rehabilitation work covering 100,000 ha for the irrigation systems, including small-scale irrigation schemes in the Yokohama Action plan. Based on this understanding, the Japan International Cooperation Agency (JICA), in partnership with the Alliance for a Green Revolution in Africa (AGRA), launched an initiative now known as the “Coalition for African Rice Development” (CARD). CARD promotes the three major agro-ecology approaches for rice cultivation in Africa: “irrigated fields,” “rain-fed lowlands,” and “rain-fed uplands.” CARD prioritizes the rehabilitation of existing irrigation facilities for rain-fed lowlands. African countries have been improving the productivity of the agriculture under the CAADP. Improvement of access to irrigated agriculture is recognized in “sustainable land management and water control”, which is one of four specific thrusts in the CAADP. Under this circumstance, the Government of Japan took the initiative to launch rehabilitation of the irrigation facilities in the SAA in cooperation with other donor countries. However due to insufficient information, the irrigation development policy and strategy of each country, and the on-going and planning schedule of related irrigation projects by international donors hinders the proper project formulation of the irrigation development.
- 3 -

- 4 -
1.1.3 National Strategy and Plan Related to Irrigation To achieve the Irrigation Policy Goals—“To achieve sustainable growth and enhanced performance of irrigation contributing fully to the goals of the Ghanaian agriculture sector” as outlined in the Growth and Poverty Reduction Strategy, the Irrigation Policy proposes the following objectives .
1) Performance and growth. 2) Socio-economic inclusion. 3) Responsible production. 4) Enhanced services
To realize the objective of “Performance and Growth,” the policy set specific sub-objectives corresponding to the policy implementation strategy.
- To raise productivity of agricultural water for irrigation, livestock watering and aquaculture. - To enhance the production potential of ongoing irrigation activities - To develop new irrigation areas according to demand and feasibility - To establish appropriate funding mechanisms for public irrigation - To increase private sector investment in irrigation
In order to implement these sub-objectives, the responsibility is given to GIDA as a central agency. At present, a sufficient budget for managing the “Public (Formal) Irrigation Project” has not been allocated. In item (b) of the sub-objectives, the increase of direct budgetary allocation to GIDA is stipulated as a strategic action. In addition, chapter 6 of the policy mentions organizational reform of GIDA. In this regard, it is highly expected that GIDA will be strengthened financially and organizationally. 1.1.4 Agriculture in Ghana (1) Agriculture Sector The agriculture sector is the main economic sector in Ghana, accounting for 34.5% of GDP (2009) and 45% of total export earnings of traditional commodities in 2007 (Economic Survey, GSS, 2005–2007). Such figures are the 2nd highest among all the economic sectors, following the mining sector. The sector is also the main sector of employment, providing jobs for 53% of the economically active population in the country (2005/06). Further, most of the crops produced in the country are consumed domestically; hence, the sector plays a decisive role in national food security. Taking account of the sector in the national economy in the future, the government of Ghana established the policy of giving the highest priority to developing the sector. (2) Land Use The country has a land surface area of 238,500 km2. Out of the total area, 13.6 million ha (57%) are used for agricultural purposes and 6.9 million ha (54% of the agricultural land area) are under cultivation. Within the areas under cultivation, the real extent of irrigated fields is extremely limited,
- 4 -

- 5 -
currently at about 29,804 ha or 0.41% of the area under cultivation.
Table 1.1.1 Agricultural Land Use in Ghana (2010) Land Use Category Area (km2) %
1. Agricultural land area 136,282 57.1 100 Area under-cultivation 73,115 54 - Area under-irrigation (ha) (29,804 ha) (0.41) Area not under-cultivation 63,167 46 2. Non-agricultural land area 91,256 38.3 - 3. Water surface 11,000 4.6 -
Total land area 238,538 100 - Source: Agriculture in Ghana, Facts & Figures (2009), MoFA
(3) Food Crop Production The food crop production in the country from 2007 to 2009 indicates substantial growth, as shown in the following table.
Table 1.1.2 Cropped Area and Production of Major Food Crops in Ghana (2007–2009) Cropped Area (1000 ha) Production (1000 MT) Yield in 2009
(t/ha) Crops 2007 2008 2009 2007 2008 2009 Maize 790 846 954 1,220 1,470 1,620 1.7Sorghum 208 276 267 155 331 350 1.3Rice/paddies 109 133 162 185 302 391 2.4Cassava 801 840 886 10,218 11,351 12,231 13.8Yams 324 348 379 4,376 4,895 5,778 15.2Others 726 746 737 5,148 5,401 5,549 7.5
Total 2,958 3,189 3,385 21,302 23,750 25,919 7.7 Source: Agriculture in Ghana, Facts & Figures (2009), MoFA
The growth rates of maize, paddy and cassava production from May 2003 to September 2007 are respectively estimated at 5.6%, 6.8% and 4.5% by MoFA. (4) Industrial Crop Production The production of industrial crops in the country from 2000 to 2009 indicates substantial growth, as shown in the following table.
Table 1.1.3 Production of Major Industrial Crops in Ghana (2003–2009) Unit: × 1000 tons
Crops 2003 2004 2005 2006 2007 2008 2009 AverageCocoa 496.8 737.0 599.3 740.5 614.5 680.8 710.6 654.2Coffee 0.34 0.48 0.27 0.16 0.30 2.02 0.52 0.58Rubber 10.9 12.3 13.6 13.6 15.3 14.1 19.1 14.1Shea nuts n.a. n.a. n.a. n.a. 28.0 30.0 31.4 29.8Oil Palm 1 1,640.1 1,686.8 1,712.6 1,737,9 1,684.5 1,896.8 2,103.6 1,780.3
1: Production of fresh fruit bunches Source: Agriculture in Ghana, Facts & Figures (2009), MoFA Cocoa products form the 2nd most important traditional export commodity, following gold, in the country.
- 5 -

- 6 -
(5) Livestock The major livestock are cattle, sheep, goats, and poultry (MoFA), and their populations as of 2009 are shown in the following table.
Table 1.1.4 Livestock Population in Ghana (2009) Unit: × 1000
Item Cattle Sheep Goats Pig Poultry Population in 2009 485 390 442 521 43,320 Index (1997=100) 114 146 174 150 273 Source: Agriculture in Ghana, Facts & Figures (2009), MoFA
(6) Food Balance and Import of Food Crops The food balance of major commodities (rice & maize) in 2009/10 is estimated by MoFA as shown in the following table.
Table 1.1.5 Food Balance of Rice and Maize (2009/10) Unit: MT
Commodity Domestic Supply 1 Import Total Supply Consumption Net Surplus Rice 204,000 384,000 588,000 576,480 11,380 Maize 1,134,000 34,000 1,168,000 1,052,000 116,000
1: Domestic supply involves- seed requirements, livestock feed & waste Source: Agriculture in Ghana (2009), MoFA
In the case of maize, self sufficiency was attained in the reported period of 2009/10; however, some 380,000 tons of rice were imported to satisfy domestic consumption in the period. Cereal imports of about 780 thousand tons on average are recorded in the country, as shown below.
Table 1.1.6 Cereal Imports in Ghana from 2005–2009 Unit: 1000 MT
Commodity 2005 2006 2007 2008 2009 Average Rice 485 390 442 395 384 419 Wheat 370 254 332 337 330 325 Maize 55 7 1 64 34 32
Total 910 651 775 796 714 776 Source: Agriculture in Ghana (2009), MoFA
Some 650,000 to 910,000 tons of cereals, mostly rice and wheat, were imported from 2005 to 2009. The average rice import volume in the period was 419,000 tons. The consumption of rice in the country is on an increasing trend and the estimated per-capita consumption as of 2005 is 15.1 kg/person (in the food balance presented earlier, per-capita consumption is estimated to be 24.1 kg/person).
Table 1.1.7 Per-capita Consumption of Rice in Ghana Unit: kg/capita
Item 1990 1995 2000 2005 Per Capita Consumption 13.3 13.9 14.5 15.1 Source: Agriculture in Ghana (2009), MoFA
- 6 -
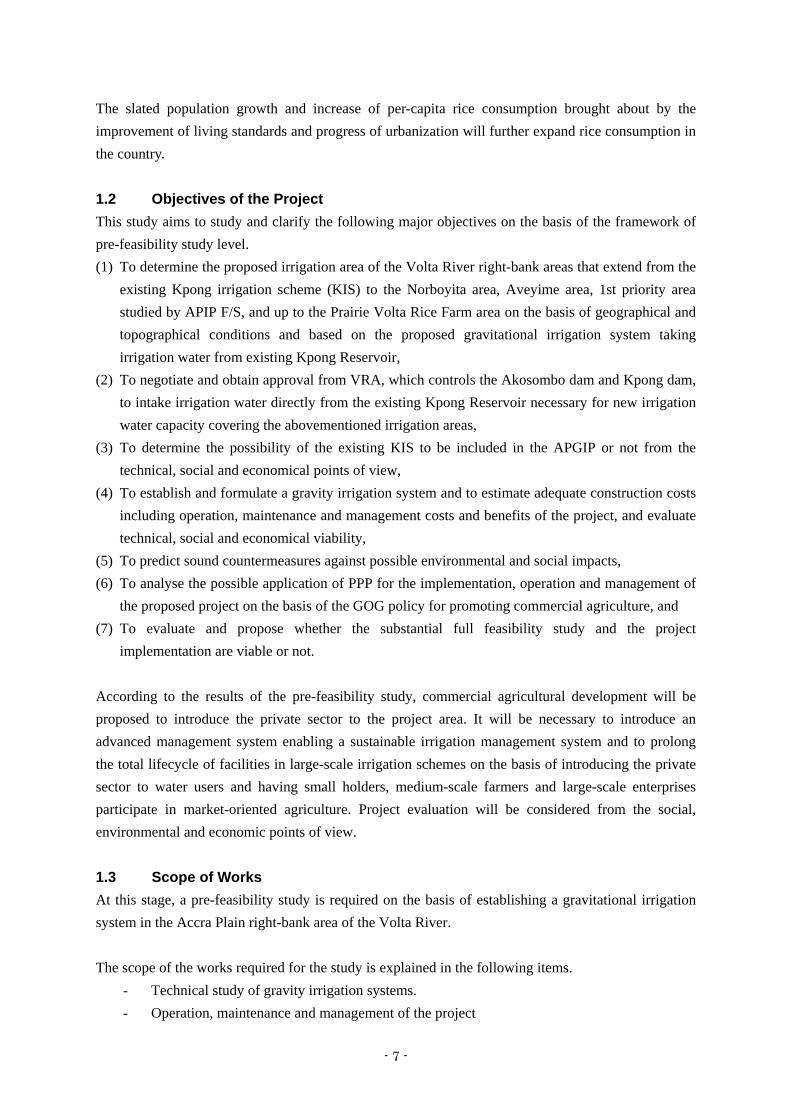
- 7 -
The slated population growth and increase of per-capita rice consumption brought about by the improvement of living standards and progress of urbanization will further expand rice consumption in the country. 1.2 Objectives of the Project This study aims to study and clarify the following major objectives on the basis of the framework of pre-feasibility study level. (1) To determine the proposed irrigation area of the Volta River right-bank areas that extend from the
existing Kpong irrigation scheme (KIS) to the Norboyita area, Aveyime area, 1st priority area studied by APIP F/S, and up to the Prairie Volta Rice Farm area on the basis of geographical and topographical conditions and based on the proposed gravitational irrigation system taking irrigation water from existing Kpong Reservoir,
(2) To negotiate and obtain approval from VRA, which controls the Akosombo dam and Kpong dam, to intake irrigation water directly from the existing Kpong Reservoir necessary for new irrigation water capacity covering the abovementioned irrigation areas,
(3) To determine the possibility of the existing KIS to be included in the APGIP or not from the technical, social and economical points of view,
(4) To establish and formulate a gravity irrigation system and to estimate adequate construction costs including operation, maintenance and management costs and benefits of the project, and evaluate technical, social and economical viability,
(5) To predict sound countermeasures against possible environmental and social impacts, (6) To analyse the possible application of PPP for the implementation, operation and management of
the proposed project on the basis of the GOG policy for promoting commercial agriculture, and (7) To evaluate and propose whether the substantial full feasibility study and the project
implementation are viable or not. According to the results of the pre-feasibility study, commercial agricultural development will be proposed to introduce the private sector to the project area. It will be necessary to introduce an advanced management system enabling a sustainable irrigation management system and to prolong the total lifecycle of facilities in large-scale irrigation schemes on the basis of introducing the private sector to water users and having small holders, medium-scale farmers and large-scale enterprises participate in market-oriented agriculture. Project evaluation will be considered from the social, environmental and economic points of view. 1.3 Scope of Works At this stage, a pre-feasibility study is required on the basis of establishing a gravitational irrigation system in the Accra Plain right-bank area of the Volta River. The scope of the works required for the study is explained in the following items.
- Technical study of gravity irrigation systems. - Operation, maintenance and management of the project
- 7 -

- 8 -
- Project cost estimation - Benefit estimation - Economic analysis - Financial analysis - Environmental and social consideration
1.3.1 Irrigation Development (1) Survey on the Accra plains service area and proposing a route for the irrigation main canal Geographical conditions of potential irrigation areas in the Accra plain are investigated from the viewpoints of land and water availability, and the potential of the proposed irrigable area. The existing F/S in the pump irrigation plan of the Accra plains is compared with the proposed gravitational irrigation system. Information on the current situation of large-scale commercial farms located in the study area is collected and studied for irrigation system design, including an alternative study. (2) Survey on water use and management Information on the current situation of water use and management of the existing irrigation schemes are collected, analysed and reflected in the irrigation system design, e.g., planning of diversion work, secondary and tertiary canal, and on-farm facilities.
(3) Preparation of the study and reporting to GIDA, JICA and WB Office In accordance with the progress of the study of each expert, the results of the study and output will be compiled in the “Field Completion Report.” The report will be submitted and explained to GIDA, the JICA Ghana Office and WB Ghana Office.
1.3.2 Infrastructure Design and Planning (1) Survey on Accra plains service area The entire irrigation system in the Accra plains area is studied from the viewpoints of land and water availability, and the potential of the proposed irrigable area.
(2) Detailed survey on existing irrigation system Information on the current situation of large-scale commercial farms located in the study area will be collected and studied for the purpose of irrigation system design, including alternative study.
(3) Survey on water use and management Information on the current situation of water use and management in the study area is collected and analysed to reflect irrigation system design, e.g., planning of diversion work, secondary and tertiary canals, and on-farm facilities. (4) Preliminary design of the irrigation system Alternative cases are studied, aiming at a comparison of irrigation systems from technical and
- 8 -

- 9 -
economic viewpoints. The study focuses on the following points:
a) Hydraulic and structural design Hydraulic calculation is conducted to examine the hydraulic profile of the irrigation canal. Canal appurtenant structures, such as aqueduct, conduit, division structure, and spillway, are also included in the design. GIDA shall assist the team in making a plan of canal alignment, irrigation block plan (diversion points), and land acquisition plan.
b) Quantitative calculation Quantitative calculation is conducted to estimate the project cost of each alternative plan and final proposed plan. An earthmoving plan, machinery schedule, and concrete procurement plan are studied to correctly estimate the project cost. In addition, an appropriate dewatering plan for the Kpong dam intake site is proposed considering the hydraulic generation schedule of the Kpong dam and water use for the existing irrigation systems of the Kpong Right Bank Irrigation Project.
c) Cost estimate i) Cost estimate by alternative study
Project cost shall be roughly estimated by the alternative study of proposed irrigation systems. Since the operation and maintenance costs of the Accra Plains First Priority Area has been estimated, the project cost shall include practicable operation and maintenance costs to enable comparison of the cost-benefit ratio under identical conditions.
ii) Cost estimate for proposed plan Project cost for the appropriate plan is estimated based on current labour and material costs. Cost estimate guideline of Ghana and GIDA shall be explained to the Study team.
d) Necessary data for irrigation system design GIDA is requested to collect necessary data for the irrigation system design. - Topographic map (1:50,000, 1:25,000) - Contour map with its interval of 1.0m by digital data - Information of existing irrigation project - Design criteria, design report and drawings introduced in other irrigation projects in Ghana - Cost estimate of a similar irrigation project
e) Topographic survey Information on the topography along the canal profile is necessary, especially for the design of the drainage crossing section of the canal.
1.3.3 Farmer's Organization and Enterprises / Management of Irrigation System
- 9 -

- 10 -
(1) Survey on management of irrigation system in other areas Information on the structure and current situation of management of irrigation systems in other areas is collected and analyzed in order to confirm the applicable management structure of the irrigation system. Information on the current situation of large-scale commercial farms located in the study area is collected and analyzed as a basis of confirming the needs and possible management structure of the irrigation system. (2) Survey on water use and management of small-scale farmers Information on the current situation of water use and management of small-scale farmers located in the study area is collected and analyzed as a basis of confirming the needs and possible management structure of the irrigation system. (3) Study on services provided by irrigation systems Services to be provided by the irrigation system are examined from the needs of water users and are prioritized in the study. The cost for the proposed service is also estimated. Services are studied from the aspect of the needs of both larger-scale commercial farms and small farms. (4) Study on water fee The expected water fee tariff is examined through confirming the current situation of farm management and the financial condition of the farmers’ group, individual farmers and enterprises which carry on agricultural business in the study area. (5) Study on necessary support by the Government Necessary support for the management of the irrigation system by the Government of Ghana is studied from technical and financial aspects. The cost of the proposed support is estimated as well. (6) Study on the concept and structure of operation and management of the system Based on the results of the survey and studies mentioned above, the concept and structure of operation and management of the system, including the roles and responsibilities of stakeholders such as the government, enterprises and farmers’ organization, are studied. The possible options of the management structure are shown as a conclusion. 1.3.4 Environmental and Social Considerations
1) Confirmation of environmental and social conditions of the target areas 2) Confirmation of legal framework of Environmental and Social Considerations (ESCs) in
Ghana 3) Collection of existing reports and data on ESCs study in the target areas 4) Conduct site survey on ESCs 5) Analysis of ESCs study, and advice on relevance, such as the necessity of the irrigation
development project in terms of ESCs
- 10 -

- 11 -
1.3.5 Agricultural Economy & Agricultural Development Plan (1) Present Condition of the Project Area Agricultural land use, agro-demography, land tenure & holdings, soils, crop production, crop budget (production costs), farm economy, marketing & post-harvest facilities, agricultural support services, and constraints and agricultural development concepts are studied and analysed. (2) Agricultural Development Plan for the Project The land-use plan, proposed cropping pattern, anticipated crop yields, crop-production plan, proposed farming practices, crop budget for the case of adopting the project, farm economy, and agricultural support services are studied and analysed. (3) Project Evaluation Evaluation procedures, project economic benefits, project economic costs, economic evaluation & sensitivity analysis, financial evaluation, indirect and intangible benefits. 1.3.6 Expected Output This study aims to show the possible alternative plan of the irrigation system in the right bank of the Volta River. The following issues are expected to be clarified through a field survey and discussion with related organizations.
- Alternative plans for the irrigation system and estimate of the project area for gravity irrigation
- Project cost of each plan - Operation and maintenance plan for the system on the basis of introducing the private sector. - Project justification and evaluation - Preparation and submission of Field Completion Report - Preparation and submission of Final Preparatory Report
1.4 Activities of the Study Team The study team consists of five members, each responsible for irrigation development, infrastructure planning and design, organization and irrigation system management, agronomy agro-economy, or environment and social consideration. The study period for the Pre-Feasibility Study for the Accra Plains Gravitational Irrigation Scheme is from January 2011 to May 2011.
- 11 -

Chapter 2
Present Condition of the Project Area
- 13 -
Chapter 2 Present Condition of the Project Area 2.1 Project Background 2.1.1 Former Study of the Project The Accra Plains extend about 156,000 ha (approximately 200,000 ha) along the right bank of the lower Volta River. The feasibility study for the whole area of the Accra plains for irrigation development has been conducted from 2008 to 2010 with assistance from the Kuwait Fund (a grant of US $1.4 million). In June 2010, the feasibility study on development of pumping irrigation in the first prioritized area (relatively flat with 5,000 ha) was carried. According to the F/S, the 1st priority area (5,000 ha) was originally planned to be irrigated by the pumped water from the Volta River. The total cost is estimated at US $106 million; the construction cost per unit area is US $21,160/ha and the OM cost is estimated at US $400/ha then the total cost with OM is around US $21,560/ha. The EIRR is estimated at 21.1%. The proposed major crops are paddy rice, cowpeas, maize, onions, peppers, tomatoes, soybeans, and fodder. The study didn’t introduce a gravitational irrigation system. The development plan introduced in the study F/S is quite risky, because of the high cost and the difficulties in development, operation and maintenance of the pumping-up operation. The WB also made a comment on the same matters. 2.1.2 Study for the Formulation of an Irrigation Project in Africa by JICA In accordance with the TICAD-IV statement, JICA sent study teams to four selected countries, namely Ghana, Mali, Uganda and Zambia, from June to September 2010, and carried out “Study for the Formulation for Irrigation Projects in Africa” to find potential irrigation projects. During the course of the study in Ghana, the study team proposed a potential gravity irrigation project within the Accra Plains Irrigation Development Project, taking irrigation water from the existing Kpong Dam. The most critical point of the project is the availability of additional irrigation water from the existing Kpong Dam. The preliminary discussion was made with VRA and GIDA in October 2010, and VRA basically approved the taking of an additional 10.0 m3/sec of irrigation water. Consequently, it is possible to adopt a gravitational irrigation system for the right-bank area of the Volta River. 2.2 Hydro-Meteorological Conditions 2.2.1 Climatic Conditions The country's warm, humid climate has an annual mean temperature between 26°C and 29°C. Variations in the principal elements like temperature, rainfall, and humidity that govern the climate are influenced by the movement and interaction of the dry tropical continental air mass, or the harmattan, which blows from the northeast across the Sahara, and the opposing tropical maritime or moist equatorial system.
The extent of drought and rainfall varies across the country. To the south of the Kwahu Plateau, the heaviest rains occur in the Axim area, in the southwest corner of Ghana. Farther to the north, Kumasi
- 12 -

- 14 -
receives average annual rainfall of about 1,400 mm, while Tamale in the drier northern savannah receives rainfall of 1,000 mm per year. From Takoradi eastward to the Accra Plains, including the lower Volta region, rainfall averages only 750 mm to 1,400 mm a year. Temperatures are usually high at all times of the year throughout the country, but at higher elevations temperatures are more comfortable. In the far north, temperature highs of 31°C are common. The southern part of the country is characterized by generally humid conditions. This is particularly so during the night, when 95 to 100 percent humidity is possible. Humid conditions also prevail in the northern section of the country during the rainy season. During the harmattan season, however, humidity drops as low as 25 percent in the north. (Referred to: http://countrystudies.us/ghana/31.htm) 2.2.2 Meteorological Conditions (1) Temperature Meteorological stations are located in Akuse and Aveyime in the project area at an elevation of 5 m to 10 m above sea level. The mean monthly maximum temperature in March is 30.2°C in Akuse and 30.6°C in Aveyime, and the monthly minimum temperature in August is 26.7°C in both stations.
Table 2.2.1 Monthly Mean Temperature (Unit: °C)
Location Jan Feb Mar Apr May Jun Jul Aug Sep Oct Nov Dec
Akuse 28.4 30.1 30.2 29.8 28.9 27.8 26.9 26.7 27.5 28.0 28.5 28.3
Aveyime 29.3 30.6 30.6 30.0 29.1 27.6 26.8 26.7 27.5 28.2 29.0 29.1Source: Ghana Meteorological Service Department
(2) Rainfall The annual rainfall in the Accra Plains ranges from 850 mm to 1,400 mm as observed at the Akuse and Aveyime stations. The average annual rainfall is 1,046.8 mm in Akuse (1990–2010). The average annual rainfall of 913.2 mm observed in Aveyime is slightly lower compared to that in Akuse.
Table 2.2.2 Monthly Average Rainfall (Unit: mm)
Location Jan Feb Mar Apr May Jun Jul Aug Sep Oct Nov Dec Total
Akuse 16.6 27.7 86.2 118.4 164.1 166.8 96.5 41.2 100.6 126.9 72.6 27.4 1,046.8
Aveyime 15.4 21.7 70.7 130.7 142.0 137.7 64.3 31.1 74.6 109.8 65.0 21.9 913.2Source: Ghana Meteorological Service Department
Less annual rainfall is expected in the eastern part of the Accra Plains, as shown on Fig. 2.2.1. This tendency may be caused by the coastal climate along the Gulf of Guinea.
- 13 -

- 15 -
Fig. 2.2.1 Location of Meteorological Observation Stations and Annual Rainfall (3) Other meteorological conditions 1) Evaporation The average annual pan-evaporation ranges from 1,430mm to 1,600mm, and the average is 1,526 mm in Akuse. Monthly pan-evaporation is high from January to March, and low from June to August.
Table 2.2.3 Average Annual Pan-Evaporation (Unit: mm)
Location Jan Feb Mar Apr May Jun Jul Aug Sep Oct Nov Dec Total
Akuse 163.0 178.4 161.5 141.1 121.8 95.3 87.8 92.7 105.2 115.8 126.8 133.9 1,526.0
Aveyime 159.5 168.8 153.9 138.9 118.4 83.8 88.1 91.6 100.3 113.4 128.7 140.3 1,478.6Source: Ghana Meteorological Service Department
Tema
Dodowa
Weija Accra
Koforidua
Aveyime
Ashaiman
Kpong
Akuse
0 30km
Volta River
To Akosombo Dam
Kpong Dam
Koforidua : 1,330.4mm
Akuse : 1,046.8mm
Aveyime : 913.2mm
- 14 -

- 16 -
2) Sunshine duration
Table 2.2.4 Average Daily Sunshine Duration (Unit: hr)
Location Jan Feb Mar Apr May Jun Jul Aug Sep Oct Nov Dec Annual
Akuse 5.3 6.5 5.9 6.6 6.6 5.1 4.2 3.7 5.0 6.9 7.4 6.7 5.3
Aveyime 5.6 7.3 6.2 7.3 6.8 5.4 4.7 4.4 5.4 7.3 7.8 7.3 5.6Source: Ghana Meteorological Service Department
3) Relative humidity
Table 2.2.5 Average Annual Mean Related Humidity (Unit: %)
Location Jan Feb Mar Apr May Jun Jul Aug Sep Oct Nov Dec Akuse 68.5 68.6 72.0 75.9 80.0 83.2 82.2 80.4 81.0 81.9 80.4 75.4Aveyime 71.5 72.1 74.8 77.7 80.5 84.0 82.9 82.8 81.6 82.2 79.8 75.8Source: Ghana Meteorological Service Department Note: Average relative humidity observed at 6:00 and 15:00
4) Wind speed Wind speed was not observed at the Aveyime station.
Table 2.2.6 Average Annual Mean Wind Speed (Unit: m/sec)
Location Jan Feb Mar Apr May Jun Jul Aug Sep Oct Nov Dec Akuse 1.1 1.5 1.6 1.6 1.2 1.2 1.5 1.6 1.3 1.0 0.8 0.9 Aveyime n.a. n.a. n.a. n.a. n.a. n.a. n.a. n.a. n.a. n.a. n.a. n.a.Source: Ghana Meteorological Service Department
2.2.3 Hydrological Conditions The command area is located along the Volta River with its stretch of about 86 km from immediately downstream of the Kpong dam to the river mouth. The Akosombo dam is located 25 km upstream of the the Kpong dam site. The river discharge is dominant, with enough released water for hydro power generation. The released water volume of both the Akosombo and Kpong dams is almost the same, enabling efficient generation of electric power. Water-level data observed at the Kpong dam and Volta River immediately downstream of the dam indicates that:
(Kpong Dam reservoir) 1) Inflow of the Kpong dam is about 1,200 m3/sec. 2) The water level of the Kpong dam is almost constant, but slightly fluctuates depending on the
balance of inflow and outflow. The highest and lowest water level is 16.97 m (2010) and 13.92 m (1998), respectively.
3) A period of lower water level of the Kpong dam reservoir was recorded in 1998 and 2007.
- 15 -

- 17 -
(Volta River) 4) The water level of the Volta River constantly fluctuated from 2.5 m to 4.0 m in the
observation period of 1984 to 2010. 5) A higher water level was observed, at. 6.28m, in November 4, 2010, and for the next 21 days
the water level continued to be 4.0 m or higher. The rising of the water level was mainly caused by flood inflow to the Akosombo dam as well as the Kpong dam.
2.3 Water Resources 2.3.1 Existing Reservoirs The major water resources in the area are the Volta River and several small rivers. The Volta River has two major water reservoirs, namely the Akosombo dam reservoir and Kpong dam reservoir. The main function of the two dams is to generate hydro electric power. The Akosombo dam is 111 m tall, with a dam crest length of 660m, a reservoir storage volume of 148 km3, and surface area of 8,502 km2. It generates hydro electric power by utilizing 1,200 m3/sec of water discharge to generate 1,020 MW of power and then releases water into the Volta River, which subsequently reaches the Kpong dam. Hydropower generation at the Kpong dam utilizes the same amount of water as the Akosombo dam to generate 160 MW of power. The storage capacity of the Kpong reservoir is 160 million m3. The 1,200 m3/sec of water discharged during hydropower generation corresponds to 103.7 million m3/day, which is about 65% of the Kpong reservoir storage capacity. The storage capacity of the Kpong reservoir can be filled up within about one and half days with the maximum water discharge from the Akosombo dam. The water level in the Kpong dam fluctuates depending upon the balance of water inflow from Akosombo dam and water release from Kpong dam for hydroelectric power generation. The water level of the Kpong dam for the normal operation head pond is 14.75 m, whereas that of the high head pond is 17.7m, and the dam crest elevation is 18.75m and the normal tail water elevation downstream is 3.0 m. There are two existing intake structures for irrigation purposes—one at the right bank of the Kpong dam for the existing Kpong irrigation scheme and one at the left bank for Kpong left-bank irrigation scheme. Construction for the Kpong left-bank irrigation scheme began in March 2011, covering 2,000 ha under MiDA. Both intake capacities are designed to be 7.2 m3/sec. As for the water resources for irrigating the Accra plains, it is easy to intake water from the Volta River directory down stream of the Kpong dam. However, the water level in the Volta River is about 3.0 m, which is too low to irrigate the Accra plains, with their elevation of. 5.0 to 20.0 m, without a pump. There is, though, an advantage in using a pump for irrigation. The site of the pump station can be selected as near as possible to the irrigation area so that the leading canal length will be minimised. In order to utilise a pump for irrigation, pump equipment with a delivery pipe and energy for operating the pump are required. As a result, the operation and maintenance costs, and perhaps even the construction cost is higher in comparison with a gravity irrigation system. The former study for the Accra Plains Irrigation Project utilized a pump for irrigation for the 1st priority area of 5,000 ha. As for a gravity irrigation system, higher elevation than the beneficial area of water level is required in the water source point to deliver irrigation water to the lower elevation beneficial area. For the
- 16 -

- 18 -
water resources for a gravity irrigation system, the Kpong dam reservoir water will be used for the source of irrigation water supply, like the existing KIS. But the water level of the reservoir is limited to within 14 to 15. The elevation of the beneficial area should be lower than the elevation. There will also be a critical limitation in using the Kpong reservoir water for irrigation, because the reservoir water is mainly utilized for hydroelectric power generation; when irrigation water is taken from the reservoir directly, the power generation capacity will be reduced. In August 2010, the JICA Study Team for “Formulation of an Irrigation Project in Africa” proposed to negotiate with VRA on taking irrigation water from the Kpong reservoir. A meeting was held at Akuse VRA Office on October 1, 2010, between VRA and GIDA to discuss the possibility of direct water intake of about 10 m3/sec for irrigation from the Kpong reservoir. As a result, VRA in principle approved the taking of water at a rate of about 10 m3/sec for irrigation with some conditions on the method of intake, canals crossing the dam body, etc. During the course of the Pre-F/S, further study was made for negotiation with VRA in detail, and the contents of the further studies are shown in paragraph 3.4. 2.3.2 Rivers in the Project Area In the project area, several river courses flow into the Volta River, the catchment areas of which are about 100 to 110 km2 at most. One of the largest catchment areas is the Norboyita River, midstream of which lies a potential dam site, near Forkope Village. The catchment area is estimated to be 95 km2 at the proposed dam site. However, according to the newly obtained digital terrain model topographic map surveyed in 2010, the contour line of 15 m elevation is very much different (about 7.5 m lower) than that shown on the 1/50,000 topographic map surveyed in 1973. As a result, the proposed dam body length was estimated to be about 700 meters in the 1/50,000 topographic map but it will expanded by more than 2 km according to the newly obtained DTM map. The potential of the proposed dam construction is discussed in paragraph 3.4. Most of the other rivers in the project area are too small to utilise to supplement irrigation water, and almost no water is available during the dry season.
2.4 Socio-economy 2.4.1 Population (1) Population The project area extends across mainly 3 districts, i.e., Dangme West and Dangme East of the Greater Accra Region, and North Tongu of the Volta Region. The NDIS area is mainly constituted by Dangme West and North Tongu District, but a limited part is located in the Dangme East District. The KIS area is mainly located in the Dangme West District, and Yilo Krobo of the Eastern Region also constitutes a very limited part. The population of these three major districts is projected as shown below:
Table 2.4.1 Population of the each District
District
2030* 2010* 2000 1984 Growth Rate (%)
1984-2000
Dangme West 215,737 126,450 96,809 63,141 2.6
Dangme East 187,322 117,544 93,112 64,135 2.3
- 17 -

- 19 -
North Tongu 532,696 208,442 130,388 61,552 4.6
*Projected populations are based on the 2000 Population and Housing Census
Most of the settlements in the project area are rural in terms of population and function. The only exceptions to this general classification are Battor (3,070) and Mepe (4,108), which are urban in terms of population and function. Aveyime (2,028) is urban in terms of population but elements of a rural agrarian economy are manifest within the spatial configuration, housing characteristics and economic life of the town. The populations of communities in the NDIS area are shown below:
Table 2.4.2 Population in NDIS Area by Community
Projection was made by base year of 2010. Source: Agricultural Extension Services, MoFA.
The number of small-scale farmers in the NDIS area could not be accurately estimated without a detailed survey, so the number was estimated by distributing the data in the STUDI Report 20,000 ha area-proportionally. According to the estimate, 2,720 small-scale farmers live in the NDIS, and approximately 2,500 live in the KIS area.
Table 2.4.3 Estimated Number of Small-scale Farmers in NDIS Area DU*
Area of DU (ha)
Number of small-scale farmers
in DU
Within project Area(ha)
Estimated number of small-scale farmers
in project area
3-1 4,418 1,767 1,700 680 4-1 1,671 668 1,000 400 5-1 5,286 2,114 3,000 1,200 6-1 9,845 3,938 1,100 440
Total 6,800 2,720 *: Development unit applied in STUDI Report 20,000 ha. The number does not include the KIP area. Source: Number of small-scale farmers in the project area is estimated by the study team based on data in STUDI
North Tongu District Dangme West District Dangme East District
Community Projected Population in
2011
Community Projected Population in
2011
Community Projected Population in
2011 Aveyime 2,028 Topko 115
Mepe 4,108 Volivo 425
Degorme 1,286 Atabui 42
Mafi Devime 1,608 Duffor 45
Atitekpo 2,039 Kotokor 36
Aklamador 998 Adakope 82
Dekpoe 509 Agbaveanu 122
Akraya 577 Tsunkpo 86 N.A. N.A. Kpogadzi 766 Agbekotsekpo 149
Mafi Dove 1,903 Kasunya 102
Kelekor 175 Nyapianya 112
Aflokope 474 Klebusey 116
Nutekpo 416
Manya 922
Lasivenu 629
Ranch 135
Tehe 469
Battor 3,070
Total 22,112 Total 1,432 Total N.A.
- 18 -

- 20 -
Report 20,000 ha.
(2) Ethnicity The local populace in the project area is made up from several ethnic groups: Ga-Dangmes, Ewes, Akans, Guan, and Mole Dagbani. The Ga-Dangme group is the majority in the Dangme West and Dangme East District, and the Ewe group accounts for more than 90% in the North Tongu District.
Table 2.4.4 Ethnicity in Related Region and Districts Region and Districts Rank-1 Rank-2 Rank-3 Rank-4
Greater Accra Region Akan (39.8%) Ga- Dangme
(29.7%) Ewe (18.0%) Mole Dagbani
(5.1%)
Dangme West District Ga- Dangme
(77.8%) Ewe (12.3%) Akan (4.9%) Mole Dagbani
(1.6%)
Dangme East District Ga- Dangme
(85.9%) Ewe (5.6%) Akan (5.1%) Mole Dagbani
(1.2%)
Volta Region Ewe (68.5%) Guan (9.2%) Akan (8.5%) Gurma (6.5%) North Tongu District Ewe (90.5%) Akan (5.3%) Guan (1.5%) Ga-
Dangme (1.5%)
Source: Population and Housing Census 2000, Ghana Statistic Service
(3) Economic character of the district The economically active population, the ratios of the employed and unemployed members of such population, and the share of occupations in the agriculture and related sector in 2000 are shown below. The unemployed ratio is 7.0–8.9 % in the three districts. The agriculture and related sector accounts for approximately 50% of occupations in Dangme West and Dangme East District. The share in the North Tongu District is 70%.
Table 2.4.5 Economically Active Population and Related Features Region and District Economically active
population in 2000 (15 years and older)
Employed (%)
Unemployed (%)
Share of Occupations in agriculture, animal husbandry,
fishing & forestry (%) Greater Accra Region 1,377,903 86.6 13.4 9.1 Dangme West 41,887 91.1 8.9 50.2 Dangme East 40,462 93.0 7.0 52.3 Volta Region 697,752 92.5 7.5 59.7 North Tongu 54,922 92.7 7.3 70.0
Source: Population and Housing Census 2000, Ghana Statistic Service 2.4.2 Land Tenure Land in the NDIS area can be categorized under two traditional types of ownership: stool land and family lands. The principal actors involved in the land acquisition process as mandated by tradition in the NDIS area are: the chief head, who is the principal signatory and is supported by the stool father, the secretary for stool land, the family head, who is supported by the secretary, and a family member for family lands1. In the KIS area, the government has land ownership for the project area which had been acquired at
1 The STUDI Report 5,000ha, June 2010
- 19 -

- 21 -
the time of development. Farmers who are members of the Osudoku Cooperative rent land according to the Land Allocation Agreement made with KIP. Farmers have the duty to pay annual land rent to KIP, which is included in the irrigation service charge. 2.5 Soils 2.5.1 Soil Distribution The soil study covering the project area was made in detail under the Detailed Feasibility Study of Accra Plains Irrigation Project for 200,000 ha carried out by Studi International. Based on the study, the soil map of the 200,000 ha, at a scale of 1:25,000, and the soil map of the 1st Priority area, at a scale of 1:5,000, were prepared by classifying soils at the soil-series level. According to the soil study and maps, major soils distributed in the project area, a low lying area of 200,000 ha extending along the right bank of the Volta River, are as shown in the following table and figure.
Table 2.5.1 Major Soils in the Project Area Soil Series Soil Type (FAO, 1990) Soil Formation
Amo Series Gleyic Cambisols Soils developed over recent mixed alluvium Tefle Series Eutric Vertisols Soils developed over recent mixed alluvium Akuse Series Calcic Vertisols Soils developed from basic gneiss
Fig. 2.5.1 Soil Map of the 200,000 ha (Source: Detailed Feasibility Study of Accra Plains Irrigation Project 200,000 ha)
(a) Amo Series (Gleyic Cambisols) The soils are distributed extensively along the Volta River and occupy the flood plains of the river. The soils cover almost the entire Project area, as shown in the soil map. The soils are derived from alluvial materials transported from the higher catchment areas of the river basin and local tributaries from the black clay belt. The soils are deep, grey mottled brown or red clays, occurring on lower levees. The soil profile is made of dark greyish brown silt loam underlain with layers of greyish-brown and yellowish-brown mottled silty clay and reddish-brown mottled silty clay at the bottom of the solum.
- 20 -

- 21 -

- 23 -
2.6 Infrastructure 2.6.1 Roads (1) Dangme West District The district has a road network about 252 km long, 40 % of which is surfaced, while the rest consists of feeder roads. Tracks and footpaths also link the villages. The total road network when compared to other districts appears to have a good spatial distribution. Apart from the central portion of the district, which is devoid of roads, the district is linked together fairly well. The national trunk roads are in an appreciably good condition. Most of the feeder roads that give access to the more rural centres are unsurfaced and need regular resurfacing, especially after the wet season. (2) Dangme East District The total length of the road network is about 172 km. The network is made up of primary roads (28 km), secondary roads (20.2 km), and feeder roads (123.3 km), which are fairly distributed through the district, with almost every settlement connected to a road. However, most of the road network, especially the feeder roads, is in a bad condition, with some roads becoming undriveable during the wet season. The roads linking the Songor lagoon area and Koluedor to the northern part of the district are in a bad condition. (3) North Tongu The road network in the district is in a poor condition, although there are ongoing efforts by the central government to make the roads more driveable. A number of feeder roads and bridges are currently undergoing construction or rehabilitation. When completed they will make the district generally more accessible. In particular, they will significantly reduce the motoring distance from Adidome to the industrial town of Juapong, and will also make towns such as Volo and Dorfor Adidome more accessible. 2.6.2 Water supply The Danish International Development Agency (DANIDA) in cooperation with the Community Water and Sanitation Agency (CWSA) is supporting the provision of water and sanitation facilities and service to rural communities in the Greater Accra Region. The water supply scheme for the related Districts of Dangme East, Dangme West and North Tongu is located in some rural and small towns in the eastern part of the Greater Accra Region and Volta Region. The water system takes its source from the Volta River. The water system was designed as a conventional treatment plant system. The old method of sedimentation, slow sand filtration and disinfection is used in the purification of the water. The service population is estimated to grow at a rate of 2.8% in the design period of 10 years. The water tap is located at a minimum walking distance to a standpipe of 500 m. The transmission and distribution systems consist of a network of pipelines of varying sizes between 50 mm to 250 mm in diameter. To promote sustainability and complete the concept of community ownership and management, the
- 22 -

- 24 -
Three District Water Supply Project is under the management of a Water and Sanitation Development Board through a Private Operator. The Water Board is responsible for the operation and maintenance of the water scheme, whereas the various water and sanitation committees take responsibility for each community linked to the scheme. Water supply systems have been well developed in the project not only in the towns of Akuse, and Aveyime, but also in their surrounding small communities, together with the electric supply. Road and water supply networks are illustrated in Fig. 2.6.1.
- 23 -

- 25 -
Proje
ct Ar
ea
Fig.
2.6
.1
Roa
d an
d W
ater
Sup
ply
Net
wor
ks in
the
Proj
ect A
rea
of A
PGIP
- 24 -

- 26 -
2.6.3 Electricity (1) Dangme West District About 30% of the 231 settlements in the district are linked to the national electricity grid. However, plans are underway for some other communities to be connected within the next 3 years under the Self Help Electrification Project. Most of the major towns in the district are supplied with electricity from the national grid. These include Dodowa, Prampram, Asutsuare, Dawhenya, Afienya, Dorymu, Old Ningo, Kordiabe, New Ningo and Agomede.
(2) Dangme East District The District has been linked up to the national electricity grid. At present the major communities have been connected to electricity under the Self-Help Electrification Programme (SHEP) and the 1, 2, 3, Programme. About 28 communities have been earmarked for connection under the SHEP 4 programme. (3) North Tongu Adidome; Akyemfo, Battor, Mepe, Mafi Kumase Asiekpe and Juapong are currently supplied with hydroelectric power. The extension of electric power to towns and villages outside the District capital is dependent on community self-help, but through the rural electrification programme the lines are being extended and very soon most of the major settlements will have electricity.
2.7 Agriculture 2.7.1 General Agriculture, crop production and livestock, are the primary economic activities in the project-related districts, and in the North Tongu District, agricultural-sector employment accounted for 71.4% of total employment opportunities in 2000 (2000 Population & Housing Census, GSS, 2005). Crop production in the districts from 2006 to 2008 was as follows.
Table 2.7.1 Production of Major Crops in Project Districts (average of 2006 to 2009) Crop
District Item Maize Rice Cassava Pepper Okro Dange West Cropped Area (ha) 731 1,801 1,429 2,274 1,860 Production (ton) 683 2,269 15,669 4,391 7,330 North Tongu Cropped Area (ha) 1,341 1,400 2,606 - - Production (ton) 1,619 3,005 23,260 - - South Tongu Cropped Area (ha) 1,384 103 2,293 - - Production (ton) 1,513 158 21,873 - -
Average Yield (t/ha) 1.1 1.6 9.6 1.9 3.9 Source: SRID, MoFA
The livestock sub-sector is another important economic activity in the districts 2.7.2 Present Agricultural Land Use The present land use in the project area was studied at the reconnaissance level based on colour
- 25 -

- 27 -
photographs at a scale of 1/50,000 taken from the air in December, 2010, a ground truth survey, and information provided by KIP and private agri-business firms operating in the project area. The present agricultural land use in KIS and NDIS is estimated as follows: (1) KIS
Table 2.7.2 Present Land Use of KIS Area Block/Land Use Category Area (ha) % % Current Use/Remarks
KIS 1. Irrigated rice field 1,852 76 43 Currently irrigated rice fields 2. Grass land 448 19 10 Once-developed uncultivated
rice field 3. Others 120 5 3 Right-of-way, etc.
Sub-total 2,420 100 56 Golden Exotics Farm 1. Banana farm 1,200 63 28 Developed area 2. Upland field 600 32 14 Target area for expansion 3. Others 90 5 2 Right-of-way, etc.
Sub-total 1,890 100 44 KIS Area (gross) 4,310 - 100
As shown, KIS covers a total area of 4,310 ha, or about 37% of the whole project area. The irrigated farmland (irrigated rice field & banana farm) accounts for 3,052 ha or 71% of the KIS area. Upland fields occupy 600 ha or 14% of the area, whereas grassland and other land accounts for respectively 448 ha or 10% and 120 ha or 3%. The area of existing irrigated rice fields extends for 1,852 ha, accounting for 43% of the KIS Area, and the banana farm occupies 1,200 ha or 28%. The farm started planting in 2005 and the production of bananas in 2006. The current upland field of 600 ha of the Golden Exotics Farm is scheduled to be developed immediately after the irrigation water supply under the project.
- 26 -

- 28 -
(2) NDIS
Table 2.7.3 Present Land Use of NDIS Area Block/Land Use Category Area (ha) (%) (%) Current Use/Remarks
No. 1 Area + No. 2 Area 1. Upland fields 3,309 55 46 Used for seasonal crop production 2. Grassland 2,562 43 35 Used for grazing 3. Others 113 2 2 Right-of-way, etc.
Sub-total 5,984 100 83 Prairie Volta Farm 1. Irrigated rice fields 490 44 7 2. Upland fields 532 48 7 Used for seasonal crop production 3. Grassland 51 5 1 Used for grazing 4. Others 33 3 - Right-of-way, etc.
Sub-total 1,106 100 15 Cassi Farm 1. Irrigated upland fields 162 95 2 Centre pivot irrigation 4. Others 8 5 - Right-of-way, etc.
Sub-total 170 100 2 NDIS (gross) 7,260 - 100
The gross area of NIDS is 7,260 ha, or about 63% of the whole project area. Irrigated farmland, and irrigated rice fields and upland fields, account only for 490 ha or 7% and 162 ha or 2% of the NIDS Area, respectively. Upland fields occupy 3,841 ha or 53% of the area, grassland occupies 2,613 ha or 36%, and others 154 ha or 2%. The Prairie Volta Farm occupies 1,106 ha or 15% of the area. Upland fields and grassland in the farm is scheduled to be developed as irrigated rice fields from 2011 to 2012. Centre pivot irrigation is introduced in Cassi Farm. (3) Project Area (Accra Plains Gravity Irrigation/APGIP) The overall features of the present land use of the project area, comprising KIS and NDIS, are summarized as follows:
Table 2.7.4 Present Land Use of the Project Area Land Use Category Area (ha) (%) Current Use/Remarks
1. Irrigated rice fields 2,342 20.2 KIS & Prairies Volta Farm 2. Banana farm 1,200 10.4 Golden Exotics Farm 3. Irrigated upland fields 162 1.4 Cassi Farm 4. Upland fields 4,441 38.4 Used for seasonal crop production 2. Grassland 3,061 26.5 Used for grazing 3. Others 364 3.1 Right-of-way, etc.
Project Area (gross) 11,570 100
The gross area of APGIP is 11,570 ha and the existing irrigated rice fields account for 2,342 ha or 20% of the project area. The banana farm of Golden Exotics Ltd. covers 1,200 ha and accounts for 10% of the area. The largest land use category in the area is upland fields, occupying 4,441 ha or 38%, and the 2nd largest land use category is grassland, representing 3,061 ha or 26.5%. Almost all the land under the two land use categories (upland fields and grassland) will be converted into irrigated rice
- 27 -

- 29 -
fields under the project. 2.7.3 Prevailing Cropping Calendar The prevailing cropping calendar in the project area is estimated based on the current cropping pattern in KIS, STUDI Report 200,000 ha, and the field survey conducted by the Study Team as follows.
Fig. 2.7.1 Present Prevailing Cropping Calendar in the Project Area 2.7.4 Crop Production The present crop productions in the Project Area are estimated by irrigation scheme as follows. (1) Kpong Irrigation Scheme (KIS) Area Major crops in the area are irrigated rice in KIS and bananas in Golden Exotic Farm. Double cropping of rice is practiced by small-scale farmers in KIS and the annual cropping intensity is estimated to be 147%. In the Golden Exotics Farm, 1,200 ha of banana estate is established and the annual production is estimated to be nearly 48,000 tons. The majority of products are exported to Europe (France, England, Germany, etc.). Major crops in upland fields are cassava, followed by maize, peppers, cowpeas, and groundnuts. Maize cultivation is reported to be carried out both in major and minor seasons. Productivity of upland crops is low due to traditional subsistence farming and the instability of rainfall distribution. The present crop production in the area is estimated as follows:
Area
Rainfall Sunshine Hrs.
5
Mean Temp.
Climatic data at Akuse; Source: Detailed Feasibility Study of Accra Plains Irrigation Project 200,000ha, Final Report, June 2010 Source: Studi 200,000ha report
KIS
No. 1 & No. 2Area
7.5 6.8
45.7
Rice (105 days) Rice (120 days)
6.5 6.8 6.7 6.7
117.9
188.1
79.2
125.8
142.6
6.8
4.5 4.55.1
6.8
158.9
Oct Nov Dec
15.9
45.8
99.8 95.4
7.0 hrs
Jan. Feb. Mar. Apr May Jun Jul Aug Sep
140mm
160mm
180mm
21C
22C
23C
24C
4.0hrs
5.0hrs
6.0hrs
20mm
40mm
60mm
80mm
100mm
120mm
Jan. Feb. Mar. Apr May Jun Aug Sep Oct Nov DecJul
Cassava
Maize Maize
Pepper
Others (Groundnut/Cowpea etc.)
N
Monthly rainfall
Average daily sunshine
Monthly mean
transplanting direct sowing
- 28 -

- 30 -
Table 2.7.5 Present Crop Production in KIS Area Area Cropped Yield Cropping Production
Remarks Block/Land Use Category/Crop (ha) Area (ha) 1 (t/ha) Intensity (%) (ton)
KIS Yields estimated based on a sample survey by the JICA Study Team
1. Irrigated rice fields 1,852 - Irrigated rice/major season 1,274 4.7 69 5,988 - Irrigated rice/minor season 1.440 4.0 78 5,760
Annual 2,714 4.3 147 11,748 Golden Exotic Farm 1. Banana farm 1,200 - Bananas 2 1,200 48 100 48,000 Estimated yield 2. Upland field 3 600 780 - 130 1,566 Cassava, maize, etc.
1: Average of 2006 to 2010; source KIP 2:Estimated 3: Assuming cropping intensity of cassava (50%), maize (30%), and peppers (20%) in the major and maize (30%) in the minor season
(2) NDIS No irrigation fields except the irrigated rice field of Prairie Volta Farm and centre pivot irrigation field of Cassi Farm exist in the NDIS area. Major crops in upland fields are similar to those in the KIS area and productivities are low. The Prairie Farm was established in 2008 and started rice production from 2010. Rice production in the farm is carried out under a fully mechanized farming system with heavy duty farm machinery, and use of aircraft for cultivation was attempted in 2011. The farm possesses a large-scale rice mill with a paddy processing capacity of 10t/hour. Cassi Farm was started in 2010, and maize and soybeans were cultivated to date. Pepper is another candidate crop of the farm. The crop production features in the area are estimated as follows:
Table 2.7.6 Present Crop Production in NDIS Area Area Cropped Yield Cropping Production
Remarks Block/Land Use Category/Crop (ha) Area (ha) (t/ha) Intensity (%) (ton)
No. 1 + No. 2 Area 1. Upland field 1 3,841 - Cassava/major season 1,922 3.5 50 6,727 - Maize/major season 1,152 1.2 30 1,382 - Pepper/major season 2 768 0.7 20 538 Pepper/others - Maize/minor season 1,152 1.2 30 1,382
Annual 4,994 - 130 10,029 Prairie Volta Farm 1. Irrigated rice fields 490 - Irrigated rice/major season 490 4.0 100 1,960 Roughly
estimated figure - Irrigated rice/minor season 490 4.0 100 1,960 Annual 980 4.0 200 3,920
Cassi Farm 162 - - - - Maize/soybesns 1: Assuming cropping intensity of cassava (50%), maize (30%), and peppers (20%) in the major and maize (30%) in the minor season 2: Represented by pepper
(3) Project Area (Accra Plains Gravity Irrigation Project/APGIP) The crop production features in the project area, combining the features of the KIS area and NDIS area, are summarized in the following table.
- 29 -

- 31 -
Table 2.7.7 Present Crop Production in the Project Area
Area Cropped Yield Cropping Production Remarks
Block/Land Use Category/Crop (ha) Area (ha) (t/ha) Intensity (%) (ton) 1. Irrigated rice fields/rice 1,852 2,714 4.3 147 11,748 2. Irrigated rice fields/Prairie 490 980 4.0 200 3,920 Estimated figure Sub-total 2,342 3 Banana farm 1,200 1,200 40 100 48,000 Estimated figure Irrigated upland fields 162 - - - - Upland field 4,441 5,774 - 130 11,595
As shown, the primary crops in the project area are irrigated rice and bananas. Compared with the cropped area of some 5,800 ha, crop productivity in upland fields is very limited under the traditional and unstable rain-fed cultivation system. 2.7.5 Prevailing Farming Practices (1) Kpong Irrigation Scheme (KIS) Area In the KIS area, irrigated rice cultivation is exclusively practiced under a double cropping system in a major (March to September) and minor season (August to January). In the major season, the transplanting method is the prevailing practice, while in the minor season direct sowing is prevalent primarily because of the limited duration between the two cropping seasons and the shortage of farm machinery for land preparation. Major varieties of rice are Marshall, aromatic rice, and Jasmine. The annual cropping intensity in the area is estimated at 147%, as stated earlier, which is rather low, possibly due to an insufficient water supply, poor drainage, and a limited farm labour force. Further, as the results of the sample survey conducted by the JICA Study Team show, heavy application of fertilizer (over 600kg/ha on average) in the area are reported by sample farmers. In the area, land preparation work is almost exclusively carried out by power tillers. Based on the results of the sample survey conducted by the Study Team and the information provided by KIP (especially crop budget data), current prevailing rice farming practices in the KIS area are summarized as follows:
Table 2.7.8 Prevailing Rice Farming Practices in KIS Area
Land Preparation tilling & crossing by power tiller tilling & crossing by power tillerSeeding Rate 1/ range: 50 - 146 kg/ha; average: 68 kg/ha range: 63 - 200 kg/ha; average: 111 kg/haPlanting Method transplanting (random planting prevail) broadcasting in flooded field (pre-germinated seed)Fertilization 1/ basal, 1st top dressing & 2nd top dressing basal, 1st top dressing & 2nd top dressing
average: NPK 341, Urea: 147, SA: 176 kg/ha average: NPK 302, Urea: 203, SA: 178 kg/haAgro-chemical Use herbicide & insecticide applied herbicide & insecticide appliedHarvesting manual manualThreshing use threshing box & manual use threshing box & manualDrying sun drying sun drying
Source: Sample survey conducted by the JICA Study Team & KIP
Farming Practices Major Season Minor Season
- 30 -

- 32 -
(2) New Developed Irrigation Scheme (NDIS) Area In upland fields in the project area, various crops are cultivated mainly in the major season and partly in the minor season under a traditional, unstable and low-productive rain-fed farming system. Major crops include cassava, maize, cowpeas, groundnuts, and pepper. Land preparation by 4-wheeled tractors under machinery hiring services is common in the area. Based on Studi Report 200,000ha, prevailing farming practices in upland fields in NDIS are roughly categorized as follows:
Table 2.7.9 Prevailing Farming Practices in Upland Field in NDIS Area (3) Agri-business Farms The Golden Exotics Banana Farm started planting in 2005 and the harvesting of bananas started in 2006. The production system of the farm appears to be highly advanced; drip irrigation systems are installed and liquid fertilizer is applied through the system. The development of the Prairie Volta Farm started in 2008 and current yield levels are estimated at about 4 t/ha. Heavy farm machinery is introduced in the farm. In the development of large-scale rice fields, no topsoil preservation has been introduced and lower yield levels than expected are attributed to the removal of topsoil. The Cassi Farm was developed in 2010 and the production of maize, soybeans, and peppers is envisioned under the center pivot irrigation system. 2.7.6 Net Production Value (NPV) under Present Conditions The crop budgets per ha of farmland in the KIS and NIDS are estimated as shown in Annex D-1. The NPVs (net production values) per ha by land use category and the same by irrigation scheme and irrigation block and are estimated based on the crop budgets as shown in Annex D-2. The NPV under the present condition is estimated at GHC 14.2 million, 5.9 million and 20.1 million, respectively, for KIS, NDIS and APGIP. The same by land use category is as summarized in the following table.
Cropping Pattern cassava/maize/pepper/cowpea/groundnutLand Preparation plowing/harrowing once by machinery hiring serviceSeeding Rate maize: 25kg/ha (local), pepper: 250g/ha (improved)Planting Method manual drilling (maize/cowpea/groundnut), pepper (planting seedling)Fertilization 1/ proportion of farmers use fertilizer: about 40% (Studi Report)Agro-chemical Use 1/ proportion of farmers use chemicals: about 40% (Studi Report)Harvesting manualThreshing/Shelling manualDrying sun dryingYield Level cassava: 3.5t/ha, maize: 1.2t/ha, pepper: 0.7t/ha (dry)
1/: Volume of fertilizer application appear to be very limitedSource: Studi Report 200,000ha & field survey by the JICA Study Team
Farming Practices Prevailing Practices
- 31 -

- 33 -
Table 2.7.10 Annual NPV by Land Use Category under Present Condition in the Project Area
Block/Land Use Category Area Crop Annual NPV/ha Annual NPV
(GHC) (GHC’000) 1. Irrigated rice field (KIS) 1,852 Irrigated rice 2,442 4,5232. Irrigated rice field (Prairie) 490 Irrigated rice 2,440 1,1962. Banana farm (Golden Exotic) 1 1,200 Banana 7,404 8,8853. Irrigated upland field (Cassi) 162 Maize/soybeans - -4. Upland field (NDIS & KIS) 2 4,441 1 843 3,7435. Grass land 3/ 3,061 Grazing 580 1,775
Total; 11,206 - 20,1221: Estimated 2: Cassava/maize/pepper etc. 3: Source – Studi Report 200,000ha
The NPV per ha of grassland used for grazing is estimated to be GHC 580/ha2 based on the Studi 200,000ha Report. 2.7.7 Farm Economy Access to farm economic data for the project area was limited to the results of sample survey conducted under the Studi Report 200,000ha.3 According to the report, the average monthly income of sample farmers (110 samples) is reported to be GHC 333 per month and an annual income of GHC 4,000 per farm household is roughly estimated. 2.7.8 Agricultural Support Services (1) Agricultural Research The principal agricultural research institutes in Ghana, which are placed under the jurisdiction of Council for Scientific and Industrial Research (CSIR) of Ministry of Environment, Science and Technology, are as follows:
Table 2.7.11 Agricultural Research Institute in Ghana Research Institute Major Research Theme/Activity
Crop Research Institute (CRI) Cereal, legume, tuber crop, and industrial crop production in the tropical rain forest area (Kumasi)
Food Research Institute (FRI) Processing, storage, marketing & utilization of farm products (Accra) Savanna Agricultural Research Institute (SARI) Production technology, breeding, and farming system in the savannah
area (Tamale) Oil Palm Research Institute (OPRI) Oil & coconut palm production and processing (Kade) Soil Research Institute (SRI) Rational utilization of land, soil management, prevention of
desertification (Kumasi) Animal Research Institute (ARI) Animal health, husbandry, and livestock management (Accra) Plant Genetic Research Institute (PGRI) Study on use & conservation of plant genetic resources (Bunso)
In addition, research activities in cacao, coffee, cashew nut and other nuts are carried out by Cacao Research Institute under Cacao Marketing Board, and agricultural experimental or research activities are conducted by technical directorates of MoFA and national universities. 2 NPV of grazing land is estimated as follows (based on page 379 of Studi Report 200,000ha):
Grazing NPV for 142,170ha is GHC 41,314,000, assuming 50% of such area consists of grazing land GHC 41,314 thousand/71,085ha = GHC 580/ha; NPV of grazing land/year
3 Sample survey on 110 farmers conducted in Dangle West & East, North & South Tongu district
- 32 -

- 34 -
(2) Extension Services (a) Extension System The agricultural extension services in Ghana are provided under the jurisdiction of DAES (Directorate of Agricultural Extension Services) of MoFA and field services are carried out by the Regional Food and Agriculture Offices at the regional level and District Agriculture Offices at the district level. Extension services are rendered under a TV (training & visit) system and the services are basically provided by AEA (Agricultural Extension Agent) through FBOs (Farmer Based Organizations). The service area of AEA is called the “operational area” and one AEA is posted in the operational area. The number of farmers per operational area and the extent of each area depend on the characteristics of the region or district. The envisaged criteria for the deployment of extension staff in the country is as follows:
Table 2.7.12 Deployment of Extension Staff Area No. of Operation Areas No. of Extension Staff Posted
District 2—3 zones, 16—24 operation areas 16—24 AEAs, 2-3 supervisors Zone 8 operation areas 8 AEAs & 1 supervisor Operational Area Service area of AEA 1 AEA
Major activities of AEA include demonstration, farmer training, field guidance/training, a farmer field day and organization of FBO (Farmer Based Organization). Recently an extension program called “Youth in Agriculture Programme” (YIAP) was launched to encourage participation of youth in agriculture production. YIAP has 4 components: i) crops/block farm, ii) livestock & poultry, iii) fisheries/aquaculture and iv) agribusiness. Under the block farm, YIAP provides tractor service and farm input on interest-free credit. The block farm system was started in 2008 and some 47,000 farmers working 10,000–11,000 ha received the benefits in 2009 and 80,000 farmers working 47,000 ha did in 2010. (b) Extension Services in the Project Area The agricultural extension services in the Project area are provided by the Dangme West, North Tongu and South Tongu District Agriculture Offices and KIP (Kpong Irrigation Project). The field level extension services are basically provided by the field extension staff—AEAs—posted in their operational areas. In KIS, both AEAs and KIP extension staff are providing such services. In KIS, a total of 4 extension personnel (3 AEAs and 1 KIP extension staff) are deployed. In the NDIS Area, 2 AEAs and 1 supervisor (SMS/Subject Matter Specialist) from the Dangme West Agriculture Office and 3 AEAs and 1 supervisor from the North Tongu Agriculture Office are posted. The extension system in Ghana is a TV (Training & Visit) system, and services are rendered through FBOs (Farmer Based Organizations). One AEA covers 6 to 8 FBOs in Dangme West District and 3 FBOs in North Tongu District. The organization structure of the Dangme West District Agriculture Office (District Agriculture Development Unit) is as shown in the following figure.
- 33 -

- 35 -
Fig. 2.7.2 Organization of Dangme West District Agriculture Office Basic extension activities of AEAs include: farmer training, establishment of demonstration fields with farmers, field guidance, formation of FBOs and field data collection. Major constraints for extension services reported by the 2 district offices are: insufficient deployment of AEAs, insufficient budgets for the services, and insufficient transportation means. (c) Field Extension Services Coverage in & around the Project Area. The Studi Report for 200,000ha (results of sample survey) indicates the field extension services coverage in and around the project area as follows:
Table 2.7.13 Field Extension Services Coverage in & around the Project Area Item Sample Survey Result
Farmers receiving advice from AEA (sample No. 78) Receiving: 71%, not receiving: 29% Farmers attending demonstration activities (sample No. 107) Attending: 53%, not attending: 47% Frequency of AEA visit (sample No. not known) Regular: 20%, weekly: 12%, fortnightly: 46%, once
a while: 22% Source: Studi Report 200,000ha
3) Farm Input Supply (a) Fertilizer & Agro-chemical In Ghana, fertilizers and agro-chemicals are basically imported and the prevailing channels of such farm inputs are: importer - distributor – distributor’s depot/retailer in rural center/town - farmer. In and around the project area there are several retailer shops handling farm inputs in rural centres/towns. Currently, fertilizers are supplied at subsidized rates to farmers through the rural distributors’ depots or retailers. The current subsidized rates of major fertilizers and import volumes of the same in the country are as follows:
District District District District Management
Agriculture Agriculture Agriculture Agriculture District &
Officer Officer Officer Officer Veterinary Information
Crop Extension Mechanization Livestock Officer System& Post-harvest Office
AEAs AEAs AEAs AEAs VOs Community Level
FBOs FBOs FBOs FBOs Farmer Level
AEA: Agricultural Extension Officer VO: Veterinary OfficerFBO: Farmer Based Organization
Director
- 34 -

- 36 -
Table 2.7.14 Subsidized Prices of Fertilizers & Fertilizer Import Fertilizer Non-subsidized Price Subsidized Price Fertilizer Import
15-15-15 GHC 56/50kg GHC 27/50kg 197,600 tons Urea GHC 51/50kg GHC 25/50kg 25,000 tons Sulfate of Ammonia GHC 38/50kg GHC 18/50kg 4,600 tons
1: As of April 2011 2: Import volume in 2009 (Agriculture in Ghana, Facts & Figures (2009), MoFA
The subsidy will be continuously provided to farming communities in the future in both cases of adopting the project and not adopting the project. The import volume of the three fertilizers amounts to some 227,000 tons in 2009. (b) Seed Production and Distribution The seed production and distribution system of grains and legumes in Ghana is illustrated as shown in the following figure.
Fig. 2.7.3 Grain & Legume Seed Production & Distribution System in Ghana In 2010, there were 453 rice seed growers in the country and they produced some 3,900 tons of seeds in 1,650 ha of seed farms. The primary rice seed production region is the Upper West region followed by the Northern Region and Upper East Region. In KIS, there are 13 rice seed growers. (4) Farm Credit (a) Credit Facilities The primary formal lending institutions of farm credit in Ghana are Agricultural Development Bank (ADB) and the rural (& community) banks (RCBs). ADB provides lending services to all farming communities of small holders, large scale and agri-business farms. The bank has 51 branch offices and 13 farm loan office/agencies in the country. In the project area, one farm loan office is established in Asutsuare, and the Tema branch office and Ashaiman agency also cover the area. RCBs are banks
Flow of breeders seed Flow of foundation seed Flow of certified seed
CRI: Crop Research Institute SARI: Savanna Agricultural Research InstituteSICD: Seed Inspection & Certification Division/MOFA
Farmers/Producers
CRI, SARI & UniversitiesProduction of Breeders
Seed
Production ofFoundation Seed
Production of CertifiedSeed Seed Growers Seed Companies
Private SectorGrains & Legumes
Development Board
Certification by SICD
- 35 -

- 37 -
established by rural communities and their main customers are small holders, especially cacao farmers. Currently, there are 130 RCBs in the country. In the project area, a branch of Dangme Rural Bank in Asutsuare, Dangme West District, the head office of Mepe Rural Bank in Mepe, and a branch office of North Tongu Rural Bank in Bottor, North Tongu District are operating farm credit services; however, their farm credit services appear to be rather limited. The terms and conditions of the farm credit provided by the ADB are as follows:
Table 2.7.15 Terms & Conditions of ADB Agricultural Credit Eligible groups of credit Individual, group of individuals, cooperative society, limited liability company Credit Amount Short term: long term: GHC 50,000.- or more (negotiable) Interest rate Short term credit (< 12 months): base rate 21.95% + processing fee 2%; total 23.95% Long term credit (12 months – 3 years): base rate 21.95% + processing fee 2%; total 23.95%Security/collateral Necessary (guarantee by guarantee companies cover 75% of credit amount; fee 2.5% of
credit amount) Others Having account with ADB
Source: ADB, Accra Head Office
The terms and conditions of the farm credit provided by RCBs in the Project area are similar to those of ADB, except for the interest rates. The current interest rate for short-term farm credit of the rural banks operating in the area is 28%. The accessibility to those formal lending institutions appears to be limited in many cases for small holders, and informal sources for farm credits such as relatives, friends and traders are prevailing in rural areas. Further, an informal saving & credit system called “susu” plays an important role in farm credit in the areas. (b) Access to Farm Credit in & around the Project Area. In KIS area, irrigation beneficiary farmers are formed into an agricultural cooperative society and have access to farm credit provided by ABD. However, in the NDIS area, accessibility to farm credit appears to be very limited. The Studi Report 200,000ha (results of sample survey) indicates that the farmers in and around the project area have access to the following farm credit:
Table 2.7.16 Farmers Access to Farm Credit in & around the Project Area Item Sample Survey Result
Farmers receiving credit for farming (sample No. 108) Receiving: 46%, not receiving: 54% Farmers having access to some form of credits (sample No. 108) Having access: 46%, no access: 72% Source of credit (sample No. 50) Formal institution: 28%, informal institutions: 72% Use of farm credit (sample No. 51) Land preparation: 94%, seed/seedling: 78%
Source: Studi Report 200,000ha
As shown, informal institutions are main providers of farm credit in & around the project area as, except for ADB and a few rural banks, commercial banks are not interested in providing credit to farmers and because of stiff conditions to receive credit from formal lending institutions.
- 36 -

- 38 -
2.7.9 Major Agricultural Facilities Major agricultural facilities in and around the project area include: rice mill, storage facility and drying facilities. The results of inventory on such facilities are as follows:
Table 2.7.17 Agricultural Facilities in & around the Project Area
According to Studi Report 200,000ha, about 54% of sample farmers possess some kind of storage facilities at home. Most common storage facilities they own are traditional ones.
2.7.10 Marketing (1) Prevailing Marketing System of Paddies & Rice in Ghana4 About 65% of rice for consumption was supplied with imported rice in Ghana in 2009/10 (refer to Table 1.1.5). There are many actors in the imported rice commodity chain, such as importers, wholesalers, large-scale consumers including hotels & restaurants, and large & small retailers. Generally, imported rice is sold in big central markets and local or satellite markets. In major cities, where there is demand and the purchasing power is high, the price of rice (imported rice) is high. On the other hand, in rural areas where there is limited demand for rice, the price of rice is relatively low. The consumer preference for taste is fragrant rice, whether it is produced locally or imported, and one of the major criteria making the consumer buy imported rice is its cleanliness. The rapid urbanization in Ghana as well as the growth of per capita income will lead to a rapid increase in rice consumption in the country. The prevailing marketing channels of paddies and rice in Ghana are reported as follows in the Study on the Promotion of Domestic Rice in the Republic of Ghana, JICA, 2008.
4: Source: The Study on the Promotion of Domestic Rice in the Republic of Ghana, Final Report, March 2008, JICA
Producer Collector Middlemen
Wholesaler Rice Mill Retailer
Consumer
Source; The Study on the Promotion of Domestic Rice in the Republic of Ghana, Final Report, March 2008, JICA
Imported Rice Local Rice (irrigated areas)
Importer
Retailer
Consumer
Place/Owner Facility No. Capacity/Size/RemarksKIP Rice mill 3 500kg paddy/hr x 3 units, Yanmar
Warehouse 2 1 0,000 tons & 5,000 tons Rice dryer 6 500 kg paddy x 3 units
2,000 kg paddy x 3 units Drying floor 45 7.2 x 7.2 m x 45 floors
Prairie Volta Farm Rice mill 1 10 ton paddy/hr. Silo 8 1,500 ton paddy x 8 units = 12,000 tons
Cassi Farm Silo 4 500 ton grain x 4 units = 2,000 tons Warehouse 1 16 x 75 m
Others Rice mill 32 mostly capacity 500 kg paddy/hr owned & operated by individual
Source: Inventory survey by the JICA Study Team
Fig. 2.7.4 Prevailing Marketing Channel of Rice
- 37 -

- 39 -
(2) Prevailing Marketing System in the Project Area Traders play an important role in the marketing of farm products in and around the project area. Traders operating in the project area can be categorized into internal traders and external traders. The internal traders are those who reside in & around the area, and the external traders are those coming from outside of the area. Traders generally specialize in the commodities they purchase, such as pepper tomatoes, cassava, and rice. Apart from buying from the farm gate and home, traders purchase products from daily and weekly markets in the area. The price of commodities purchased by them is basically determined by the supply and demand of commodities in particular seasons. Marketing or buying centres in and around the area include Asutsuare, Akuse, Avehime, Mepe and Bottor. The prevailing marketing channel of paddies in the KIS area is: farmer – traders from Kumasi & Takwa (mostly market women). Traders from Kumasi usually take paddies back to the Kumasi area and mill them there, on the other hand, traders from Takwa mill paddies in the KIS area and take the rice to their places. In the KIS area, there are 32 small rice mills. Milling capacities of the rice mills are mostly around 4 tons of paddies per day. Because of the limited supply of products and the seasonal nature of supply, such mills are operated far below their processing capacities. Processing of cassava into dough (dried tube) or gari (cassava flour), and pepper to dried & grinded pepper is commonly practiced by producers before marketing. According to Studi Report 200,000 ha, some portions of pepper and okra produced in & around the area are exported through traders. On the other hand, the Natriku Womens Association based in Akuse started trading chilli peppers in 2006 and okra in 2007. The association exports such products on behalf of member producers. (3) Wholesale Market Prices of Rice The differences in market prices of local rice and imported rice are reported in the rice market of the country as shown below.
Table 2.7.18 Monthly Average Wholesale Prices of Local and Imported Rice Differences of about 20% in the price between local and imported rice are observed in the table. The expected production of quality rice under the project will result in premium prices for rice produced in the project area.
Unit: GHC/50kgCommodity Jan. Feb. Mar. Apr. May Jun. Jul. Aug. Sep. Oct. Nov. Dec. Average
Local Rice (2010) 52.81 54.03 52.83 52.64 53.36 54.63 54.46 55.76 53.23 53.54 55.55 55.48 54.03
Local Rice (2009) 48.04 49.77 50.70 49.50 50.64 52.89 52.05 54.44 55.06 53.54 53.43 52.89 51.91
Local Rice (2008) 59.71 65.00 61.41 60.85 62.37 62.90 63.90 64.75 65.31 65.02 64.45 64.53 63.35
Imported Rice (2010) 64.48 64.95 65.92 66.15 66.15 68.22 66.92 66.93 67.48 68.77 71.35 72.60 67.49
Imported Rice (2009) 59.71 65.00 61.41 60.85 62.37 62.90 63.90 64.75 65.31 65.02 64.45 64.53 63.35
Imported Rice (2008) 42.97 43.70 45.17 47.54 56.17 59.99 61.79 60.53 60.89 61.92 62.28 61.53 55.37
Average of 2009 & 2010
Local Rice 50.43 51.90 51.77 51.07 52.00 53.76 53.25 55.10 54.15 53.54 54.49 54.19 52.97
Imported Rice 62.10 64.98 63.66 63.50 64.26 65.56 65.41 65.84 66.39 66.90 67.90 68.56 65.42
Source: : Marketing Services Unit, SRID (MOFA)
50.00
55.00
60.00
65.00
70.00
75.00
80.00
1 2 3 4 5 6 7 8 9 10 11 12
Local Rice
Imported Rice
- 38 -

- 40 -
2.7.11 Agricultural Mechanization The agricultural mechanization in the country has been promoted under the Agricultural Mechanization Centres (AMSEC) program of MoFA (Agricultural Engineering Services Directorate/AESD). Under the program, AESD supply farm machinery to companies or cooperatives that are qualified by the Directorate to be established as farm machinery services providers or as agricultural mechanization centres. The providers will have supplies of tractors, accessories and trailers from the Directorate at subsidized rates. The basic conditions of the supply are:
Subsidy 33% of machinery CIF prices subsidized Down Payment 50% of machinery prices (50% × 67% of CIF prices) Instalment Payments 3 to 5 years install payment (50% × 67% of CIF prices)
The program started in 2007 and a total of 84 AMSECs had been established in the country by the end of 2010 and organized into the National Association of Agric Mechanization Service Center Operators (NAAMSECO). In the project-related district of Dangme West, one AMSEC is established. The number of tractors (mostly medium sized/60-65HP ones) in the project-related districts is reported to be 22 in Dangme West, 4 in North Tongu and 9 in South Tongu (Studi Report 200,000ha). 2.8 Existing Irrigation Systems 2.8.1 Irrigation Systems (1) Kpong Irrigation Project (a) Irrigation system KIS was constructed to supply irrigation water to 1,955 ha in the Asutsuare irrigation scheme and new development area of 1,073 ha in the Akuse area by gravity. The main features of KIS were composed of the irrigation canal construction in the Akuse and the Asutsuare low level and high level areas. The high level area has been cultivated for bananas under the Golden Exotic Ltd. for the last three years.
i) Main supply canal The main irrigation canal (Akuse main canal) is 16.2 km long and originated from the existing irrigation outlet in the Kpong dam right embankment to the diversion point of the Northern and Southern Lower Level Canals. The canal slope is limited to 1:10,000 due to a limited fall available between the Kpong dam outlet to the tail area. The canal was designed for a full intake water discharge capacity of 7.21 m3/sec between 0 Km to 2.20 Km, where a major distributaries group is required to serve Branch AK/C2 and the northern part of the Akuse area. There are a total of six branch canal offtakes in the Akuse area. The offtakes are comprised of vertical lift gate cross regulators linked to the check gates (movable weir head regulators). The check gates are located immediately upstream of the six siphons crossing major drainage canals.
- 39 -

- 41 -
ii) Low level canal The lower level canal is composed of the northern low level canal (NLLC) and the Southern low level canal (SLLC) to supply water to the downstream area of the KIS. NLLC and SLLC are diverted immediately downstream of the Akuse main canal. SLLC is diverted to the Distributaries Y and Z. iii) High level canal The high level irrigated area is located at SLLC to supply irrigation water to the elevated area through the high level pump station. The high level area is utilized for the banana estate under the administration of Golden Exotic Ltd. iv) Night storage reservoir Night storage reservoirs were constructed in the Akuse and high level areas. In the Akuse command area, night reservoirs are located at the lateral canals of AK/C2, AK/C3, AK/C4 and AK/C5 to hold the total daily irrigation requirements for each lateral canal. During the 12-hour daytime operation, lateral canals draw water from the night storage reservoirs. A total of five night reservoirs were constructed along the high level canal. v) Lateral canal The infield layout has been based on the 24 ha standard watercourse unit comprising of 24 paddy basins of 1.0 ha each. Field laterals are designed for 12-hour operation with a standard discharge of 75 lit/sec., which is equivalent to about 1.5 lit/sec/ha over 24 hours.
(b) Beneficiaries and Farmers Organization The current water users of KIP are categorized into four groups, i.e., small-scale rice farmers (1,852 ha), banana estate (1,200 ha), fish-pond users (28 ha), and vegetable farmers whose farms are out of the project area (40 ha). The majority of the beneficiaries are small-scale farmers holding approximately 2,052 ha, of which the share of land developed is 2,052 ha. As for small-scale rice farmers, residents of the communities of the project area and people from the submerged area of the Kpong dam site were settled and allocated 1 ha of farmland by the land allocation committee of the project. (c) Organization and Management Structure The Kpong Irrigation Scheme is managed by KIP, which is a substantial unit of GIDA for project management. Even though KIP was expected to be operated and maintained autonomously in terms of finance at the design stage, the budgetary allocation from GIDA had been continued from the beginning of the project up to now. KIP has four core function units in its administration: project management, field operations, maintenance, and finance and administration. The number of total staff members is 101 in 2010, of which 8 are seconded to GIDA Headquarters. (d) Operation and Maintenance of Irrigation System
- 40 -

- 42 -
The demarcation of responsibility for operation and maintenance of the irrigation system are as follows. - The project (KIP): Operating and maintaining the irrigation system from the intake to secondary
canals, main and secondary drainage, access road and other major facilities. - Farmers: Operating and maintaining the lateral canals as well as lateral drainages. - Banana estate: Operating and maintaining the pump station and irrigation system after the pump. (e) Services and Activities The services provided by KIP, apart from the operation and maintenance of irrigation system are as follows: - Agricultural extension - Machinery service (Tractor service has been stopped now, but a construction machinery service
and caring service are provided to farmers.) - Facilitation of agricultural credit - Seed production and sales (f) Irrigation Service Charge Irrigation service charge (ISC) is charged to water users and collected by KIP directly based on the contracts between users and KIP. ISC is charged to areas without consideration of crop type; however, the price is decided depending on the purpose and condition of water users, i.e., 120.00 GHC/ha/year for the full irrigable area (in case of small-rice farmers), 39.60 GHC/ha-year for water access out of the commanded area with a pump (in case of vegetable farmers) and 133.00 GHC/ha/year to the aquaculture area (in case of fishery-pond users) individually. ISC consists of a land rent fee, project development fee, irrigations fee, and management fee. As for the banana estate, a concession fee including ISC is charged under the contract with GIDA, and the fee is paid to GIDA. The recovery of ISC is as low as 45% in 2010, which is almost the same as the national average of 53.5%. The detailed information on the management of KIP is attached in Annex E.1. (2) Other Irrigation Project (a) Aveyime Irrigation Project The project site is a three-hour drive from Accra via Sege. The national road runs from Accra to Sege, and a road with asphalt pavement connects Sege and the site spreading along the lower Volta River. The road condition is good. The scheme is a pump irrigation system completed in 1975. The water source is the lower Volta River. Japan was involved in the initial construction stage, and JICA studied the feasibility of rehabilitation of the project in 1997. The potential area is 120 ha and developed area is 60 ha. The irrigation system was abandoned because of a breakdown of the pumps in 1998. After that, the
- 41 -

- 43 -
project was rehabilitated by AgSSIP (World Bank program) in 2005. After pumping up irrigation water, it is stored in a night storage reservoir. From the reservoir, the main and secondary canals convey the water by gravity. The major crop is expected to be paddy rice at the beginning of irrigation restart, and in the future, farmers intend to introduce pepper. Testing of the pump system was done at the beginning of 2011 and minor repair work for the night reservoir and canals are underway at the moment. It is expected to start cultivation in March with 60 ha of paddy fields. Because of the high cost of pump operation, farmers intend to minimize use of pump water. Thus, farmers delay their cropping calendar so that they can utilize rain in April and May as much as possible. Because AIP has just started irrigation services, ISC has not yet been charged so far. The price of ISC will be decided after ascertaining the results of the first crop. Even though AIP is designed to provide agricultural support services, such as marketing and credit, those services are not in sight so far. (b) Tokpo Irrigation Project This project is located at a distance of 10 km to the west of Aveyime. The road is unpaved, with a dirt surface. The potential area is 91 ha, of which 68 ha has been developed by 404 farmers (236 males and 168 females). This scheme was completed in 2005 under SSIDP of AfDB. Unfortunately, the scheme has not yet started irrigation services. After pumping up irrigation water, it is stored in a night storage reservoir. From the reservoir, the conveyance canal and secondary canals deliver the water by gravity. The conveyance canal connects the No. 1 and No. 2 reservoirs. Major crops are paddies and vegetables. The project was left uncompleted because of loan expiration. Farmers feel strong indignation with the unfinished situation, because they cooperated with the project by not farming during the construction period. Land levelling work was not conducted. This makes cultivation difficult. Land reclamation is another critical issue. It is not expected that farmers would conduct reclamation where the utilization of cattle for working is uncommon. (3) Other Large-scale Irrigation Users Other large-scale irrigation users, which are private large-scale farms, operating in the project area are summarized below. Detailed information on each user is shown in Annex E.2. (a) Golden Exotics Farm The Golden Exotics Farm is operated by Golden Exotics Ltd., which is a local subsidiary of a French company named “La Compagnie Fruitiere” (LCF). The Golden Exotics Farm has irrigation land approximately 1,200 ha in KIS and produces bananas for export. The farm takes irrigation water from the secondary canal of KIS by pump. A drip irrigation system is applied over the entire farm. The land of the farm is rented by the government (GIDA) under the concession contract, including the
- 42 -

- 44 -
irrigation system. (b) Prairie Volta Farm The Prairie Volta Farm is operated by Prairie Volta Ltd., which is a funded by joint investment between USA and Ghana, of which 30 % was received from the Government of Ghana, 30% from Ghana Commercial Bank, and 40% from Prairie Texas Cooperated. The Prairie Volta Farm operates large-scale rice cultivation with irrigation water taken from the Volta River by pump. The cropped area was 290 ha in 2010, whereas the farm size is approximately 1,300 ha. After pumping up, irrigation water is delivered to each plot by a gravity canal system developed by the farm. The farm is equipped with a large-scale drying-milling-storage facility with a capacity of 60,000 MT/year. (c) Cassi Farm The Cassi Farm was established in 2009 as a private company with investment by Ghanaian capital. The farm takes water from the Volta River by pump and delivers it to the fields with a pressurized system, with approximately 2 km from the river to the field. A centre pivot irrigation system, which uses pressured water from the Volta River, is introduced to cultivate maize, soy beans, and vegetables. The irrigated area covered 160 ha in 2010. (d) Volta River Estate Farm (Site-D) Volta River Estates Ltd, which has shareholders from Agrofair—a fairtrade organisation from the Netherlands—and other shareholders are from within Ghana. Volta River Estate has 4 banana estates in the Northern and Greater Accra regions, of which the total area is 370 ha. One of the estates, Site-D (120ha), is located next to the KIP project area. The farm takes water from the Volta River by pump and applies it to crops by a micro sprinkler system in the field. Because Site-D is close to the river and the pump is connected to the micro sprinkler system, there is no need for water from KIP or APGIP. (e) N&D Organic Farms N&D Organic Farm is a Ghanaian privately-operated company established in 2008, which produces bananas by organic cultivation. The farm is located next the KIP project area. In 2010, 8ha were cropped, whereas the total farm size is 50 ha. Currently, the farm cultivates crops by rain because the irrigation system is under development. Because the farm is close to the Volta River and the elevation of the
farmland is high, the farm is planning to install a pump in the Volta River. There is no need for water from KIP
or APGIP. 2.8.2 Farmers Organization and WUA (1) Farmers Organization in Irrigation Project The farmer’s organization is registered based on the Cooperative Societies Degree, 1968, N.L.C.D. 251and Cooperative Societies Regulations, 1968, L.I. 604. According to the Regulation of GIDA, it is prescribed that all the farmers for each project shall establish a Farmer’s Cooperative Society (Farmers Cooperative). The Farmers Cooperative is required to:
- 43 -

- 45 -
- Reprint its members in all transactions both with private and government agencies concerning the Project.
- Participate in the business of the Management of the Project - Participate in the operation and maintenance of irrigation facilities, and - Act as an arbitrator in disputes involving members of the Farmers Cooperative. As described above, the Farmers Cooperative in the GIDA irrigation project has the role and responsibility as a Water Users Association (WUA) and, in general, WUAs are not established in addition to cooperatives. By organizing all farmers in the project, it is expected that the Farmers Cooperative would play a role in overall farming activity covering crop production and marketing as well as irrigation and water management. (2) Osudoku Agricultural Cooperative Society Limited Osudoku Agricultural Cooperative Society Limited (Osudoku Cooperative) was established to organize all farmers in KIS and it was registered based on the Cooperative Societies Decree, 1968, No.252 on 2003. The purposes of the establishment mentioned in the by-laws were: - To promote unity in all aspects among the family groups on the project - To assist others in terms of cultivation and marketing of the farm produce - To promote scientific methods of rice farming - To educate farmers on the urgent needs and benefits as a farmer - To liaise between the lateral groups, the branch canals, KIP management, and farmers and the
financing bank - To seek relief service to all farmers on the project There are approximately 2,500 members of the Osudoku Cooperative, but some of them have retired from farming and only the name remains the same. Joining the Osudoku Cooperative was a condition in the land allocation agreement to obtain farmland in KIS. The Osudoku Cooperative has an executive committee acting as the governing body of the management structure. The executive committee is presently made up of 11 members, consisting of the president, vice president, secretary, vice secretary, treasurer, vice treasurer, two organizers, and three other members. The committee members are elected from the branch canal group. The financial sources of the Osudoku Cooperative are the membership fee and commission on the Osudoku Cooperative marketing of rice. The major roles and activities of the Osudoku cooperative are: - Implementation of water management (water distribution) under the leadership of Block Leaders
and Lateral Leaders, - Organizing communal work and mechanical work for maintaining lateral canal and drainage, - Cooperative marketing of rice, - Facilitation of ADB credit access,
- 44 -

- 46 -
- Group purchasing of agricultural input, and - Organizing communal work for harvesting. The demarcation of maintenance of irrigation infrastructure is in such a way that the Osudoku Cooperative would take responsibility for the lateral level canal and drainage, and KIP would be responsible for the remaining matters. Maintenance work at the lateral level is usually conducted in January and June, and is carried out mainly through member’s communal work led by the Block and Lateral Leaders. In cases where mechanical work is necessary, the Osudoku Cooperative would rent machinery from KIP. Currently, no accurate water management is applied in the KIP irrigation system. Lateral blocks within the secondary or branch canal start to take water simultaneously when it is available in the canal. Within the lateral block, farmers take water step-by-step from the lower reach to the upper reach, in principle. There are many cases when farmers face difficulty in following such regulations due to broken or malfunctioning gates, or other problems. Farmers who benefit from a certain lateral canal have formulated a lateral group, which is a basic unit for the operation and maintenance of the lateral canal. There are approximately 200 Lateral groups in KIS. The Lateral leader is elected by members to manage and lead the lateral group. Several lateral groups gather to formulate a block of laterals and the Block leader is elected. Block leaders are considered as key people for coordinating and adjusting issues on water use and maintenance work among farmers. In the case of occurrences of problems or conflicts, Block leaders have a discussion with the branch canal executive, who is in charge of management at the branch canal level within the Osudoku Cooperative. Branch canal executives participate in PMU meetings at KIP, representing the Osudoku Cooperative and reporting on the irrigation and farming, and on the coordination of the irrigation schedule, maintenance schedule and other services of KIP.
Branch Canal Executive
Block Leader*1
Lateral Leader
Farmers
PMU Meeting
Reporting
Coordination
Coordination
CoordinationReporting
Reporting
Coordination
Cooperative
KIP
Leading OM of Lateral Canal
OM of Lateral Canal
Coordinating Lateral Groups
*1: In some cases Block Group is mixed-up with Branch Group. Fig. 2.8.1 Structure of Water Management by Farmer’s Participation
The Osudoku Cooperative is currently not even playing the role it was designed to perform, due to:
- 45 -

- 47 -
- Mistrust between the members and their executives - Executives do not understand the roles and functions of the Osudoku Cooperative - Executives could not educate members for them to know they are partial owners of the Osudoku
Cooperative - The by-laws of the Osudoku Cooperative were not effectively implemented. (2) Aveyime Farmers Cooperative and Marketing Society Limited The Aveyime Farmers Cooperative and Marketing Society Limited (Aveyime Cooperative) was established in 1977 for the Aveyime Irrigation Project, and it was re-organized and registered as it is in 2005 to cope with the rehabilitation project. Because the rehabilitation was just completed this year and farmers are will carry out the first cropping since irrigation was halted 13 years ago, the Aveyime Cooperative has not started full-scale functioning. The Aveyime Cooperative comprises 90 members. The executive committee, which consists of nine members (the chairman, vice chairman, secretary, treasurer, organizer and another four members), is the managing body of the Aveyime Cooperative. The demarcation of operation and maintenance is such that the project takes the responsibility for the pump, main canal, main drainage, etc., and farmers take the responsibility for maintenance at the lateral level. Block leaders will be appointed by the Aveyime Cooperative to operate the check gates in the irrigation system. The pump will be operated by the operator deployed by the project. The price of ISC has not yet been decided because neither the project nor farmers have any idea of the cost for running the pump at the moment. The decision is scheduled to be made after the first crop, based on the result of the actual cost. (3) Tokpo-Noyami Farmers Association The Tokpo-Noyami Farmers Association was established in 2002 in order to organize the beneficiary farmers of the Tokpo Irrigation Scheme funded by AfDB. Because the project had been stopped during the construction stage, farmers have not started irrigation agriculture yet. The members of the Association are eager to complete the construction and to start irrigation as soon as possible. 2.9 Social and Environmental Conditions Social and environmental conditions were reviewed based on the Final Report of the Feasibility Study of the Accra Plains Irrigation Project, June 2010, GIDA, STUDI International. 2.9.1 Social Environment (1) Local Populace There are three districts in the project area: Dangme East, Dangme West and North Tongu District. The local populace in the project area is made up several ethnic groups. These are Mafis, Dangmes, Krobos, Ewes and Akans. The predominant ethnic group in Dangme East District is the Ga-Dangme (85.9%). The next largest ethnic groups are the Ewe (5.6%) and the Akan (5.1%). The predominant ethnic group in Dangme West District is the Ga-Dangme (77.8%). The next largest ethnic groups are the Ewe (12.3%) and the
- 46 -

- 48 -
Akan (4.9%). The predominant ethnic group in North Tongu District is the Ewe (90.3%). The next largest ethnic groups are the Akan (5.9%) and the Ga-Dangme (1.3%). There are no indigenous people in the project area. Most of the settlements in the project area are marked as rural in terms of population and function. The only exceptions to this general classification are Battor (13,203) and Mepe (8,096), which are urban in terms of population and function. Aveyime (7,258) is urban by population but elements of a rural agrarian economy manifest within the spatial configuration, housing characteristics, and economic life of the town.
Table 2.9.1 Population of each District
Name of District 1984 2000 2010* 2030* Growth Rate (%)
1984-2000
Dangme East 64,135 93,112 117,544 187,322 2.3
Dangme West 63,141 96,809 126,450 215,737 2.6
North Tongu 61,552 130,388 208,442 532,696 4.6
*Projected population are based on 2000 Population and Housing Census
(2) Local Resources (a) Local Resources Fuel wood is a major source of energy for cooking among households in the project zone. Rivers, lakes, and creeks in the project’s sphere of influence also provide households in the project area with water for domestic purposes. The rivers, creeks, and lakes are sources of fish and water for domestic purposes, and a means of transportation for the local population. The trees also support the local building industry. In addition, some of the trees and shrubs have medical value. The leaves of Azadirachta indica (Nim Tree) are used to cure malaria/fever. Ceiba is used to cure asthma, dysentery and menstrual bleeding, among others. The grass cover also supports livestock production as the grasses such as Brachiaria falcifera provide excellent grazing grounds for herbivores. (b) Culturally Sensitive Areas (Sacred Groves and Rock) There are seven culturally sensitive areas within the project area which may be affected by the development of the irrigation fields. Out of the seven, six are sacred groves covering an area of about one acre each, while the remaining one is a sacred rock. Seven culturally sensitive areas are located in North Tongu District. The locations of the culturally sensitive areas measured by GPS are shown in Table 2.9.2.
- 47 -

- 49 -
Table 2.9.2 Location of culturally sensitive areas within the project zone
Culturally Sensitive Areas Community Location (by GPS)
Harmpe (Horpe) sacred grove Near Kelekor N: 06.04424 E: 000.44387
Kumi sacred grove (site 1) Near Kumipo N: 06.04968 E: 000.43375
Kumi sacred grove (site 2) Near Kumipo N: 06.05052 E: 000.43209
Agorgorme sacred grove (site 1) Near Kelekor N: 06.03916 E: 000.44828
Agorgorme sacred grove (site 2) Near Kelekor N: 06.03915 E: 000.44901
Yafikpo (Anyafoekpo) sacred grove Near Ntepor (Nyafoekpo) N: 06.02373 E: 000.43340
Kpedinyi Rock/Stone Near Bla Botikope N: 06.03546 E: 000.41091
(3) Public Facilities/Social Institutions (a) Education There are public primary and junior high schools within the proposed project area. (b) Water and Sanitation The water bodies that are infected with disease vectors serve as a source of drinking water for some households in the project area. Therefore, potable water is supplied to all the communities in the project area. All the communities in the project area have access to pipe-borne water through community standpipes provided under the Three District Water and Supply Scheme. The project is being implemented by the Community Water and Sanitation Agency in the Dangme West District, Dangme East districts, and North Tongu District. (4) Economy Rain-fed farming and fishing are major economic activities. Fishing is one of the economic activities among the inhabitants of communities along the Volta River. The creeks and lakes provide avenues for fishing and aqua-culture, but currently fish landings from these sources are insignificant due to siltation and invasion caused by aquatic weeds. Traditional methods of fishing including trapping, and the use of cast nets, and hooks and lines. (5) Public Health and Sanitation (a) Health Facility The Catholic Hospital located at Battor is the only health facility in the project area. This specialised facility serves communities within the project’s sphere of influence as well as patients from the Accra-Tema metropolis and other settlements on the Accra plains. (b) Sanitary Condition
- 48 -

- 50 -
Some households drink water from non-pipe sources, such as lakes, creeks and the Volta River. In the rural communities, the use of pit latrines and open defecation are widely practised. The lack of sanitation facilities and the use of natural water bodies for domestic purposes are linked to the incidence of diarrhoeal diseases in the project area. (c) Major Diseases The major diseases reported at the Battor Catholic Hospital are malaria, gynaecological conditions, and hypertension. Bio-statistics from the District Health Management Team in Adidome support the high prevalence of malaria, hypertension and gynaecological disorders in the project district. Also, the top ten causes of morbidity in the district include water and sanitary-related diseases such as diarrhoea and worm infestation. The prevalence of HIV/AIDS in the North Tongu district is low (0.69%). The highest prevalence rate ever recorded in the district was 2.69%, in 2004. 2.9.2 Natural Environment (1) Topography and Geology (a) Topography The project lies within the coastal savannah climatic region. (b) Geology The Amo and Tefle series are the most dominant soil types in the project area. Clay and sandy clay are the major constituents of these series. (2) Flora and Fauna, National Park (a) Flora The project area is part of the coastal savannah vegetation zone, which is also referred to as the coastal scrub and grass zone. This zone is characterised by grass interspersed with scrubs and short trees. Trees in the project area are the major source of fuel wood (fire wood) for households in the project zone. Charcoal burning is also being undertaken on a small scale by women in the project zone, using off-cuts from these trees. Rare species have not been reported. (b) Fauna The following species are likely to be found in the project area. Rare species have not been reported: Birds: Bubulcus ibis (Cattle egret), Corvus albus (Hooded Crow), Neophron monachus (Hooded Vulture), Milvus milvus (Red Kite) and M. Migrans (Black Kite). Mammals: Xerus erythropus (West African Ground Squirrel), Cricetomys gambianus (Giant Rat), Rattus rattus (House Rat), Lemniscomys striatus (Spotted Grass Mouse) and Heliosciurus gambianus (Gambian Sun Squirrel), Thryonomys swinderianus (Grass cutter). Reptiles:
- 49 -

- 51 -
Agama agama (Rainbow Lizard), Naja nigricolis (Spitting Cobra), Dasypeltis fasciatus (Egg eating Snake), Bitis arietans (Puff Adder), Bufo regularis (Common Toad). Fish: These water bodies have a number of fish varieties, including Claris Senegalensis (Mudfish), Egeria Radiata (Oyster) and Hydrocyon Brevis (Tiger Fish). (c) National Park The project area is not located in a National Park or Protected Area. (3) Lakes and River system The project area has a number of water bodies. These include lakes, creeks and seasonal streams. Major water bodies in the project’s sphere of influence are the Volta River, Lake Mlangui (Mlangu), Lake Keli, Lake Aklamador (Kumikpo), Lake Blanor (Bla botikope) and Lake Blaque (Bla Botikope). The construction of the Kpong and Akosombo Hydroelectric Dams upstream reduced the tidal level of the Volta River, leaving behind lakes and creeks in a natural depression within the original riverbed. The water bodies are drying up due to the lack of flood water from the Volta River and the declining rainfall. (4) Climate (a) Temperature The average annual temperature for Akuse is 22.4°C. The warmest month is March, with a mean monthly temperature of 23.9°C in Akuse. The coldest month is August, corresponding to the rainy season, with an average temperature of 21.8°C for Akuse. (b) Rain The major rainy season is between March and July, while the minor season occurs between September and October. The mean annual rainfall over the period from 1961 to 2007 for Akuse is 1,148.4mm. The maximum and minimum annual rainfalls are 1,961mm (1966) and 563mm (1975) respectively. 2.9.3 Pollution (1) Water Quality According to the Environmental Impact study of the Accra plains (5,000 ha), nine water bodies within the project area were sampled to determine the physical, chemical and biological parameters, as baseline data. In terms of turbidity, four water bodies were within the World Health Organization (WHO) limit of 5 NTU, and five water bodies were above the WHO limit. The levels of ammonia, nitrates, sulphates and phosphates are within the WHO guidelines.
(2) Air quality
- 50 -
- 52 -
According to the environmental impact study of Accra plains (5,000 ha), air quality assessment was carried out at the four settlements within the project area. A PM10 (Particulate Matter) Minivolt Sampler was used, and values between 27.8 ㎍/m³ and 55.6 ㎍
/m³, which is within the EPA (Environmental Protection Agency) guideline of 70 ㎍/m³, were measured. (3) Noise According to the environmental impact study of Accra Plains (5,000 ha), noise assessment was carried out at the four settlements within the project area. A Quest Suite Professional high precision integrated/logging sound level meter was used, with measurement results showing that night time noise levels for three sampling points were within the EPA guideline of 48 dB (A). One sampling point was 50.7 dB (A), which is above the EPA guideline.
- 51 -


Chapter 3
Project Planning

- 52 -
Chapter 3 Project Planning 3.1 Constraints for Development Constraints for development of irrigation and water management are as follows:
Dependence of agriculture on poor and erratic rainfall. Inefficient use of existing irrigation systems. High development and running costs of irrigation systems. Low productivity on existing irrigation schemes. Delay in completion of design and implementation of some large irrigation schemes. Low capacity of staff engaged in irrigated agriculture.
3.2 Basic Development Policy The basic development concepts and some assumptions applied for the project formulation are enumerated as follows:
The project shall be formulated as an irrigated agriculture development project. Proposed target crop for the project is rice with double cropping. In order to save energy as well as operation and maintenance costs, a rational irrigation system
should be introduced by canal lining and also a gravitational irrigation system. Effective use of limited water resources Commercial oriented agriculture Small scale farmers, medium-large scale enterprise Sustainable irrigation project through a modernised management system for effective and easy
maintenance work Two scenarios for the project development plan for distribution of the project area for
commercial and small holders are as follows: Scenario 1: 50% of the project area is to be allocated to commercial enterprises and the
other 50% is to be allocated to government-organized small-scale farmers. Scenario 2: 100% of the project area is to be allocated to commercial enterprises.
3.3 Agricultural Development Plan 3.3.1 Land Use Plan In the Study, the introduction of double cropping for rice is envisaged in the project area, except for the existing agri-business farms and the areas demarcated for future expansion by the farms. The future land use under the with-project conditions by irrigation scheme—the Kpong Irrigation Scheme (KIS), New Developed Irrigation Scheme (NDIS), and the project (APGIP)—are as follows:
- 52 -

- 53 -
(1) KIS The future land use of KIS in the case of adopting the project is planned in accordance with the irrigation development plan as follows:
Table 3.3.1 Land Use of KIS in Case of Adopting the Project
Under the project, the area of irrigated rice fields will increase by 448 ha to 2,300 ha upon the conversion of currently uncultivated rice fields into irrigated fields. Further, a new banana farm covering 600 ha is planned to be developed by converting upland fields, bringing the total area for banana farms to 1,800 ha. (2) NDIS The future land use in the NDIS in the case of adopting the project is planned in accordance with the irrigation development plan as follows:
Table 3.3.2 Land Use in NDIS in Case of Adopting the Project
As shown in the table, the development of 5,687ha of irrigated rice fields is envisaged under the project by converting upland fields and grassland. No land use changes are assumed in Prairie Volta Farm and Cassi Farm, regardless of whether the project is adopted or not, as the land use at the farms
ha % ha % Changes/Remarks
1 Irrigated rice field 2,300 53 1,852 43 increase of 448ha1 Grassland 448 10 converted to rice field1 Others 120 3 120 3 right-of-ways etc.
2,420 56 2,420 56
1 Banana farm 1,800 42 1,200 28 existing banana farm2 Upland Field 600 14 upland field/newly developed area3 Others 90 2 90 2 upland field/right-of-ways etc.
1,890 44 1,890 444,310 100 4,310 100
With-project Without-projectArea Area
Scheme/Land Use CategoryKIS
Sub-totalGolden Exotics Farm
Sub-totalKIS Area Total (gross)
ha % ha % Changes/Remarks1 Irrigated rice field 5,687 78 newly developed rice fields2 Upland Field 3,309 46 converted to rice field/right-of-ways3 Grassland 2,562 35 converted to rice field/right-of-ways4 Others 297 4 113 2 right-of-ways etc.
5,984 82 5,984 82
1 Irrigated rice field 1,051 15 490 7 existing & new irrigated rice fields2 Upland Field 532 8 converted to rice field/right-of-ways3 Grassland 51 1 converted to rice field/right-of-ways4 Others 55 1 33 0 right-of-ways etc.
Sub-total 1,106 16 1,106 16170 2 170 2 irrigated upland field 162ha & others 8ha
7,260 100 7,260 100
with & withoutSub-total
Prairie Volta Farm
Cassi FarmNDIS Area Total (gross)
With-project Without-projectArea Area
Scheme/Land Use Category
Present
- 53 -

- 53 -
under the project are the same as the future land use planned without the project. In the Prairie Volta Farm, the irrigated rice fields are scheduled to be expanded by 561 ha from 2011 to 2012, bringing the total area of rice fields to 1,051 ha in the case of adopting the project. (3) Project Area The overall features of the future land use of the project area in the case of adopting the project are as follows:
Table 3.3.3 Land Use of the Project Area in Case of Adopting the Project
Under the project, the development of 6,135ha of new irrigated rice fields is planned and the total area of rice fields will be expanded to 9,038ha, including 1,852ha of existing rice fields in KIS and 1,051ha of rice fields in the Prairie Volta Farm, part of which are to be developed even if the project is not adopted. In addition, 600ha of banana farm will be developed in the Golden Exotics Farm under the project, as mentioned earlier. 3.3.2 Target Crop & Planned Cropping Pattern (1) Target Crop As a basic development plan, the double cropping of irrigated rice in the irrigation schemes is envisioned under the present study based on the following reasons.
- Rice imports in Ghana in 2009 reached about 384,000 tons. An expansion of rice imports is projected due to the increase of per capita rice consumption because of the progress of urbanization, income growth, and population growth. The production of domestic rice under the project will significantly contribute to food security in the country and to foreign currency savings.
- Most soil in the project area is very suitable for rice compared with other crops, as discussed in section 2.4. The suitability of soil for other crops, upland crops and vegetables, is low because of the clay texture and wetness hazard.
- No serious constraints are anticipated in the marketing of products (paddy & rice) because of
ha % ha % Changes/Remarks1 Irrigated rice field 7,987 69 1,852 16 KIS, No. 1 Area & No. 2 Area2 Irrigated rice field /Prairie 1,051 9 1,051 9 no change from without-project condition
Sub-total 9,038 78 2,903 253 Banana farm 1,800 16 1,200 10 expansion of 600ha4 Irrigated upland field 162 1 162 1 no change from without-project condition5 Upland Field 3,777 33 converted to rice field6 Grassland 2,958 26 converted to rice field
Sub-total 1,962 17 8,097 7011,000 95 11,000 95 project net area
7 Upland/Grassland 206 2 converted to right-of-ways8 Others 570 5 364 3 right-of-way etc.
11,570 100 11,570 100 project gross area
Scheme/Land Use Category
Project Area (net)
Project Area (gross)
With-project Without-projectArea Area
- 54 -
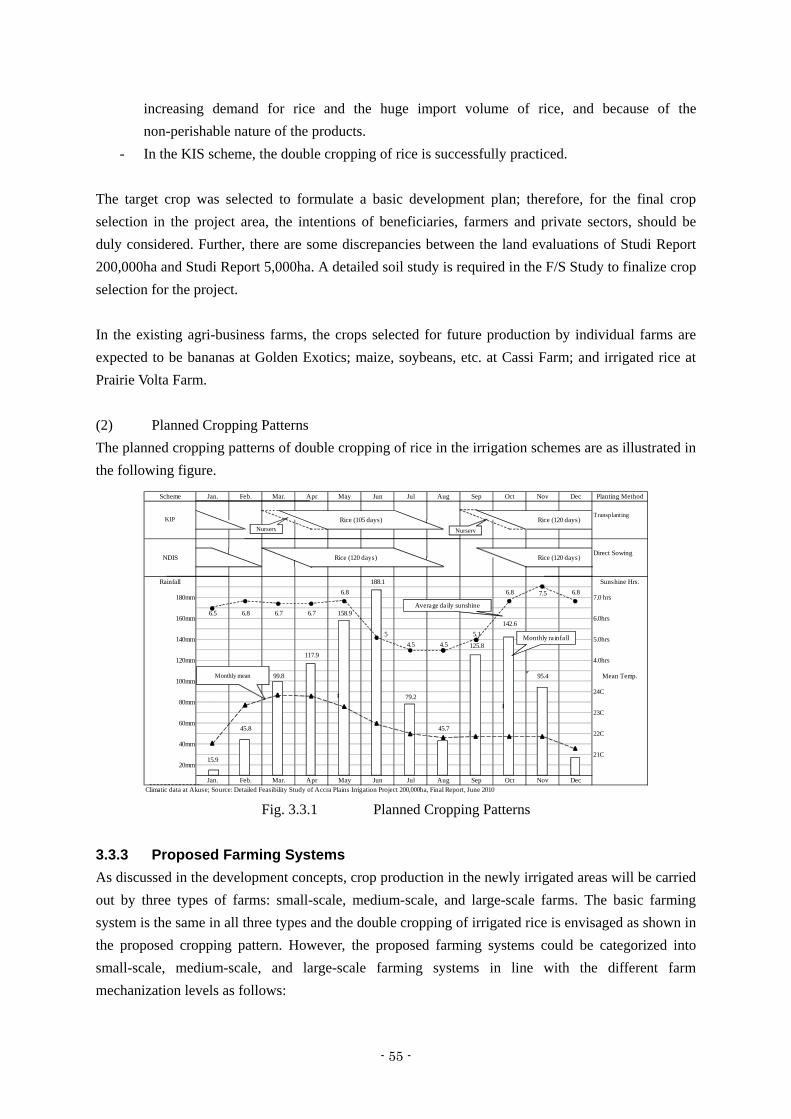
- 54 -
increasing demand for rice and the huge import volume of rice, and because of the non-perishable nature of the products.
- In the KIS scheme, the double cropping of rice is successfully practiced.
The target crop was selected to formulate a basic development plan; therefore, for the final crop selection in the project area, the intentions of beneficiaries, farmers and private sectors, should be duly considered. Further, there are some discrepancies between the land evaluations of Studi Report 200,000ha and Studi Report 5,000ha. A detailed soil study is required in the F/S Study to finalize crop selection for the project. In the existing agri-business farms, the crops selected for future production by individual farms are expected to be bananas at Golden Exotics; maize, soybeans, etc. at Cassi Farm; and irrigated rice at Prairie Volta Farm. (2) Planned Cropping Patterns The planned cropping patterns of double cropping of rice in the irrigation schemes are as illustrated in the following figure.
Fig. 3.3.1 Planned Cropping Patterns 3.3.3 Proposed Farming Systems As discussed in the development concepts, crop production in the newly irrigated areas will be carried out by three types of farms: small-scale, medium-scale, and large-scale farms. The basic farming system is the same in all three types and the double cropping of irrigated rice is envisaged as shown in the proposed cropping pattern. However, the proposed farming systems could be categorized into small-scale, medium-scale, and large-scale farming systems in line with the different farm mechanization levels as follows:
Scheme Planting Method
Transplanting
Direct Sowing
Rainfall Sunshine Hrs.
5
Mean Temp.
Climatic data at Akuse; Source: Detailed Feasibility Study of Accra Plains Irrigation Project 200,000ha, Final Report, June 2010
NDIS
Aug Sep Oct Nov DecJulJan. Feb. Mar. Apr May Jun
20mm
40mm
60mm
80mm
100mm
120mm
140mm
160mm
180mm
21C
22C
23C
24C
4.0hrs
5.0hrs
6.0hrs
7.0 hrs
Jan. Feb. Mar. Apr May Jun Jul Aug Sep Oct Nov Dec
15.9
45.8
99.8 95.4
188.1
79.2
125.8
142.6
6.8
4.5 4.55.1
6.8
158.96.5 6.8 6.7 6.7
117.9
Rice (105 days) Rice (120 days)KIP
7.5
Rice (120 days) Rice (120 days)
6.8
45.7
Monthly rainfall
Average daily sunshine
Monthly mean
Nursery Nursery
- 55 -

- 55 -
Producer/ Farming System/Mechanization Level Farm Size Operator Cropping Pattern Farming Practices
KIS (small-scale) IndividualDouble cropping of
rice in major & minor season
Transplanting/partially mechanized (land preparation) Small-scale Individual Direct sowing/partially mechanized (land preparation/ harvesting) Medium-scale Individual Direct sowing/moderately mechanized (land preparation
/harvesting/others) Large-scale agric-firm Direct sowing/highly to fully mechanized
In the KIS, it is assumed that the existing farming system and production practices will be continued in the case of adopting the project (transplanting/partial mechanization). 3.3.4 Crop Production Plan (1) Target Yields The target yields of irrigated rice under the project were estimated based on the current and/or target yield levels of the KIS, Ashaiman Irrigation Scheme, Prairie Volta Farm, and the potential yield estimated by MoFA. Such reference yield levels are as shown in the following table.
Table 3.3.5 Reference Yield Levels of Irrigated Rice Place/Source Source Yield Level
Ashaiman Irrigation Project (small-scale farm/transplanting)
Target yield of the Project 5.5 t/ha (major & minor season)
KIS (transplanted farms) Sample survey major season yield level 1 3.7–8.9 t/ha (avg. 4.7 t/ha) (small-scale farm) KIS yield survey
(appeared to be yield levels of advanced farmers) 5.8 t/ha
Prairie Volta Farm (large-scale) Maximum yield level in the 1st year after development 5.4 t/ha (direct sowing) Target yield of the Farm 5.0–6.0t/ha
MoFA 2 Potential yield 6.0 t/ha 1: Results of sample survey by the Study Team 2: Source: Agriculture in Ghana, Facts & Figures (2009), MoFA
The target crop yields at the full development stage are planned by irrigation schemes on the basis of the yield levels stated above as follows:
Table 3.3.6 Target Yields under the project Season
Scheme Crop Planting Method Major Minor Remarks KIS (small-scale farm) Irrigated rice Transplanting 5.5 t/ha 5.5 t/ha Paddy yield NDIS - Small-scale Farm Irrigated rice Direct sowing 5.0 t/ha 5.0 t/ha Paddy yield - Medium-scale Farm Irrigated rice Direct sowing 5.5 t/ha 5.5 t/ha Paddy yield - Large-scale Farm Irrigated rice Direct sowing 6.0 t/ha 6.0 t/ha Paddy yield Banana Estate* Bananas Annual: 40t/ha (current yield level) Cassi Farm* Maize/soybeans Not available Prairie Rice Farm* Irrigated rice Direct sowing 5.5 t/ha 5.5 t/ha Paddy yield
*: crop yields estimated by the farms
(2) Crop Production Plan The planned cropped areas by irrigation scheme (double cropping of irrigated rice) and the crop
- 56 -
Table 3.3.4 Proposed Farming System

- 57 -

- 57 -
5. The financial NPVs (Net Production Values) per ha by land use category and the same by irrigation scheme and irrigation block are estimated based on the crop budgets as shown in Annex D-6 and the incremental NPV in both the cases of adopting the project and of not adopting it are estimated as shown in Annex D-7 and summarized as follows:
Table 3.3.9 Incremental Financial NPV between W/P & W/O Unit: GHC ‘000
Scheme Under Project NPV 1/
W/o Project NPV Incremental NPV
KIS 24,579 14,044 10,535 NDIS 31,055 7,233 23,822 - No. 1 Area 12,208 1,545 10,663 - No. 2 Area 18,847 5,688 13,159
APGIP 55,634 21,277 34,357 1/: NPV at full development stage & onward
As shown, the incremental net production value under the project amounts to GHC 34.4 million at the full development stage (2022). The NPV attained in the project area under the project will reach about 2.6 times the amount of the present NPV in the Project area. The NPV, excluding NPVs of private firms in the Area, is expected to be 4.4 times the amount of the present NPV (GHC 38.6 million & 8.7 million, respectively). 3.4 Irrigation and Drainage Plan 3.4.1 Water Resources Development Plan From 2008 to 2010, a feasibility study on 5,000ha of the first priority area in the Accra Plains Irrigation Project by a pumping irrigation system has been conducted under the assistance of the Kuwait Fund. According to the study results, the project cost will be more than 20,000 US$/ha which is too high an investment cost for irrigation. The Accra Plains Gravity Irrigation Project is proposed, aiming to provide an alternative or countermeasure plan to the development of Accra plains by comparing with the above-mentioned pumping irrigation system. Accordingly, the water resource for the gravitational irrigation system has been proposed to use/intake water directly from the existing Kpong Dam Reservoir on the basis of an agreement from VRA. The advantages of using/intaking water from the reservoir are that an EL of 15.0 m—sufficient for gravitational irrigation to reach the first priority area—can be maintained by the pumping irrigation of APIP and that clear irrigation water with no suspended material can be obtained due to the large-scale de-silting basin in the Akosombo dam and Kpong dam. The clarity of the water will be more than 1 meter and there is no need for countermeasures to sedimentation. In accordance with the results of the first discussion with VRA and GIDA on October 1, 2010, on the intake of irrigation water for irrigation from the Kpong dam reservoir, the following 3 items have been agreed between both authorities. (1) The rate of intake of irrigation water directly from the right bank of the Kpong reservoir shall be
- 58 -

- 58 -
about 10 m3/sec for the new irrigation scheme. (2) The intake structure shall be designed carefully, to secure safety at the point where the intake
crosses the Kpong dam and to prevent water leaking, on the basis of approval from VRA. (3) The present intake capacity of 7.2 m3/sec shall be utilized to the maximum (at present water
intake is only 3.5 m3/sec). Based on the above-mentioned meeting, three alternative plans were considered, and the second meeting was held on March 1, 2011, at the VRA engineering office in Akuse. At the meeting, the two authorities discussed the following four matter and reached agreement regarding them.
(1) The level of new water intake for NDIS was set at EL.14.8m, which is the same level as the irrigation scheme in the left bank.
(2) In order to prevent dam-body cutting, the location of a new intake was selected at about 100 m outside of the dam body abutment on the right bank side.
(3) The maximum intake capacity was set at 11.3 m3/sec based on the irrigation acreage and water requirement analysis.
(4) As for the existing Kpong Irrigation Scheme, the rehabilitation of the main canal by lining it with concrete and the expansion of the area of paddy fields and the banana farm were agreed upon to reduce water loss and maintenance cost for effective utilization of the water. The proposed intake capacity for KIS is estimated to be 7.2 m3/sec, considering the expansion of paddy fields and the banana farm. As the result, the total intake capacity from the existing Kpong dam will become 18.5 m3/sec.
The VRA basically consented to these conditions and both authorities signed an agreement. The agreement is shown in Annex B. At the meeting, VRA requested GIDA to calculate the annual average water intake from the Kpong dam, as the average intake discharge will affect the opportunity cost of hydro-electric generation in the Kpong hydropower station. Also, VRA suggested that GIDA study daily water level fluctuation in the reservoir, as it affects water intake capacity from the dam. VRA provided daily water level data of the Kpong Reservoir from 1984 to 2010. The third meeting was held on April 4, 2011, at the VRA engineering office at Akuse. Half-month water requirements have been analyzed using Avayime daily rainfall data from 1990 to 2010. Careful study has been made to finalize irrigation acreage for KIS (4,100ha) and NDIS (6,900ha). Annual average intake capacity during that 21 year period for KIS and NDIS has been estimated. Based on the daily average intake discharge from the Kpong dam, the opportunity cost of hydro power generation has also been estimated.
- 59 -

- 59 -
Table 3.4.1 shows the peak intake capacity, the annual average intake capacity, and opportunity cost of hydropower generation of the Kpong Reservoir as the major water resources of APGIP.
Table 3.4.1 Water Intake Capacity from Kpong Dam
Irrigation Scheme
Net irrigation area (ha)
Peak discharge (m3/sec)
Annual Ave. intake volume (1000 m3)
Annual average discharge (m3/sec)
Reducing hydropower generation (MWH/year)
Opportunity cost (GHC × 1000/year)
KIS 4,100 7.151 79,739. 2.528 2,370 78.2NDIS 6,900 11.382 158,603. 5.029 4,714 155.6Total(APGIP) 11,000 18.533 238,342. 7.558 7,084 233.8
3.4.2 Potential of the Norboyita Dam Crossing the Norboyita River along the route of the main canal is the most difficult issue in the project, because the catchment area of the river is about 100 km2 and a tributary with a 110 km2 catchment area joins the Norboyita River. The flood pain of the river spreads about 2 to 3 km wide. The water surface elevation of the proposed main canal is estimated to be about 12 m starting from the Kpong dam intake (EL 14.8 m), and the canal is about 30 km, running on a slope of 1:15,000. In order to reach the main canal up to the first priority area and the Prairie Volta area, the canal slope should be kept as gentle as possible to save water losses caused by siphoning and the structure should be checked. Because the main canal length is estimated to be more than 60 km and the elevation difference between the intake site (EL 14.8 m) to the first priority area (EL 10.0 m) is estimated to be only about 4.8 m, the average slope of the canal is estimated to be 4.8/60,000 = 1/12,500. It is necessary to consider how to cross the river by comparing siphoning and aqueduct. In the case of siphoning, there is more water loss than aqueduct. In order to adopt the aqueduct method, it is necessary to provide a sufficient cross section area to be able to pass the flood peak discharge of the river under the main canal aqueduct. The flood peak discharge can be estimated by
Route of Proposed Main Irrigation Canal
Proposed Dam Crest Length is 4 km
Spillway
Fig. 3.4.1 Location Map of Norboyita Potential Dam Site
- 60 -

- 60 -
following the simplified equation from Figure 12-19: Flood Q10 (m3/sec)/Francou-Rodier, p. 246, F/S 5,000ha Q10 = 0.35 × A, where Q10 is the 10 year return period flood discharge (m3/sec) and A is the catchment area (km2). The catchment area at the crossing point of the river is 210 km2, and Q10 = 0.35 × 210 = 73.5 m3/sec. It is necessary to secure the safety of the proposed aqueduct with respect to flood discharge, and also to conduct river course training work to excavate a river channel to connect to the Volta River. The total length from the crossing point of the main canal to the Volta River is about 3 km. On the other hand, an alternative option would be to construct a flood protection dam upstream of the main canal crossing point in order to store flood peak discharge. In the 1/50,000 topographic map, the narrowest point for dam construction is only about 500 meter wide on the dam embankment at the elevation of 15.0 m. However, according to the latest obtained DTM topographic map surveyed in 2010, the narrowest point of EL.15.0 becomes very wide, 4 km, as shown in the above figure. The height of the dam is estimated to be about 12 m. Accordingly, dam construction is considered to be much more costly than the river training work, therefore the dam construction plan is not recommended. With regard to the siphon method, irrigation water from the Kpong Dam is very clear and the main canal is lined by concrete, so that no sediment load will be expected in the siphon area. In the case of an emergency, the siphon section is large enough, about 2 × 2 m with double sections, to be cleaned manually. The length of the siphon, 500 m, is sufficient to cross the river, and both sides of the approaches can be embanked with protection by riprap. Stone pitching can be used to protect that part of the siphon of the river section from flood damage.
3.4.3 Comparison of Three Development Plans Basically the gravitational irrigation system should be introduced with deep consideration given to the reduction of energy consumption for sustainable irrigation system operation and management. Hence, the canal should be lined to make maintenance work easier. Drainage improvement and keeping the outlet of the river course to the Volta River should be considered. It is necessary to provide farm roads for effective farming activities and secure market accessibility. The proposed irrigation scheme can be named “Accra Plains Gravity Irrigation Project” (APGIP). (1) New Intake Capacity and Alternative Study The following three options have been compared among the existing KIS with and without the improvement of the existing main canal and the new development area of NDIS. Case 1: New development area (NDIS) only, excluding existing KIP Case 2: New development area (NDIS) and improvement of KIS by concrete lining of the main
canal. Case 3: Combined plan of new development area (NDIS) and KIS, as one new main canal and
existing KIP intakes and canals are abundant. The proposed options are shown in the following Fig.3.4.2.
- 61 -
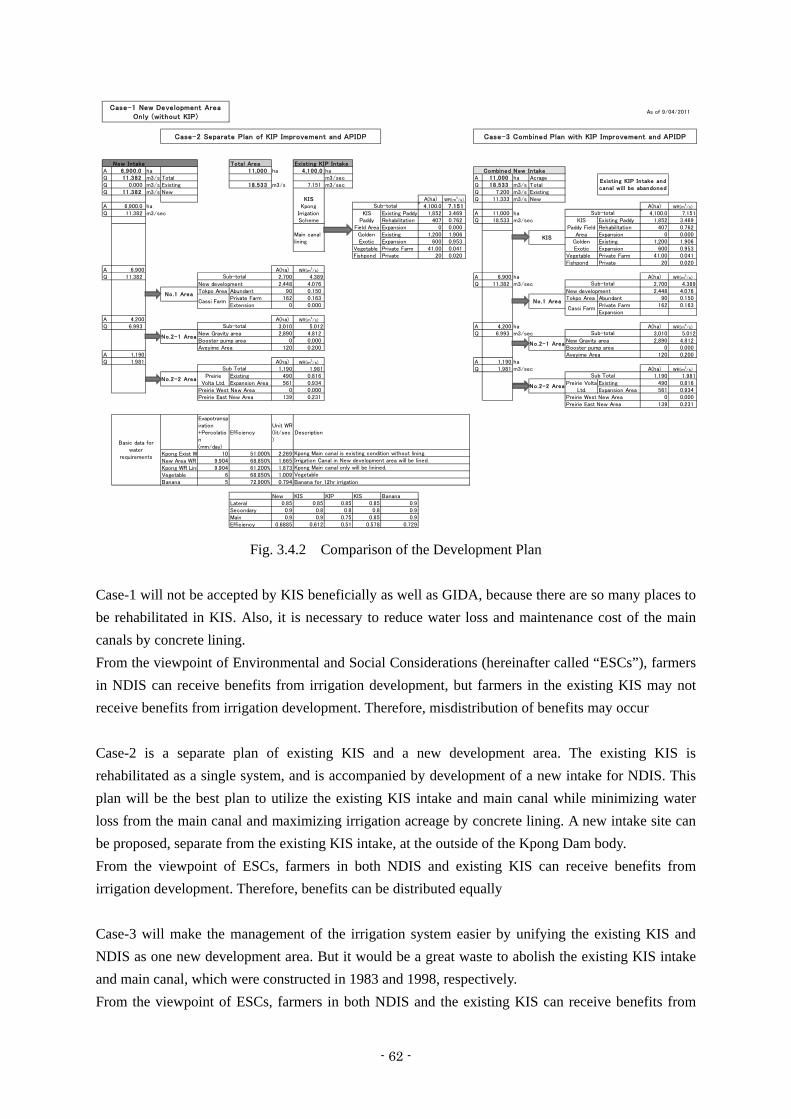
- 61 -
New Intake Total Area Existing KIP IntakeA 6,900.0 ha 11,000 ha 4 ,100.0 ha Combined New IntakeQ 11 .382 m3/s Total m3/sec A 11 ,000 ha AcrageQ 0.000 m3/s Existing 18.533 m3/s 7.151 m3/sec Q 18 .533 m3/s TotalQ 11 .382 m3/s New Q 7.200 m3/s Existing
KIS A(ha) WR(m3/s) Q 11.333 m3/s New
A 6,900.0 ha 4,100.0 7.151 A(ha) WR(m3/s)
Q 11.382 m3/sec Existing Paddy 1,852 3.469 A 11,000 ha 4,100.0 7.151Rehabilitation 407 0.762 Q 18.533 m3/sec Existing Paddy 1,852 3.469Expansion 0 0.000 Rehabilitation 407 0.762
Main canal Existing 1,200 1.906 Expansion 0 0.000lining Expansion 600 0.953 Existing 1,200 1.906
Vegetable Private Farm 41.00 0.041 Expansion 600 0.953Fishpond Private 20 0.020 Vegetable Private Farm 41.00 0.041
Fishpond Private 20 0.020A 6,900 A(ha) WR(m
3/s)
Q 11.382 2,700 4.389 A 6,900 ha A(ha) WR(m3/s)
New development 2,448 4.076 Q 11.382 m3/sec 2,700 4.389Tokpo Area Abundant 90 0.150 New development 2,448 4.076
Private Farm 162 0.163 Tokpo Area Abundant 90 0.150Extension 0 0.000 Private Farm 162 0.163
ExpansionA 4,200 A(ha) WR(m
3/s)
Q 6.993 3,010 5.012 A 4,200 ha A(ha) WR(m3/s)
New Gravity area 2,890 4.812 Q 6.993 m3/sec 3,010 5.012Booster pump area 0 0.000 New Gravity area 2,890 4.812Aveyime Area 120 0.200 Booster pump area 0 0.000
A 1,190 Aveyime Area 120 0.200Q 1.981 A(ha) WR(m
3/s) A 1,190 ha
1,190 1.981 Q 1.981 m3/sec A(ha) WR(m3/s)
Existing 490 0.816 1,190 1.981Expansion Area 561 0.934 Existing 490 0.816
Preirie West New Area 0 0.000 Expansion Area 561 0.934Preirie East New Area 139 0.231 Preirie West New Area 0 0.000
Preirie East New Area 139 0.231
Evapotranspiration+Percolation(mm/day)
EfficiencyUnit WR(lit/sec)
Description
Kpong Exist W 10 51.000% 2.269New Area WR 9.904 68.850% 1.665Kpong WR Lini 9.904 61.200% 1.873Vegetable 6 68.850% 1.009Banana 5 72.900% 0.794 Banana for 12hr irrigation
New KIS KIP KIS BananaLateral 0.85 0.85 0.85 0.85 0.9Secondary 0.9 0.8 0.8 0.8 0.9Main 0.9 0.9 0.75 0.85 0.9Efficiency 0.6885 0.612 0.51 0.578 0.729
No.1 Area
No.2-1 Area
No.2-2 Area
No.1 Area
KpongIrrigationScheme
No.2-1 Area
No.2-2 Area
KIS
Basic data forwater
requirements
Existing KIP Intake andcanal will be abandoned
Case-1 New Development AreaOnly (without KIP)
Case-2 Separate Plan of KIP Improvement and APIDP Case-3 Combined Plan with KIP Improvement and APIDP
Cassi FarmCassi Farm
Sub-total
KISPaddy
Field AreaGoldenExotic
Sub-total
Preirie VoltaLtd.
Sub Total
Kpong Main canal is existing condition without lining.Irrigation Canal in New development area will be lined.Kpong Main canal only will be linined.
PreirieVolta Ltd.
Vegetable
As of 9/04/2011
Sub-total
Sub-total
KISPaddy Field
AreaGoldenExotic
Sub-total
Sub-total
Sub Total
Fig. 3.4.2 Comparison of the Development Plan
Case-1 will not be accepted by KIS beneficially as well as GIDA, because there are so many places to be rehabilitated in KIS. Also, it is necessary to reduce water loss and maintenance cost of the main canals by concrete lining. From the viewpoint of Environmental and Social Considerations (hereinafter called “ESCs”), farmers in NDIS can receive benefits from irrigation development, but farmers in the existing KIS may not receive benefits from irrigation development. Therefore, misdistribution of benefits may occur Case-2 is a separate plan of existing KIS and a new development area. The existing KIS is rehabilitated as a single system, and is accompanied by development of a new intake for NDIS. This plan will be the best plan to utilize the existing KIS intake and main canal while minimizing water loss from the main canal and maximizing irrigation acreage by concrete lining. A new intake site can be proposed, separate from the existing KIS intake, at the outside of the Kpong Dam body. From the viewpoint of ESCs, farmers in both NDIS and existing KIS can receive benefits from irrigation development. Therefore, benefits can be distributed equally Case-3 will make the management of the irrigation system easier by unifying the existing KIS and NDIS as one new development area. But it would be a great waste to abolish the existing KIS intake and main canal, which were constructed in 1983 and 1998, respectively. From the viewpoint of ESCs, farmers in both NDIS and the existing KIS can receive benefits from
- 62 -

- 62 -
irrigation development. However, existing KIS facilities, such as water intake and the main canal, need to be abolished. In this case, construction waste will be generated. Thus, Case 3 has a greater negative impact than Case 2.
Case Advantages Disadvantages Case-1 Simple and easy OMM KIS left behind.Case-2 Activate KIS by rehabilitation
Save water by lining canal Save OM costs
Double irrigation canal system should be constructed. Cost will be high.
Case-3 One irrigation system with single canal system makes OMM easy. Construction costs will be reduced by construction of a single canal.
Existing KIS intake and main canals should be abolished. Existing KIS facilities were constructed 12 years ago, and facilities can still be used by rehabilitation.
In order to activate and effectively utilize the existing KIS, the main irrigation canal should be lined so as to reduce water loss as well as operation and maintenance costs. The benefits from the rehabilitation of KIS are expected to be sufficient enough to cover the investment cost of the rehabilitation work. Accordingly, Case 2 is the most recommended of the three cases and has been selected as the final format of the proposed irrigation system. However, this JICA study includes a pre-F/S stage and the proposed acreage and intake discharge might be subject to change during the full Feasibility Study stage, which will be performed within one or two years. With the adoption of gravitational irrigation, the route for the main irrigation canal has been studied as shown in Fig. C.1. The new intake from the Kpong dam needs to be constructed outside the dam body in the right bank area. The depth of reservoirs will be 2–3 m, so it will be possible to construct the intake structure through dry work by using sheet piles for temporary work. For the route of the main canal, the existing KIS main canal can not be utilized because the elevation of the water surface of the existing KIS main canal is 14.0 m, which is about 80 cm lower than the proposed new irrigation canal. The existing KIS irrigation canal is not lined with a trapezoidal section. In order to reduce canal seepage loss and the loss accompanying expansion of the irrigation area, the canal should be lined with concrete.
(2) Potential New Irrigation Areas Downstream of KIS, there is a wide wetland area with low elevation. It will be possible to introduce paddy cultivation by improving the drainage system of the Norboyita River. According to the former F/S report on the Accra Plains Project for 200,000ha, this area has been categorized as a Priority 2 area with high potential for irrigation. However, the elevation of the area is rather low, so the route for the main canal should be selected to pass through a high elevation area. Downstream, the route will arrive at APIP 1st Priority Area (5,000 ha), and further down stream at the Prairie Volta rice farm area. In order to effectively improve and enlarge the potential irrigation area within the wetlands in the Norboyita River, drainage system improvement will be required for connection to the Volta River. Accordingly, the Norboyita area, which is named “No. 1 NDIS Area,” can be included in the
- 63 -

- 63 -
beneficial area of APGIP. The area is relatively large, encompassing 2,000 to 3,000 ha. In order to elongate the gravitational irrigation area up to the Accra plains 1st priority area and the Prairie Volta rice farm area, a canal slope of 1:15,000 will be required. The distance of the 1st priority area from the Kpong dam is about 60 km. Based on the F/S of the 1st priority area for pump irrigation, the elevation of the Accra plains 1st priority area is about 20 m at the highest point and about 5 m at the lowest. It will be almost impossible to irrigate the whole area with a gravitational irrigation system, because the elevation of the intake point at Kpong dam is about 15m. The possible irrigation area, which is lower than 10 m, using gravity irrigation is estimated to be about 3,000 ha. From this, the targeted area for gravitational irrigation is 3,000 ha and the rest of 2,000 ha can be irrigated by using a terminal booster pump. Another option is to exclude areas higher than 10 m and instead include the privately owned rice farming area downstream. Pump irrigation requires a pump and related equipment, and the energy cost for operation, and therefore lifetime cost, is generally more expensive than gravity irrigation. In this study, therefore, a gravity irrigation system can be introduced in the whole irrigation area. The required average slope of the proposed main canal can be estimated as follows: (EL 15.0m – EL.10.0m)/60 km = 5m/60,000m = 1/12,000. Considering the head loss of siphoning across rivers, however, the average slope of the main canal will be estimated as about 1: 15,000 for the proposed new irrigation canal.
(3) Potential Net Irrigation Area The APGIP consists of two irrigation schemes, namely KIP and a new development area called “New Development Irrigation Scheme” (NDIS). The NDIS area consists of two areas: the No. 1 Area and the No. 2 Area. The No. 1 Area is made up of the Norboyita Block. The No. 2 Area encompasses the territory from down stream of KIS up to the Prairie Volta Farm, and can be divided into the No. 2-1 Area (Accra 1st priority area) and the No. 2-2 Area (Prairie Volta area), as shown in Fig. C.2. The whole area of APGIP with the layout of the proposed new main irrigation canal of 70 km is shown in Fig. C.2., and the water requirement of each case is shown in Table B.1. In order to secure maximum utilization of the existing KIS Intake capacity of 7.2 m3/sec, improvement of the main canal of the existing KIS through concrete lining, expansion of the Golden Exotic Banana Plantation area, and rehabilitation of 400 ha of paddy fields in KIS were proposed. If these proposed improvements are made, the KIS area will become 4,100 ha and the intake discharge will be 7.151 m3/sec. The newly developed part of the total area will be 6,900 ha and the capacity of new intake will be 11.382 m3/sec. The total area of the APGIP is 11,000 ha and total intake discharge will be 18.533 m3/sec, of which 7.151 m3/sec is the existing KIP Intake capacity. Based on photographs and DTM (Digital Terrain Map) with 1 m and 5 m contour lines provided by VRA for EPP analysis, present land use area and the routes of the main and secondary canals together with irrigation blocks have been studied. As a result, the total net irrigation area for APGIS will be 11,000ha, made up of the 4,100 ha of the Kpong Irrigation Scheme (KIS), and the 6.900 ha of NDIS
- 64 -

- 64 -
(No. 1 Area: 2,700 ha; No. 2 Area: 4,200 ha). 3.4.4 Improvement of Kpong Irrigation Scheme (KIS) In the KIS area, the existing irrigation area for paddies is 1,852 ha, with an extra 407 ha becoming available upon expansion through rehabilitation of the irrigation and drainage system. There is 41 ha of private vegetable farms obtaining irrigation water from the KIS and also 20 ha of fish ponds located in the KIS area, which get water from the KIS canal. According to the information from Golden Exotics, another 600 ha of banana farm will be developed in the KIS area in the future. Based on the information collection and inventory survey on KIS facilities, the lining of main irrigation canals was proposed. Improvement of drainage by the rehabilitation was also been proposed. Details on the length of the canal for drainage improvement and quantity of work are shown above in this chapter. 3.4.5 New Development Irrigation Scheme (NDIS) The new development irrigation scheme (NDIS) has been divided into the No. 1 Area and No. 2 Area, with the No. 2 Area consisting of the No. 2-1 Area in the mainly 1st priority area in the APIP study and the No. 2-2 Area mainly in the Prairie Volta area. In the No. 2-1 Area, Aveyime pump irrigation is under construction. Considering reduction of the cost for operation and maintenance, the area will be irrigated by this gravity irrigation scheme. The lower, flat area in the 1st priority area covering 2,890 ha will also be incorporated in the project area. In the No. 2-2 Area, the existing 490 ha of paddy fields in the Prairie Volta area are already irrigated by diesel pump operation getting water from the Volta River. The company is planning to expand their paddy fields by 561 ha in the future. The net irrigation area for each irrigation scheme is shown in the following Table.
Table 3.4.2 Irrigation Acreage of APGIP (ha) Crops
KIS (ha)
NDIS (ha) APGIP (ha) No. 1
Area No. 2 Area
Sub total
Paddy fields 2,300 2,538 4,200 6,737 9,038
Upland crops 0 162 0 162 162
Bananas 1,800 0 0 0 1,800
Total 4,100 2,700 4,200 6,900 11,000
3.4.6 Water Requirement Analysis (1) Analysis of Water Requirement for Irrigation
- 65 -

- 66 -

- 66 -
Table 3.4.5 Irrigation Acreage in Irrigation Schemes
Irrigation Scheme Paddy field
(ha)
Upland field
(ha)
Banana farm
(ha)
Total
(ha)
KIS 2,259 41 (20) 1,800 4,100
NDIS 6,738 163 0 6,900
Total (APGIP) 8,997 203 (20) 1,800 11,000
Note: A fish pond of 20 ha is included in the upland field. Banana farm irrigation is 12 hours.
2) Amount of Required Water for Irrigation Schemes In accordance with the above-mentioned factors, gross irrigation water requirement that is intake capacity from the Kpong Dam has been estimated for KIS, NDIS, and the total of them is shown in Table-B.2 and water intake pattern for selected years is shown in Fig. B.1. As mentioned above, banana farm irrigation runs for 12 hours per day, the volume of necessary water for bananas is estimated to be half of the water requirement. As for the existing condition of KIS, there is no intake data, only gate opening data. The existing irrigation acreage of KIS is estimated to be 3,093 ha, of which paddy fields cover 1,852 ha, banana farm 1,200 ha and private upland fields 41 ha. The ratio of the area is 3,093/4,100 = 0.754. Accordingly, the amount of current water intake will be 75.4% of the KIS’s planned water intake. However, the existing irrigation canal is not lined and the water intake after the concrete lining will be 1.2 times the volume of the existing water intake (61.2/51.0 = 1.2). Therefore, the amount of water intake after lining will be 95% of the planned water intake (0.754 × 1.2). Accordingly, the water intake is estimated to be 2.288 m3/sec (2.528 m3/sec × 0.905), and the increment of the water intake is 0.240 m3/sec (2.528–2.288).
The results are summarized as follows:
Table 3.4.6 Peak and Average Discharge of Irrigation Schemes Irrigation Scheme
Peak Discharge (m3/sec)
Annual Average Volume
(1000 m3)
Average Discharge (m3/sec)
Increment Discharge (m3/sec)
KIS 7.151 79,739. 2.528 0.240
NDIS 11.382 158,603. 5.029
Total 18.533 238,342. 7.558 0.240
Based on the proposed irrigation network, the maximum water intake capacity and water requirements, considering the irrigation efficiency for each cropping area and type, are shown in the following Fig. 3.4.3.
- 67 -

- 67 -
New Intake Total Area Existing KIS IntakeA 6,900 ha 11 ,000 ha 4,100 haQ 11.382 Total 7.200 m3/secQ 0.000 Existing 18.533 m3/s 7.151 m3/secQ 11.382 New 0.049
11.333 A(ha) WR(m3/s)
A 6,900 ha 4,100 7.151Q 11.382 m3/sec Existing Paddy 1,852 3.469
Rehabilitation 407 0.762Expansion 0 0.000Existing 1,200 1.906
Expansion 600 0.953
Vegetable Private Farm 41 0.041Fishpond Private (Pond) 20 0.020
A 6,900 ha A(ha) WR(m3/s) Paddy 2,259
Q 11.382 m3/s 2,700 4.389 Banana 1,800New development 2,448 4.076Tokpo Area Abundant 90 0.150
Private Farm 162 0.163Extension 0 0.000
A 4,200 ha A(ha) WR(m3/s)
Q 6.993 m3/s 3,010 5.012A(ha) WR(m
3/s) New Gravity area 2,890 4.812
4,200 6.993 Booster pump area 0 0.000New development 3,029 5.043 Aveyime Area 120 0.200Aveyime Potential 120 0.200
Existing 490 0.816 A(ha) WR(m3/s)
Extension 561 0.934 1,190 1.981Existing 490 0.816Expansion Area 561 0.934
Eastend New Area 139 0.231
Evapotranspiration+Percolation(mm/day)
EfficiencyUnit WR(lit/sec)
Description
Kpong Exist W 9.904 51.000% 2.248New Area WR 9.904 68.850% 1.665Kpong WR Lini 9.904 61.200% 1.873Vegetable 6 68.850% 1.009Banana 5 72.900% 0.794 Banana for 12hr irrigation should be twice of the UWR. 1.588
Canal NDIS KIS(Imprv) BananaLateral 0.85 0.85 0.9Secondary 0.9 0.8 0.9Main 0.9 0.9 0.9Efficiency 0.6885 0.612 0.729
0.850.8
0.750.510
No.2-2
Sub Total
No.2 AreaPreirie Volta
Farm
KIP(Exist)
Basic data forwater
requirementsKpong Main canal is existing condition without lining.Irrigation Canal in New development area will be lined.Kpong Main canal only will be linined.Vegetable
KIS
PreirieVolta
Golden
Exotic(Bana
na)
KIS
Irrigtation System Netwroks of APGIPKIS Improvement and New Development Irrigation Scheme (NDIS)
New Development Irrigation Scheme (NDIS) Kpong Irrigation Scheme (KIS)
Cassi Farm
Sub-totalNo.2-1
NDIS
NDIS
Sub-total
No.1 Area
Sub-total
Sub-total
KISPaddy
Field AreaMain canalconcrete
lining
Fig. 3.4.3 Irrigation System Networks of APGIP
3.4.7 Water Availability from Kpong Reservoir (1) Intake Canal Capacity of NDIS For the proposed main irrigation canal for NDIS, as shown in Fig. C.1, water depth to discharge has been calculated according to the Manning formula and the approximation equation is derived by the method of least squares, as shown in Table B.2. (2) Water Fluctuation of Kpong Reservoir The data of daily water level data from 1984 to 2010 was obtained from VRA. The half-monthly
- 68 -

- 68 -
average water level has been analysed based on the data of daily water level, because water requirement analysis is estimated on a half-monthly basis. The average monthly water level from 1984 to 2010 and annual maximum, minimum and average water level are shown in Fig B.2. Daily water level fluctuation curves are shown in Fig. B.3 for selected years in 1998, 2007 and 2008, together with the elevation of irrigation canals of KIS and NDIS. (3) Water Balance Analysis of Available Water and Water Requirement Based on the analysed half-monthly water level data, available water intake capacity was estimated adopting the approximation equation. Several severe years are selected to compare water availability from the Kpong dam and necessary water intake capacity, as shown in Table B.3. As a result, available water was sufficient to intake due to the low water level for about one month in April or May in 1998 and 2007. The frequency of the water deficit is estimated to be twice in the duration of 28 years, which corresponds to a 2/28 return period. Abnormal drought conditions are estimated to occur once every 14 years. In order to find daily water fluctuation and available water intake, daily analysis has also been made as shown in Table B.3. According to the analysis of daily water availability, most of the water levels of the Kpong dam are very high compared with the designed water level of the new irrigation canal, 14.8m. Therefore, careful operation of intake gates is required. It will be necessary to introduce an automatic water intake control system for both the new intake and KIS intake.
3.4.8 Hydro Power Generation Reducing In order to estimate the negative benefit of power generation capacity with respect to the opportunity cost of water caused by APGIP, average discharge on the basis of annual volume of intake was calculated. Based on the factors of plant efficiency and hydropower generation cost at the power plant obtained from VRA, the opportunity cost of irrigation water was estimated as an annual average condition. The estimated negative benefits of KIS and NDIS are summarised as follows:
Table 3.4.7 Reducing Hydropower generation caused by APGIP
Irrigation Scheme Average Power generation
loss (MWH)
Negative Benefit
(1000 GHC)
Negative Benefit
(1000 US$)
KIS improve 1,875 244 164
KIS increment 178 23 16
NDIS 3,730 485 326
Total (APGIP) 5,605 729 490
- 69 -

- 69 -
3.5 Environmental and Social Considerations 3.5.1 Environmental and Social Considerations in Ghana (1) The Ghana Environmental Assessment Regulations The Environmental Assessment Regulations, Legislative Instrument 1652, was promulgated in 1999 to give complete legal status to the Ghana Environmental Impact Assessment procedures. The Regulations require that all development activities likely to impact adversely on the environment must be subject to an environmental assessment. The objective of the legislative instrument is to ensure that such development activities are carried out in an environmentally sound and sustainable manner. It prohibits the commencement of an undertaking (including agriculture sector projects and investments) without both prior registration and an environmental permit. The requirements of the legislative instrument, however, place enormous responsibilities on all players in the development of Ghana. The nature of the responsibilities varies from stakeholder to stakeholder, such as policy makers, implementing or regulatory agencies, planning authorities, financial intermediaries, institutions providing training, or consultants providing services in EIA, depending on their statutory functions, areas of jurisdiction, and interests. The procedure of EIA is as follows: -A proponent who wants to obtain an environmental permit shall submit an application to the central
office of EPA in the case where the project is categorized into the undertakings in Schedule 2 in the Regulations or to the Region Office in the case of the undertakings in Schedule 1.
- EPA notifies the proponent of the result of screening within 25 working days after receiving the application. EPA issues a screening report stating whether the application, i) is approved, or ii) is rejected, or iii) requires a preliminary environmental assessment, or iv) requires an environmental impact assessment
- The proponent who is required to conduct a preliminary environmental assessment shall submit a preliminary environmental statement to EPA. An environmental impact assessment is required unless the EPA grants approval.
-The proponent who is required to conduct an environmental impact assessment shall carry out scoping and prepare terms of reference, then submit a scoping report to the EPA, including the terms of reference and the opinions expressed at the stakeholder meetings or public consultations, and notify relevant Governmental Offices and local people of such submission by press publicity to collect opinions on the terms of reference.
- The EPA shall open EIA to the public through the Region Office of the EPA and stakeholders’ opinions should be collected.
- The EPA shall hold a public hearing in cases where there appears to be great adverse public reaction, or that the project will involve resettlement of communities, or that the project could have extensive and far reaching effects.
- The EPA issues an environmental permit after reviewing and approving the EIA, and the proponent can implement the project after finishing registration of the project.
- 70 -

- 70 -
- The EIA procedure shall be finalized within 90 days from the date of receipt of the completed application form, not including the period for preparation of EIA and a public hearing.
- 71 -

- 71 -
EPA Proponent Stakeholder
Project
Submission of EA application (Registration Form)
Screening
Screening Report SEA
PEA Study
Review
Scoping (Terms of Reference)
Review
EIA Study
Draft EIA Report Open
Public Hearing
EIA Report Review
Project can be implemented
Notify stakeholder by press publicity, and collect options on TOR
Public Hearing
Public Hearing
・Adverse public reaction ・Resettlement ・Extensive negative impact
Schedule 2 EIA Required
EIA Required
Schedule 1 Nor Approved
Approved PEA Required
Draft PEA Report Submission
Approved
Scoping Report Submission
Approved
Draft EIA Report Submission
Environmental Permit
EIA: Environmental Impact AssessmentPEA: Preliminary Environmental Assessment SEA: Strategic Environment Assessment TOR: Terms of Reference
Figure 3.5.1 Procedure of EIA
- 72 -
- 72 -
(2) State Lands Act (Act 125) of 1963 Under the State Lands Act (Act 125) of 1963 any person who will suffer loss or damage to his or her property as a result of the project will receive compensation. This applies to owners of the lands that will be used as burrow and sand pits and other land uses for the project. The procedure to be followed during land acquisition and compensation payment for work camps, the pumping station, offices, reservoir sites, rural roads, canals, and drains are summarised as follows: - Identification of individual land owners and affected properties; - Liaison with each district assembly, environmental protection agency (EPA) and other
institutional stakeholders to facilitate negotiations with land owners; and - Compensation and acquisition of lands, including the preparation of documentation for the
acquired lands. (3) Environmentally Sensitive Areas (ESAs) The Ghana Environmental Assessment (EA) Regulations, LI 1652 of 1999 attempted to provide adequately for biodiversity and related sensitive resources consideration in EIA by classifying certain areas as environmentally sensitive. The application of Environmentally Sensitive Areas (ESAs) in Ghana’s EIA Procedures for over a decade has revealed some important shortcomings in the list and its utility value, especially in screening. The general observation is that in its attempt to provide comprehensively for biodiversity and related resources consideration in EA, the whole area of Ghana has virtually been classified as “environmentally sensitive.” This has not helped in the desire to achieve effective protection and conservation of biological and other sensitive resources in Ghana. (Source: Capacity Building in biodiversity for Impact Assessment, May 2006, International Association for Impact Assessment, EPA). The Environmental Protection Agency (EPA) conducted a study with financial support from the International Association for Impact Assessment (IAIA) to develop a modified, appropriate and better defined set of ESAs. The exercise led to the modification of the ESAs list and a reduction from 12 areas to 8 clearly-defined and precise ESAs, as follows: (a) All areas declared by law as Wildlife Conservation Areas (including National Parks, Resource
Reserves, Wildlife Reserves, Strict Nature Reserves, Ramsar Sites and Wildlife Sanctuaries), Forest Reserves, or Globally Significant Biodiversity Areas.
(b) Areas which constitute the natural habitat of any threatened (endangered, data deficient and
vulnerable), rare, or endemic flora and fauna. (c) All known historical, cultural, archaeological, and scientific sites that are of public interest. (d) All areas known to be prone to natural environmental disturbance, such as coastal erosion,
flooding, geological hazards (including earthquakes, tremors, and landslides), and radioactive emissions.
- 73 -

- 73 -
(e) Hilly areas with gradients greater than 45 degrees and prone to erosion, rock falls, mudslides, or
landslides. (f) Areas of land adjoining water bodies, a minimum distance of 50 m from the bank of the water
body. (g) Water bodies (surface or ground) characterized by one or more of the following conditions:
1) Tapped or abstracted for domestic purposes; 2) Water within a controlled and/or protected area; 3) Supports wildlife and fish; 4) Head waters.
(h) Mangrove area/forest characterized by one or more of the following conditions:
1) Adjoining mouth/estuary of a river/stream system; 2) Habitat for wildlife; 3) Spawning ground for fish; 4) Near or adjacent to traditional fishing ground; 5) Acting as a natural buffer against shore erosion, strong winds or for storm floods.
(4) Water Resources Commission Water Resources Commission (WRC) was established by a Parliamentary Act (Act 522 of 1996) as the overall body responsible for water resources management in Ghana. WRC is made up of 15 members, including the chairman, the executive secretary, a chief and two other persons, one of whom shall be a woman. The rest are representatives of ten (10) institutions, including GIDA, VRA and EPA. WRC regulates and manages the utilization of water resources in Ghana. All people utilize water resources based on the strategy for Integrated Water Resources Management (IWRM) for the sustainable utilization of the nation’s water resources. At present, VRA has utilized water resources from Volta River for hydro-electric power generation. As far as water utilization for NDIS (New Development Irrigation Scheme) is concerned, GIDA has already obtained basic consent from VRA. 3.5.2 JICA’s Guidelines for Environmental and Social Considerations (April 2010) Japan’s ODA Charter states that in formulating and implementing assistance policies, Japan will take steps to assure fairness. This will be achieved by giving consideration to the conditions of the socially vulnerable and to the gap between the rich and poor, as well as the gaps among various regions in developing countries. Furthermore, when implementing ODA, great attention will be paid to factors such as environmental and social impacts on developing countries. JICA, which is responsible for ODA, plays a key role in contributing to sustainable development in developing countries. The inclusion of environmental and social costs in development costs and the social and institutional framework that makes such inclusion possible are crucial for sustainable
- 74 -

- 74 -
development. Internalization and an institutional framework are requirements for measures regarding environmental and social considerations, and JICA is required to have suitable consideration for environmental and social impacts. Democratic decision-making is indispensable for environmental and social considerations. It is important to ensure stakeholder participation, information transparency, accountability, and efficiency, in addition to respect for human rights, in order to conduct an appropriate decision-making process. In this context, with respect to human rights and in view of the principles of democratic governance, the measures for environmental and social considerations are implemented by ensuring a wide range of meaningful stakeholder participation and transparency of decision-making, as well as by working for information disclosure and by ensuring efficiency. Governments bear the responsibility for accountability, but at the same time stakeholders are responsible for their comments. Owing to the issues discussed above, JICA always considers environmental and social impacts when implementing cooperation projects. Difference between “Ghana’s Environmental Assessment Regulations” and “JICA Environmental Guideline” is as follows. As far as matters to be addressed in the environmental statement are concerned, there are no items concerning resettlement, or ethnic minorities and indigenous peoples in “Ghana’s Environmental Assessment Regulations.” However, other items are included. In case resettlement is expected in the course of the project cycle, World Bank Safeguard Policy is said to be applied. 3.5.3 World Bank (Safeguard Policy) Safeguard policies play an important role in enhancing positive outcomes of development projects, or the benefit-side of the equation. Several policies require meaningful consultation with, and participation by, affected people during the design, preparation, and implementation of World Bank-financed projects—a requirement that has often been at issue in projects reviewed by the Inspection Panel. The appropriate implementation of the World Bank's safeguard policies plays a central role in ensuring the effectiveness, sustainability and positive development impact of its projects and programs. Social safeguard policies on involuntary resettlement and indigenous people aim to promote inclusion of the most vulnerable groups and protect involuntarily displaced persons and indigenous peoples. These two policies can be used as entry points to address social issues involved in investment lending operations, and to mitigate and compensate adverse impacts on indigenous peoples and persons displaced by development projects. The World Bank's Operational Policy 4.12: Involuntary Resettlement is triggered in situations involving involuntary taking of land and involuntary restrictions of access to legally designated parks
- 75 -

- 75 -
and protected areas. The policy aims to avoid involuntary resettlement to the extent feasible, or to minimize and mitigate its adverse social and economic impacts. It promotes participation of displaced people in resettlement planning and implementation, and its key economic objective is to assist displaced persons in their efforts to improve or at least restore their incomes and standards of living after displacement. The policy prescribes compensation and other resettlement measures to achieve its objectives and requires that borrowers prepare adequate resettlement planning instruments prior to World Bank appraisal of proposed projects. The World Bank Safeguard Policies concern the following: Environmental Assessment, Natural Habitats, Pest Management, Indigenous Peoples, Physical Cultural Resources, Involuntary Resettlement, Forests, Safety of Dams, Projects on International Waterways, Projects in Disputed Areas. (Source: http://web.worldbank.org). 3.6 Organization and Management Plan There are various alternative options for the organization and management structure of the project, in consideration of public and private partnership (PPP) as mentioned in Chapter 6. In this section, a possible organization and management structure is discussed as a sample in the case that a private scheme management company would be commissioned under the concession contract where major infrastructure are developed by the government. Even though this section figures out details of the structure, it will not limit alternatives of applicable PPP mechanisms, which shall be decided by the government of Ghana based on discussion among the stakeholders as well as the consideration of the development policy of the sector. The government of Ghana is currently preparing the National PPP Policy. The project is expected to be managed by GIDA because it requires technical skills and experience in irrigation development. The project shall be implemented following the guidelines shown in the National PPP Policy, under the technical and administrative support of MOFA and MOFEP. 3.6.1 Project Management Organization (1) Organizational Structure The project would be implemented and managed through GIDA with the chief executive of GIDA having overall responsibility. A Project Implementation Committee (PIC) would be formulated to establish the policy and supervise the overall implementation of the project. The PIC would be chaired by the chief executive of GIDA, and includes representatives of related ministries and stakeholders, i.e., Ministry of Food and Agriculture, Ministry of Financing and Economic Planning, local administrative organizations, Farmer’s Cooperatives, etc. The Accra Pain Gravity Irrigation Project (APGIP) comprises the rehabilitation of the Kpong
- 76 -

- 76 -
Irrigation Scheme (KIS) and the development of the New Developed Irrigation Scheme (NDIS), which are individual irrigation schemes. Even though both schemes have different situations, that is, one is the rehabilitation of an existing irrigation scheme where beneficiaries have already taken root, and the other is a new development of an irrigation scheme where beneficiaries are recruited and settled by the project, it is recommended to set up a unified PIC in consideration of the requirements of close connection in the implementation of both schemes, especially during the construction stage. It is also recommended to set sub-committees under the PIC for each project as well. Regarding the management structure of NDIS, there are two options: one is direct management by GIDA and the other is introducing a private sector entity to be the scheme management company, which shall be decided by GIDA based on careful discussion among stake holders. In this study, the management structure was examined under the condition of introducing the private sector. Under the PIC, the Project Management Units (PMUs) of each project would undertake the implementation and management of the projects. KIP would function as a PMU of the rehabilitation of KIS and manage the scheme as it is. As for NDIS, a new organization of PMU directly assigned by GIDA is to be formulated and given the responsibility for supervising implementation, coordination of land allocation, facilitation of formulating a Farmer’s Cooperative, and any other duties for preparing settling farmers and enterprises. After completion of initial stage work by GIDA-PMU, a private scheme management entity (Scheme Management Company: SMC) would be deployed under the concession of GIDA and take over the responsibilities for management of the irrigation scheme. GIDA-PMU would be absorbed into GIDA Headquarters and become the unit which takes responsibility for monitoring and controlling the project after taking over from the Scheme Management Company.
Administration Level
Implementation Level
KIS
KIP (PMU)
KIP (PMU)
During Implementation Stage
KIS NDIS
After Completion
GIDA
Project ImplementationCommittee (PIC)
GIDA-PMU for NDIS
GIDA
SMC
NDIS
GIDA-PMU for NDIS
Fig. 3.6.1 Organization Diagram of Administration and Implementation
(2) KIP The current KIP organization structure, which comprises units of project management, financial and administration, maintenance and field operation, is well designed and set up to provide necessary functions of irrigation scheme management. However, it is required to enhance the function and improve its performance to deal with the improved irrigation system after rehabilitation. Major issues to be improved include the following:
- 77 -

- 77 -
- Improvement of water management by KIP KIP is required to implement accurate and adequate water management based on water measurement and records of distributed water in the main and secondary canal system. When an irrigation area is used intensively and the system is in full use after rehabilitation, it is a concern that lower-reach beneficiaries may face difficulty in receiving water without appropriate water management in the system. Thus, KIP would secure a fixed number of water bailiffs and increase their capacity to ensure that the project’s infrastructure is operated and maintained effectively and efficiently.
- Increase of guidance and instruction to farmers regarding water management (enhancement of Lateral Group) In parallel with the improvement of water management by KIP, it is necessary to improve water use practice of farmers in the lateral canal. In order to ensure effective use of water, fair and appropriate water distribution, and good coordination between farmers, it is required to increase guidance and instruction to farmers, and to develop the capacity of block leaders and lateral leaders, who are leading farmers. For this purpose, KIP would concentrate on developing the capacity of water bailiffs and extension officers as well as secure a budget for increasing their day-to-day communication with farmers (including for motorbikes and fuel).
- Strengthening capacity of machinery Old and malfunctioning plants and equipment are to be renewed, and plants and equipment are to be increased, in order to maintain the function of the irrigation system through adequate and timely maintenance work by KIP. Excavators for creeks and drainage canals, plants and equipment for road maintenance, and machinery that local farmers can rent for lateral maintenance would be equipped at the KIP workshop.
- Reviewing Irrigation Service Charge The current price system of irrigation service charge is not set to cover the necessary cost of system operation and maintenance. The price system shall be set based on the necessary cost. It is strongly recommended to review and revise the price system as well as to transfer the concession fee of the banana farm into KIP’s internally-generated fund from GIDA’s revenue.
- Increase Recovery of Irrigation Service Charge Even though it is clear that both KIP and farmers shall be delegated responsibility to low recovery of ISC, it is required for KIP to take the first step in order to solve this effectively. KIP would assure sufficient water delivery on time (show its ability), show the use of collected ISC clearly, and assure allocation of a part of ISC for maintenance for lateral canals.7 The allocation of ISC to lateral maintenance is to be delivered by providing machinery service instead of cash. Making a point on transparency would contribute to farmers’ becoming aware of what they are paying for directly. This would also help farmers to gain a better understanding of the financial requirements of the project.
7 According to the regulation of KIP, the collected ISC is to be allocated 10% for GIDA administration, 80% for the project, which will be used for maintaining infrastructures, and 10% for maintaining lateral by farmers.
- 78 -

- 78 -
In consideration of farm economy, it might be difficult to quickly change the situation in which the KIP staff is burdened by GIDA budget allocation. However, it is to be considered that part of the human expense is to be allocated to a large-scale commercial banana farm according to the water use amount. It is clear that the irrigation system is required to be operated and maintained by the budget recovered by ISC, including human expense for management, in order to ensure sustainable operation. Thus, it is recommended to increase ISC to cover all costs gradually in future. (3) GIDA-PMU for NDIS (a) Roles and Responsibilities during Implementation Stage GIDA-PMU for NDIS would be a representative of GIDA during the implementing period of the project. The major roles and responsibilities are: - To recruiting and allocate land to small-scale and medium-scale farmers as well as large-scale
farms in a fair and equitable manner, in cooperation with the Land Allocation Committee, - To facilitate farmers formulating Farmers’ Cooperatives and a sub-structure for water
management (Secondary Block and Lateral Group), - To invite a large-scale farm entity in place and adjust business contents - To conclude a Land Allocation Agreement with small-scale and medium-scale farmers, and a
concession contract with large-scale farms, - To manage long-term land lease contracts with land owners, - To balance the conflicting interests of stake holders by leading the Stake Holders Committee - To control and supervise construction work In order to fulfil the roles above, GIDA-PMU would comprise its organization by project management, financial and legal administration, engineering, and agriculture. Under the major units, contract management, agriculture and commercial, extension and Farmer’s Cooperative, design and construction supervising, etc. would be deployed. (b) Roles and Responsibilities after Take-over After transferring responsibilities to the Scheme Management Company (SMC), GIDA-PMU would be absorbed and function as a unit responsible for project management within GIDA Headquarters. The major responsibilities are: - To manage concession contracts with SMC - To monitor and evaluate project management of SMC - To manage long-term land lease contracts with land owners and to control payment of land rent
fees from SMC - To make policy decisions for the project management under the Project Implementation
Committee, and to balance the conflicting interests of stake holders through leading the Stake Holders Committee
- 79 -

- 79 -
After transferring, GIDA-PMU would scale down the organization and concentrate contract management and monitoring. In order to fulfil the above roles, GIDA-PMU would deploy project management, financial and legal administration, monitoring unit (engineering and agriculture). (4) Scheme Management Company (a) Roles and Responsibilities In this study, it is assumed that the private business entity entrusted to operate and maintain the irrigation scheme, which is called the Scheme Management Company (SMC), is hired by GIDA. SMC would operate and maintain the irrigation scheme effectively and efficiently so that farmers and farm enterprises in the project area would receive full benefits, under the concession contracts with GIDA. SMC would operate and maintain the scheme sustainably by self financing based on ISC collection. SMC would provide paid services of agricultural support to small and medium-scale farmers as well. Leading farmers to become market oriented in the project area is also expected. The roles and responsibilities of SMC are: - Coordinating irrigation and a water distribution schedule among the secondary block level as
well as operating water distribution of the main and secondary canals8 - Maintaining the main and secondary canals,9 and the drainage system, as well as maintaining
plant and equipment for maintenance - ISC setting and collection - Monitoring and evaluation of operation and maintenance of the lateral block level by farmers,
enhancing the maintenance activity of the Lateral Group, and providing mechanical service for lateral maintenance
- Technical extension and monitoring, and evaluation of farming activity of small-scale and medium-scale farmers
- Providing agricultural machinery service to small and medium-scale farmers - Providing post harvesting service to small-scale farmers - Marketing - Arranging contracts with seed farmers and providing rice seed to small and medium-scale
farmers - Facilitating small farmers to access farming credit, such as ADB credit - Facilitating to formulate and enhance Farmer’s Cooperatives - Reporting to GIDA-PMU (b) Expected Organization of Scheme Management Company The Scheme Management Company (SMC) shall propose how it will be an optimum organization to fulfil the roles and responsibilities above in the field. Some expectations of the organization are discussed here.
8 In case of the large-scale farm block, SMC will take responsibility to deliver water up to the boundary of the block. 9 In case of the large-scale farm block, SMC will take responsibility to maintain the canal up to the boundary of the block.
- 80 -

- 80 -
In consideration with its role and responsibility, SMC would have four piers in its organization, i.e., project management, financial and administration, engineering management, and agriculture and commercial management. Project management: Responsible for overall coordination of the project activities under the cooperation of chiefs of core sections. A monitoring and evaluation unit would be set under the project management, which would be responsible for monitoring the performance of the project as well as the operation of a management information system. A Stake Holders Committee, composed of project management, representatives of Farmers Cooperatives, representatives of farming enterprises, the District Office of the Agricultural Extension Services, and other stakeholders, would be set up in order to balance the conflicting interests of the stake holders and give advice for project management. Financial and administration management: Responsible for preparation of the detailed budgets, supervising expenditure, and preparing and submitting regular financial reports to the project management, as well as for overall issues of human resources and office services. The contract for irrigation service and collection of ISC are also covered by the financial and administration management. Engineering management: Responsible for the efficient and effective delivery of water through the main and secondary canal as well as coordination and adjustment of a water distribution schedule based on the irrigation schedule of farmers/farms. Regular Stake Holders Meetings shall be held under the management for coordinating the water distribution schedule and the maintenance plan among stakeholders. Another important responsibility is the overall maintenance function of irrigation and drainage facilities and other infrastructures, as well as the maintenance of plants and equipment. Water bailiffs are to monitor farmers’ activities for OM in the lateral block, and to provide instruction thereon, as well as to operate the main and second canal systems. Agriculture and commercial management: Responsible for extension service, machinery service, post harvest and marketing, and facilitation of credit. Under the extension service, input materials and seed supply would be covered as well as facilitating the activities of farmers’ cooperatives. Post harvest and marketing would have a close relationship with large-scale farms and enterprises in the project area, and would arrange services to cover small and medium-scale farmers.
- 81 -

- 81 -
Fig. 3.6.2 Sample Organization Chart of the Scheme Management Company
- 82 -
- 82 -
(c) Irrigation Service Charge and Financial Support to SMC Farmers and farming enterprises would conclude contracts for service provided by SMC, including irrigation water service. SMC would decide the price of ISC based on its business plan under the approval of GIDA-PMU. ISC shall be set to cover all costs for operation and maintenance, including management fees of SMC. ISC also includes development fees for recovering the development cost of the irrigation and drainage system, which shall be charged fully or partly according to type of beneficiary. It is essential to make clear the detailed breakdown and background of pricing in order to increase farmers awareness and understanding of ISC. ISC would be collected based on the secondary block, the representative of farmers or farm enterprises would collect ISC from block members and pay SMC. SMC shall have the authority to stop water delivery when the users do not pay for ISC. SMC manages its business by self financing, in principle, based on the ISC collection. However, it is also to be noted that it is difficult to maintain the business during the start-up period of the project because a delay in receiving ISC income or low recovery is expected at that time. Thus, it is necessary to consider that the government would give financial support to SMC at the beginning of the project, which would last up to three years. The possible support to SMC is providing a soft loan for operating capital. 3.6.2 Farmers and Users Participation (1) Role of Farmers and Users in Management of the Irrigation System The principal of demarcation of roles between project and farmers/enterprises (users) is as follows. In the case of the small or medium-farm block, the project is responsible for OM of the main and secondary canal and drainage, as well as infrastructures such as the access road, and the farmers take responsibility for the operation and maintenance of canals and drainage at the lateral level. In case of the large-scale farm block, the project is responsible for OM of the main and secondary canal up to the boundary of the block and drainage, and enterprises (farms) take responsibility for OM in the block The details of roles in the management of irrigation system vary between small and medium-scale farms and large-scale farms (enterprises). (a) Role of small-scale farmers and medium-scale farmers - To coordinate the irrigation schedule among farmers at the lateral and branch/secondary level.
Participate in coordination meetings at the scheme level (PMU Meeting for KIS and Stake Holders Meeting for NDIS).
- To operate the irrigation system and carry out water distribution at the lateral level - To implement maintenance work at the lateral level - To balance the conflicting interests of stake holders at the lateral and branch/secondary level in
- 83 -

- 83 -
cooperation with water bailiffs. Reporting to the Stake Holder Committee, if necessary. - To monitor water use and maintenance work at the lateral and branch/secondary level, and report
to the project through water bailiffs - To monitor the farming activity in the lateral and branch/secondary level, and report to the
project through the extension officers (b) Role of large-scale farms (enterprises) - To coordinate the irrigation schedule among farms in the secondary block. Participate in
coordination meetings at the scheme level (Stake Holders Meeting for NDIS). - To operate the irrigation system and carry out water distribution in the secondary block - To implement maintenance work in the secondary block - To balance the conflicting interests of stake holders in the secondary block in cooperation with
water bailiffs. Reporting to the Stake Holder Committee, if necessary. - To monitor the water use and maintenance work in the secondary block and report to the project
through water bailiffs - To report the farming activity in the secondary block to the project through extension officers (2) Farmers Cooperative and WUA (a) KIS The Osudoku Agricultural Cooperative Society Limited (Osudoku Cooperative) has been formulated to cover all small holders in KIS. The Cooperative has a function of WUA as well as to act as a Farmer Based Organization (FBO) in the project area. Osudoku Cooperative would enhance its activity, both in the WUA function and FBO function, to cope with the increasing responsibility accompanying full use of the irrigation system after rehabilitation. Regarding the WUA function, it is required to enhance the Lateral Group as well as the Branch/Block Group to manage minute water distribution and maintenance work. (b) NDIS According to the GIDA Regulation (L.I.), a Farmers Cooperative would be established by all farmers of NDIS, which would be based on the Cooperative Society Degree, 1968. Large-scale farms (enterprises) would not be included in the Farmers Cooperative from the viewpoint of the concept of a cooperative. The Secondary Block is considered as an individual hydraulic block from the aspect of water management. In NDIS, farmers’ and users’ participation in the irrigation scheme would be fulfilled by two lines according to the type of Secondary Block. In a case where the Secondary Block is developed by the public sector, farmers within it would formulate a Secondary Group as a key sub-structure of the Farmers Cooperative. The group would function as a WUA and take responsibility for the distribution schedule within the Secondary Block, and the operation and maintenance of the irrigation system at the lateral level. Under the leading of the Secondary Block Leader, Lateral Groups would carry out operation and maintenance activity in the field. The Lateral
- 84 -

- 84 -
Leader would organize communal work among the lateral members for maintenance work as well as arrangement of renting machinery if necessary. Coordination among Lateral Groups is the responsibility of the Secondary Block Leader. ISC would be collected by the person in charge of the Secondary Group and paid to SMC. In a case where the Secondary Block is developed by the private sector, large-scale farms would be key for the management of the irrigation system within the block. Large-scale farms and small-scale farms would formulate the WUA in the Secondary Block. The WUA would take responsibility for coordinating the distribution schedule, and for operating and maintaining the system. Small-scale farmers would formulate the Lateral Group, and carry out operation and maintenance at the lateral level.
Farmers Cooperative of NDIC
WUA of Secondary
Block
Secondary Group of
Cooperative
Secondary Group of
Cooperative
WUA of Secondary
Block
Large scale farm
Lateral Group
Small scale
farmers
Large scale farm
Lateral Group
Small scale
farmers
Lateral Group
Small & medium
scale farmers
Lateral Group
Small & medium
scale farmers
Lateral Group
Small & medium
scale farmers
Lateral Group
Small & medium
scale farmers
Private Developmen t Block
Public Development Block
PublicDevelopment Block
Private Development Block
Fig. 3.6.3 Organization Diagram of Water Management in Farmers/Farms Level The existing Farmers Cooperatives in the project area of NDIS, i.e., Aveyime Irrigation Farmers Cooperative and Marketing Society Ltd, and Tokpo-Noyami Farmers Association, which has been established for a certain irrigation scheme, are to be absorbed into the Farmers Cooperatives of NDIS and expected to function as a Secondary Group.
- 85 -


Chapter 4
Facilities Plan

- 82 -
Chapter 4 Facilities Plan 4.1 Facilities Plan of NDIP 4.1.1 Intake Facility at Kpong Dam The intake facility is installed at the right bank of the Kpong dam, in consideration of the dam location and alignment of the Akuse main canal of KIS. The location and plan of the intake facility are shown in Fig. C.1 in Annex C. The following are prominent features of the intake:
Table 4.1.1 Intake Facility Items Descriptions 1. Intake gates 2.0m × 2.0m × 3 sluice gates by electric operation
Design intake capacity: 11.3 m3/sec Canal bed elevation: 12.80m Design water level: 14.80m Water depth: 2.00 m (Variable due to the daily fluctuation in the reservoir water level of the Kpong dam
2. Head race channel W7.8m x H2.3m (Concrete lining) 3. Road culvert (Dam axis) W4.0m × H2.5m × L18m
4.1.2 Irrigation System Irrigation water is supplied to the farmland by gravity. As shown in Fig. C.2, irrigation blocks are broadly divided into two, i.e., NDIS No. 1 area and No. 2 area, bounded by Sege-Aveyime road. Appropriate diversion points are selected to supply irrigation water to each farm block or the most upstream of a series of farm blocks. The locations of the irrigation blocks and each command area are shown in Fig. C.3, C.4. 4.1.3 Drainage System As hilly terrain continuously lies along the right side bank of the Volta River, swamp areas as well as swampy ponds have been developed upstream of the hilly area for about 50km from Akuse to the Prairie farm. A very gentle slope along the hilly area has been accelerating deposition of sediment flowing out from the upstream drainage area. Therefore, arable areas lower than EL 4 to 5 m are in poor drainage condition, thus water logging hinders agricultural farming, including rice cultivation. Outflow points to the Volta River are shown in Fig. C. 5. It is proposed to widen the outflow points to the Volta River to increase flow capacity of the natural streams. In addition, widening of the drainage canal/stream is also an effective method to mitigate the inundation condition in the proposed farm area. A large drainage area is located upstream of the Norboyita area and Aveyime. The drainage capacity has been estimated on the basis of flood discharge analysis, as mentioned in Paragraph 3.4.2. The flood peak discharge can be estimated by following a simplified equation taken from Figure 12-19: Flood Q10 (m3/sec)/Francou-Rodier, p. 246, APIP F/S 5,000 ha: Q10 = 0.35 × A : where Q10 is the 10 year return period flood discharge (m3/sec) and A is the catchment area (km2). The flood discharge of small rivers crossing the proposed main irrigation canal has also been estimated with the same equation.
- 86 -

- 83 -
4.1.4 Irrigation Canal The main and secondary canals are constructed with a canal slope of 1:15,000 for the open canal. The average canal slope is about 1:10,000 because slightly large friction loss is considered in the siphon culverts and check gate sections. The hydraulic profile is shown in Fig. C.6 (1). Canal alignment is basically along the contour line to minimize earth moving volume. Sections of the main and secondary canals are indicated in Fig. C.7. The Main canal is planned in parallel with the existing Akuse main canal and the South Lower Level Canal of KIS (0–17 km: pump station to High Level Canal). At the crossing points with drainage channels, the siphon structure is proposed to structurally conform to the existing KIS canal. A longer siphon of about 500 m is proposed at the crossing section of two drainage channels at the Norboyita area (30 km) to secure a wider flow section of these drainage channels. The siphon culvert is 2.5 m wide and 2.5 m high with double culverts to minimize friction loss (in this case, velocity is about 1.1 m/sec and friction loss is 0.25 m). Drainage culverts are proposed at drainage crossing sections downstream of the 30 km siphon because relatively small drainage flow is expected. The structure of the siphon is shown in Fig. C.8. Instead of a siphon, an aqueduct may be constructed in wider swampy areas. (See Fig. C.9 (4) for reference) Secondary canals are located along the contour line to minimize earth volume. Secondary canals are extended to farm areas of 20 to 30 ha in principle. Lateral canals convey irrigation water to farm areas of 10 ha. Surfaces of the main and secondary canals, with a flow capacity of more than 0.1 m3/sec, are lined with concrete 0.1m or 0.07 m thick. Lateral and on-farm canals are earth canals. Table 4.1.2 shows the features of the canals.
Table 4.1.2 Prominent Features of the Project (NDIS) Items Description Lining Length / sites 1. Main irrigation canal Concrete lining 69.1 km
1.1 Section 1 (11.3 m3/sec) No.0 – No. 27+200 (t=0.1m ) 27.2 km 1.2 Section 2 (10.5 m3/sec) No.27+200 – No. 37+600 (t=0.1m ) 10.4 km 1.3 Section 3 (9.0 m3/sec) No.37+600 – No. 39+200 (t=0.1m ) 1.6 km 1.4 Section 4 (7.5 m3/sec) No.39+200 – No. 45+400 (t=0.1m ) 6.2 km 1.5 Section 5 (6.0 m3/sec) No.45+400 – No. 55+800 (t=0.1m ) 10.4 km 1.6 Section 6 (4.0 m3/sec) No.55+800 – No. 58+600 (t=0.1m ) 2.8 km 1.7 Section 7 (2.5 m3/sec) No.58+600 – No. 62+400 (t=0.07m) 3.8 km 1.8 Section 8 (1.5 m3/sec) No.62+400 – No. 67+300 (t=0.07m) 4.9 km 1.9 Section 9 (0.5 m3/sec)* No.67+300 – No. 69+100 (t=0.07m) 1.8 km
2. Secondary irrigation canal Concrete lining (t=0.07m) (t=0.07m) 115.5 km 2.1 Section 1 (1.0 m3/sec) Concrete lining (t=0.07m) 11.8 km 2.2 Section 2 (0.8 m3/sec) Concrete lining (t=0.07m) 4.0 km 2.3 Section 3 (0.6 m3/sec) Concrete lining (t=0.07m) 1.0 km 2.4 Section 4 (0.5 m3/sec) Concrete lining (t=0.07m) 4.6 km 2.5 Section 5 (0.4 m3/sec) Concrete lining (t=0.07m) 37.6 km 2.6 Section 6 (0.2 m3/sec) Concrete lining (t=0.07m) 52.1 km 2.7 Section 6 (0.1 m3/sec) Concrete lining (t=0.07m) 4.4 km
Note: *Main canal Section 9 is classified in "Main canal" in the report.
- 87 -

- 84 -
In addition to the secondary canal listed above, pipeline canals with their total length of 9.95 km shall be installed to supply irrigation water to the farm blocks located far from the main canal. The location of the pipeline canals are shown in Fig. C.11, Annex C. Since the water head between the main canal and the irrigation area is small, i.e., about 3.0 m, relatively large diameters of the conduits, 800 mm to 900 mm is required. 4.1.5 Flow Control Facilities Water control facilities such as spillways and emergency outlets are installed immediately upstream of the siphons and check gates. The typical structure of the spillways and emergency outlets are shown in Fig. C.10, in Annex C. Check gates are installed at intervals of about 3 km in the main canal and 2 km in the secondary canal in NDIS. The water level is controlled by gate opening. Spillway and emergency outlet channels are installed immediately upstream of the gates and siphons from the viewpoint of safety. Regarding bridges for local residences, in addition to those for cattle, five canal bridge culverts parallel to the KIS canal and 16 culverts in NDIS are installed for this purpose. The intervals between these culvert bridges are about 3 km in both schemes. The bridge culverts are located in the inter section with existing roads, in principle. Flow control facilities and other appurtenant structures are listed below. (NDIS) Transverse structures
1. Drainage culvert : 28 sites (W 2.0 m × H 2.0 m × 1) 2. -Do- : 4 sites (W 2.0 m × H 2.0 m × 2) 3. Road culvert (Intake site) : 1 sites (W 4.0 m × H 2.5 m × 2) 4. -Do- (Main canal) : 5 sites (W 4.0 m × H 2.5 m ×2) including KIS 5. -Do- (Main canal) : 9 sites (W 3.0 m × H 2.5 m × 2) including KIS 6. -Do- (Main canal) : 6 sites (W 2.0 m × H 2.0 m × 2) 7. -Do- (Main canal) : 10 sites (W 2.0 m × H 1.5 m × 1) 8. -Do- (Secondary canal) : 33 sites (W 2.5 m × H 1.5 m × 1) 9. -Do- (Secondary canal) : 203 sites (W 2.0 m × H 1.0 m × 1)
Check gate 1. Main canal : 14 sites (W 2.0 m ×H 2.0m × 2 or 1) 2. Secondary canal : 237 sites (W 1.0 − 1.2 m × H 1.0 m × 1)
Division gate 1. Main, secondary canal : 215 sites (W 0.5 m × H 0.5 m × 1)
Spillway, outlet : 10 sites 4.1.6 Drainage Canal A large drainage area is located upstream of the Norboyita and Aveyime areas. Drainage improvement downstream of the Norboyita area is not encouraged from the viewpoints of conservation of the natural conditions of the swampy area. Heavy sediment flow from the drainage area of more than 200 km2 is also one of the reasons not to recommend the drainage improvement work in the area. Higher flow velocity by the drainage improvement work accelerates erosion of the riverbed materials, eventually a huge amount of dredging work to secure drainage flow capacity would cause financial difficulties. The drainage improvement work is implemented at several sites in the command area and outlets to the Volta River. River-widening work is shown in Table 4.1.3, and in Fig. C.12, in Annex C.
- 88 -

- 85 -
Table 4.1.3 Drainage Improvement Work (NDIS)
Area in NDIP Location Descriptions
Flood discharge (m3/sec)
Length (km)
1. No. 1 area Irrigation blocks 8–11
Drainage canal is installed in the farm area to fix drainage channel
10 10
No. 1 area outlet drainage
Existing drainage channel is widened to increase flow capacity.
5 15
2. No. 2 area Lac Aklamador outlet Existing drainage channel is widened to increase flow capacity.
15 15 Lac Aklamador outlet 1 10 10 Lac Aklamador outlet 2 5 5
4.1.7 Road Networks The project provides additional road net works along the main and secondary irrigation canal as a farm to market road. In addition, farm roads are also constructed basically along 10 ha paddy fields for transportation of the agricultural input as well as agricultural machinery and equipment. These roads are available to transport the OM machinery. 4.1.8 Rural Development Facilities Rural infrastructures, such as roads, the electric grid, and water supply systems, have been well equipped in the NDIP area, especially along the regional roads along the Volta River. It is, however, necessary to conduct further study when a large settlement is expected and when population growth is beyond the development plan of the related three District Governments. 4.2 Facilities Plan of KIS 4.2.1 Intake Facility from Kpong Dam The intake facility is located at the right bank of the Kpong dam. The Location is shown in Fig. C. 13 in Annex C. The following are prominent features of the intake facility:
Table 4.2.1 Intake Facility Items Descriptions 1. Intake gates W 2.2 m × H 1.52 m × 1 sluice gates by manual operation
Design intake capacity: 7.2 m3/sec 2. Head race channel W 1.25 m × H 1.25 m (Concrete culvert)
Canal bed elevation: 12.00 m 3. Spillway W 4.0 m , crest elevation of 14.00 m
Since the intake facility has sufficient capacity, there is no need to rehabilitate the intake. Maximum intake capacity is estimated to be about 7.2 m3/sec when the water level is at the average operational elevation of about 15.0 m. Stop-log gates are also equipped at the intake site, thus maintenance of the gate is carried out well by VRA. 4.2.2 Irrigation System The irrigation system of KIS consists of gravity and pump lifting systems. The main features of KIS
- 89 -

- 86 -
are the irrigation canal construction in low and high level areas in Akuse and Asutsuare. The high level area has been cultivated for a banana plantation under Golden Exotic Ltd. for the last three years. Fig. C. 13 indicates the whole system layout of KIS. Irrigation canals of a total length of 43.4 km are as follows:
Table 4.2.2 Canal System of KIS Irrigation canal Discharge Length (km) Canal protection
1. Akuse main canal 4.1–7.2 m3/sec 16.2 Earth lining
2. South lower level canal 3.88 m3/sec–end (1.46 m3/sec downstream of pump station) 5.3 -do-
3. North lower level canal 0.46 m3/sec–end 5.1 -do-
4. Distributary Z 8.1 -do-
5. Distributary Y 3.0 -do-
6. High level canal 2.42 m3/sec (at present, Golden Exotic Ltd.) 5.6 -do-
Source: KIP office, GIDA (Edited by JICA)
Night storage reservoirs are located in the Akuse and high-level areas. In the Akuse command area, night reservoirs are located at the lateral canal of AK/C2, AK/C3, AK/C4 and AK/C5 to hold the total daily irrigation requirements for each lateral canal. During the 12 hours of daytime operation, lateral canals draw water from the night storage reservoirs. A total of five night reservoirs were constructed along the high level canal, but since 24-hour irrigation has became practicable, night reservoirs have not been utilized. Meanwhile, night reservoirs are effectively utilized for the pressurized irrigation system (micro drip system) at the banana estate along the high level canal. The reservoirs are essential to constantly supply irrigation water to the farm due to a shortage and fluctuation of the water supply through the Akuse Main Canal. As explained above, the maximum flow discharge of 7.2 m3/sec has not been diverted due to a shortage of flow capacity of the irrigation canal. The shortage of the flow capacity is due to the narrow flow area of the canal caused by sedimentation, especially downstream of the diversion point of the south and north lower level canals. It is therefore necessary to protect the canal with concrete lining to secure flow capacity. Check gates located immediately upstream of the siphons have been well maintained. 4.2.3 Drainage System An insufficient drainage canal slope corresponding to the natural terrain causes water logging in the farmland in KIS. In addition, the narrow and unstable maintenance road along the drainage canal hinders smooth mobilization of machinery and equipment. Heavy weeding in the drainage canal also causes insufficient flow capacity of the canal. It is therefore necessary to improve drainage conditions. 4.2.4 Irrigation Canal Existing irrigation canals are lined with concrete to secure flow capacity. Table 4.2.3 shows details of
- 90 -

- 87 -
the lining work.
Table 4.2.3 Canal Lining Work of KIS Location Station Width
(m) Height
(m) Lining
(m) Length (km)
1. Akuse main canal (CH 0.0–1.40km) 4.7 2.10 0.10 1.40 (CH1.40–2.23km) 4.7 2.25 0.10 0.83 (CH 2.23–5.88km) 4.7 2.25 0.10 3.65 (CH 5.88–7.70km) 4.0 2.05 0.10 1.82 (CH 7.70–12.69km) 3.5 2.20 0.10 4.99 (CH 12.69–16.10km) 3.5 2.00 0.10 3.41 2. South Lower Level Canal (CH 0.000–2.201km) 4.57 1.70 0.10 2.21 (CH 2.201–3.259km) 3.96 1.30 0.10 1.33 (CH 3.259–5.286km) 3.96 1.00 0.10 2.03 3. North Low Level Canal (CH 1.25–1.50km) 3.35 0.75 0.10 0.25 (CH 1.591–2.344km) 2.44 0.80 0.07 0.75 (CH 2.344–2.940km) 1.83 0.85 0.07 0.60 (CH 2.940–3.351km) 1.52 0.90 0.07 0.41 (CH 3.351–4.553km) 1.22 0.95 0.07 1.20 (CH 4.553–6.437km) 0.91 0.85 0.07 1.88 4. Distributary Z (CH 0.00–0.544km) 2.13 0.85 0.07 0.54 (CH 0.544–3.769km) 1.83 0.85 0.07 3.23 (CH 3.769–4.229km) 1.52 0.90 0.07 0.46 (CH 4.229–6.759km) 1.22 0.60 0.07 2.53 (CH 6.759–8.130km) 0.91 0.70 0.07 1.37 5. Distributary Y (CH 0–0.346km) 1.52 0.85 0.07 0.35 (CH 0.346–0.732km) 1.22 0.90 0.07 0.39 (CH 0.732–1.149km) 1.22 0.55 0.07 0.42 (CH 1.184–2.031km) 0.91 0.80 0.07 0.847 (CH 2.058–3.074km) 0.91 0.50 0.07 1.02
6. High Level Canal (CH 0–2.080km) 3.50 1.70 0.10 2.08 (CH 2.080–5.035km) 3.00 1.50 0.10 2.96 (CH 5.035–5.615km) 2.50 1.30 0.10 0.58
Note: Canal dimensions are taken from the contract drawing of KIP.
The canal section of the rehabilitation (concrete lining) adheres fundamentally to the original design section for the reasons below even though a smaller section can maintain sufficient flow capacity with improvement of the roughness coefficient by the concrete lining. The concrete lining is extended to approximately 0.2–0.3m above the design water surface. The earth surface free board is additionally maintained according to the original design free board depth of about 0.7 m.
1) Because of the existing division gates, the siphons don’t need to be rehabilitated, from an economical point of view, so the canal section shall conform to the original design to avoid a change of the hydraulic conditions.
- 91 -

- 88 -
2) In the case where the canal section is reduced corresponding to the roughness coefficient improvement, it is necessary to fill earth materials below the canal bed and behind the side slopes. It is preferable not to place concrete lining material on the filling materials so as to avoid cracks and uneven settlement caused by consolidation of the materials by water weight (20 kN/m2).
A hydraulic profile in the cases of unlined and lined irrigation canals are indicated in Fig. C.6.(2) and C.6.2.(3), respectively. The water level shall be controlled by the check gates located immediately upstream of the siphons and additional check gates in the south and north low level canals. 4.2.5 Flow Control Devices Flow control devices are listed below. Check gates are additionally installed in the south and north low level canals to maintain the water level. The water level is controlled by gate opening. Spillways and emergency outlet channels are installed immediately upstream of the gates and siphons from viewpoint of safety. Regarding bridges for not only cattle but for local residences too, five canal bridge culverts parallel to the KIS canal are planned to be installed for this purpose.
(KIS) Check gate
1. Main canal : 1 site (W 2.0 m × H 2.0 m × single) 2. -Do- : 11 sites (W 1.5 m × H 1.5 m × single)
Division gate 1. Main canal : 10 sites (W 1.5 m × H 1.5 m × single) 2. -Do- : 35 sites (W 1.0 m × H 1.0 m × single)
Spillway, outlet : 7 sites
4.2.6 Drainage Canal Table 4.2.4 shows details of the drainage work. The locations of the drainage improvement work are indicated in Fig. C. 14 in Annex C.
Table 4.2.4 Drainage Improvement Works
Location Descriptions Flood discharge
(m3/sec) Length (km)
1. Lupu main drain Existing drainage channel is widened to increase flow capacity.
5 5.0 2. Lupu-Klebwe outfall 5 1.0 3. Klebwe outfall 5 1.5 4. Sopa drain 3 2.5 5. Sopa- Kasu link drain 5 2.0 6. Kasu outfall drain 5 1.5 7. Kasu drain outlet 15 2.0 8. 10.0 9. 9.0
- 92 -

- 89 -
4.3 Land Development As shown on the figure below, paddy fields are developed to cover 10 ha (200 m × 500 m) in principle. Farm roads 4.0 m wide, and 0.5 m × 0.5m on-farm canals and drainage canals are provided by the project. About 3,000 m3 of earth moving is required for the land levelling work. Top soil shall be repeatedly moved to the vicinity field. Compaction by bulldozer carried out ten times effectively improves permeability of the paddy field comprised of sandy materials. Furrows shall be constructed by man-power. 4.4 Workshops for Agricultural Support and OMM 4.4.1 Plant and Equipment for Agricultural Support Service (1) Basic Concept of Agricultural Support Service Currently, most of the GIDA irrigation project, including KIP, provides agricultural support service, as mentioned below. In general, farming machinery, post harvest, and marketing services are provided through a combination of project work, farmer’s organization, and private sector. Due to the limitation of capacity of public service and private actors, including private millers, the needs of farmers are complimented by farmers who own extra tractors, middlemen, traders, etc.
- Technical extension - Farming machinery service (land preparation, harvesting, carting) - Input supply service (fertilizer, chemicals, seeds, etc.) - Post harvest service (Drying, rice husking and milling) - Marketing service (storage, packing and sales) - Farming credit (facilitation for access to ADB credit)
Large-scale farms are used to covering all farming and marketing activities by their own means as well as preparing initial investment. They are also expected to provide some services, such as post harvest and marketing, to neighbouring small and medium-scale farms. Especially within the Private Development Block, small-scale farmers are expected to be involved in the out-grower system of
Irrigation canal W0.5m x H 0.5m x 200m
Irrigation canal W0.3m x H 0.3m x 200mx10 rows
Irrigation canal (W0.5m x H 0.5m x 500m)
Drainage canal (W0.5m x H 0.5m x 500m)
Fig. 4.3.1 Plan of Land Development
- 93 -

- 90 -
large-scale farms (Agribusinesses), which will provide necessary support from extension to marketing services under the contract. Thus, the project will consider only small-scale and medium-scale farms in the Public Development Block. Small-scale farmers in the Public Development Block are expected to be recruited from the community and primarily lack experienced in irrigation agriculture as well as rice production. They require agricultural support service to begin and continue their farm management. Medium-scale farmers are expected to be experienced in irrigation agriculture and to have prepared agricultural machinery using their own capital, at least a tractor with an attachment for land preparation. This class of farmer is expected to act as anchor farmers in the project area who will contribute to enhancing the capability of farm management for neighbouring small-scale farmers through technical extension, providing mechanical service, and marketing, as well as water management within the secondary/lateral block.
1) Extension Service Technical extension service is provided by the project and it targets both small-scale and medium-scale farmers. The extension work will be carried out in combination with day-to-day communication between farmers and extension officers, and events such as technical seminars and field demonstration. The farmer association will be expected to be a receiver of extension service as well as a coordinator of recipient farmers. Medium-scale farmers are expected to complement the activity of the extension officers through day-to-day communication with small-scale farmers. 2) Machinery Service Land preparation (tractor service), carting service and harvesting service are considered to be provided by agricultural support service. Due to their limited capital, small-scale farms need to be supported in all mechanizations. Medium-scale farms are expected to have a tractor, but rice combine harvesters are rather difficult to introduce at the beginning stage. Currently, mechanical service is provided by existing private service providers, such as private Agricultural Mechanization Services Centres (AMSECs) and individual tractor owners in and around the project area. The capacity of machinery service of the private sector is expected to increase due to such factors as existing private service providers’ increasing their amount of machinery through capital increase, new private service providers coming from outside the project area, middle-scale farms (anchor farms) and large-scale farms (agribusiness) providing service with extra capacity of machinery, and some farmers starting to introduce machinery by applying the governmental subsidy. In the project, it is assumed that 50% of needs will be satisfied by the private sector, and that the project is necessary to meet the remaining 50% of needs. 3) Input Supply Service
- 94 -

- 91 -
Input supply service is usually provided in combination with agricultural credit. 4) Post Harvest Service Small-scale farmers are drying paddies using sun light on the ground. In order to reduce loss in drying work as well as to increase work efficiency, drying floors are to be allocated at an accessible distance from farms. A simple warehouse or shelter is to be equipped for each drying floor to shelter the plants from rain as well as to regulate the regular rice commodity chain. After controlling moisture, paddies will be transferred to a processing station or sale-collection point of a rice company, medium or large-scale farm in the project, private service provider, etc. A small milling unit for self-consumption rice is to be equipped at each drying floor shelter, as well. Medium-scale farms are expected to equip the necessary space, warehouse, and dryer if necessary, within their farms. Milling service is expected to be provided by the private sector, such as large-scale commercial farms in and around the project area, as well as private rice millers, intermediaries, traders, wholesalers, etc. 5) Agricultural Credit Agricultural credit is essential to keep farm management going, especially for small-scale farms. Currently, agricultural credit is mainly provided by Agricultural Development Bank (ADB). According to the experience in KIP in recent years, farmers are eager to have agricultural credit for inputs (seed, fertilizer, and chemicals) but it is difficult for many farmers to access credit due to a lack of collateral. Actually, only 336 farmers qualified for ADB credit in the major season of 2010, which covers approximately 300 ha, whereas the total cultivated area is 1,652 ha. The project is expected to facilitate farmer’s access to agricultural credit, though it is not realistic that the project will provide credit directly. The block farm program may be enhanced by MoFA and the project may endorse collateral for ABD credit for small-scale farms.
Table 4.4.1 Agricultural Support Service Necessary to be provided by the Project
Service Contents Public development block Private development block
Small-scale farm
Medium-scale farm
Small-scale farm
Large-scale farm
1. Extension service ■ ■
- Provided by
large-scale farm
- Provided by
himself
2. Machinery Service
2-1. Land Preparation ● -
2.2. Harvesting ● ▲
2-3. Carting ● -
3. Input Supply Service ● ▲
4. Post Harvest Service
4-1 Drying ● ▲
4-2. Rice Milling ● ▲
5. Marketing Service
5-1. Storage, Packing and Sales ● -
6. Agricultural Credit
6.1. Facilitation to ADB credit ■ -
■: Provided by the project
- 95 -

- 92 -
●: Provided by the project in combination with local private service provider ▲: Partially provided by the project in combination with local private service provider -: Not necessary to be provided by the project
(2) Plant and Equipment for Agricultural Support Service In order to estimate necessary plants and equipment for agricultural support service, the following conditions and assumptions were applied:
1) Extension Service In the newly developed area, one extension officer is assigned to each group of two secondary blocks (public developed block) with a transportation means such as motorbike. At the beginning stage of the project, it is necessary to assign additional staffs to enhance the officers’ activity in order to support farmers beginning their irrigation agriculture by closer communication. In the existing KIS area it is necessary to increase the number of extension officers due to the enlargement of the irrigation area and to provide the required accurate water management. 2) Machinery Service Land preparation (tractor service) and carting service: - Small-scale farms are to be the target of land preparation and carting service. - Existing private service providers in and around the project area, which consist of private
AMSECs and individual tractor owners, as well as farmers with their own machinery, will occupy 50% of the land preparation and carting work of small-scale farms.
Harvesting service (Rice combine harvester): - Small and medium-scale farms are to be the targets of harvesting service by the project. - Existing private service providers and farmers with their own machinery, as well as
manpower, will occupy 50% of the harvesting work of small and medium-scale farms. 3) Post Harvest Service Drying floor: Drying floors are to be allocated at an accessible distance from small-scale farms. In consideration of the work distance and transportation means of farmers, which is carting by tractor or handcart, drying floors are designed to be allocated for each 50 ha of paddy fields. A small rice milling unit for self consumption is to be equipped at each drying floor.
The estimated plants and equipment for agricultural support service are shown in Table G.3 in Annex G. The plants and equipment will be scheduled to be installed according to the increase of rice production by the progress of the project.
- 96 -

- 93 -
4.4.2 Plant and Equipment for Maintenance Work The responsibilities for the maintenance of infrastructure of the irrigation schemes would be demarcated principally in such a way that:
- The projects (KIP and SMC) would take responsibility for intake facility, main and secondary canals, main and secondary drainage, other main infrastructures such as roads,
- Small and medium-scale farmers would take responsibility for lateral-level facilities, including canals and drainages,
- Large-scale farms would take responsibility for all on-farm facilities. The amount of major facilities to be maintained in the irrigation schemes are: KIS
- Intake facility 1 - Main canal 16.2 km (concrete lined) - Secondary canal 27.1 km (concrete lined) - Main drainage 48.4 km, of which 8.4 km would be rehabilitated in the project - Road and others
NDIS - Intake facility 1 - Main canal 69.1 km (concrete lined) - Secondary canal 115.5 km (concrete lined) - Main drainage 33.5 km, of which 8.4 km would be rehabilitated in the project - Road and others
In order to keep the function of the irrigation scheme as designed, and secure appropriate water distribution to each farm, it is essential to maintain the facilities effectively and efficiently. Because of huge amount of facilities to be maintained, it is essential for projects to equip adequate plants and equipment for maintenance work. It is necessary to provide mechanical service under the contract to small and medium-scale farmers and Farmers Cooperatives for maintaining lateral-level infrastructures as well. The proposed plants and equipment for maintenance work is shown in Table G.4 in Annex G. Those plants and equipment deployed to the projects would be operated and maintained in the mechanical workshop of each project. The existing KIS workshop would be used as it is and a new workshop would be developed for NDIS.
- 97 -


Chapter 5
Initial Environmental Examination (IEE)

- 94 -
Chapter 5 Initial Environmental Examination (IEE) 5.1 Comparative Examination of Alternatives (1) Proposed Project The outline of the proposed project is as follows at this stage: - About 2,500 farmers (small holder, emerging farmer) and the private sector (Agri-business) will
be working on the plains after the completion of the project. - Planned irrigation area is about 11,000 ha in total;
KIS (Kpong Irrigation Scheme): 4,100 ha, No. 1 Area (Norboyita area):2,700 ha, No. 2 Area (1st Priority area + Prairie area):4,200 ha.
- Construction of New Irrigation Water Intake (Outlet from the Kpong Dam Reservoir). - Construction of New Irrigation Canal (about 70 km) including partial siphon. - Drainage. (2) Alternatives to the project, including the option of not adopting the project The alternatives to the project are summarized below:
Table 5.1.1 Summary of Alternatives Alternatives Description
Adopting the project 【Case 1】 New development area (NDIS) only, excluding existing KIS.
‐Meteorology: No adverse impact is expected. ‐Hydrological Situation: Water loss from canal is expected because the existing
canal of KIS has so many places to be rehabilitated. ‐Eco-System: The project area does not include the wetland ecosystem (lake and
pond). However, wetland conditions are likely to change if runoff from farmland comes into the lake and pond in the wetland area.
‐Livelihood: Animal husbandry is one of main sources of the local economy. Irrigation canals are likely to block cattle grazing unless cattle crossing points are provided.
‐Involuntary resettlement: No involuntary resettlement is expected at the present stage, because irrigation canals don’t pass through or near the existing communities.
Adopting the project 【Case 2】 NDIS and improvement of KIS by concrete lining of the main canals.
‐Meteorology: No adverse impact is expected. ‐Hydrological Situation: Water loss will be minimized by constructing concrete
lining. ‐Eco-System: The project area does not include the wetland ecosystem (lake and
pond). However, wetland conditions are likely to change if runoff from farmland comes into the lake and pond in the wetland area.
‐Livelihood: Animal husbandry is one of main sources of the local economy. Irrigation canals are likely to block cattle grazing unless cattle crossing points are provided.
‐Involuntary resettlement: No involuntary resettlement is expected at the present stage, because irrigation canals don’t pass through or near the existing communities.
‐Proposed gravity irrigation area covers a total of about 11,000 ha of the Accra Plains. This alternative may be one of the methods to enhance food security and the development of agro-based industries. However, since the target area of this alternative consists of vast plains, and there is some possibility of adverse impacts, it is necessary to take account of environmental and social
- 98 -

- 95 -
considerations, and to minimize and mitigate adverse impacts. Adopting the project 【Case 3】 Combined plan of NDIS and KIS as one new main canal. Existing KIS intake and canal are abolished.
‐Meteorology: No adverse impact is expected. ‐Hydrological Situation: Water loss will be minimized by constructing concrete
lining. However, existing KIS facilities, such as the water intake and main canal need to be abolished. In this case, construction waste will be generated. Therefore, it can be said that Case 3 has a greater negative impact than Case 2.
‐Eco-System: The project area does not include the wetland ecosystem. However, wetland conditions are likely to change if runoff from farmland comes into the lake and pond in the wetland area.
‐Livelihood: Animal husbandry is one of main sources of the local economy. Irrigation canals are likely to block cattle grazing unless cattle crossing points are provided.
‐ Involuntary Resettlement: No involuntary resettlement is expected at the present stage, because irrigation canals don’t pass through or near the existing communities.
Not adopting the project
‐No action will be taken. Under this scenario, only 3,354 ha of the Accra Plains will be under irrigation. Vast sections of the plains will be under various uses, including small-scale farming. Therefore, the impact of these activities on major eco-systems will be insignificant. However, it may not be in line with Ghana’s agriculture policy on food security or the millennium development goal for the reduction of hunger.
5.2 Possible Adverse Environmental and Social Impacts No extensive involuntary resettlement is expected. The route of the main canal and road has been selected to pass though the high elevated area along the hilly area in order to increase the gravitational irrigable area as much as possible. Normally, residential areas and villages are located in the flat area along the Volta River, but there are very few houses located in the hilly and high elevated area, where the new main canal and road are planned to locate. Therefore, in general, large-scale involuntary resettlement will not be necessary in this project implementation, although a few houses might need to be shifted or replaced in cases where the layout of the new canals and roads might cross some residential area. The new irrigation water intake might not affect the intrusion of salt water into the Volta River. The peak irrigation water intake from the Kpong Dam is estimated to be 11.4m3/sec for NDIS, 7.2m3/sec for KIS, or a total of 18.6m3/sec. The amount of the peak intake corresponds to 1.55% compared with the water release from the hydro-power generation capacity of 1,200 m3/sec. However, the duration of the peak intake period will be limited to within a few days. The daily average water intake from the Kpong Dam is estimated to be 7.6 m3/sec, which is 0.63 % of the water for hydro-power generation. Such a small percentage of water intake upstream of the Kpong Dam will have almost no effect on the intrusion of salt water downstream of the Volta River. However, occasionally there will be a water release shortage from the Kpong Dam to downstream of the Volta River caused by time lag and power demand of water release for hydro-power generation between the Akosombo Dam and Kpong Dam. The problem of the salt water intrusion downstream of the Volta River should be considered by and be the responsibility of VRA. Fortunately, VRA is a member of Water Resources Commission (WRC), which regulates and manages the utilization of water resources in Ghana. VRA utilizes water
- 99 -

- 96 -
resources based on the strategy for Integrated Water Resources Management (IWRM) for the sustainable utilization of the nation’s water resources. Therefore, it is likely that VRA is considering reducing salt water intrusion downstream of the Volta River. The adverse impact that may be caused by the implementation of the project is shown in Table F.1 in Annex F. The extent of possible adverse impacts at each phase of the project is shown in Table 5.2.1.
- 100 -
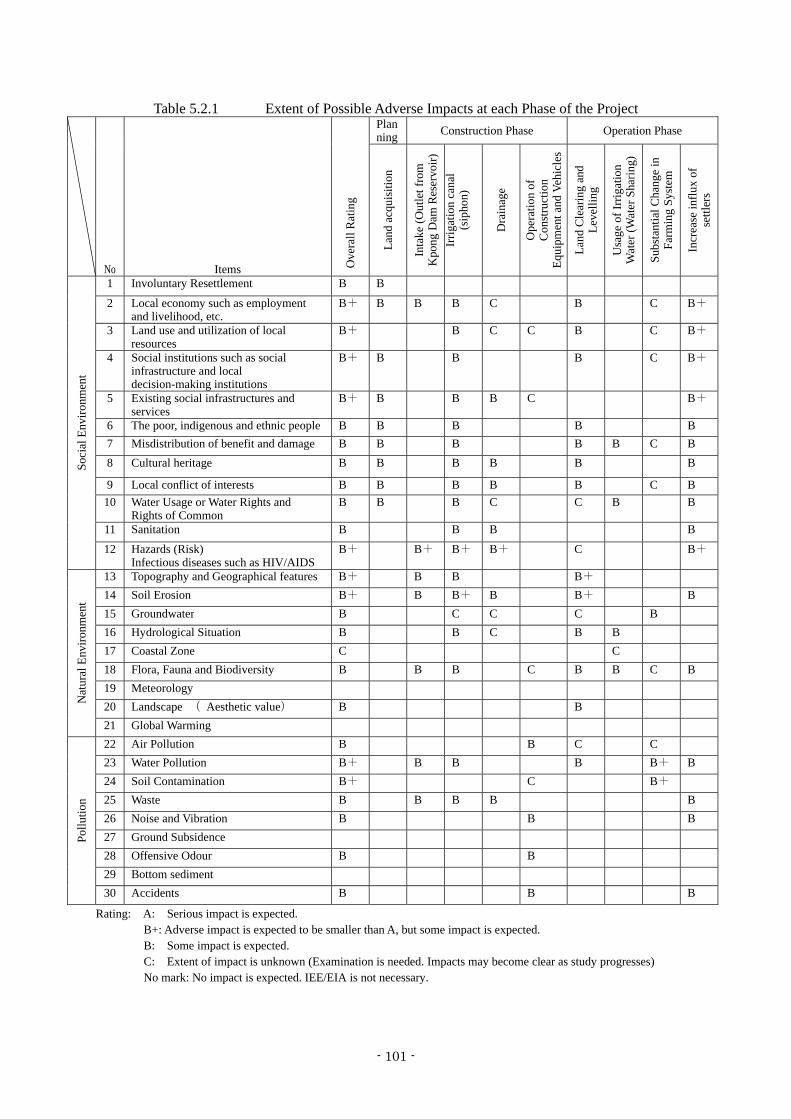
- 97 -
Table 5.2.1 Extent of Possible Adverse Impacts at each Phase of the Project
No Items Ove
rall
Rat
ing
Planning Construction Phase Operation Phase
Land
acq
uisi
tion
Inta
ke (O
utle
t fro
m
Kpo
ng D
am R
eser
voir)
Ir
rigat
ion
cana
l (s
ipho
n)
Dra
inag
e
Ope
ratio
n of
C
onst
ruct
ion
Equi
pmen
t and
Veh
icle
s
Land
Cle
arin
g an
d Le
velli
ng
Usa
ge o
f Irr
igat
ion
Wat
er (W
ater
Sha
ring)
Subs
tant
ial C
hang
e in
Fa
rmin
g Sy
stem
Incr
ease
influ
x of
se
ttler
s
Soci
al E
nviro
nmen
t
1 Involuntary Resettlement B B
2 Local economy such as employment and livelihood, etc.
B+ B B B C B C B+
3 Land use and utilization of local resources
B+ B C C B C B+
4 Social institutions such as social infrastructure and local decision-making institutions
B+ B B B C B+
5 Existing social infrastructures and services
B+ B B B C B+
6 The poor, indigenous and ethnic people B B B B B7 Misdistribution of benefit and damage B B B B B C B8 Cultural heritage B B B B B B
9 Local conflict of interests B B B B B C B10 Water Usage or Water Rights and
Rights of Common B B B C C B B
11 Sanitation B B B B
12 Hazards (Risk) Infectious diseases such as HIV/AIDS
B+ B+ B+ B+ C B+
Nat
ural
Env
ironm
ent
13 Topography and Geographical features B+ B B B+ 14 Soil Erosion B+ B B+ B B+ B15 Groundwater B C C C B16 Hydrological Situation B B C B B 17 Coastal Zone C C 18 Flora, Fauna and Biodiversity B B B C B B C B19 Meteorology 20 Landscape ( Aesthetic value) B B 21 Global Warming
Pollu
tion
22 Air Pollution B B C C23 Water Pollution B+ B B B B+ B24 Soil Contamination B+ C B+25 Waste B B B B B 26 Noise and Vibration B B B27 Ground Subsidence 28 Offensive Odour B B 29 Bottom sediment 30 Accidents B B B
Rating: A: Serious impact is expected. B+: Adverse impact is expected to be smaller than A, but some impact is expected.
B: Some impact is expected. C: Extent of impact is unknown (Examination is needed. Impacts may become clear as study progresses) No mark: No impact is expected. IEE/EIA is not necessary.
- 101 -

- 98 -
5.3 Mitigation and Monitoring for Key Impacts The assumed mitigation measures for the adverse impacts are shown in Table F.2 in Annex F.
5.4 Proposed Additional Study for EIA during F/S (1) To hold Public Consultations At the time of an Environmental Impact Assessment Study (5,000 ha as a 1st Priority Area), public consultations took place from 29th July to 12th August, 2009, and the key stakeholders of the North Tongu District participated (including the District Assembly, District Agriculture Directorate, Health Experts, councillors of communities, traditional rulers of communities, farmers and residents, others concerned). The project area of APGIP covers not only the North Tongu District, but also Dangme East District and Dangme West District. Therefore, public consultation meetings need to be held in these two Districts as well. (2) To undertake an Environmental Impact Assessment Study, including a study on wetland An Environmental Impact Assessment Study (5,000 ha as a 1st Priority Area) was carried out at the time of the Feasibility Study of the Accra Plains Irrigation Project (Detailed Feasibility Study for the 5,000 ha). As a result of the Study, negative impacts were identified, and mitigation measures were established to prevent or minimize negative impacts. However, this study does not cover other areas, such as the No. 1 Area (Norboyita area) or KIS (Kpong Irrigation Scheme area). Therefore, an additional Environmental Impact Assessment Study needs to be carried out covering the whole project area of the Accra Plains Gravity Irrigation Project (APGIP). The scope of the Study needs to be in line with the requirements of the Environmental Protection Agency (EPA), Ghana. The project area is not located in the National Parks or Protected Area, but a wetland consisting of lakes and ponds extends near the No.1 Area (Norboyita area). The wetland is likely used not only as a fishing point for the communities, but also as habitats for wildlife. However, since an environmental study or research has not been conducted yet in this area, the value or importance of this wetland is not clear. Therefore, an Environmental Study on the wetland near the No. 1 Area (Norboyita area) may be necessary. (3) To respect traditional religious objects There are seven culturally sensitive areas within the project area which may be affected by the development of the irrigation fields. Out of the seven, six are sacred groves covering an area of about one acre each while the remaining one is a sacred rock. In order to respect the traditional religious objects, the land around the culturally sensitive areas should not be acquired. The irrigation canals need to make a detour around those culturally sensitive areas. New settlers need to be informed of the presence of culturally sensitive areas, so that they can understand and respect traditional culture. (4) To consider the existing water distributing pipe network being laid underground
- 102 -
- 99 -
All the communities in the project area have access to pipe-borne water through community standpipes provided under the Three District Water and Supply Scheme. The project is being implemented by the Community Water and Sanitation Agency in the Dangme West District, Dangme East districts and North Tongu District. There are two water intakes near Aveyime town in the Volta River. New irrigation canals are thought to cross those water distributing pipes laid underground. Therefore, it is necessary to collect information on the existing water distributing pipe network. (5) To provide Cattle Crossing Bridges Animal husbandry is one of the main sources of the local economy. Irrigation canals area likely to block cattle grazing unless cattle crossing points are provided. Therefore, when designing irrigation canals, cattle crossing points need to be provided at the planning phase and temporary cattle crossing points need to be provided at the construction phase. (6) To study an effective and feasible Monitoring Plan Irrigation development promotes farm production during the dry season. It signifies a possible increase in usage of chemical fertilizers, pesticides, and herbicides. As a result, overuse of those chemicals may cause water pollution and soil contamination. Therefore, it is necessary to study an effective and feasible monitoring plan.
- 103 -


Chapter 6
Possible Options of Organization and Management

- 98 -
Chapter 6 Possible Options of Organization and Management 6.1 Introduction The term “Public-Private Partnership” (PPP) describes a range of possible relationships among public and private entities in the context of infrastructure and other services. The idea of involving private investors and managers in the irrigation sector was debated in the hope that private partners would bring efficient management skills, fresh funds, and relief of government responsibility. PPP allocates the tasks, obligations, and risks among public and private partners in an optimal way. In order to make PPP effective, each partner should have certain advantages, relative to the other, in performing specific tasks. At the same time, the structure of the partnership should be designed to allocate risks to the partners who are best able to manage those risks. Because the possible relationships between public and private partners vary greatly and there are no fixed paths, it is necessary to have careful discussion among the stakeholders during the process of designing the PPP mechanism in the project. Regarding the management of the irrigation system in APGIP, the PPP approach can be applied to any field of the project, in theory, such as development, operation and maintenance of the irrigation system and related infrastructure, development of the agricultural field, management of farming and marketing, and providing irrigation service and agricultural support to farmers. To discuss and design the PPP mechanism for the project, it is necessary to understand the possible private partners and to have careful and deep discussion with them to identify their intentions toward investment as well as their business idea; however, this is outside the scope of the study, and to be left to the succeeding market test and detailed PPP study for APGIP, which are expected to be held by WB. Considering the above situation, possible options of organization and management of APGIP were examined in this study in order to provide some materials for starting the discussion. The aspects to be discussed on the irrigation system management are:
- Land ownership - Irrigation users - Development of land and irrigation infrastructure - Management of irrigation system - Agricultural support service - Irrigation service charge and other fees
6.2 Land Ownership KIS Land of the existing KIP area is owned by GIDA/GOG. (it was acquired by GIDA/GOG when development started and allocated to farmers under lease contracts (Land Allocation Agreements between KIP and farmers).
- 104 -

- 99 -
NDIS Development land for NDIS can be: a. Owned by GIDA/GOG and rented to users.
This is the conventional method, and is the same as the procedure applied in KIP. b. Land owners maintain ownership during the project period. GIDA will acquire long-term land
leaseholds with exclusive attorneyship by premium payments of one-third of the land value to land owners. After development of land, land users pay the land rent fee to the land owners through GIDA annually, based on the contracts between the land users and GIDA. In the 2nd Area, GIDA has started sensitization and negotiations with land owners under this condition.
6.3 Irrigation Users KIS Irrigation users and Land Allocation Agreements of KIP are to remain as they are. All small-scale farmers in KIS are organized into the Osudoku Farmers Cooperative. A low recovery ratio of ISC from small-scale farmers shall be solved to improve KIP’s performance. In addition, it is necessary to discuss that ISC payment of the banana estate (Golden Exotic Ltd) shall be connected to KIP’s Internal Generated Fund (IGF) in order to strengthen and stabilize the financial situation of KIP. NDIS The irrigation users invited to NDIS will be categorized into three farmer types, i.e., small-scale, medium-scale and large-scale farmers.
Table 6.3.1 Farmer Types of Irrigation Users Object Self consumption and commercial Commercial
Farmer Type Small-scale Medium-scale Large-scale Farming Type Self consumption/ Local market
or functioning as out-grower of agribusiness
Domestic market Domestic/ Export Agribusiness
Size 1–2 ha Represented by 1.5 ha
10–30 ha Represented by 20 ha
One unit: 50–100 ha
Support Services Necessary for support service fully or partially Not necessary/ individual
6.4 Development of Land and Irrigation Infrastructure The issue in the construction of irrigation infrastructure is how to demarcate the investment between the public and private sector. As the situation is different between the rehabilitation of existing infrastructure and new development of the irrigation scheme, KIS and NDIS shall be discussed separately. KIS Considering the history of the development of KIS, it is reasonable that the public sector is to cover the investment for rehabilitation, except for the area of the banana estate. As for the banana estate, only the main and secondary canal up to the pump station are to be rehabilitated by the project,
- 105 -

- 100 -
whereas the pumps and canal network after the pump shall be maintained by the farm.
Table 6.4.1 Options for Demarcation of Rehabilitation of KIS
Options Stakeholders Main canal Secondary
canal Lateral canal
network Land
development
Rehabilitation
Public (GIDA) ● ● ●
Small-scale farm
▲ Partially (Labour
contribution)
▲ If necessary
Banana Estate (Large-scale farm)
● After pump
station ●
● Expansion
area NDIS (1) Concept of Land Development GIDA is preparing the new policy of land allocation in the large-scale irrigation development, which will be reflected to the amendment on the Regulation of GIDA (L.I.1350). According to the new policy, at least 30% of the developed land shall be allocated to local (and recruited) small holders when a private investor develops the land utilizing public irrigation water, for the purpose of securing the livelihood of local small holders. When the government develops the land, 30% of the developed land is recommended to be allocated for commercial farms, in consideration of the promotion of commercial farming. In consideration of GIDA’s new policy, a Private Development Block and Public Development Block are proposed to be introduced in NDIS. The land of NDIS will be divided into a number of secondary blocks, the size of which is expected to be 100–300 ha depending on the geographical and irrigation network conditions. Those secondary blocks are considered hydraulically independent under the main irrigation system. Thus they are able to be managed independently. Some of the small blocks less than 100 ha would be combined into one block from the aspect of management size. Each secondary block would be categorized as Private Development Block and Public Development Block, depending on the type of development. Private Development Block is to be developed by the initiative and investment of the private sector, such as agribusiness enterprise (Large-scale farm). Within the block, the large-scale farms occupy 70% of land for their own farming and the remaining 30% will be allocated to small-scale farms, which are expected to perform as out-grower farming or contract farming under the large-scale farms. Large-scale farms are expected to take care of the farming of small-scale farms and to provide agricultural support services, such as technical extension, input supply, mechanical service, post harvest and marketing under a contract. In consideration of the target crops, the expected investors of the private development blocks are large-scale rice farm companies operating in and around the project area who intend to expand
- 106 -

- 101 -
business; rice processing and trading companies who intend to go into production; and investors who intend to go into rice cultivation. Those farms are expected to supply a value chain to the project area by equipping large-scale rice processing and storage plants on site or other places. In most cases, it is expected that such kind of companies intend to gather up rice produced around their farm for their commodity as well as to produce rice themselves. Small-scale farmers in the Private Development Block are expected to sell their products to large-scale farms under an out-growing scheme or contract farming. The large-scale farms provide agricultural services to the small-scale farms, such as extension, input supply and mechanical service. In any case, depending on the policy and plan, large-scale farms are expected to contribute to the project area by supplying agricultural service and/or a value chain, and a farm which does not have such plan would be required to compensate by alternative means, such as additional payments for development and so on. Potential investors need to be identified in the further study so that a deep and detailed discussion on the possible mechanism or relationship between large-scale farms and small-scale farms in the block will be started. The Public Development Block is to be developed by the government (GIDA), and 70% of the land will be allocated to small-scale farmers and 30% will be allocated to medium-scale farmers. The project will provide agricultural support services, such as technical extension, mechanical service, post harvest, and marketing, to both small and medium-scale farmers through SMC. Medium-scale farmers are expected to lead farmer’s organizations in the block as well, especially in the marketing activity. A farmer’s organization formulated by all small and medium farmers in the project area is expected to play the role of marketing production. Some of the production is expected to be gathered up by the large-scale farms in the project area as well. Most small-scale farmers recruited in the project are expected not to have any experience of irrigated agriculture. Thus, careful technical extension is vital, as well as providing mechanical service and other support. It is expected that many farmers who have experience of irrigated agriculture or medium-scale farming, regardless of crop types, will come to the project as medium-scale farmers. Because of their experience and management skills, they are expected to act as anchor farmers in the block who will lead the introduction of appropriate farming technology and farm business. Medium-scale farmers are expected to possess agricultural machinery, at least tractors. Those who have extra machinery will provide machinery service to other farmers. (2) Scenarios for Land and Block Distribution The overall land distribution to each farmer type will be decided by the allocation of public and private blocks, which shall be decided in consideration of marketability and business plans of invited
- 107 -

- 102 -
large-scale farms, as well as the governmental policy. In the study, it is possible to set two scenarios of land and block distribution as shown below:
Main Canal System Private Devel’t Block
Public Devel’t Block
Public Devel’t Block
Private Devel’t Block
Private Devel’t Block
Public Devel’t Block
Private Devel’t Block
Public Devel’t Block
Scnario-1: Allocate Private Development Block 50% and Public Development Block 50%
Private Development Blocks Public Development Blocks
Large-scale farms: 70% Medium-scale farmers: 30%
Small-scale farmers: 70% Small-scale farmers: 30% 50 % 50 %
In this scenario, small-scale farms will occupy 50% of the developed land, medium-scale farms occupy 15% and large-scale farms will occupy 35% in total (in other words, small holders: 50%; commercial farms, including medium-scale farms: 50%).
Scenario-2: Allocate Private Development Block 100%
Private Development Blocks
Large-scale farms: 70%
Small-scale farmers: 30% 100 %
In this scenario, small-scale farms will occupy 30% of the developed land and large-scale farms will occupy 70% in total (in other words, small holders: 30%; commercial farms: 70%).
(3) Demarcation of Investment by Public and Private Sector The construction of irrigation infrastructure of NDIS consists of main, secondary and lateral canal/drainage and land development. It is to be discussed how to demarcate the necessary investment between the public and private sector. The possible demarcations of public and private investment are shown in the table below. In the case of rice development, the cost for land development becomes huge and it might be difficult for private investors (large-scale farm) to cover the land development cost for small-scale farms. Thus, there may be an option of burdening the public sector with the land development for small-scale farms in the private development block. (Option a-2)
- 108 -

- 103 -
Table 6.4.2 Options for Demarcation of Construction of NDIS
Options Stakeholders Main canal Secondary
canal Lateral canal
network Land
development
a-1. Private Development Block
Public ● ●
Small-scale farm
Large-scale farm ●After the boundary of
block ● ●
a-2. Private Development Block
Public ● ● ● For
small-scale farms
Small-scale farm
Large-scale farm ●After the boundary of
block ●
● For own farms
b-1. Public Development Block
Public ● ● ● ●
Small-scale farm
Medium-scale farm
b-2. Public Development Block
Public ● ● ● ●
Small-scale farm
Medium-scale farm ● ●
6.5 Irrigation System Management (1) Management organization As for the structure of the management organization, it is theoretically possible to consider both types, i.e., introducing a unified management unit for KIS and NDIS under single organization and appointing management units individually. However, the unified management is not recommended in consideration of the history of KIS, the scale of irrigation schemes, and differences between users and their farming styles in KIS and NDIS. The possible options for irrigation system management are to: a. Appoint management units individually in KIS and NDIS
Individual management units in KIS and NDIS will have the advantage of making service contents and an irrigation service charge suitable for the conditions of each scheme, especially considering the differences between users and their farming styles. In this case, KIP will be appointed to the management unit of KIS. However, it should be noted that KIP needs to strengthen its management, so as to improve water management practice, and increase its effectiveness and efficiency. For NDIS, there are two options, i.e., i) establishing a GIDA project office (public management unit), and ii) hiring a private scheme management company.
b. Combine unified and individual management Even though establishing individual management units has an advantage in the flexibility of services, it is worth considering to set-up an umbrella structure to improve the effectiveness and
- 109 -

- 104 -
efficiency of scheme management. There is an option that the appointed private Scheme Management Company of NDIS supervises the management of KIP so that the know-how or experience of private business will be transferred to KIP. This is the combination of unified management and individual management. In this case, it is necessary to consider a contract for supervision between KIP/GIDA and the scheme management company.
a-1. Individual Management a-2. Individual Management b. Individual Management underwith Public Project with Private Scheme Manager Supervison of Private Scheme Manager
KIP
KIS NDIS
Private Scheme Manager
GIDA
AdministrationAdministration
KIP
KIS NDIS
GIDA (APGIP)
GIDA
Private Scheme
ManagerKIP
KIS NDIS
Supervising
GIDA
Administration
Fig. 6.5.1 Irrigation Management Organization
(2) Demarcation of Responsibility for Operation and Maintenance Small-scale farms are responsible for the operation and maintenance of the lateral canal network, while the scheme management company and/or KIP are responsible for the canal system from the intake to the off-takes in the lateral canals. In case of medium and large farms, the scheme management company is responsible for the canal system from the intake to off-takes in the main canal or to the beginning of their farm territories, and the remaining parts are managed by small farms.
Table 6.5.1 Options for Demarcation of Operation and Maintenance
Scheme Stakeholders Main canal Secondary canal Lateral canal
network On-farm irrigation
KIS
KIP ● ●
Small holders / Association
● ●
Private (Banana estate)
● After pump station
● ●
NDIS
Private Development
Block
Scheme Management
Company ● ●
Small-scale farm ● ●
Large-scale farm ●
After the block boundary
● ●
NDIS
Public Development
Scheme Management
Company ● ●
Small-scale farm ● ●
- 110 -

- 105 -
Block Medium-scale farm
● After the boundary
of farm ● ●
(3) Water Management and Farmer’s Organization KIS Osudoku Cooperative was formulated to cover all small holders in KIS, which has the function of a WUA as well as a Farmer-based organization (FBO) in KIS. Osudoku Cooperative is required to enhance its activity to cope with the increasing of its responsibility once the irrigation system enters full operation after rehabilitation. It can do so by enhancing the Lateral Group as well as the Branch/Block Group to manage minute water distribution and maintenance work. NDIS A new farmers association (Farmers Cooperative) is required to be formulated by all the farmers of NDIS. In the Public Development Block, a Secondary Group would be formulated as a key sub-structure for managing the irrigation system in the Secondary Block under the Farmers Cooperative. The Secondary Group is expected to function as a WUA and take responsibility for the operation and maintenance of the irrigation system at the lateral level. ISC would be collected by the person in charge of the Secondary Group and paid all together to the scheme management company. In the Private Development Block, large-scale farms would be the key entities for management of the irrigation system within the block. Large-scale farms and small-scale farms would formulate WUA through the Secondary Block. WUA takes responsibility for coordinating the distribution schedule, and for the operation and maintenance of the system. Small-scale farms would formulate a Lateral Group and carry out operation and maintenance at the lateral level. (4) Collection of Irrigation Service Charge The Irrigation Service Charge (ISC) is to be collected separately by the project management body, i.e., KIP, for KIS and by a private scheme manager for NDIS. The ISC price shall be set to cover the necessary cost for operation and maintenance of the irrigation system, including human expenses and administration cost, in principal. If it is difficult for new small-scale farmers to pay the full price of ISC from the beginning of their farming, it will be necessary to consider a governmental subsidy, but such subsidy shall be limited to the launching period of their farming. 6.6 Agricultural Support Service The items to be examined in the agricultural support service are:
- Which kind of agricultural support service is to be provided by the project? - Will a new private service provider be established/hired, or will the scheme management
company cover agricultural support service? - How can commercial farms in and around the irrigation schemes contribute to the provision
- 111 -

- 106 -
of agricultural support service? Currently, most of the GIDA irrigation project, including KIP, provides the agricultural support service as shown below. In general, farming machinery, post harvest and marketing services are provided by a combination of the project, farmer’s organization, and private sector. Due to the limitation of the capacity of public service, private actors, such as private millers, farmers who own extra tractors, intermediaries, and traders, complement the needs of farmers.
Service contents 1) Technical extension 2) Farming machinery service (Land preparation, harvesting, carting) 3) Input supply service (fertilizer, chemicals, seeds, etc.) 4) Post harvest service (drying, rice husking and milling, storage) 5) Marketing service (storage, packing and sales) 6) Farming credit (facilitation for accessing to ADB credit)
KIS a. KIP provides agricultural support service as it is. The capacity of KIP shall be increased in
order to meet farmer’s needs. b. KIP provides agricultural support service as it is. The scheme management company or a
private service provider for the NDIS will contribute to compensate for any deficit of the capacity of KIP or local private entities.
NDIS
a. The scheme management company will cover agricultural support service as its activity. Advantage: Easy to secure ICS recovery. Disadvantage: The scheme management company will have a complicated business. Large
investment is required for the scheme management company. b. Hiring Private Service Provider
Advantage: The scheme management company can concentrate on water management. Disadvantage: The scheme management company possibly faces difficulty in ISC collection.
Existing and newly-entering private millers and traders are also expected to contribute to meeting farmers needs. Large-scale commercial farms with extra capacity for post harvesting and marketing capacity, such as Prairie Volta Ltd., can be expected to contribute to the value chain of other farms.
- 112 -

- 107 -
Possible Demarcation for Kpong Irrigation SchemeSmall Holders Banana Estate
Kpong-Small
Mai
n ca
nal
Seco
ndar
yca
nal
Terti
ary
cana
l
Land
deve
lopm
ent
On-
farm
irrig
atio
n
Farm
oper
atio
n
Agr
icul
tura
lsu
ppor
t Kpong-Banana
Mai
n &
seco
ndar
y
Pum
pst
atio
n
Can
als i
nth
e fa
rm
Land
deve
lopm
ent
On-
farm
irrig
atio
n
Farm
oper
atio
n
Agr
icul
tura
lsu
ppor
t
Governance Governance PublicOwnership /concession Public Ownership /
concessionInvestment&financing
Investment&financing Private (Banana Estate)
OMM Farmers / Farmers Association OMM
Possible Demarcation for Accra Plain Gravity Irrigation SchemePrivate Development Block
Small Scale Farm Large Scale FarmPrivate-Small-1
Mai
n ca
nal
Seco
ndar
yca
nal
Terti
ary
cana
l
Land
deve
lopm
ent
On-
farm
irrig
atio
n
Farm
oper
atio
n
Agr
icul
tura
lsu
ppor
t Private Large-1
Mai
n ca
nal
Seco
ndar
yca
nal
Terti
ary
cana
l
Land
deve
lopm
ent
On-
farm
irrig
atio
n
Farm
oper
atio
n
Agr
icul
tura
lsu
ppor
t
Governance Public Governance PublicOwnership /concession Private Ownership /
concessionInvestment&financing (Large Scale Farm) Investment
&financing Private (Large Scale Farm)
OMM Farmers / Farmers Association OMM
Private-Small-2
Mai
n ca
nal
Seco
ndar
yca
nal
Terti
ary
cana
l
Land
deve
lopm
ent
On-
farm
irrig
atio
n
Farm
oper
atio
n
Agr
icul
tura
lsu
ppor
t Private Large-2M
ain
cana
l
Seco
ndar
yca
nal
Terti
ary
cana
l
Land
deve
lopm
ent
On-
farm
irrig
atio
n
Farm
oper
atio
n
Agr
icul
tura
lsu
ppor
t
Governance Public Governance PublicOwnership /concession Private Ownership /
concessionInvestment&financing (Large Scale Farm) Investment
&financing Private (Large Scale Farm)
OMM Private Farmers / Farmers Association OMM Private
Public Development BlockSmall Scale Farm Medium Scale Farm
Public-Small-1
Mai
n ca
nal
Seco
ndar
yca
nal
Terti
ary
cana
l
Land
deve
lopm
ent
On-
farm
irrig
atio
n
Farm
oper
atio
n
Agr
icul
tura
lsu
ppor
t Public-Med-1
Mai
n ca
nal
Seco
ndar
yca
nal
Terti
ary
cana
l
Land
deve
lopm
ent
On-
farm
irrig
atio
n
Farm
oper
atio
n
Agr
icul
tura
lsu
ppor
t
Governance Governance
Ownership /concession Public Ownership /
concession PublicInvestment&financing
Investment&financing
OMM Farmers / Farmers Association OMM Farmers
Public-Small-2
Mai
n ca
nal
Seco
ndar
yca
nal
Terti
ary
cana
l
Land
deve
lopm
ent
On-
farm
irrig
atio
n
Farm
oper
atio
n
Agr
icul
tura
lsu
ppor
t Public-Med-2
Mai
n ca
nal
Seco
ndar
yca
nal
Terti
ary
cana
l
Land
deve
lopm
ent
On-
farm
irrig
atio
n
Farm
oper
atio
n
Agr
icul
tura
lsu
ppor
t
Governance Governance
Ownership /concession Public Ownership /
concession PublicInvestment&financing Private Investment
&financing Private
OMM Private Farmers / Farmers Association OMM Private Farmers Fig. 6.6.1 Conceptual Diagram of Public and Private Demarcation of Irrigation System Management
- 113 -

Chapter 7
Cost Estimation

- 108 -
Chapter 7 Cost Estimation 7.1 Project Facility Plan 7.1.1 General The construction site is composed of the NDIS and KIS area. The construction work is broadly classified into the construction of the intake, canal construction and land development in NDIS, and concrete lining work in KIS. In addition, both projects include drainage improvement work. The construction of the project office, workshop, garage for OM machinery and equipment, rice dryers and rice storage facilities is categorized as architectural work. Procurement of OM and agricultural machinery and equipment is also included in the project. Local materials are available for all the work except the work for the gate hoist devices, which shall be imported from South Africa, for example, to ensure reliable quality for longer service life. The large-scale civil work, including that for the main and secondary canals, drainage canal excavation, maintenance, and farm roads, will be carried out mainly by the heavy construction machinery. The work for minor rehabilitation and small structures will be done by manpower with minor construction equipment. 7.1.2 Prominent Features of the Project Tables 7.1.1 and 7.1.2 indicate the prominent features of the project.
Table 7.1.1 Prominent Features of the Project (NDIS) Items Description Length / sites NDIP 1. Main irrigation canal Concrete lining (t=0.1m – 0.07m) 69.1 km 2. Secondary irrigation canal Concrete lining (t=0.07m)
Conduits (dia. 600 – 800mm) 115.5 km 9.6 km
3. Intake 2.0m × 2.0m × 3 lanes 3 sluice gate 4. Siphon 2.5m × 2.5m 7 sites 5. Drainage culverts 2.0m × 2.0m × 1 or 2 culverts 32 sites 6. Road culvert 2.5m × 4.0m (double culvert) − 2.0m × 1.0m
(single culvert) 266 sites
7. Drainage work Widening of drainage channel 33.5 km 8. Spillway and outlet 11 sites 9. Land development Land levelling, canal construction 6,450 ha 10. Agricultural facilities
10.1 Dry floor 400 m2/ site with partial roof 40 sites 10.2 Rice storage 100 m2/ site 40 sites 10.3 Large rice storage 600 m2/ site 1 site
11. Project office, etc. 11.1 Project office 420 m2 1 site 11.2 Dormitory 400 m2 (Project staff) 1 site 11.3 Workshop 600 m2 (OM machinery repair) 1 site 11.4 Garage 600 m2 (OM machinery and equipment) 1 site 11.5 Generator room 1 site 11.6 Toilet, fence, others l.s.
12. OM machinery and equipment l.s. 13. Agricultural equipment l.s.
- 114 -

- 109 -
Table 7.1.2 Prominent Features of the Project (KIS) Items Description Length / sites NDIP 1. Main irrigation canal Concrete lining (t=0.1m – 0.07m) 43.3 km
1.1 Akuse main canal 16.2 km 1.2 South Lower Level Canal 5.3 km 1.3 North Lower Level Canal 5.1 km 1.4 Distributary Z 8.1 km 1.5 Distributary Y 3.0 km 1.6 High Level Canal 5.6 km
2. Road culverts 2.0m × 2.5m × 2 5 sites 3. Drainage work Widening of drainage channel 8.2 km 4. Agricultural facilities
4.1 Dry floor 400 m2/ site with partial roof 43 sites 4.2 Rice storage 100 m2/ site 43 sites 4.3 Large rice storage 600 m2/ site 1 site
5. OM machinery and equipment l.s. 6. Agricultural equipment l.s.
7.2 Implementation Plan and Schedule (1) Implementation plan The original contracts are divided into several packages, including the package for building work, OM, and agricultural machinery/equipment procurement. Considering the urgent needs to rehabilitate the existing KIS irrigation systems, the package is recommended to be carried out in parallel with the main canal construction of NDIS in the extent of the Akuse main canal and the south low level canal. The north low level canal, distributaries Y and Z, and the high level canal are rehabilitated during the non-cultivated period in two rice cropping periods. As to the canal construction work, including the secondary canal of NDIS, there is no obstructive factor for the construction. The contracts of three to four packages are recommended considering the management capacity of the local contractors. It will be a significant achievement to secure quality control of the embankment of the main canal from 15 km to 30 km, where the canal is constructed on the relatively large embankment. Land-development work is composed of land levelling, lateral irrigation, drainage canal excavation, and farm road construction. Land development works are scheduled corresponding to the progress of the main and secondary canal construction for realizing earlier benefits. (2) Implementation schedule The number of monthly workable days for regular work, such as concrete work, and earthwork for the irrigation facilities, is estimated based on the rainfall data from 1990 to 2010. The estimate indicates that 25 days per month and 300 days per annum can be deemed as work days for the construction work. Considering an appropriate construction capacity of the heavy machinery for the earthwork—mainly compaction of the embankment—and the concrete production capacity of the mixing plant, it is necessary to include periods for mobilization and demarcation of three years and two years,
- 115 -

- 110 -
respectively, in order to complete the NDIS and KIS rehabilitation work. It is preferable to complete the construction of the project offices, dry floor, and rice storage facilities at an early stage. Bidding for the procurement of OM, and for agricultural machinery and equipment shall be announced early to ensure a period for machinery assembly and shipping of at least eight months. 7.3 Project Cost Estimate 7.3.1 Assumptions The following are assumptions of the cost estimates for both KIS rehabilitation work and NDIS:
1) Material costs were based on data in "Quantity Surveyor Issue 2, 2009, the Ghana Institution of Surveyors in 2090."
2) The exchange rate used in the estimates is US$1.00=GHC1.49 3) Construction cost is calculated on the basis of contracts with local contractors. 4) The physical contingency of 5 % of the total cost of the construction, equipment procurement,
administration, and engineering services is included in the project cost. 5) Price contingency is also taken into account at an annual price escalation rate of 2.0 percent.
7.3.2 Project Cost Project cost is comprised of following items:
1) Construction costs Construction costs are composed of direct cost, temporary and preparatory work, contractors’
expenses, overheads, profit, etc. Direct temporary costs, such as mobilization/demobilization of the construction machinery and equipment, and concrete plant installation is inclusive in the direct cost.
2) Temporary costs Temporary costs are composed of the cost for temporary roads, a stockpile yard, dewatering,
etc. 3) Site expenses Site expenses are the costs for the site office, material storage, warehouse, workshop,
accommodation facilities, material test, topographic survey, salary for the contractor's employees, medical expenses, and other expenses necessary to accommodate the construction work.
4) Administration costs Detailed design and construction work is undertaken by GIDA with assistance and advice
from a consultant. Administration cost is estimated at 1 % or 2 % percent of the construction cost of each project, taking required the technical level into account.
5) Engineering service costs Engineering service costs are estimated for the detailed design and construction supervisory
work undertaken by consultants. The consultants technically assist and advise the GIDA staff during the detailed design and construction supervision period. Engineering cost is equivalent
- 116 -

- 111 -
to 5 percent of the construction work. 6) Physical contingency The physical contingency of 5 % of the total cost of 1), 2) and 3) above is taken into account. 7) Price contingency The price contingency of 2 percent per annum is taken into account.
7.3.3 Cost Estimates The construction cost is composed of the direct construction cost, indirect cost, OM facility and equipment, agricultural equipment, land acquisition and compensation, administration, engineering services, physical contingency, and price contingency, as well as the tax. Project cost is summarized in Table 7.3.1 and 7.3.2 for NDIS and KIS, respectively.
- 117 -
- 112 -
Table 7.3.1 Project Cost (NDIS)
Description Amount
(GHC’000) Remarks
I. Construction Cost 1. Main irrigation canal construction 1.1 Earthwork 11,009.6 1.2 Concrete lining work 13,386.1 1.3 Intake construction 760.4 1.4 Siphon construction 3,494.9 1.5 Drainage culvert construction 1,472.1 1.6 Road culvert construction 604.4 1.7 Gate installation 512.8 1.8 Spillway, outlet works 267.1 Subtotal 1 31,507.4 2. Secondary canal construction 2.1 Earthwork 2,337.2 2.2 Concrete lining work 6,286.6 2.3 Siphon construction 408.1 2.4 Road culvert construction 931.2 2.5 Gate installation 2,124.0 2.6 Pipe line work 7,685.7 Subtotal 2 19,772.8 3. Drainage works 3.1 Earthwork 361.8 Subtotal 3 361.8 4. Land development 4.1 19,223.2 Subtotal 4 19,223.2 5. Warehouse, building works 5.1 Dryer, rice storage 1,316.8 5.2 Project office, workshop, etc. 1,150.3 Subtotal 5 2,467.1 Total (1+2+3+4+5) 73,332.3 6. Temporary cost 1,466.6 2 % of (1+2+3+4+5) 7. Site expense 7,479.9 10 % of (1+2+3+4+5+6) 8. Overhead and profit 6,852.3 8 % of (1+2+3+4+5+6+7) Total I. 88,861.1
II. Procurement cost for OM equipment 4,976.0 Total (I+II) 93,837.1
III. Administration cost 938.4 1 % of (I+II) IV. Engineering services 4,691.9 5 % of (I+II)
Total (I+II+III+IV) 99,467.4
V. Physical contingency 4,973.4 5 % of (I+II+III+IV)
VI. Price contingency 10,428.7 2 % per year of (I+II+III+IV) Total project cost 114,869.5
Note: Cost for agricultural machinery/equipment (GHC3,542,700). Land acquisition cost is excluded from the table.
- 118 -
- 113 -
Table 7.3.2 Project Cost (KIS)
Description
Amount
(GHC × 1000)
Remarks
I. Construction Cost
1. Akuse main canal 6,035.2
2. South lower level canal work (by pump station) 658.6
3. South lower level canal work (downstream of pump station)
649.8
4. North lower level canal work 525.1
5. Distributary Y canal work 251.9
6. Distributary Z canal work 762.6
7. High-level canal work 1,373.7
8. Gate installation including concrete works 581.6
9. Drainage works 977.1
10. Dryer, rice storage work 1,313.7
Total (1–10) 13,129.3
11. Temporary cost 262.6 2 % of (1-10)
12. Site expense 1,339.2 10 % of (1-11)
13. Overhead and profit 1,178.5 8 % of (1-12)
Total I. 15,909.6
II. Procurement cost for equipment
1. Procurement cost for OM equipment 2,326.7
2. Procurement cost for agricultural machinery
2,339.0
Total II. 4,665.7
Total (I+II) 20,575.3
III. Administration cost 364.7 2 % of (I+II)
IV. Engineering services 911.8 5 % of (I+II)
Total (I+II+III+IV) 21,851.8
V. Physical contingency 975.6 5 % of (I+II+III+IV)
VI. Price contingency 1,747.5 2% of (I+II+III+IV)
Total project cost 24,574.9
Note: Land acquisition cost is excluded from the table.
- 119 -

- 114 -
7.4 Annual Operation, and Maintenance Cost and Replacement Cost 7.4.1 Annual Operation and Maintenance Cost The costs for annual operation and maintenance at the full development stage are estimated to be about GHC 1.40 million (direct cost) for NDIS and GHC 0.71 million (direct cost) for KIS. The depreciation cost of machinery and equipment is excluded from OM cost. OM cost is comprised of the costs for salaries, wages of project staff, and running and maintenance costs, such as for fuel and lubricant for the irrigation facilities. OM cost for the irrigation facilities consists of rehabilitation of the concrete lining, gravel pavement repair, weeding, etc. Annual OM costs above are equivalent to about 1.6% and 4.5% of the construction cost of each project. Since the OM cost for KIS includes road maintenance, and salaries and wages of project staff, the amount is relatively high compared to that of NDIS. Table 7.4.1 indicates OM cost of both irrigation systems:
Table 7.4.1 Annual Operation and Maintenance Cost (NDIS)
Item of OM Quantity Cost (GHC × 1000) Remarks 1. Concrete lining 5% of lining concrete per year 847 Replace with concrete 2. Road pavement 30% of road pavement per
year 147 Including drainage ditch
excavation 3. Repair of embankment Embankment of canal, road 156 Weeding, gully protection4. Project staff salary 250 Total 1,400
Note: OM cost is composed of fuel, lubricant, maintenance and operators’ costs, thus, machinery cost (depreciation cost) is excluded from the OM cost.
(KIS) Item of OM Quantity Cost (GHC ‘000) Remarks 1. Concrete lining 5% of lining concrete per year 351 Replace with concrete 2. Road pavement 30% of road pavement per
year 54 Including drainage ditch
excavation 3. Repair of embankment Embankment of canal, road 52 Weeding, gully protection4. Project staff salary 250 Total 707
Note: OM cost is composed of fuel, lubricant, maintenance and operators’ costs, thus, machinery cost (depreciation cost) is excluded from the OM cost.
7.4.2 Replacement Cost The intake and division gates require replacement within the project’s useful lifetime because the facilities have a shorter useful life than civil works. The replacement cost is estimated to be about GHC 1.23 million for 10 year replacement for the small gates, and GHC 0.36 million for the large gates of NDIP. Similarly, GHC 0.27 million for 10 year replacement for the small gates and GHC 0.04 million for large gates are estimated for KIS. OM, and agricultural machinery and equipment would also be replaced after ten consecutive years of use. 7.5 Disbursement Schedule The disbursement schedule is shown on Tables 7.5.1 and 7.5.2.
- 120 -

- 115 -
Table 7.5.1 Cost Schedule (NDIS) Amount (GHC × 1000)
Year 2011 2012 2013 2014 2015 2016 Total
1 2 3 4 5 6
I. Construction work
1. Main irrigation canal construction
0.0 0.0 0.0 9,452.2 12,603.0 9,452.2 31,507.4
2. Secondary canal construction
0.0 0.0 0.0 3,626.1 4,834.9 3,626.1 12,087.1
3. Drainage works 0.0 0.0 0.0 0.0 361.8 0.0 361.8
4. Land development 0.0 0.0 0.0 5,767.0 7,689.2 5,767.0 19,223.2
5. Warehouse, building works
0.0 0.0 0.0 2,467.1 0.0 0.0 2,467.1
6. Temporary work 0.0 0.0 0.0 426.2 509.8 376.9 1,312.9
7. Site expense 0.0 0.0 0.0 2,173.9 2,599.9 1,922.2 6,696.0
8. Overhead and profit 0.0 0.0 0.0 1,913.0 2,287.8 1,691.6 5,892.4
II. Procurement cost for OM equipment
0.0 0.0 0.0 0.0 4,976.0 0.0 4,976.0
III. Administration 84.5 84.5 169.0 169.1 169.1 169.0 845.2
IV. Engineering services service 845.2 1,267.9 845.2 422.6 422.7 422.6 4,226.2
V. Physical contingency 46.5 67.6 50.7 1,320.9 1,822.7 1,171.4 4,479.8
VI. Price contingency 19.5 56.8 63.9 2,219.0 3,827.7 3,197.9 9,384.8
995.7 1,476.8 1,128.8 29,957.1 42,104.6 27,796.9 103,459.9
Note: The cost for agricultural machinery/equipment (GHC 3,542,700) is excluded from the table.
- 121 -

- 116 -
Table 7.5.2 Cost Schedule (KIS) Amount (GHC ×1000)
Year 2011 2012 2013 2014 2015 Total 1 2 3 4 5
I. Construction work
1. Akuse main canal 0.0 0.0 0.0 3,017.6 3,017.6 6,035.2 2. South lower level Canal
work (by pump station) 0.0 0.0 0.0 329.3 329.3 658.6
3. South lower level canal
work (downstream of Pump station)
0.0 0.0 0.0 324.9 324.9 649.8
4. North lower level canal
work 0.0 0.0 0.0 262.6 262.5 525.1
5. Distributary Y canal work 0.0 0.0 0.0 126.0 125.9 251.9 6. Distributary Z canal work 0.0 0.0 0.0 381.3 381.3 762.6 7. High-level canal work 0.0 0.0 0.0 686.9 686.8 1,373.7 8. Gate installation 0.0 0.0 0.0 290.8 290.8 581.6 9. Drainage work 0.0 0.0 0.0 977.1 0.0 977.1 10
. Dryer, rice-storage work 0.0 0.0 0.0 1,313.7 0.0 1,313.7
11
. Temporary work 0.0 0.0 0.0 154.2 108.4 262.6
12
. Site expense 0.0 0.0 0.0 786.4 552.8 1,339.2
13
. Overhead and profit 0.0 0.0 0.0 692.1 486.4 1,178.5
II. Procurement cost for OM
equipment 0.0 0.0 0.0 2,326.7 0.0 2,326.7
III. Administration 36.5 36.5 109.4 109.4 72.9 364.7
IV. Engineering services 182.4 273.5 182.4 182.4 91.1 911.8
V. Physical contingency 10.9 15.5 14.6 598.1 336.5 975.6 VI. Price contingency 4.6 13.0 18.4 1,004.8 706.7 1,747.5
Total 234.4 338.5 324.8 13,564.3 7,773.9 22,235.9
Note: The cost for agricultural machinery equipment (GHC 2,339,000) is excluded from the table.
- 122 -

- 117 -
7.6 Preliminary Estimation of Irrigation Service Charge (1) Conditions of estimation Irrigation Service Charge (ISC) comprises three components, namely the land rent fee, water fee, and development fee. The administration fee, which is included in the ISC of KIS, is considered as included in the water fee in this study. Land Rent Fee: The land rent fee is not considered in the study because the price of the land lease is not yet decided. Water Fee: The water fee is to be set to cover the necessary cost for operation and maintenance of the infrastructure managed by the project. The administration cost required for the management of the project office is considered as included in the operation cost and labour cost (human expense of the project office) as mentioned above. The replacement cost of hydraulic structures, as well as construction machinery, is allocated to the annual maintenance cost equitably by dividing the purchase cost by the life period. KIP and SMC shall allocate the replacement cost into the special account in preparation for replacement. Development Fee: The development fee is to be set to cover the construction cost of 1) main irrigation canal, 2) secondary irrigation canal and 3) drainage work, which are burdened by the government cost. Those costs are divided by the project life (50 years) and disbursed to the annual development fee equitably. 6) Temporary cost, 7) site expense, 8) overhead and profit, 9) administration cost, 10) engineering cost, and 11) physical contingency are included in the construction cost for calculating the development fee. Demarcation of construction cost of secondary canal in the private block: The secondary canal of NDIS is constructed using government funds up to the boundary of the block (distance of delivery canal), and the length after the boundary (distance of on-farm canal) is to be paid for by the private sector—the large-scale farms in principal. However, the length of the pipeline in the hilly area is to be constructed by the governmental cost. The billing structure of ISC by farm type is assumed as shown below:
Table7.6.1 Billing Structure of ISC by Farm Type Farm Type Irrigation Service Charge
Land Rent Fee* Development Fee Water Fee
Large-scale farms ● ● ●
Medium-scale farmers ● ●
Small-scale farmers ● ●
Note *: The land rent fee is not considered in this study.
- 123 -

- 118 -
(2) Preliminary estimation of ISC prices The ISC prices of KIS and NDIS are estimated as shown below:
Table7.6.2(1) Preliminary Estimation of ISC Price of KIS Farm Type Irrigation Service Charge (GHC/ha-year)
Development Fee Water Fee Total ISC
Large-scale farms 78 243 322
Small-scale farms 243 243
Note: ISC price is estimated based on the reference price of 2011.
Table 7.6.2(2) Preliminary Estimation of ISC Price of NDIS Farm Type Irrigation Service Charge (GHC/ha-year)
Development Fee Water Fee Total ISC
Large-scale farms 178 276 431
Medium-scale farmers 276 276
Small-scale farmers 276 276
Note: ISC price is estimated based on the reference price of 2011.
(3) ISC in Farm Budget ISC prices were assessed based on each farm type’s share of the financial crop budget. The ratio of ISC to production cost and net return are as shown below: Table 7.6.3 Ratio of ISC to Production Cost in Financial Crop Budget per ha of Rice with Project
Irrigation Scheme
Farmer Type ISC (GHC)
Total Production Cost (GHC) Ratio of ISC to Production Cost Major
Season Minor Season Annual
KIS Large-scale 322 Small-scale 243 1,074 1,074 2,148 11.3%
NDIS Large-scale 431 866 866 1,732 24.9% Medium-scale 276 1,079 1,079 2,158 12.8% Small-scale 276 1,204 1,204 2,408 11.4%
Table 7.6.4 Ratio of ISC to Net Return in Financial Crop Budget per ha of Rice with Project Irrigation Scheme
Farmer Type ISC (GHC)
Net Return (GHC) Ratio of ISC to Net Return Major
Season Minor Season Annual
KIS Large-scale 322 Small-scale 243 2,281 2,611 4,892 5.0%
NDIS Large-scale 431 2,794 3,154 5,948 7.2% Medium-scale 276 2,276 2,606 4,882 5.6% Small-scale 276 1,846 2,146 3,992 6.9%
- 124 -

- 119 -
(4) Farmer’s Responsibility other than ISC Farms are to pay for the maintenance of on-farm level infrastructure. The on-farm OM cost is estimated to be 160 GHC/ha. In the case of large-scale farms of NDIS, the maintenance cost of the secondary canal within a block (on-farm secondary canal), which is estimated to be 23 GHC/ha, is to be added to the above cost.
Table 7.6.5 Ratio of On-farm OM Cost to Net return in Financial Crop Budget per ha of Rice with Project
Irrigation Scheme
Farmer Type On-farm OM Cost(GHC)
Total Production Cost (GHC)
Ratio to Production
Cost
Net Return (GHC)
Ratio to Net Return
KIS Large-scale Small-scale 160 2,148 7.4% 4,892 3.3%
NDIS Large-scale 183 1,732 10.6% 5,948 3.1% Medium-scale 160 2,158 7.4% 4,882 3.3% Small-scale 160 2,408 6.6% 3,992 4.0%
Apart from the on-farm OM cost, large-scale farms in NDIS are required to bear the land development cost as an initial investment. The land development cost, including the cost of 30% of land for small-scale farmers, is estimated to be 7,055 GHC/ha, which is equivalent to the depreciation cost of 706 GHC/ha-year for 10 years. On the condition that large-scale farms would be exempt from the land development cost of small-scale farms, the land development cost of large-scale farms would be 4,939 GHC/ha, which is equivalent to the depreciation cost of 494 GHC/ha-year for 10 years. The cost of ISC, on-farm OM, and land development for large-scale farms is estimated to be 1,108 GHC/ha, which is equivalent to a net-return of 18.6% in the financial crop budget in the case of adopting the project.
Table 7.6.6 ISC, On-farm OM and Land Development Cost, and Ratio to Net Return
Irrigation Scheme
Farmer typeISC
(GHC/ha-year)
On-farm OM Cost
(GHC/ha-year)
Depreciation of land
development (GHC/ha-year)
Total cost (GHC/ha-year)
Ratio to net return
KIS Large-scale 322 Small-scale 243 160 403 8.2%
NDIS Large-scale 431 183 706 1,319 22.2% 431 183 494 1,108 18.6% Medium-scal
e 276 160
436 8.9%
Small-scale 276 160 436 10.9%
- 125 -

- 120 -
(5) Recommendation on Cost Burden of ISC Small-scale farmers in KIS: The estimated ISC price is 243 GHC/ha, which is equivalent to almost double the current price (120 GHC/ha). The deficit of ISC revenue is covered by the budget allocation for human expense by GIDA at the moment. According to the Willingness to Pay (WTP) survey in KIS, most farmers would accept an increase of the ISC price if the irrigation service would be improved after rehabilitation. However, the average price that farmers are willing to pay after rehabilitation is 134 GHC/ha, meaning that there is still a big difference from the estimated price. In consideration of the current situation of ISC recovery, it seems that such a big increase of ISC would be difficult, so it is advisable to raise the price after a few years of showing the results of service increase. Large-scale farms in KIS: It is recommended to start discussing the post-rehabilitation increase of the ISC price based on the above estimation upon the renewal of contracts, scheduled for 2012. It is also necessary to start the procedure for transferring the ISC of the banana estate, which is now allocated in the revenue of GIDA HQ, to the IGF of KIP. Small-scale farmers in NDIS: The estimated price of ISC for small-scale farmers, 276 GHC/ha, in NDIS is considered expensive in comparison with prices in other GIDA projects, including the current KIP price. Considering that most small farmers of NDIS are expected to be new to irrigation agriculture or rice cultivation, it is recommended to provide a governmental subsidy to their ISC for a few years until their farm management would be stabilized. Large-scale farms in NDIS: The annual burden of ISC, on-farm OM cost, and land development cost of large-scale farms in NDIS occupy over 20% of the expected net return of the crop budget. It might be difficult to bear in some cases. According to the results of the future market test, it might be necessary to consider governmental support for land development for small-scale farms, which is to be borne by large-scale farms in the private development block. Annex G.5 Preliminary Estimation of ISC and Share in Farm Economy
- 126 -

Chapter 8
Project Evaluation

- 121 -
Chapter 8 Project Evaluation 8.1 Objectives The objectives of the project evaluation are:
- To examine the economic viability of the proposed project, - To examine the financial impact of investment of the proposed project on beneficiary farmers
capacity to pay in each irrigation scheme, and - To examine the indirect benefits, intangible benefits, and socio-economic impact of the
proposed project. The results of the examinations are to be employed as factors in judging the economic viability, financial soundness, and social acceptance of the project. 8.2 Proposed Project for Evaluation The present project evaluation is made on the two irrigation schemes (KIS & NDIS) and the overall Accra Plains Gravity Irrigation Project (APGIP) as follows:
Table 8.2.1 List of Evaluated Irrigation Schemes & Project Project/Irrigation Block Project Area (ha)* (%)
Kpong Irrigation Scheme (KIS) 4,100 ha 37 New Developed Irrigation Scheme (NDIS) 6,900 ha 63 Accra Plains Gravity Irrigation Project (APGIP) 11,000 ha 100
*: Net area
8.3 Economic Evaluation 8.3.1 Economic Evaluation Procedures Both the project benefits and costs are estimated based on the following conditions or assumptions:
- All the prices are expressed in constant prices as of the beginning of 2011, and the foreign currency exchange rate is fixed at US$ 1.00 = GHC 1.49,
- The project life is assumed to be 50 years, starting from 2014, which is the proposed year for the commencement of project implementation,
- Farm-gate prices of internationally traded agricultural inputs and outputs are calculated in the form of export or import parity prices, as shown in Annex H-1.
- A standard conversion factor (SCF) of 0.90 was applied.8 Annex H-2 summarized the prices applied for the estimation of economic crop budgets. Transfer payments, such as taxes, duties, and subsidy interest, were excluded in estimating the economic benefits and costs. Financial construction costs were converted into economic costs using the conversion factor of 0.765 {financial cost − (VAT/NHIL 15%) × SCF},
8 SCF applied in World Bank project, “Ghana Social Opportunity Project,” effective from November, 2010
- 127 -

- 122 -
- Basically, it was assumed that the case of not adopting the project is actually the same as the present condition, and that, in Prairie Volta Farm, the expansion of rice fields to 561 ha is carried out as scheduled by the farm from 2011 to 2022
- Sunk costs were not taken into consideration in the economic evaluation. - Because of rather limited accessibility to economic data on the agri-business farms operating
in the project area, the following approaches were taken in the project evaluation.
Agri-business Farms Approaches in Economic Evaluation Golden Exotics Farm Only the planned extension area of 600 ha is taken into consideration for
economic evaluation. No changes between the cases of adopting the project and not adopting it are assumed in the existing farm.
Cassi Farm
Excluded from economic evaluation because no direct effects on their farm operation will be brought in the case of adopting the project. No changes in NPV (net production value) between the cases of adopting the project and not adopting it are assumed.
Prairie Volta Farm
- To avoid complexity in project evaluation, the Aveyime Scheme, located within the NDIS
Area, was included in the evaluation of the NDIS as the planned areal extent of the former is only 75 ha or accounts only for 1% of the NDIS Area.
8.3.2 Economic Benefits (1) Irrigation and Drainage Benefit (Crop Production Increase) The project irrigation and drainage benefit will accrue from land use conversion from upland fields/grassland to irrigated fields, and from the increase in cropping areas and productivity of the target crop, irrigated rice. The economic benefit was estimated as the increment net production value in the future between the cases of adopting the project and not adopting it. The economic crop budgets of subject crops were prepared for both of such cases by applying prices (Annex H-3 to H-5). The project benefits (increment of net production value) of KIS, NDIS and the project (APGIP) are estimated as shown in Annex H-6 to H-8 and are summarized in the following table.
Table 8.3.1 Economic Irrigation and Drainage Benefit Net Production Value (GHC’000)
Project AreaAdopting the
project Not adopting
the project Increment
Project/Scheme Kpong Irrigation Scheme (KIS) 4,100 ha 23,429 12,865 10,564 New Developed Irrigation Scheme (NDIS) 6,900 ha 29,220 5,477 23,743 Accra Plains Gravity Irrigation Project (APGIP) 11,000 ha 52,649 18,342 34,307
The annual economic benefit flow was estimated based on the progress of the area to be developed. The project benefit is assumed to be realized from 2016 in all the KIS, NDIS and APGIP. The attainment of the target yields and the full development stage assumed for the project evaluation are as follows:
- 128 -

- 123 -
Table 8.3.2 Assumptions on Full Development Stage and Build-up Period Assumed
Project/Scheme Project Area
(ha)
Target Yield Attained/ Full Development
(major season)
Build-up Period(years)
Kpong Irrigation Scheme (KIS) 4,100 2020 5 New Developed Irrigation Scheme (NDIS) 6,900 2022 7 Accra Plains Gravity Irrigation Project (APGIP) 11,000 2022 7
Based on these assumptions, the build-up of project irrigation & drainage benefits of individual irrigation schemes and the project are estimated as shown in the following table. The full project benefit is realized from 2022 onward, the 9th year after the commencement of the project implementation.
Table 8.3.3 Build-up of Irrigation & Drainage Benefits in Proportion
The details of economic benefit flows are presented in Annex H-9. (2) Other Anticipated Project Benefits Reducing OMM costs by lining the main canal in the KIS, and reducing the pumping cost in the Prairie Volta Farm (in NDIS) by introducing gravity irrigation under the project are expected as shown in the following table.
Table 8.3.4 Other Project Benefits
(3) Project Benefits The full project benefit is realized from 2020 onward in the KIS and 2022 in NDIS and APGIP. The estimated economic project benefit streams are presented in Annex H-9 and summarized as follows:
Table 8.3.5 Annual Increases in Project Benefits
Irrigation Block With-project 1/ With-out Project 1/ Saving/YearKIS Main canal OMM cost/year: Main canal OMM cost/year: Financial: GHC 45,200; economic: GHC 36,100
Financial:GHC 63,200 Financial:GHC 108,400Prairie V. Farm Gravity irrigation water supply Annual pumping cost: Financial: GHC 626,400; economic: GHC458,000
Financial: GHC 626,400; economic: GHC458,0001/: Source – JICA Study Team (KIS) & Prairie Volta Farm
Items Unit 2016 2017 2018 2019 2020 2021 2022 2023Cropped Area 1/ ha 9,100 20,200 20,200 20,200 20,200 20,200 20,200 20,200 - KIS ha 6,400 6,400 6,400 6,400 6,400 6,400 6,400 6,400 - NDIS ha 2,700 13,800 13,800 13,800 13,800 13,800 13,800 13,800Incremental Benefit 2/ - KIS GHC 000 5,171 7,812 8,868 9,396 10,453 10,453 10,453 10,453 - NDIS GHC 000 2,651 11673 14,577 17,609 19,983 22,357 24,202 24,202 - APGIP GHC 000 7,822 19,485 23,445 27,005 30,436 32,810 34,655 34,6551/: Cropped area under irrigation; banana cropped area 1,800ha/year 2/: Total project benefit
Year
IrrigationScheme/Project 2016 2017 2018 2019 2020 2021 2022
KIS 50 75 85 90 100 100 100NDIS 11 47 59 72 82 92 100 - No. 1 Area 25 50 65 75 85 95 100 - No. 2 Area - 45 55 70 80 90 100
APGIP 23 56 67 78 88 95 100
Year
- 129 -

- 124 -
8.3.3 Negative Benefit The agricultural production foregone in farmland located outside the project area acquired for the construction of irrigation & drainage and other physical facilities, and the loss of generated power due to the use of water from the Kpong dam for irrigation purposes are the tangible negative benefits of the project. Under the project, a limited portion of farmland in the project area is acquired for the construction of physical facilities. Changes to “right of way” areas have been taken into account in the future in the land-use plan for the case of adopting the project, therefore, production foregone in such areas is not considered as a negative benefit in estimating the annual economic benefit. The tangible negative benefits under the project are estimated as follows:
Table 8.3.6 Estimation of Annual Tangible Negative Benefits under Project Farm Land Acquired for Right-of ways Area NPV/year Financial Economic (Outside project area) 200 ha GHC 1,133,000 GHC 1,133,000 GHC 56,200Loss of generated power Water Use/Year Loss of Power/Year Financial Economic - KIS 79.7 million m3 1.88 million kWh GHC 164,000 GHC 148,000 - NDIS 158.6 million m3 3.73 million kWh GHC 729,000 GHC 656,000
Annual Negative Benefits - - GHC 2,026,000 GHC 860,000
8.3.4 Economic Cost The economic project investment costs include the following cost items:
- Preparatory works, - Direct construction cost, including intake facilities, main and secondary systems, drainage
works, rehabilitation works of physical facilities, on-farm development, miscellaneous works, and contractor’s expenses,
- OMM equipment and farm machinery, - Annual OMM cost, major repairing cost and replacement cost, - Administration cost, consulting service cost, and - Physical contingencies
The economic project investment cost was estimated by applying conversion factors as indicated in Annex H-10. The annual OMM cost, major repairing cost, and replacement cost were converted to economic values from financial cost by multiplying SCF. The annual disbursement of the estimated project economic cost scheduled according to the construction schedule is presented in Annex H-11 and summarized below.
Table 8.3.7 Disbursement Schedule of Project Investment Cost
Unit: GHC 000
Items 2013 2014 2015 2016 2017 & on TotalInitial Investment Cost 1,138.9 38,869.4 50,065.0 26,545.8 116,619Annual OMM Cost 524.3 1,420.0 -
Total 1,138.9 38,869.4 50,065.0 27,070.1 1,420.0 -Major Repairing/Replacement Cost from 2024 every 10 years: 3,821.8; from 2025 every 20 years: 10,052.4
from 2035 every 20 years: 10,125.2
Year
- 130 -

- 125 -
8.3.5 Economic Evaluation and Sensitivity Analysis The economic cost and benefit streams for 51 years (project life of 50 years plus preparatory work over 1 year), comprising the preparatory work, project investment cost, annual OMM cost, repairing & replacement cost for the stream and irrigation & drainage benefit, other benefits, and negative benefits are presented in Annex H-9 & H-11. The results of economic evaluations are expressed by the economic internal rate of return (EIRR) and Net Present Value (B-C) and benefit-cost ratio (B/C) at a discount rate of 12% are presented in Annex H-12 and summarized below.
Table 8.3.8 Results of Economic Evaluation
Project/Scheme EIRR (%)
Present Value (at 12% discount rate) (GHC × 1000)
Benefit Cost B - C B/C Ratio KIS 20.8 56,050 31,733 24,317 1.8 NDIS 19.3 110,768 64,374 46,394 1.7 APGIP 19.8 166,818 96,107 70,711 1.7
As shown in the table, it can be said that the two irrigation schemes and the project are economically viable under the conditions set up as described earlier. A sensitivity analysis was made for the following five cases.
- Case 1 Construction cost: up 10 %, - Case 2 Irrigation & drainage benefit (crop production benefit): down 10 %, - Case 3 Irrigation water supply (construction works): 1 year delay, - Case 4 Target yields of paddies: down about 10% (about 14% less than irrigation/drainage
benefit) as follows.
Case KIS
(t/ha) Small-scale Farm
(t/ha) Medium-scale Farm
(t/ha) Large-scale Farm
(t/ha) Normal 5.5 5.0 5.5 6.0 Case 4 5.0 4.5 5.0 5.5
- Case 5 Case 1 combined with Case 2.
The results of sensitivity analyses are expressed similarly by the economic internal rate of return (EIRR), net present value (B−C), and benefit-cost ratio (B/C) at the discount rate of 12% are presented in Annex H-13 to H-17 and summarized in the following table.
Table 8.3.9 Results of Sensitivity Analysis of the Project Schemes/Project Indicator Case 1 Case 2 Case 3 Case 4 Case 5 Normal
KIS EIRR (%) 20.1 18.9 20.3 18.3 18.2 20.8 B/C Ratio 1.7 1.6 1.7 1.5 1.5 1.8
NDIS EIRR (%) 17.9 17.7 18.1 17.0 16.4 19.3 B/C Ratio 1.6 1.6 1.6 1.5 1.4 1.7
APGIP EIRR (%) 18.6 18.1 18.8 17.4 17.0 19.8 B/C Ratio 1.6 1.6 1.7 1.5 1.5 1.7
As shown, the project economic viability will not be seriously affected by the changes in the conditions examined in the present sensitivity analysis. However, as the decreases of target yields will affect the project economic viability most (Case 4), the strengthening of extension and agricultural
- 131 -

- 126 -
support services is considered essential for the attainment of target yield levels at the earliest stage possible. 8.3.6 Comparison with the Previous FS Study The comparison of the economic evaluation results between the present Pre-F/S and the F/S on 5,000ha (1st Priority Area) is as follows:
Table 8.3.10 Comparison of Economic Evaluation Results Subject Study EIRR (%) B/C Ratio
Present Pre-F/S (NDIS) 19.3 1.7 (at 12% discount rate) F/S on 5,000ha by Studi International* 20.4 2.2 (at 10% discount rate)
*: Mixed scenario-agribusiness, large-scale & small-scale farmers Source - Studi Report 5,000ha
8.4 Financial Evaluation (1) Capacity-to-pay The financial evaluation of the project was carried out from a farm-economics view point. However, because of the limited accessibility to information on farm economic conditions in the project area, the evaluation was made by examining the incremental capacity-to-pay of small-scale farms in KIS and NDIS. The assumptions set for the evaluation are as follows:
Table 8.4.1 Assumptions for Financial Analysis on Small-scale Farms (Typical Farm) Items KIS NDIS
Typical farm size 1.0ha/farm 1.5ha/farm Cropping pattern Double cropping of rice Double cropping of rice Proportion of family labour to total 40% 30% Crop budgets applied No project: Table D-1, with: Table D-4 No project: Table D-1, with: Table D-4
The results of the evaluation based on the assumptions are as follows:
Table 8.4.2 Results of Financial Analysis on Small-scale Farms (Incremental Net Return) 1/ Unit: GHC
Adopting/Not adopting the project*
KIS (1.0 ha/farm) NDIS (1.5 ha/farm) Major Season
Minor Season
Annual Major Season
Minor Season
Annual
Present/Adopting project
- Gross Return 2,867 2,680 5,547 1,769 324 2,093 - Net Return 1,772 1,573 3,345 1,086 179 1,265With-Project - Gross Return 3,355 3,685 7,040 4,575 5,025 9,600 - Net Return 2,281 2,611 4,892 2,769 3,219 5,988
Increment 509 1,038 1,547 1,683 3,040 4,723*: Refer to Tables D-1 & D-4 in the Annex
The incremental net return in the case of adopting the project is GHC 1,547 in KIS and GHC 4,723 in NDIS. On the basis of the estimated irrigation service charges under the project and the assumption on interests due for farm credit, the capacity-to-pay of the small-scale farms is examined as follows:
- 132 -

- 127 -
Table 8.4.3 Examination of Capacity-to-Pay in Case of Adopting Project1 Item KIS: 1.0ha/farm (GHC) NDIS: 1.5ha/farm (GHC)
Net Return per Farm 4,892 100 % 5,988 100 % Irrigation Service Charges (ISC)2 243 5.0 % 414 6.9 % Credit Interest3 139 2.8 % 294 4.9 % Net Surplus 4,510 92.2 % 5,280 88.2 %
1: At full development stage onward 2: ISC (including water fee) estimated in the Section 7.6 3 Assuming: (Farm machinery hiring cost + farm inputs cost) × 24 % × 6/12 × 2 seasons
As shown, the net surpluses of GHC 4,510 (92% of net return) in KIS and of GHC 5,280 (88% of net return) in NDIS are expected under the project. This reveals that beneficiary farmers can fully shoulder the annual irrigation service charges (OMM cost & others) and interests levied on farm credit services. (2) FIRR (Financial Internal Rate of Return) The FIRRs of the project were calculated by applying financial costs and benefits as shown in Annex H-18 and as summarized in the following table.
Table 8.4.4 FIRR (Financial Internal Rate of Return) of the Project
Project/Scheme FIRR (%)
Present Value (at 12% discount rate) (GHC × 1000)
Benefit Cost B−C B/C Ratio KIS 21.6 71,675 38,500 33,085 1.9 NDIS 14.7 113,153 90,123 23,030 1.3 APGIP 16.8 184,828 128,714 56,115 1.4
8.5 Socio-economic Impact, Indirect Benefits and Intangible Benefits 8.5.1 Socio-economic Impact (1) Creation of Employment Opportunities In addition to the huge impact on the national economy of the incremental production of paddies (i.e. 75,300 tons) or rice (i.e. 48,900 tons) and the impact of reducing foreign exchange costs by some US$25.6 million at the full development stage and onward, the most important anticipated socio-economic impact of the project on the society and people in and around the project area is the creation of employment opportunities. The incremental employment opportunities under the project in comparison with the case of not adopting the project are estimated as follows:
- 133 -

- 128 -
Table 8.5.1 Increased Employment Opportunities under the With-project
(mandays) (%)
KIS -Irrigated Rice Field 2,300 4,600 570,400 1,852 1,274 175,812 1,440 174,240 350,052 220,348 -Banana Farm1/ 1,800 1,800 450,000 1,200 1,200 300,000 300,000 150,000 -Upland Field 600 600 69,000 180 21,600 90,600 -90,600 -Others 210 658 658
Sub-total 4,310 6,400 1,020,400 4,310 3,732 544,812 195,840 740,652 279,748 138NDIS -Irrigated Rice Field 5,687 11,374 613,110 613,110 -Upland Field 3,309 3,309 380,535 993 119,160 499,695 -499,695 -Others 297 2,675
Sub-total 5,984 11,374 613,110 5,984 3,309 380,535 119,160 499,695 113,415 123Total (APGIP) 10,294 17,774 1,633,510 10,294 7,041 925,347 315,000 1,240,347 393,163 132
CroppedArea(ha)
1/: Assumed 1 permanent staff/ha; souce: Golden Exotics Farm
Minor Season
CroppedArea(ha)
LabourRequirements
(mandays)
AnnualLabour
Requirements(mandays)
IncrementalLabour
Requirements
Note: Prairie Volta Farm&Cassi Farm not included since no chanes in labour requirements between with & without project assumed
LabourRequirements
(mandays)
Scheme/Land Use Area(ha)
AnnualLabour
Requirements(mandays)
CroppedArea(ha)
Area(ha)
Major Season
With-project Without-project
As shown in the table, the creation of employment opportunities of about 393,000 man-days or some 1,600 fulltime workers (farmers) is anticipated under the project. The future employment opportunities under the project are roughly about 130% of the same under present conditions. Further, in addition to the creation of employment opportunities in farming, increased job opportunities in the fields of processing, transportation, and marketing of products are expected. (2) Activation of District/Regional Economy Marketing of farm inputs and outputs would expand drastically under the project and farmers’ purchasing power capacity would increase substantially along with the improvement of farm incomes. These would contribute to the activation of district/regional economy. 8.5.2 Indirect Benefits The livestock sub-sector is another important economic activity in and around the project area. Under the project, the incremental production of rice straw of approximately 75,000 tons (when assuming straw/grain rate = 1) is expected. The volume is roughly estimated to be the monthly roughage requirements of approximately 75,000 cattle (assuming roughage requirement/head/month = 1.0 ton) and will greatly contribute to the roughage supply in a dry season when cattle in and around the area suffer from a shortage of roughage/grasses. In addition to straw, by-products of rice bran and broken rice (about 10% of paddies) could be used for quality animal feeds when rice milling is done in the large-scale rice mill of Prairie Volta Farm or mills in and around the project area. 8.5.3 Intangible Benefits Ancillary business chances created in the course of processing, transporting and transacting of rice/paddies, and attributed to the project implementation could be regarded as typical intangible benefits that will contribute to rural and individual farm economies through an increase in inputs to be purchased and transported, as well as the value addition of outputs.
- 134 -


Chapter 9
Conclusion and Recommendations
- 129 -
Chapter 9 Conclusion and Recommendations 9.1 Conclusion The proposed gravitational irrigation system of the Accra Plains Gravity Irrigation Project taking water from the Kpong Dam has strong potential for development and is deemed to be technically and economically feasible at the pre-feasibility level of the study. The unit costs per hectare of the APGIP for the construction cost and operation & maintenance cost derived from the study show that these costs are almost half those of the pump irrigation system of the APIP studied in 2010. The investment cost as well as OM cost for the gravity irrigation system of the APGIP has proven to have very high advantages compared with a pump irrigation system. It is concluded that the implementation of the proposed project contributes greatly to the national economy on the basis of commercial agriculture as well as poverty eradication through stabilization and improvement of commercial oriented smallholders’ paddy rice production. It also greatly contributes to increasing the rice production by a gravitational irrigation system with less operation and maintenance cost, thus resulting in the reduction of importing rice from other countries and reducing the expenditure of foreign currency. 9.2 Recommendations The Accra Plains development for irrigated agriculture will be the flagship project in the GOG, as mentioned in important policies. A Full Feasibility Study is recommended to be performed as soon as possible. It is recommended to MoFA/GIDA to take the initiative as the leading ministry for implementing the project in close coordination and collaboration with the concerned authorities and agencies. However, it is necessary to tackle the following hurdles as early as possible:
1) Investigating potential commercial enterprises and conducting a study for financial analysis for evaluation and management of the project.
2) In preparing a necessary procedure to proceed to the next step of full feasibility study, it will
be necessary to take action to collaborate with related authorities and donors. Further Study Items Needed to undertake the Full-Scale Feasibility Study 1. Necessary Information (1) In the pre-feasibility study, the irrigation and drainage planning was formulated based on the
5 m contour line map of DTM (Digital Terrain Model). Although the DTM with a 1 m contour line was also provided at the end of the study, the 1 m counter line of the DTM was not clear, so it was not used for the facility planning or the land development plan. It is necessary to obtain a clear contour line map or digital mesh elevation data to prepare a detailed topographic map in order to review the route of the main and secondary canals as well as the boundary of the land development area.
- 135 -

- 130 -
(2) Topographic and Geological Survey
The topographic survey covered only the specified route of the main canal of the intake, siphon, and the large embankment areas. However, it is necessary to conduct a topographic survey all along the line of the main canal and secondary canals, including a plain survey at the intake, siphon and diversion points at several locations. In addition, it is also necessary to conduct a geological survey to examine the bearing stress and profile of the foundation of the intake, siphon, and the large embankment portion. A soil test is also to be conducted to examine the stability of the embankment.
(3) Census in 2010
The population, and the number of the farm households in the project area were estimated based on previous census data, and the data obtained through the hearing survey from the District offices. In the Feasibility Study, it is necessary to update these demographic data by using Census 2010 data.
2. Project Cost
After the revision of canal alignment, the project cost shall be reviewed with an accurate quantity survey of the concrete lining and earth movement volume of the canal. The unit cost of labour, materials and operation cost of the construction machinery shall also be reviewed by doing a latest cost survey.
3. Farming Plan
In the pre-feasibility study, the irrigated rice is envisioned in the irrigation schemes on the basis that the rice cultivation needs a larger water requirement and that the market price of rice is relatively stable. It is necessary to examine the profitability and marketability of other target crops to encourage the entry of large-scale farmers in the project.
4. Project Benefit
Allocation of farmland The decision process of the farmland allotment between the small farmers and the commercial farmers shall be clarified in line with the policy of the government as described in the draft of LI-1350. The introduction of PPP may impose a tremendous burden on large-scale farmers due to certain unfavourable conditions of PPP operation. Therefore, the allocation of the project investment cost between the large and the small holders, and the agricultural support policy for the small holders shall be discussed and clarified first. Since the land-sharing balance of the various farmers groups have a crucial impact on the economical evaluation as well as the financial evaluation of the project, it is necessary to propose an effective technique on the land sharing between the commercial, small, and medium-scale farmers in accordance with the survey result of the market test proposed by the World Bank. In addition, the roles of the Ghana Irrigation Development Authority (GIDA) shall be discussed when a private
- 136 -

- 131 -
company is employed for the operation and maintenance of the entire irrigation system. The Government policy of land sharing between the small holders and the large-scale farmers is unclear in the government development project. It is necessary to review the land sharing ratio of 7:3 of large and small holders, which is described in LI-1350.
5. Economical Evaluation (EIRR) In the economic analysis, it is important to clarify that, from the viewpoint of the national economy, the profits of a private company may be deducted from a benefit, especially when a private company gains the benefit through the export of produce.
6. Basic Policy of PPP
Regarding PPP policy, there are two types of organizations within the private sector—the users of the irrigation system, and the private organizations that are to operate and manage the irrigation facilities. The commercial farmers, as users, manage the irrigation farming in their farmland. On the contrary, the private organizations, such as the scheme management companies (SMCs), have to cover a wider area of irrigation facility operation, farming services, etc., with the sufficient knowledge and financial back-up of the government. The potential on management and investment plan of the large commercial farming shall be studied. The potential of SMCs shall be also studied from the viewpoints of willingness to participate in the project, management skills, fund management, human resources, etc.
7. Financial Analysis
The tangible financial analysis of commercial farming, including the investment plan and cash flow analysis (income and expenditure balance), is necessary in the project formulation under the PPP policy. The financial analysis becomes practicable when the evaluation conditions, such as target crops, marketability of the produce, price trends, and balance of production cost and depreciation cost, are accurately estimated. The financial analysis of SMC is conducted from the business viewpoint. The payable cost of commercial farmers for operation and maintenance of the irrigation facilities, and financial support by the Government to reduce management risk shall be estimated accurately from the analysis.
8. Consultation with VRA
There are several factors to be considered in preparing the irrigation plan. For example, the irrigation water requirement is dependent on the crop selection of the commercial farmers, and the irrigation method shall be the pressurized method, drip irrigation, etc. In addition, the commercial farmers can plan to select a farm area including an elevated upland area to mitigate flood damage. When the commercial farmers select a higher elevation area located at an upper area of the main canal, some irrigation blocks may be left unused in the proposed gravity irrigation area. The intake capacity is also subject to change due to the extension of the irrigation area outside the proposed gravity irrigation area. Since such modifications need to be consulted with VRA in each case, it is proposed to deliberate several issues related to
- 137 -
- 132 -
intake discharge and the location of the irrigation area, in advance. In any case, the irrigation plan shall be modified and updated in consultation with VRA and GIDA.
9. Scope of Work for Full Feasibility Study is outlined as follow: (1) Collection of Basic Data (through local consultants under sub-contract)
1) Topographic data through supplemental survey 2) Geological data through geological investigation and tests 3) Soil survey by observation of pit and tests 4) Identification of the potential beneficiaries through interviews with small holders and private
entrepreneurs on their possible intentions and conditions for participation in the proposed project.
5) Identification of the development constraints and possible countermeasures for the ongoing projects which are operated by PPP in and around the project site.
(2) Review, update and prepare preliminary designs for the agriculture development facilities and cost estimates 1) Main and principal canals and major facilities 2) Secondary canal system 3) Tertiary canal systems for 3 pilot areas in a total of 300 ha. 4) Related facilities, including flood protection, market facilities and workshops, if needed 5) Review, update and prepare project costs (financial and economic costs) for the project
facilities, agricultural input, and OMM cost, including replacement cost.
(3) Identification of the proposed beneficiaries, benefit and allocation of participation 1) Preparation of profitable cropping plan and acreages. 2) The government policy, process and participation allocation of private entrepreneurs and
small holders 3) Preparation of proposal for introducing private entrepreneurs and small holders after a study
and market test 4) Preparation of a proposal on the future role and implication of GIDA in the project after a
study
(4) Investigation for potential investors and companies to be introduced for large-scale farming and scheme management, and operation for the proposed irrigation scheme on the basis of introducing Public Private Partnership (PPP) for the irrigation scheme. 1) Investigation of potential private entrepreneurs for large-scale farming 2) Investigation of potential private entrepreneurs for the scheme management company for
water management and operation of all facilities and agricultural services for the irrigation scheme.
3) Study for irrigation system operation, maintenance and management system under PPP. (5) Economic and financial analysis
- 138 -

- 133 -
1) Preparation of investment plan, estimation of financial cost and benefit, cash flow, etc. for the project operation system selected from the above investigations.
2) Estimation of economic cost and benefit for the selected operation system 3) Estimation of FIRR and EIRR with sensitivity analysis.
(6) Environmental and social safeguard
EIA with environmental monitoring and management, including a mitigation plan, will be prepared by the GIDA in accordance with the guidelines for environmental and social considerations of the Government and JICA, and the environmental and social safeguard policies of the World Bank.
(7) Project implementation schedule for Full Feasibility Study
A two-year study period will be required because it takes one-and-a-half years to prepare topographical maps and study PPP, and another six months for coping with comments on Environmental and Social Considerations submitted by the JICA Advisory Committee on Environmental and Social Considerations, World Bank and Government of Ghana, such as EPA (Environmental Protection Agency).
The overall work schedule can be depicted as follows:
Work Category 1st fiscal year 2nd fiscal year
Data collection, survey, investigationand preparation of feasibility studyAssistance to GIDA to carry out EIAfor environmetal and social safeguard
127 8 9 10 111 2 3 4 5 67 8 9 10 11 121 2 3 4 5 6
(8) Assignment schedule According to JICA Guidelines for Environmental and Social Considerations, the project is classified as “Category A” because it falls into the agriculture sector and involves large-scale irrigation under the Guidelines. The full scale F/S is scheduled to be implemented for a period of two years, including the study period for assisting GIDA to carry out EIA. Based on the results of the pre-F/S, JICA reviews the scoping draft and supports consulting with local stakeholders. JICA conducts environmental and social surveys at the EIA level in accordance with TOR. The following nine expatriate specialists within two years will be required. 1) Team leader/irrigation development, 2) Irrigation and drainage facilities plan and design, 3) Construction plan and cost estimate, 4) Agronomy and pedology, 5) Irrigation system operation and management, 6) Agro-economist, 7) Environmental safeguard, 8) Social safeguard, 9) Coordinator/Marketing
(9) Undertaking by the Government of Ghana 1) Assignment of full time counterpart for each expatriate specialist
- 139 -

- 134 -
2) Exemption of taxes for the expatriate specialists and their families 3) Working room with desks, chairs, electricity, telephone and air conditioner
(10) The following work is planned to be carried out by the local consultants in Ghana who are
employed and supervised by the JICA study team: 1) Profile survey for the main canal with a distance of 70 km, a cross section survey with
intervals of 500 m to 1 km, and a topographic survey for major proposed facilities. 2) Geological investigation and laboratory test at the intake site and major hydraulic structures. 3) Farm economy survey of small holders and medium-scale farmers. 4) Interview with potential entrepreneurs, large-scale farming for asset management plan for
introducing PPP for irrigation schemes. 5) Investigation of potential private companies for scheme management of the irrigation
scheme. 6) Financial analysis of potential investors to be introduced for the NIDS. 7) Environmental impact assessment, including soil, water quality, fauna and flora, monitoring
and management.
- 140 -


ANNEXES
Annex A Hydro-Meteorological Information Annex B Irrigation and Drainage Development Annex C Infrastructure Planning/Design Annex D Agriculture Annex E Farmer's Organization, Enterprises / Management of Irrigation System Annex F Environment and Social Considerations Annex G Project Cost and Implementation Plan Annex H Project Evaluation Annex I Photographs of the APGIP Annex J List of Collected Data and Document


Annex A
Hydro-Meteorological Information


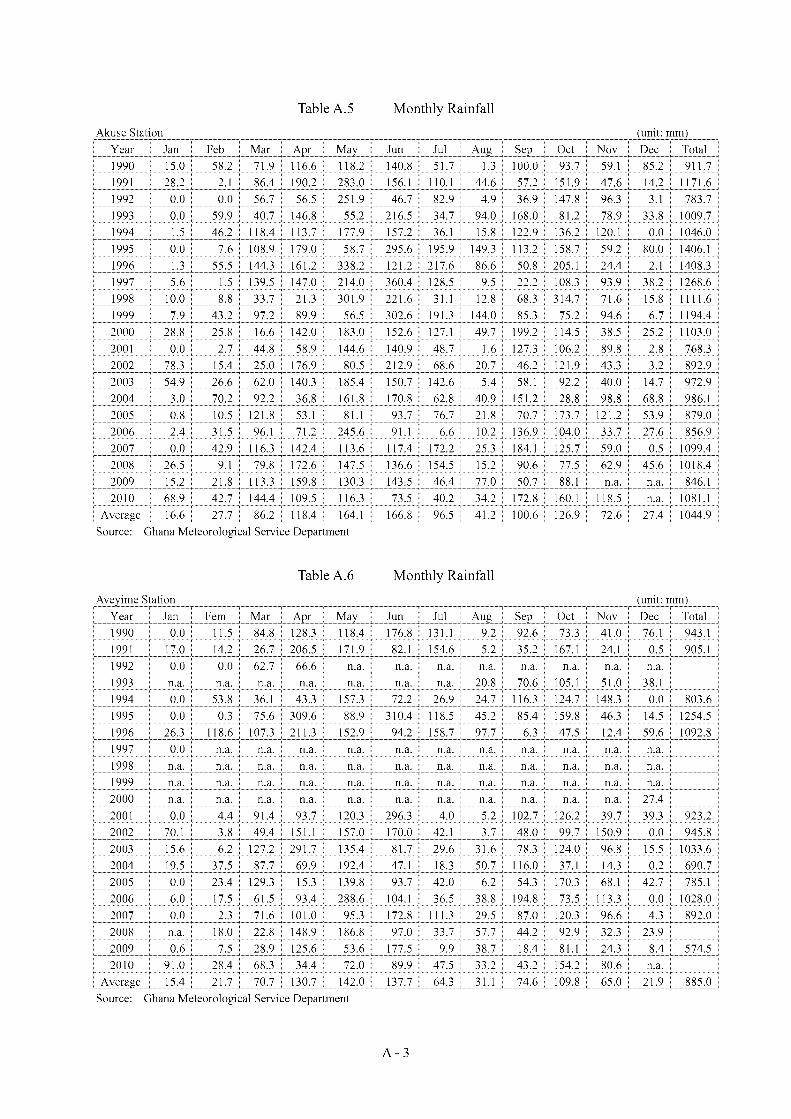


Annex B
Irrigation and Drainage Development


B - 2
Tabl
e B
.1 (1
)
Kpo
ng Ir
rigat
ion
Sche
me
(KIS
)
Tota
lPa
ddy
Expa
nsio
nU
plan
dFi
sh p
ond
Sub
Tota
lB
anan
a Ex
pans
ion
Sub
tota
l(h
a)Pa
ddy
Upl
and
Ban
ana
Tota
l18
5240
741
2023
2012
0060
018
0041
2022
5961
1800
4120
20ha
of f
ish
pond
is in
clud
ed in
the
Upl
and.
Kpo
ng Ir
riga
tion
Sche
me
(KIS
)B
anan
a is
irrig
ated
und
er d
rip ir
rigat
ion
with
12
hour
s irr
igat
ion.
Gro
ss W
ater
Req
uire
men
t (m
3/se
c)(U
nit:
lit/s
ec/h
a)Y
ear
Ja
n
Feb
M
ar
Ap r
M
ay
Jun
Ju
l
Aug
Se
p
Oct
N
ov
Dec
Max
Ave
rage
Yea
rY
ear
1st
2nd
1st
2nd
1st
2nd
1st
2nd
1st
2nd
1st
2nd
1st
2nd
1st
2nd
1st
2nd
1st
2nd
1st
2nd
1st
2nd
(m3/
sec)
(m3/
sec)
Yea
r19
903.
130
1.62
20.
257
0.00
01.
505
1.29
45.
767
3.25
32.
427
6.03
43.
181
1.81
30.
000
2.89
61.
188
1.60
82.
145
4.78
16.
060
4.48
55.
513
5.55
94.
787
3.21
86.
060
3.02
219
9019
913.
130
0.97
20.
257
0.00
00.
638
4.32
62.
156
3.97
53.
438
3.21
85.
491
3.40
10.
000
2.89
61.
549
1.60
82.
722
6.15
33.
099
3.83
55.
296
6.20
95.
509
5.24
06.
209
3.13
019
9119
923.
130
1.62
20.
257
0.00
01.
505
2.23
25.
478
6.06
94.
449
0.00
05.
708
4.41
23.
063
1.88
51.
549
1.60
83.
950
5.43
11.
655
6.50
73.
563
5.55
95.
509
5.24
06.
507
3.34
919
9219
933.
130
1.62
20.
257
0.00
00.
855
3.89
34.
611
4.04
75.
460
5.38
42.
892
1.23
54.
579
2.17
41.
115
1.17
42.
867
4.70
95.
843
3.54
65.
080
5.27
04.
137
5.24
05.
843
3.29
719
9319
943.
130
1.62
20.
000
0.00
00.
638
3.96
55.
622
6.64
74.
449
2.49
64.
553
4.84
54.
940
2.03
01.
549
0.48
42.
867
2.90
34.
760
4.70
21.
758
5.41
55.
509
5.24
06.
647
3.33
919
9419
953.
130
1.62
20.
257
0.00
00.
711
2.37
75.
045
0.00
04.
016
5.45
70.
000
1.81
30.
824
2.68
01.
549
0.00
02.
145
5.07
05.
626
1.88
54.
213
6.57
05.
076
5.24
06.
570
2.72
119
9519
963.
130
1.62
20.
000
0.00
00.
000
1.65
54.
611
3.61
40.
000
1.55
75.
564
1.95
70.
000
1.59
71.
549
0.00
02.
145
6.15
32.
955
3.40
25.
152
6.57
05.
509
5.24
06.
570
2.66
619
9619
973.
130
1.40
50.
257
0.00
00.
277
0.78
84.
178
4.48
02.
933
2.85
70.
000
0.00
00.
824
2.89
61.
549
1.60
83.
733
5.93
66.
132
4.05
25.
802
3.53
74.
137
5.24
06.
132
2.74
019
9719
983.
130
1.26
10.
000
0.00
01.
144
3.67
66.
705
6.43
00.
000
2.56
85.
852
0.00
04.
146
2.68
01.
332
1.17
43.
733
4.05
91.
438
1.01
94.
935
5.27
05.
076
5.24
06.
705
2.95
319
9819
992.
914
1.62
20.
040
0.00
00.
000
2.88
25.
550
5.13
05.
677
5.31
20.
000
1.74
01.
907
0.00
00.
177
0.00
03.
950
3.62
55.
699
5.35
24.
069
5.27
05.
509
5.24
05.
699
2.98
619
9920
002.
264
1.62
20.
257
0.00
01.
505
3.89
33.
095
5.78
04.
593
2.13
54.
264
2.39
01.
907
1.74
11.
549
0.00
01.
134
1.96
54.
977
4.77
44.
863
6.13
75.
509
4.22
96.
137
2.94
120
0020
013.
130
1.62
20.
257
0.00
00.
000
3.89
35.
045
5.49
15.
532
3.14
66.
286
0.00
04.
940
2.89
61.
549
1.60
82.
361
3.98
66.
132
2.46
34.
935
6.35
33.
993
5.24
06.
353
3.36
920
0120
020.
458
1.62
20.
257
0.00
00.
000
4.32
63.
095
5.13
03.
366
3.65
13.
614
1.81
34.
290
2.03
01.
549
1.60
82.
867
5.50
36.
060
3.90
70.
170
6.57
05.
509
5.24
06.
570
3.02
620
0220
033.
130
1.18
80.
257
0.00
00.
000
2.81
00.
000
5.34
75.
749
1.91
84.
914
3.97
94.
940
1.88
50.
466
1.60
82.
073
5.07
03.
893
4.99
04.
141
4.76
54.
932
5.24
05.
749
3.05
420
0320
042.
480
1.62
20.
000
0.00
00.
566
2.08
84.
322
7.15
23.
510
1.99
04.
769
5.35
14.
651
2.89
61.
549
0.19
52.
506
3.48
15.
915
6.14
65.
802
6.06
55.
509
5.24
07.
152
3.49
220
0420
053.
130
1.62
20.
000
0.00
00.
000
2.88
26.
417
6.86
35.
604
2.13
52.
820
5.35
14.
940
1.45
21.
549
1.17
42.
867
5.35
83.
316
3.90
73.
924
6.20
93.
993
5.24
06.
863
3.36
520
0520
062.
914
1.62
20.
000
0.00
00.
783
3.09
94.
684
5.78
00.
000
2.71
32.
964
4.84
54.
940
1.66
90.
177
1.60
80.
000
4.34
75.
338
5.71
31.
758
6.57
05.
509
5.24
06.
570
3.01
120
0620
073.
130
1.62
20.
257
0.00
01.
216
2.16
02.
806
7.15
26.
399
3.07
42.
892
2.60
74.
940
0.00
01.
549
0.77
33.
733
3.84
25.
265
3.76
32.
841
6.28
15.
509
5.24
07.
152
3.21
020
0720
083.
130
0.75
50.
000
0.00
00.
783
4.32
64.
034
4.33
63.
005
3.21
84.
047
4.62
94.
940
2.17
41.
549
0.00
03.
950
4.92
54.
471
5.20
74.
863
6.57
05.
221
4.80
76.
570
3.37
320
0820
093.
130
1.62
20.
257
0.00
00.
566
4.32
64.
684
4.40
85.
749
5.16
84.
264
1.01
84.
940
2.89
61.
549
0.05
13.
661
5.79
24.
327
5.92
95.
296
6.28
15.
509
5.24
06.
281
3.61
120
0920
102.
697
0.00
00.
000
0.00
00.
205
3.17
16.
705
6.14
16.
326
3.94
03.
108
5.35
13.
424
2.89
61.
549
0.41
23.
733
5.50
32.
810
4.70
25.
152
4.47
65.
509
5.24
06.
705
3.46
120
10
Max
3.13
01.
622
0.25
70.
000
1.50
54.
326
6.70
57.
152
6.39
96.
034
6.28
65.
351
4.94
02.
896
1.54
91.
608
3.95
06.
153
6.13
26.
507
5.80
26.
570
5.50
95.
240
7.15
23.
611
Max
Ave
rag e
2.89
01.
424
0.14
90.
000
0.61
43.
051
4.50
55.
106
3.93
73.
237
3.67
52.
788
3.29
22.
108
1.31
80.
871
2.81
64.
695
4.56
14.
299
4.24
45.
786
5.11
75.
075
6.43
13.
148
Ave
rage
Kpo
ng Ir
riga
tion
Sche
me
(KIS
)G
ross
Wat
er R
equi
rem
ent V
olum
e (m
3)(U
nit:
lit/s
ec/h
a)Y
ear
Ja
n
Feb
M
ar
Ap r
M
ay
Jun
Ju
l
Aug
Se
p
Oct
N
ov
Dec
Max
Ann
ual T
otal
Yea
rY
ear
1st
2nd
1st
2nd
1st
2nd
1st
2nd
1st
2nd
1st
2nd
1st
2nd
1st
2nd
1st
2nd
1st
2nd
1st
2nd
1st
2nd
(1,0
00 m
3)(1
,000
m3)
Yea
r19
9032
45.9
2617
93.7
5026
6.23
90.
000
1560
.454
1430
.747
5979
.777
3373
.065
2516
.773
6674
.316
3298
.156
1879
.562
0.00
032
03.6
1312
31.5
8117
78.1
4322
24.0
0249
57.3
9762
83.6
8749
60.7
8557
16.8
0857
64.5
1149
64.2
9735
59.7
2166
74.3
16##
####
###
1990
1991
3245
.926
1074
.913
266.
239
0.00
066
1.90
747
85.3
2122
35.8
3341
21.8
5435
65.0
7735
59.3
5456
94.2
8135
26.8
980.
000
3203
.613
1605
.976
1778
.143
2823
.033
6380
.095
3213
.653
4241
.948
5492
.171
6438
.421
5713
.086
5796
.103
6438
.421
####
####
#19
9119
9232
45.9
2617
93.7
5026
6.23
90.
000
1560
.454
2469
.068
5680
.262
6293
.342
4613
.382
0.00
059
18.9
1845
75.2
0231
75.9
5720
85.4
2216
05.9
7617
78.1
4340
95.9
7456
31.3
0717
16.0
7571
97.1
6836
95.0
7857
64.5
1157
13.0
8657
96.1
0371
97.1
68##
####
###
1992
1993
3245
.926
1793
.750
266.
239
0.00
088
6.54
443
06.0
9647
81.7
1541
96.7
3356
61.6
8659
55.4
7929
98.6
4112
80.5
3147
48.4
1324
04.9
0511
56.7
0212
98.9
1829
72.7
9148
82.5
1860
59.0
5139
22.4
6552
67.5
3554
64.9
9642
90.3
8757
96.1
0360
59.0
51##
####
###
1993
1994
3245
.926
1793
.750
0.00
00.
000
661.
907
4385
.967
5830
.019
6892
.373
4613
.382
2760
.646
4720
.855
5024
.476
5122
.808
2245
.164
1605
.976
535.
705
2972
.791
3010
.545
4935
.867
5200
.398
1823
.106
5614
.754
5713
.086
5796
.103
6892
.373
####
####
#19
9419
9532
45.9
2617
93.7
5026
6.23
90.
000
736.
786
2628
.809
5230
.988
0.00
041
64.1
0860
35.3
500.
000
1879
.562
854.
711
2964
.001
1605
.976
0.00
022
24.0
0252
56.9
1258
34.4
1420
85.4
3643
68.9
8868
12.8
1652
63.8
1357
96.1
0368
12.8
16##
####
###
1995
1996
3245
.926
1793
.750
0.00
00.
000
0.00
018
30.1
0147
81.7
1537
47.4
590.
000
1722
.326
5769
.160
2029
.320
0.00
017
65.9
3916
05.9
760.
000
2224
.002
6380
.095
3063
.895
3762
.723
5342
.413
6812
.816
5713
.086
5796
.103
6812
.816
####
####
#19
9619
9732
45.9
2615
54.1
3726
6.23
90.
000
287.
513
871.
651
4332
.442
4646
.006
3040
.925
3160
.000
0.00
00.
000
854.
711
3203
.613
1605
.976
1778
.143
3871
.338
6155
.459
6358
.566
4481
.560
6016
.323
3667
.903
4290
.387
5796
.103
6358
.566
####
####
#19
9719
9832
45.9
2613
94.3
960.
000
0.00
011
86.0
5940
66.4
8469
53.2
0366
67.7
360.
000
2840
.517
6068
.675
0.00
042
99.1
4029
64.0
0113
81.3
3912
98.9
1838
71.3
3842
08.6
0814
91.4
3811
26.9
8651
17.7
7754
64.9
9652
63.8
1357
96.1
0369
53.2
03##
####
###
1998
1999
3021
.290
1793
.750
41.6
030.
000
0.00
031
87.9
0557
55.1
4053
19.9
1658
86.3
2358
75.6
080.
000
1804
.684
1977
.894
0.00
018
3.27
70.
000
4095
.974
3759
.334
5909
.293
5919
.235
4219
.230
5464
.996
5713
.086
5796
.103
5919
.235
####
####
#19
9920
0023
47.3
8017
93.7
5026
6.23
90.
000
1560
.454
4306
.096
3209
.258
5993
.826
4763
.140
2361
.292
4421
.340
2478
.594
1977
.894
1925
.680
1605
.976
0.00
011
75.6
9820
37.1
2051
60.5
0452
80.2
6850
42.8
9863
63.5
4357
13.0
8646
77.9
1263
63.5
43##
####
###
2000
2001
3245
.926
1793
.750
266.
239
0.00
00.
000
4306
.096
5230
.988
5694
.311
5736
.565
3479
.483
6517
.949
0.00
051
22.8
0832
03.6
1316
05.9
7617
78.1
4324
48.6
3941
33.7
2963
58.5
6627
24.4
0251
17.7
7765
88.1
7941
40.6
2957
96.1
0365
88.1
79##
####
###
2001
2002
475.
407
1793
.750
266.
239
0.00
00.
000
4785
.321
3209
.258
5319
.916
3490
.198
4038
.579
3747
.430
1879
.562
4448
.898
2245
.164
1605
.976
1778
.143
2972
.791
5706
.185
6283
.687
4321
.819
175.
770
6812
.816
5713
.086
5796
.103
6812
.816
####
####
#20
0220
0332
45.9
2613
14.5
2526
6.23
90.
000
0.00
031
08.0
340.
000
5544
.553
5961
.202
2121
.680
5095
.250
4125
.929
5122
.808
2085
.422
482.
792
1778
.143
2149
.123
5256
.912
4037
.321
5519
.881
4294
.109
4940
.844
5114
.055
5796
.103
5961
.202
####
####
#20
0320
0425
72.0
1617
93.7
500.
000
0.00
058
7.02
823
09.3
2644
82.1
9974
16.5
2536
39.9
5622
01.5
5049
45.4
9255
48.6
2848
23.2
9232
03.6
1316
05.9
7621
6.22
225
98.3
9736
09.5
7761
33.9
2967
97.8
1460
16.3
2362
88.6
6457
13.0
8657
96.1
0374
16.5
25##
####
###
2004
2005
3245
.926
1793
.750
0.00
00.
000
0.00
031
87.9
0566
53.6
8771
17.0
0958
11.4
4423
61.2
9229
23.7
6255
48.6
2851
22.8
0816
06.1
9716
05.9
7612
98.9
1829
72.7
9155
56.4
2834
38.2
8943
21.8
1940
69.4
7264
38.4
2141
40.6
2957
96.1
0371
17.0
09##
####
###
2005
2006
3021
.290
1793
.750
0.00
00.
000
811.
665
3427
.517
4856
.594
5993
.826
0.00
030
00.2
5930
73.5
2050
24.4
7651
22.8
0818
45.8
0918
3.27
717
78.1
430.
000
4508
.123
5534
.898
6318
.589
1823
.106
6812
.816
5713
.086
5796
.103
6812
.816
####
####
#20
0620
0732
45.9
2617
93.7
5026
6.23
90.
000
1260
.938
2389
.197
2909
.743
7416
.525
6635
.112
3399
.613
2998
.641
2703
.230
5122
.808
0.00
016
05.9
7685
5.18
838
71.3
3839
83.9
7154
60.0
1941
62.0
7729
46.2
8965
13.3
0057
13.0
8657
96.1
0374
16.5
25##
####
###
2007
2008
3245
.926
835.
300
0.00
00.
000
811.
665
4785
.321
4182
.684
4496
.248
3115
.804
3559
.354
4196
.703
4799
.839
5122
.808
2404
.905
1605
.976
0.00
040
95.9
7451
07.1
5446
36.3
5257
59.4
9350
42.8
9868
12.8
1654
13.5
7053
16.8
7868
12.8
16##
####
###
2008
2009
3245
.926
1793
.750
266.
239
0.00
058
7.02
847
85.3
2148
56.5
9445
71.1
2759
61.2
0257
15.8
6644
21.3
4010
55.8
9551
22.8
0832
03.6
1316
05.9
7656
.480
3796
.459
6005
.701
4486
.594
6558
.201
5492
.171
6513
.300
5713
.086
5796
.103
6558
.201
####
####
#20
0920
1027
96.6
530.
000
0.00
00.
000
212.
634
3507
.388
6953
.203
6368
.221
6560
.233
4358
.062
3223
.278
5548
.628
3550
.351
3203
.613
1605
.976
455.
834
3871
.338
5706
.185
2914
.137
5200
.398
5342
.413
4641
.328
5713
.086
5796
.103
6953
.203
####
####
#20
10
Max
3245
.926
1793
.750
266.
239
0.00
015
60.4
5447
85.3
2169
53.2
0374
16.5
2566
35.1
1266
74.3
1665
17.9
4955
48.6
2851
22.8
0832
03.6
1316
05.9
7617
78.1
4340
95.9
7463
80.0
9563
58.5
6671
97.1
6860
16.3
2368
12.8
1657
13.0
8657
96.1
0374
16.5
2591
610.
781
Max
Ave
rag e
2996
.330
1575
.215
154.
118
0.00
063
6.81
133
74.2
7046
71.6
8152
94.7
8940
82.6
9135
80.0
3038
11.1
1428
91.1
2634
13.9
8723
31.8
0513
67.0
7696
3.87
329
20.3
7148
68.2
5547
29.0
5947
55.4
0344
01.0
7959
99.8
4553
06.6
0056
13.5
4267
10.9
90##
####
###
Ave
rage
Not
e: B
anan
a Fa
rm is
irrig
ated
und
er d
rip ir
rigat
ion
with
12
hour
s irr
igat
ion
in a
day
, so
that
the
volu
me
of w
ater
for B
anan
a Fa
rm is
est
imat
ed h
alf o
f one
day
gro
ss w
ater
requ
iem
ent o
f m3/
sec
KIS
Are
a(ha
)K
IS A
rea(
ha)
Gol
den
Exot
ics(
ha)
Tota
l KIS
Are
a (h
a)

B - 3
Tabl
e B
.1 (2
)
New
Dev
elop
men
t Irr
igat
ion
Sche
me
(ND
IS)
Pa
ddy
Cas
si(U
plan
dSub
Tot
alPa
ddy
Sub
tota
lTo
tal
Padd
yU
plan
d To
tal
2538
162
2700
4200
4200
6900
6738
162
6900
New
Dev
elop
men
t Irr
igat
ion
Sche
me
(No.
1 an
d N
o.2
Are
a)G
ross
Wat
er R
equi
rem
ent (
m3/
sec)
Yea
r
Jan
Fe
b
Mar
A
pr
May
Ju
n
Jul
A
ug
Sep
O
ct
Nov
D
ecM
axA
vera
geY
ear
Yea
r1s
t2n
d1s
t2n
d1s
t2n
d1s
t2n
d1s
t2n
d1s
t2n
d1s
t2n
d1s
t2n
d1s
t2n
d1s
t2n
d1s
t2n
d1s
t2n
d(m
3/se
c)(m
3/se
c)Y
ear
1990
4.98
22.
581
0.40
90.
000
2.39
52.
059
9.17
75.
177
3.86
39.
603
5.06
22.
885
0.00
04.
609
1.89
02.
558
3.41
37.
608
9.64
47.
138
8.77
48.
847
7.61
95.
122
9.64
44.
809
1990
1991
4.98
21.
547
0.40
90.
000
1.01
66.
885
3.43
16.
326
5.47
15.
121
8.73
95.
413
0.00
04.
609
2.46
52.
558
4.33
39.
792
4.93
26.
103
8.42
99.
881
8.76
88.
340
9.88
14.
981
1991
1992
4.98
22.
581
0.40
90.
000
2.39
53.
553
8.71
89.
659
7.08
00.
000
9.08
47.
022
4.87
43.
001
2.46
52.
558
6.28
68.
643
2.63
410
.355
5.67
18.
847
8.76
88.
340
10.3
555.
330
1992
1993
4.98
22.
581
0.40
90.
000
1.36
16.
196
7.33
96.
441
8.68
98.
569
4.60
21.
965
7.28
83.
460
1.77
51.
869
4.56
27.
493
9.29
95.
644
8.08
48.
387
6.58
58.
340
9.29
95.
247
1993
1994
4.98
22.
581
0.00
00.
000
1.01
66.
311
8.94
810
.578
7.08
03.
972
7.24
57.
711
7.86
23.
230
2.46
50.
771
4.56
24.
620
7.57
57.
482
2.79
88.
617
8.76
88.
340
10.5
785.
313
1994
1995
4.98
22.
581
0.40
90.
000
1.13
13.
782
8.02
80.
000
6.39
18.
684
0.00
02.
885
1.31
24.
265
2.46
50.
000
3.41
38.
068
8.95
43.
001
6.70
510
.456
8.07
98.
340
10.4
564.
330
1995
1996
4.98
22.
581
0.00
00.
000
0.00
02.
633
7.33
95.
751
0.00
02.
478
8.85
43.
114
0.00
02.
541
2.46
50.
000
3.41
39.
792
4.70
25.
414
8.19
910
.456
8.76
88.
340
10.4
564.
243
1996
1997
4.98
22.
236
0.40
90.
000
0.44
11.
254
6.64
97.
130
4.66
74.
547
0.00
00.
000
1.31
24.
609
2.46
52.
558
5.94
29.
447
9.75
96.
448
9.23
45.
629
6.58
58.
340
9.75
94.
360
1997
1998
4.98
22.
006
0.00
00.
000
1.82
05.
851
10.6
7110
.233
0.00
04.
087
9.31
40.
000
6.59
84.
265
2.12
01.
869
5.94
26.
459
2.28
91.
622
7.85
48.
387
8.07
98.
340
10.6
714.
699
1998
1999
4.63
72.
581
0.06
40.
000
0.00
04.
587
8.83
38.
165
9.03
48.
454
0.00
02.
770
3.03
60.
000
0.28
10.
000
6.28
65.
770
9.06
98.
517
6.47
58.
387
8.76
88.
340
9.06
94.
752
1999
2000
3.60
32.
581
0.40
90.
000
2.39
56.
196
4.92
59.
199
7.31
03.
397
6.78
63.
804
3.03
62.
771
2.46
50.
000
1.80
43.
126
7.92
07.
597
7.74
09.
766
8.76
86.
731
9.76
64.
680
2000
2001
4.98
22.
581
0.40
90.
000
0.00
06.
196
8.02
88.
739
8.80
45.
006
10.0
030.
000
7.86
24.
609
2.46
52.
558
3.75
86.
344
9.75
93.
920
7.85
410
.111
6.35
58.
340
10.1
115.
362
2001
2002
0.73
02.
581
0.40
90.
000
0.00
06.
885
4.92
58.
165
5.35
75.
811
5.75
12.
885
6.82
83.
230
2.46
52.
558
4.56
28.
758
9.64
46.
218
0.27
010
.456
8.76
88.
340
10.4
564.
816
2002
2003
4.98
21.
891
0.40
90.
000
0.00
04.
472
0.00
08.
509
9.14
93.
053
7.82
06.
332
7.86
23.
001
0.74
12.
558
3.29
88.
068
6.19
67.
942
6.59
07.
583
7.84
98.
340
9.14
94.
860
2003
2004
3.94
72.
581
0.00
00.
000
0.90
13.
323
6.87
911
.382
5.58
63.
168
7.59
08.
516
7.40
34.
609
2.46
50.
311
3.98
85.
540
9.41
49.
781
9.23
49.
651
8.76
88.
340
11.3
825.
557
2004
2005
4.98
22.
581
0.00
00.
000
0.00
04.
587
10.2
1210
.923
8.91
93.
397
4.48
78.
516
7.86
22.
311
2.46
51.
869
4.56
28.
528
5.27
76.
218
6.24
69.
881
6.35
58.
340
10.9
235.
355
2005
2006
4.63
72.
581
0.00
00.
000
1.24
64.
932
7.45
49.
199
0.00
04.
317
4.71
77.
711
7.86
22.
656
0.28
12.
558
0.00
06.
919
8.49
59.
091
2.79
810
.456
8.76
88.
340
10.4
564.
792
2006
2007
4.98
22.
581
0.40
90.
000
1.93
53.
438
4.46
611
.382
10.1
834.
891
4.60
24.
149
7.86
20.
000
2.46
51.
230
5.94
26.
114
8.38
05.
988
4.52
29.
996
8.76
88.
340
11.3
825.
109
2007
2008
4.98
21.
202
0.00
00.
000
1.24
66.
885
6.41
96.
901
4.78
25.
121
6.44
17.
367
7.86
23.
460
2.46
50.
000
6.28
67.
838
7.11
68.
287
7.74
010
.456
8.30
87.
650
10.4
565.
367
2008
2009
4.98
22.
581
0.40
90.
000
0.90
16.
885
7.45
47.
016
9.14
98.
224
6.78
61.
621
7.86
24.
609
2.46
50.
081
5.82
79.
217
6.88
69.
436
8.42
99.
996
8.76
88.
340
9.99
65.
747
2009
2010
4.29
20.
000
0.00
00.
000
0.32
65.
047
10.6
719.
774
10.0
686.
270
4.94
78.
516
5.44
94.
609
2.46
50.
656
5.94
28.
758
4.47
27.
482
8.19
97.
123
8.76
88.
340
10.6
715.
507
2010
Max
4.98
22.
581
0.40
90.
000
2.39
56.
885
10.6
7111
.382
10.1
839.
603
10.0
038.
516
7.86
24.
609
2.46
52.
558
6.28
69.
792
9.75
910
.355
9.23
410
.456
8.76
88.
340
11.3
825.
747
Max
Ave
rag e
4.59
92.
266
0.23
70.
000
0.97
74.
855
7.17
08.
126
6.26
65.
151
5.84
94.
437
5.24
03.
355
2.09
81.
387
4.48
27.
472
7.25
86.
842
6.75
59.
208
8.14
48.
077
8.07
75.
010
Ave
rage
New
Dev
elop
men
t Irr
igat
ion
Sche
me
(No.
1 an
d N
o.2
Are
a)G
ross
Wat
er R
equi
rem
ent V
olum
e (m
3)(m
3)Y
ear
Ja
n
Feb
M
ar
Apr
M
ay
Jun
Ju
l
Aug
Se
p
Oct
N
ov
Dec
Max
Ann
ual T
ota l
Yea
rY
ear
1st
2nd
1st
2nd
1st
2nd
1st
2nd
1st
2nd
1st
2nd
1st
2nd
1st
2nd
1st
2nd
1st
2nd
1st
2nd
1st
2nd
(1,0
00 m
3)(1
,000
m3)
Yea
r19
9064
56.2
3835
67.8
1952
9.55
80.
000
3103
.786
2845
.796
1189
3.94
467
09.1
2150
05.9
3213
275.
402
6560
.126
3738
.502
0.00
063
72.0
7724
49.6
4935
36.7
7744
23.6
0398
60.4
0112
498.
430
9867
.141
1137
0.89
111
465.
775
9874
.126
7080
.384
1327
5.40
215
2485
.477
1990
1991
6456
.238
2138
.031
529.
558
0.00
013
16.5
5295
18.1
3844
47.1
3481
98.4
8370
91.0
3970
79.6
5511
326.
084
7015
.099
0.00
063
72.0
7731
94.3
3035
36.7
7756
15.0
9212
690.
189
6392
.045
8437
.353
1092
4.08
212
806.
201
1136
3.48
811
528.
612
1280
6.20
115
7976
.258
1991
1992
6456
.238
3567
.819
529.
558
0.00
031
03.7
8649
11.0
4511
298.
199
1251
7.63
391
76.1
460.
000
1177
2.89
391
00.2
0663
17.0
6741
47.9
6331
94.3
3035
36.7
7781
47.0
0811
200.
827
3413
.321
1431
5.36
973
49.6
1311
465.
775
1136
3.48
811
528.
612
1431
5.36
916
8413
.672
1992
1993
6456
.238
3567
.819
529.
558
0.00
017
63.3
6085
64.9
4795
10.9
6583
47.4
1911
261.
253
1184
5.61
459
64.3
8125
47.0
1394
44.7
2747
83.4
2423
00.7
1325
83.5
8559
12.9
6597
11.4
6512
051.
621
7801
.892
1047
7.27
410
870.
030
8533
.700
1152
8.61
212
051.
621
1663
58.5
7419
9319
9464
56.2
3835
67.8
190.
000
0.00
013
16.5
5287
23.8
1211
596.
072
1370
9.12
391
76.1
4654
91.0
0393
89.9
1399
93.8
2310
189.
408
4465
.693
3194
.330
1065
.532
5912
.965
5988
.059
9817
.578
1034
3.73
736
26.2
0811
167.
903
1136
3.48
811
528.
612
1370
9.12
316
8084
.014
1994
1995
6456
.238
3567
.819
529.
558
0.00
014
65.4
8852
28.7
7510
404.
582
0.00
082
82.5
2812
004.
479
0.00
037
38.5
0217
00.0
4458
95.4
8131
94.3
300.
000
4423
.603
1045
6.14
611
604.
813
4147
.990
8690
.039
1355
0.88
210
469.
871
1152
8.61
213
550.
882
1373
39.7
8119
9519
9664
56.2
3835
67.8
190.
000
0.00
00.
000
3640
.123
9510
.965
7453
.802
0.00
034
25.7
5411
475.
020
4036
.375
0.00
035
12.5
0131
94.3
300.
000
4423
.603
1269
0.18
960
94.1
7374
84.1
6110
626.
210
1355
0.88
211
363.
488
1152
8.61
213
550.
882
1340
34.2
4519
9619
9764
56.2
3830
91.2
2352
9.55
80.
000
571.
871
1733
.739
8617
.348
9241
.037
6048
.485
6285
.329
0.00
00.
000
1700
.044
6372
.077
3194
.330
3536
.777
7700
.199
1224
3.38
012
647.
366
8913
.949
1196
6.63
672
95.5
6185
33.7
0011
528.
612
1264
7.36
613
8207
.459
1997
1998
6456
.238
2773
.492
0.00
00.
000
2359
.105
8088
.351
1383
0.11
513
262.
314
0.00
056
49.8
6812
070.
765
0.00
085
51.1
1058
95.4
8127
47.5
2225
83.5
8577
00.1
9983
71.0
3929
66.5
1322
41.6
0710
179.
401
1087
0.03
010
469.
871
1152
8.61
213
830.
115
1485
95.2
1819
9819
9960
09.4
3035
67.8
1982
.749
0.00
00.
000
6340
.832
1144
7.13
610
581.
462
1170
8.06
111
686.
749
0.00
035
89.5
6639
34.0
870.
000
364.
542
0.00
081
47.0
0874
77.4
2111
753.
749
1177
3.52
483
92.1
6710
870.
030
1136
3.48
811
528.
612
1177
3.52
415
0618
.433
1999
2000
4669
.004
3567
.819
529.
558
0.00
031
03.7
8685
64.9
4763
83.3
0511
921.
888
9474
.018
4696
.676
8794
.169
4929
.992
3934
.087
3830
.232
3194
.330
0.00
023
38.4
9640
51.8
8910
264.
387
1050
2.60
210
030.
465
1265
7.26
511
363.
488
9304
.498
1265
7.26
514
8106
.899
2000
2001
6456
.238
3567
.819
529.
558
0.00
00.
000
8564
.947
1040
4.58
211
326.
143
1141
0.18
969
20.7
9012
964.
383
0.00
010
189.
408
6372
.077
3194
.330
3536
.777
4870
.411
8222
.102
1264
7.36
654
18.9
1310
179.
401
1310
4.07
382
35.8
2711
528.
612
1310
4.07
316
9643
.947
2001
2002
945.
599
3567
.819
529.
558
0.00
00.
000
9518
.138
6383
.305
1058
1.46
269
42.1
0380
32.8
4774
53.7
4337
38.5
0288
48.9
8244
65.6
9331
94.3
3035
36.7
7759
12.9
6511
349.
763
1249
8.43
085
96.2
1834
9.61
213
550.
882
1136
3.48
811
528.
612
1355
0.88
215
2888
.827
2002
2003
6456
.238
2614
.627
529.
558
0.00
00.
000
6181
.967
0.00
011
028.
271
1185
6.99
742
20.0
8010
134.
595
8206
.589
1018
9.40
841
47.9
6396
0.28
735
36.7
7742
74.6
6710
456.
146
8030
.344
1097
9.19
885
41.1
0398
27.4
7710
171.
998
1152
8.61
211
856.
997
1538
72.9
0120
0320
0451
15.8
1335
67.8
190.
000
0.00
011
67.6
1645
93.3
1489
15.2
2014
751.
676
7239
.975
4378
.946
9836
.722
1103
6.37
795
93.6
6363
72.0
7731
94.3
3043
0.07
151
68.2
8471
79.5
4912
200.
558
1352
1.04
211
966.
636
1250
8.32
811
363.
488
1152
8.61
214
751.
676
1756
30.1
1520
0420
0564
56.2
3835
67.8
190.
000
0.00
00.
000
6340
.832
1323
4.37
014
155.
931
1155
9.12
546
96.6
7658
15.4
4411
036.
377
1018
9.40
831
94.7
7131
94.3
3025
83.5
8559
12.9
6511
051.
890
6838
.854
8596
.218
8094
.294
1280
6.20
182
35.8
2711
528.
612
1415
5.93
116
9089
.771
2005
2006
6009
.430
3567
.819
0.00
00.
000
1614
.424
6817
.428
9659
.901
1192
1.88
80.
000
5967
.598
6113
.317
9993
.823
1018
9.40
836
71.3
6736
4.54
235
36.7
770.
000
8966
.783
1100
9.06
812
567.
851
3626
.208
1355
0.88
211
363.
488
1152
8.61
213
550.
882
1520
40.6
1520
0620
0764
56.2
3835
67.8
1952
9.55
80.
000
2508
.041
4752
.180
5787
.560
1475
1.67
613
197.
423
6761
.925
5964
.381
5376
.801
1018
9.40
80.
000
3194
.330
1700
.993
7700
.199
7924
.230
1086
0.13
282
78.4
8858
60.2
5112
955.
137
1136
3.48
811
528.
612
1475
1.67
616
1208
.870
2007
2008
6456
.238
1661
.435
0.00
00.
000
1614
.424
9518
.138
8319
.475
8943
.164
6197
.422
7079
.655
8347
.360
9547
.015
1018
9.40
847
83.4
2431
94.3
300.
000
8147
.008
1015
8.27
392
21.8
3311
455.
794
1003
0.46
513
550.
882
1076
7.74
310
575.
420
1355
0.88
216
9758
.908
2008
2009
6456
.238
3567
.819
529.
558
0.00
011
67.6
1695
18.1
3896
59.9
0190
92.1
0011
856.
997
1136
9.01
887
94.1
6921
00.2
0410
189.
408
6372
.077
3194
.330
112.
340
7551
.263
1194
5.50
889
23.9
6113
044.
446
1092
4.08
212
955.
137
1136
3.48
811
528.
612
1304
4.44
618
2216
.412
2009
2010
5562
.621
0.00
00.
000
0.00
042
2.93
569
76.2
9413
830.
115
1266
6.56
913
048.
487
8668
.308
6411
.189
1103
6.37
770
61.7
4863
72.0
7731
94.3
3090
6.66
777
00.1
9911
349.
763
5796
.301
1034
3.73
710
626.
210
9231
.732
1136
3.48
811
528.
612
1383
0.11
517
4097
.758
2010
Max
6456
.238
3567
.819
529.
558
0.00
031
03.7
8695
18.1
3813
830.
115
1475
1.67
613
197.
423
1327
5.40
212
964.
383
1103
6.37
710
189.
408
6372
.077
3194
.330
3536
.777
8147
.008
1269
0.18
912
647.
366
1431
5.36
911
966.
636
1355
0.88
211
363.
488
1152
8.61
214
751.
676
1822
16.4
12M
axA
vera
g e59
59.7
8431
33.1
4730
6.54
50.
000
1266
.635
6711
.518
9292
.104
1053
1.48
481
20.5
8771
20.7
8075
80.4
1257
50.5
3167
90.5
1546
38.0
2527
19.1
5319
17.1
7058
08.7
0096
83.0
9694
06.2
3194
58.6
3087
53.8
6911
933.
860
1055
4.97
711
165.
491
1116
5.49
115
8603
.245
Ave
rage
New
Dev
elop
men
tA
rea
No.
1 A
rea
(ha)
No.
2 A
rea
(ha)
Tota
l New
Are
a (N
o.1
+ N
o.2)
(ha)

B - 4
Tabl
e B
.1 (3
)
To
tal W
ater
Req
uire
men
t of A
ccra
Pla
in G
ravi
ty Ir
rigat
ion
Proj
ect (
APG
IP)
Pa
ddy
Upl
and
Ban
ana
Tota
lPa
ddy
Upl
and
Tota
lPa
ddy
Upl
and
Ban
ana
Tota
l22
5961
1800
4120
6738
162
6900
8997
223
1800
1102
0In
clud
ed 2
0ha
of fi
sh p
ond
Incl
uded
20h
a of
fish
pon
d
Tot
al W
ater
Req
uire
men
t of A
ccra
Pla
in G
ravi
ty Ir
riga
tion
Proj
ect
Gro
ss W
ater
Req
uire
men
t (m
3/se
c)(m
3/se
c)Y
ear
Ja
n
Feb
M
ar
Ap r
M
ay
Jun
Ju
l
Aug
Se
p
Oct
N
ov
Dec
Max
Ann
ual A
vera
gY
ear
1st
2nd
1st
2nd
1st
2nd
1st
2nd
1st
2nd
1st
2nd
1st
2nd
1st
2nd
1st
2nd
1st
2nd
1st
2nd
1st
2nd
(m3/
sec)
(m3/
sec)
Yea
r19
908.
112
4.20
30.
665
0.00
03.
900
3.35
214
.944
8.43
06.
290
15.6
378.
242
4.69
70.
000
7.50
63.
078
4.16
65.
558
12.3
8915
.704
11.6
2314
.287
14.4
0612
.406
8.34
015
.704
7.83
119
9019
918.
112
2.51
80.
665
0.00
01.
654
11.2
125.
588
10.3
018.
910
8.33
914
.231
8.81
40.
000
7.50
64.
014
4.16
67.
055
15.9
458.
031
9.93
913
.726
16.0
9014
.278
13.5
8016
.090
8.11
119
9119
928.
112
4.20
30.
665
0.00
03.
900
5.78
514
.196
15.7
2811
.529
0.00
014
.792
11.4
347.
937
4.88
64.
014
4.16
610
.236
14.0
734.
289
16.8
629.
234
14.4
0614
.278
13.5
8016
.862
8.67
919
9219
938.
112
4.20
30.
665
0.00
02.
216
10.0
8911
.950
10.4
8814
.149
13.9
537.
494
3.20
011
.867
5.63
42.
891
3.04
37.
429
12.2
0215
.142
9.19
013
.164
13.6
5810
.722
13.5
8015
.142
8.54
319
9319
948.
112
4.20
30.
000
0.00
01.
654
10.2
7614
.570
17.2
2511
.529
6.46
811
.798
12.5
5712
.802
5.26
04.
014
1.25
57.
429
7.52
412
.335
12.1
844.
556
14.0
3214
.278
13.5
8017
.225
8.65
219
9419
958.
112
4.20
30.
665
0.00
01.
841
6.15
913
.073
0.00
010
.407
14.1
400.
000
4.69
72.
136
6.94
44.
014
0.00
05.
558
13.1
3814
.581
4.88
610
.919
17.0
2613
.155
13.5
8017
.026
7.05
119
9519
968.
112
4.20
30.
000
0.00
00.
000
4.28
811
.950
9.36
50.
000
4.03
514
.418
5.07
10.
000
4.13
74.
014
0.00
05.
558
15.9
457.
657
8.81
613
.351
17.0
2614
.278
13.5
8017
.026
6.90
819
9619
978.
112
3.64
10.
665
0.00
00.
719
2.04
210
.827
11.6
117.
600
7.40
40.
000
0.00
02.
136
7.50
64.
014
4.16
69.
675
15.3
8315
.891
10.5
0015
.035
9.16
610
.722
13.5
8015
.891
7.10
019
9719
988.
112
3.26
70.
000
0.00
02.
964
9.52
717
.377
16.6
630.
000
6.65
515
.166
0.00
010
.744
6.94
43.
452
3.04
39.
675
10.5
183.
727
2.64
012
.790
13.6
5813
.155
13.5
8017
.377
7.65
219
9819
997.
551
4.20
30.
104
0.00
00.
000
7.46
914
.383
13.2
9514
.711
13.7
660.
000
4.51
04.
943
0.00
00.
458
0.00
010
.236
9.39
514
.768
13.8
6810
.544
13.6
5814
.278
13.5
8014
.768
7.73
819
9920
005.
866
4.20
30.
665
0.00
03.
900
10.0
898.
020
14.9
7911
.904
5.53
211
.049
6.19
44.
943
4.51
24.
014
0.00
02.
938
5.09
112
.897
12.3
7112
.603
15.9
0314
.278
10.9
6015
.903
7.62
120
0020
018.
112
4.20
30.
665
0.00
00.
000
10.0
8913
.073
14.2
3114
.336
8.15
216
.289
0.00
012
.802
7.50
64.
014
4.16
66.
119
10.3
3115
.891
6.38
312
.790
16.4
6510
.348
13.5
8016
.465
8.73
120
0120
021.
188
4.20
30.
665
0.00
00.
000
11.2
128.
020
13.2
958.
722
9.46
29.
365
4.69
711
.118
5.26
04.
014
4.16
67.
429
14.2
6015
.704
10.1
260.
439
17.0
2614
.278
13.5
8017
.026
7.84
320
0220
038.
112
3.08
00.
665
0.00
00.
000
7.28
20.
000
13.8
5614
.898
4.97
112
.734
10.3
1112
.802
4.88
61.
207
4.16
65.
371
13.1
3810
.090
12.9
3310
.731
12.3
4812
.781
13.5
8014
.898
7.91
420
0320
046.
428
4.20
30.
000
0.00
01.
467
5.41
111
.201
18.5
359.
097
5.15
812
.359
13.8
6712
.054
7.50
64.
014
0.50
76.
494
9.02
115
.329
15.9
2715
.035
15.7
1614
.278
13.5
8018
.535
9.04
920
0420
058.
112
4.20
30.
000
0.00
00.
000
7.46
916
.628
17.7
8614
.523
5.53
27.
307
13.8
6712
.802
3.76
34.
014
3.04
37.
429
13.8
868.
593
10.1
2610
.170
16.0
9010
.348
13.5
8017
.786
8.72
020
0520
067.
551
4.20
30.
000
0.00
02.
028
8.03
012
.137
14.9
790.
000
7.02
97.
681
12.5
5712
.802
4.32
50.
458
4.16
60.
000
11.2
6613
.832
14.8
044.
556
17.0
2614
.278
13.5
8017
.026
7.80
420
0620
078.
112
4.20
30.
665
0.00
03.
151
5.59
87.
272
18.5
3516
.582
7.96
57.
494
6.75
612
.802
0.00
04.
014
2.00
49.
675
9.95
613
.645
9.75
17.
363
16.2
7714
.278
13.5
8018
.535
8.32
020
0720
088.
112
1.95
70.
000
0.00
02.
028
11.2
1210
.453
11.2
377.
787
8.33
910
.488
11.9
9512
.802
5.63
44.
014
0.00
010
.236
12.7
6311
.587
13.4
9412
.603
17.0
2613
.529
12.4
5717
.026
8.74
020
0820
098.
112
4.20
30.
665
0.00
01.
467
11.2
1212
.137
11.4
2414
.898
13.3
9211
.049
2.63
912
.802
7.50
64.
014
0.13
29.
488
15.0
0911
.212
15.3
6513
.726
16.2
7714
.278
13.5
8016
.277
9.35
820
0920
106.
989
0.00
00.
000
0.00
00.
531
8.21
817
.377
15.9
1516
.395
10.2
118.
055
13.8
678.
873
7.50
64.
014
1.06
89.
675
14.2
607.
283
12.1
8413
.351
11.5
9914
.278
13.5
8017
.377
8.96
820
10
Max
8.11
24.
203
0.66
50.
000
3.90
011
.212
17.3
7718
.535
16.5
8215
.637
16.2
8913
.867
12.8
027.
506
4.01
44.
166
10.2
3615
.945
15.8
9116
.862
15.0
3517
.026
14.2
7813
.580
18.5
359.
358
Max
Ave
rag e
7.48
83.
691
0.38
50.
000
1.59
17.
906
11.6
7513
.232
10.2
038.
388
9.52
47.
225
8.53
25.
463
3.41
62.
258
7.29
812
.166
11.8
1811
.141
10.9
9914
.994
13.2
6213
.152
13.1
528.
159
Ave
rage
Tot
al W
ater
Req
uire
men
t of A
ccra
Pla
in G
ravi
ty Ir
riga
tion
Proj
ect
Gro
ss W
ater
Req
uire
men
t Vol
ume
(m3)
(m3)
Yea
r
Jan
Fe
b
Mar
A
p r
May
Ju
n
Jul
A
ug
Sep
O
ct
Nov
D
ecM
axA
nnua
l Tot
alY
ear
Yea
r1s
t2n
d1s
t2n
d1s
t2n
d1s
t2n
d1s
t2n
d1s
t2n
d1s
t2n
d1s
t2n
d1s
t2n
d1s
t2n
d1s
t2n
d1s
t2n
d(m
3)(1
,000
m3)
Yea
r19
9097
02.1
6553
61.5
6979
5.79
70.
000
4664
.240
4276
.543
1787
3.72
110
082.
186
7522
.705
1994
9.71
898
58.2
8256
18.0
650.
000
9575
.690
3681
.230
5314
.920
6647
.605
1481
7.79
718
782.
117
1482
7.92
617
087.
699
1723
0.28
614
838.
423
1064
0.10
519
949.
718
2291
48.7
8919
9019
9197
02.1
6532
12.9
4479
5.79
70.
000
1978
.459
1430
3.46
066
82.9
6712
320.
337
1065
6.11
610
639.
010
1702
0.36
510
541.
997
0.00
095
75.6
9048
00.3
0653
14.9
2084
38.1
2619
070.
284
9605
.698
1267
9.30
116
416.
254
1924
4.62
217
076.
574
1732
4.71
519
244.
622
2374
00.1
0619
9119
9297
02.1
6553
61.5
6979
5.79
70.
000
4664
.240
7380
.113
1697
8.46
118
810.
975
1378
9.52
80.
000
1769
1.81
013
675.
408
9493
.023
6233
.384
4800
.306
5314
.920
1224
2.98
216
832.
133
5129
.396
2151
2.53
711
044.
691
1723
0.28
617
076.
574
1732
4.71
521
512.
537
2530
85.0
1419
9219
9397
02.1
6553
61.5
6979
5.79
70.
000
2649
.904
1287
1.04
314
292.
680
1254
4.15
216
922.
939
1780
1.09
389
63.0
2238
27.5
4414
193.
140
7188
.329
3457
.415
3882
.504
8885
.756
1459
3.98
218
110.
672
1172
4.35
615
744.
808
1633
5.02
612
824.
087
1732
4.71
518
110.
672
2499
96.6
9819
9319
9497
02.1
6553
61.5
690.
000
0.00
019
78.4
5913
109.
779
1742
6.09
120
601.
496
1378
9.52
882
51.6
4914
110.
769
1501
8.29
915
312.
216
6710
.857
4800
.306
1601
.237
8885
.756
8998
.605
1475
3.44
515
544.
134
5449
.314
1678
2.65
617
076.
574
1732
4.71
520
601.
496
2525
89.6
1719
9419
9597
02.1
6553
61.5
6979
5.79
70.
000
2202
.274
7857
.585
1563
5.57
00.
000
1244
6.63
718
039.
829
0.00
056
18.0
6525
54.7
5588
59.4
8248
00.3
060.
000
6647
.605
1571
3.05
817
439.
227
6233
.426
1305
9.02
720
363.
698
1573
3.68
317
324.
715
2036
3.69
820
6388
.472
1995
1996
9702
.165
5361
.569
0.00
00.
000
0.00
054
70.2
2414
292.
680
1120
1.26
10.
000
5148
.079
1724
4.18
060
65.6
950.
000
5278
.440
4800
.306
0.00
066
47.6
0519
070.
284
9158
.068
1124
6.88
415
968.
623
2036
3.69
817
076.
574
1732
4.71
520
363.
698
2014
21.0
5119
9619
9797
02.1
6546
45.3
6079
5.79
70.
000
859.
383
2605
.390
1294
9.78
913
887.
043
9089
.410
9445
.329
0.00
00.
000
2554
.755
9575
.690
4800
.306
5314
.920
1157
1.53
718
398.
839
1900
5.93
213
395.
509
1798
2.95
910
963.
464
1282
4.08
717
324.
715
1900
5.93
220
7692
.381
1997
1998
9702
.165
4167
.888
0.00
00.
000
3545
.165
1215
4.83
520
783.
318
1993
0.05
00.
000
8490
.385
1813
9.44
10.
000
1285
0.25
088
59.4
8241
28.8
6138
82.5
0411
571.
537
1257
9.64
644
57.9
5133
68.5
9315
297.
178
1633
5.02
615
733.
683
1732
4.71
520
783.
318
2233
02.6
7119
9819
9990
30.7
1953
61.5
6912
4.35
20.
000
0.00
095
28.7
3717
202.
276
1590
1.37
917
594.
384
1756
2.35
70.
000
5394
.250
5911
.981
0.00
054
7.81
90.
000
1224
2.98
211
236.
756
1766
3.04
217
692.
759
1261
1.39
716
335.
026
1707
6.57
417
324.
715
1769
2.75
922
6343
.074
1999
2000
7016
.384
5361
.569
795.
797
0.00
046
64.2
4012
871.
043
9592
.563
1791
5.71
414
237.
158
7057
.968
1321
5.50
874
08.5
8659
11.9
8157
55.9
1248
00.3
060.
000
3514
.194
6089
.008
1542
4.89
115
782.
870
1507
3.36
319
020.
807
1707
6.57
413
982.
410
1902
0.80
722
2568
.846
2000
2001
9702
.165
5361
.569
795.
797
0.00
00.
000
1287
1.04
315
635.
570
1702
0.45
417
146.
754
1040
0.27
419
482.
331
0.00
015
312.
216
9575
.690
4800
.306
5314
.920
7319
.050
1235
5.83
119
005.
932
8143
.315
1529
7.17
819
692.
253
1237
6.45
717
324.
715
1969
2.25
325
4933
.820
2001
2002
1421
.006
5361
.569
795.
797
0.00
00.
000
1430
3.46
095
92.5
6315
901.
379
1043
2.30
112
071.
426
1120
1.17
256
18.0
6513
297.
880
6710
.857
4800
.306
5314
.920
8885
.756
1705
5.94
818
782.
117
1291
8.03
752
5.38
220
363.
698
1707
6.57
417
324.
715
2036
3.69
822
9754
.927
2002
2003
9702
.165
3929
.152
795.
797
0.00
00.
000
9290
.001
0.00
016
572.
824
1781
8.19
963
41.7
6015
229.
844
1233
2.51
815
312.
216
6233
.384
1443
.079
5314
.920
6423
.790
1571
3.05
812
067.
664
1649
9.07
812
835.
212
1476
8.32
015
286.
053
1732
4.71
517
818.
199
2312
33.7
5120
0320
0476
87.8
2953
61.5
690.
000
0.00
017
54.6
4469
02.6
4013
397.
419
2216
8.20
110
879.
931
6580
.496
1478
2.21
416
585.
005
1441
6.95
595
75.6
9048
00.3
0664
6.29
377
66.6
8010
789.
126
1833
4.48
720
318.
856
1798
2.95
918
796.
992
1707
6.57
417
324.
715
2216
8.20
126
3929
.582
2004
2005
9702
.165
5361
.569
0.00
00.
000
0.00
095
28.7
3719
888.
057
2127
2.94
117
370.
569
7057
.968
8739
.206
1658
5.00
515
312.
216
4800
.968
4800
.306
3882
.504
8885
.756
1660
8.31
810
277.
143
1291
8.03
712
163.
767
1924
4.62
212
376.
457
1732
4.71
521
272.
941
2541
01.0
2620
0520
0690
30.7
1953
61.5
690.
000
0.00
024
26.0
8910
244.
946
1451
6.49
517
915.
714
0.00
089
67.8
5791
86.8
3715
018.
299
1531
2.21
655
17.1
7654
7.81
953
14.9
200.
000
1347
4.90
716
543.
966
1888
6.44
054
49.3
1420
363.
698
1707
6.57
417
324.
715
2036
3.69
822
8480
.269
2006
2007
9702
.165
5361
.569
795.
797
0.00
037
68.9
8071
41.3
7686
97.3
0222
168.
201
1983
2.53
510
161.
538
8963
.022
8080
.031
1531
2.21
60.
000
4800
.306
2556
.181
1157
1.53
711
908.
201
1632
0.15
112
440.
565
8806
.540
1946
8.43
717
076.
574
1732
4.71
522
168.
201
2422
57.9
3920
0720
0897
02.1
6524
96.7
350.
000
0.00
024
26.0
8914
303.
460
1250
2.15
913
439.
412
9313
.226
1063
9.01
012
544.
063
1434
6.85
415
312.
216
7188
.329
4800
.306
0.00
012
242.
982
1526
5.42
813
858.
185
1721
5.28
715
073.
363
2036
3.69
816
181.
313
1589
2.29
920
363.
698
2551
06.5
7820
0820
0997
02.1
6553
61.5
6979
5.79
70.
000
1754
.644
1430
3.46
014
516.
495
1366
3.22
817
818.
199
1708
4.88
513
215.
508
3156
.099
1531
2.21
695
75.6
9048
00.3
0616
8.82
011
347.
722
1795
1.20
913
410.
555
1960
2.64
816
416.
254
1946
8.43
717
076.
574
1732
4.71
519
602.
648
2738
27.1
9320
0920
1083
59.2
740.
000
0.00
00.
000
635.
568
1048
3.68
220
783.
318
1903
4.79
019
608.
720
1302
6.37
196
34.4
6716
585.
005
1061
2.09
995
75.6
9048
00.3
0613
62.5
0111
571.
537
1705
5.94
887
10.4
3815
544.
134
1596
8.62
313
873.
060
1707
6.57
417
324.
715
2078
3.31
826
1626
.820
2010
Max
9702
.165
5361
.569
795.
797
0.00
046
64.2
4014
303.
460
2078
3.31
822
168.
201
1983
2.53
519
949.
718
1948
2.33
116
585.
005
1531
2.21
695
75.6
9048
00.3
0653
14.9
2012
242.
982
1907
0.28
419
005.
932
2151
2.53
717
982.
959
2036
3.69
817
076.
574
1732
4.71
522
168.
201
2738
27.1
93M
axA
vera
g e89
56.1
1447
08.3
6246
0.66
30.
000
1903
.447
1008
5.78
813
963.
785
1582
6.27
312
203.
278
1070
0.81
011
391.
526
8641
.657
1020
4.50
269
69.8
3040
86.2
2928
81.0
4387
29.0
7114
551.
351
1413
5.28
914
214.
033
1315
4.94
817
933.
705
1586
1.57
716
779.
033
1677
9.03
323
8342
.315
Ave
rage
Tota
l of A
PGIP
(ha)
KIS
Are
a (h
a)N
ew A
rea
(No.
1 +
No.
2) (h
a)
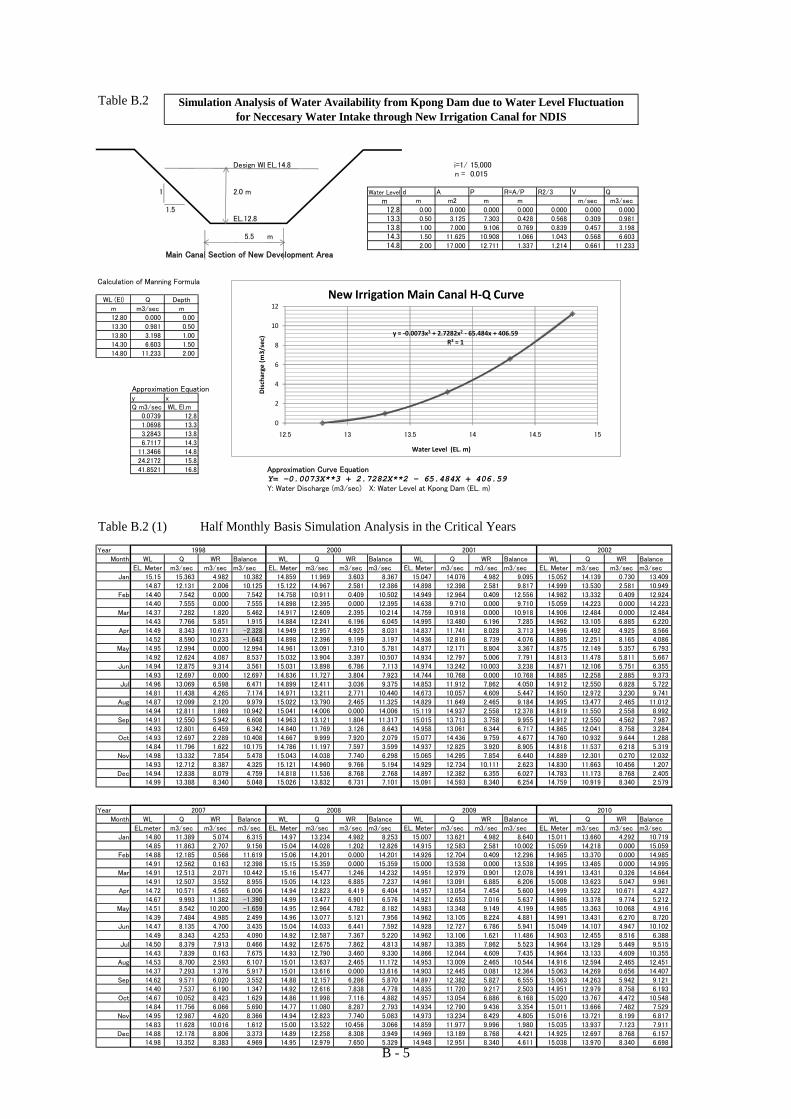
B - 5
Table B.2
Design WLEL.14.8 i=1/ 15,000n = 0.015
1 2.0 m Water Level d A P R=A/P R2/3 V Q
m m m2 m m m/sec m3/sec
1.5 12.8 0.00 0.000 0.000 0.000 0.000 0.000 0.000EL.12.8 13.3 0.50 3.125 7.303 0.428 0.568 0.309 0.981
13.8 1.00 7.000 9.106 0.769 0.839 0.457 3.1985.5 m 14.3 1.50 11.625 10.908 1.066 1.043 0.568 6.603
14.8 2.00 17.000 12.711 1.337 1.214 0.661 11.233
Main Canal Section of New Development Area
Calculation of Manning Formula
WL (El) Q Depthm m3/sec m12.80 0.000 0.0013.30 0.981 0.5013.80 3.198 1.0014.30 6.603 1.5014.80 11.233 2.00
Approximation Equationy xQ m3/sec WL El.m
0.0739 12.81.0698 13.33.2843 13.86.7117 14.3
11.3466 14.824.2172 15.841.8521 16.8 Approximation Curve Equation
Y= -0.0073X**3 + 2.7282X**2 - 65.484X + 406.59Y: Water Discharge (m3/sec) X: Water Level at Kpong Dam (EL. m)
Table B.2 (1) Half Monthly Basis Simulation Analysis in the Critical Years
YearMonth WL Q WR Balance WL Q WR Balance WL Q WR Balance WL Q WR Balance
EL. Meter m3/sec m3/sec m3/sec EL. Meter m3/sec m3/sec m3/sec EL. Meter m3/sec m3/sec m3/sec EL. Meter m3/sec m3/sec m3/secJan 15.15 15.363 4.982 10.382 14.859 11.969 3.603 8.367 15.047 14.076 4.982 9.095 15.052 14.139 0.730 13.409
14.87 12.131 2.006 10.125 15.122 14.967 2.581 12.386 14.898 12.398 2.581 9.817 14.999 13.530 2.581 10.949Feb 14.40 7.542 0.000 7.542 14.758 10.911 0.409 10.502 14.949 12.964 0.409 12.556 14.982 13.332 0.409 12.924
14.40 7.555 0.000 7.555 14.898 12.395 0.000 12.395 14.638 9.710 0.000 9.710 15.059 14.223 0.000 14.223Mar 14.37 7.282 1.820 5.462 14.917 12.609 2.395 10.214 14.759 10.918 0.000 10.918 14.906 12.484 0.000 12.484
14.43 7.766 5.851 1.915 14.884 12.241 6.196 6.045 14.995 13.480 6.196 7.285 14.962 13.105 6.885 6.220Apr 14.49 8.343 10.671 -2.328 14.949 12.957 4.925 8.031 14.837 11.741 8.028 3.713 14.996 13.492 4.925 8.566
14.52 8.590 10.233 -1.643 14.898 12.396 9.199 3.197 14.936 12.816 8.739 4.076 14.885 12.251 8.165 4.086May 14.95 12.994 0.000 12.994 14.961 13.091 7.310 5.781 14.877 12.171 8.804 3.367 14.875 12.149 5.357 6.793
14.92 12.624 4.087 8.537 15.032 13.904 3.397 10.507 14.934 12.797 5.006 7.791 14.813 11.478 5.811 5.667Jun 14.94 12.875 9.314 3.561 15.031 13.898 6.786 7.113 14.974 13.242 10.003 3.238 14.871 12.106 5.751 6.355
14.93 12.697 0.000 12.697 14.836 11.727 3.804 7.923 14.744 10.768 0.000 10.768 14.885 12.258 2.885 9.373Jul 14.96 13.069 6.598 6.471 14.899 12.411 3.036 9.375 14.853 11.912 7.862 4.050 14.912 12.550 6.828 5.722
14.81 11.438 4.265 7.174 14.971 13.211 2.771 10.440 14.673 10.057 4.609 5.447 14.950 12.972 3.230 9.741Aug 14.87 12.099 2.120 9.979 15.022 13.790 2.465 11.325 14.829 11.649 2.465 9.184 14.995 13.477 2.465 11.012
14.94 12.811 1.869 10.942 15.041 14.006 0.000 14.006 15.119 14.937 2.558 12.378 14.819 11.550 2.558 8.992Sep 14.91 12.550 5.942 6.608 14.963 13.121 1.804 11.317 15.015 13.713 3.758 9.955 14.912 12.550 4.562 7.987
14.93 12.801 6.459 6.342 14.840 11.769 3.126 8.643 14.958 13.061 6.344 6.717 14.865 12.041 8.758 3.284Oct 14.93 12.697 2.289 10.408 14.667 9.999 7.920 2.079 15.077 14.436 9.759 4.677 14.760 10.932 9.644 1.288
14.84 11.796 1.622 10.175 14.786 11.197 7.597 3.599 14.937 12.825 3.920 8.905 14.818 11.537 6.218 5.319Nov 14.98 13.332 7.854 5.478 15.043 14.038 7.740 6.298 15.065 14.295 7.854 6.440 14.889 12.301 0.270 12.032
14.93 12.712 8.387 4.325 15.121 14.960 9.766 5.194 14.929 12.734 10.111 2.623 14.830 11.663 10.456 1.207Dec 14.94 12.838 8.079 4.759 14.818 11.536 8.768 2.768 14.897 12.382 6.355 6.027 14.783 11.173 8.768 2.405
14.99 13.388 8.340 5.048 15.026 13.832 6.731 7.101 15.091 14.593 8.340 6.254 14.759 10.919 8.340 2.579
YearMonth WL Q WR Balance WL Q WR Balance WL Q WR Balance WL Q WR Balance
EL.meter m3/sec m3/sec m3/sec EL. Meter m3/sec m3/sec m3/sec EL. Meter m3/sec m3/sec m3/sec EL. Meter m3/sec m3/sec m3/secJan 14.80 11.389 5.074 6.315 14.97 13.234 4.982 8.253 15.007 13.621 4.982 8.640 15.011 13.660 4.292 10.719
14.85 11.863 2.707 9.156 15.04 14.028 1.202 12.826 14.915 12.583 2.581 10.002 15.059 14.218 0.000 15.059Feb 14.88 12.185 0.566 11.619 15.06 14.201 0.000 14.201 14.926 12.704 0.409 12.296 14.985 13.370 0.000 14.985
14.91 12.562 0.163 12.398 15.15 15.359 0.000 15.359 15.000 13.538 0.000 13.538 14.995 13.485 0.000 14.995Mar 14.91 12.513 2.071 10.442 15.16 15.477 1.246 14.232 14.951 12.979 0.901 12.078 14.991 13.431 0.326 14.664
14.91 12.507 3.552 8.955 15.05 14.123 6.885 7.237 14.961 13.091 6.885 6.206 15.008 13.623 5.047 9.961Apr 14.72 10.571 4.565 6.006 14.94 12.823 6.419 6.404 14.957 13.054 7.454 5.600 14.999 13.522 10.671 4.327
14.67 9.993 11.382 -1.390 14.99 13.477 6.901 6.576 14.921 12.653 7.016 5.637 14.986 13.378 9.774 5.212May 14.51 8.542 10.200 -1.659 14.95 12.964 4.782 8.182 14.983 13.348 9.149 4.199 14.985 13.363 10.068 4.916
14.39 7.484 4.985 2.499 14.96 13.077 5.121 7.956 14.962 13.105 8.224 4.881 14.991 13.431 6.270 8.720Jun 14.47 8.135 4.700 3.435 15.04 14.033 6.441 7.592 14.928 12.727 6.786 5.941 15.049 14.107 4.947 10.102
14.49 8.343 4.253 4.090 14.92 12.587 7.367 5.220 14.962 13.106 1.621 11.486 14.903 12.455 8.516 6.388Jul 14.50 8.379 7.913 0.466 14.92 12.675 7.862 4.813 14.987 13.385 7.862 5.523 14.964 13.129 5.449 9.515
14.43 7.839 0.163 7.675 14.93 12.790 3.460 9.330 14.866 12.044 4.609 7.435 14.964 13.133 4.609 10.355Aug 14.53 8.700 2.593 6.107 15.01 13.637 2.465 11.172 14.953 13.009 2.465 10.544 14.916 12.594 2.465 12.451
14.37 7.293 1.376 5.917 15.01 13.616 0.000 13.616 14.903 12.445 0.081 12.364 15.063 14.269 0.656 14.407Sep 14.62 9.571 6.020 3.552 14.88 12.157 6.286 5.870 14.897 12.382 5.827 6.555 15.063 14.263 5.942 9.121
14.40 7.537 6.190 1.347 14.92 12.616 7.838 4.778 14.835 11.720 9.217 2.503 14.951 12.979 8.758 6.193Oct 14.67 10.052 8.423 1.629 14.86 11.998 7.116 4.882 14.957 13.054 6.886 6.168 15.020 13.767 4.472 10.548
14.84 11.756 6.066 5.690 14.77 11.080 8.287 2.793 14.934 12.790 9.436 3.354 15.011 13.666 7.482 7.529Nov 14.95 12.987 4.620 8.366 14.94 12.823 7.740 5.083 14.973 13.234 8.429 4.805 15.016 13.721 8.199 6.817
14.83 11.628 10.016 1.612 15.00 13.522 10.456 3.066 14.859 11.977 9.996 1.980 15.035 13.937 7.123 7.911Dec 14.88 12.178 8.806 3.373 14.89 12.258 8.308 3.949 14.969 13.189 8.768 4.421 14.925 12.697 8.768 6.157
14.98 13.352 8.383 4.969 14.95 12.979 7.650 5.329 14.948 12.951 8.340 4.611 15.038 13.970 8.340 6.698
Simulation Analysis of Water Availability from Kpong Dam due to Water Level Fluctuationfor Neccesary Water Intake through New Irrigation Canal for NDIS
1998
2007
2001 20022000
2008 2009 2010
y = -0.0073x3 + 2.7282x2 - 65.484x + 406.59R² = 1
0
2
4
6
8
10
12
12.5 13 13.5 14 14.5 15
Dis
char
ge (m
3/se
c)
Water Level (EL. m)
New Irrigation Main Canal H-Q Curve

B - 6
Table B.2 (2) Daily Base Simulation Analysis in Critical Months
WL Q WR Balance WL Q WR Balance WL Q WR Balance WL Q WR BalanceDay EL. M m3/sec m3/sec m3/sec EL. M m3/sec m3/sec m3/sec EL. M m3/sec m3/sec m3/sec EL. M m3/sec m3/sec m3/sec
1 14.80 11.347 7.116 4.231 14.80 11.347 4.565 6.782 15.06 14.232 10.200 4.032 14.49 8.331 4.700 3.6322 15.01 13.652 7.116 6.536 14.87 12.092 4.565 7.527 15.05 14.115 10.200 3.915 14.56 8.972 4.700 4.2723 15.23 16.294 7.116 9.179 14.74 10.727 4.565 6.162 15.04 13.999 10.200 3.798 14.56 8.972 4.700 4.2724 14.92 12.638 7.116 5.522 14.36 7.204 4.565 2.639 14.22 6.082 10.200 -4.118 14.50 8.421 4.700 3.7225 14.78 11.138 7.116 4.023 14.57 9.065 4.565 4.500 14.37 7.288 10.200 -2.912 14.22 6.082 4.700 1.3836 14.79 11.242 7.116 4.127 14.84 11.769 4.565 7.204 14.28 6.551 10.200 -3.649 14.39 7.457 4.700 2.7587 15.05 14.115 7.116 7.000 14.77 11.035 4.565 6.470 14.41 7.628 10.200 -2.572 14.55 8.879 4.700 4.1798 14.80 11.347 7.116 4.231 14.88 12.200 4.565 7.635 14.30 6.712 10.200 -3.489 14.73 10.625 4.700 5.9269 14.60 9.348 7.116 2.233 14.83 11.663 4.565 7.098 14.45 7.976 10.200 -2.225 14.70 10.323 4.700 5.624
10 14.49 8.331 7.116 1.215 14.63 9.636 4.565 5.071 14.26 6.393 10.200 -3.807 14.50 8.421 4.700 3.72211 15.04 13.999 7.116 6.883 14.64 9.732 4.565 5.167 14.46 8.064 10.200 -2.137 14.41 7.628 4.700 2.92812 15.09 14.586 7.116 7.470 14.54 8.786 4.565 4.221 14.54 8.786 10.200 -1.414 14.48 8.241 4.700 3.54213 14.79 11.242 7.116 4.127 14.71 10.423 4.565 5.858 14.50 8.421 10.200 -1.779 14.27 6.472 4.700 1.77214 14.84 11.769 7.116 4.654 15.03 13.883 4.565 9.318 14.31 6.793 10.200 -3.408 14.31 6.793 4.700 2.09315 14.69 10.224 7.116 3.108 14.66 9.927 4.565 5.362 14.45 7.976 10.200 -2.225 14.35 7.121 4.700 2.42116 14.55 8.879 8.287 0.592 14.46 8.064 11.382 -3.319 14.26 6.393 4.985 1.408 14.46 8.064 4.253 3.81117 14.64 9.732 8.287 1.446 14.47 8.152 11.382 -3.230 14.39 7.457 4.985 2.472 14.28 6.551 4.253 2.29918 14.67 10.026 8.287 1.739 14.38 7.372 11.382 -4.010 14.31 6.793 4.985 1.808 14.40 7.542 4.253 3.29019 14.47 8.152 8.287 -0.135 14.52 8.603 11.382 -2.780 14.32 6.874 4.985 1.889 14.50 8.421 4.253 4.16820 14.71 10.423 8.287 2.137 14.55 8.879 11.382 -2.504 14.17 5.704 4.985 0.720 14.53 8.694 4.253 4.44121 14.84 11.769 8.287 3.483 14.53 8.694 11.382 -2.688 14.38 7.372 4.985 2.388 14.67 10.026 4.253 5.77322 15.18 15.673 8.287 7.387 14.40 7.542 11.382 -3.840 14.51 8.512 4.985 3.527 14.84 11.769 4.253 7.51723 15.06 14.232 8.287 5.945 14.33 6.956 11.382 -4.427 14.31 6.793 4.985 1.808 14.55 8.879 4.253 4.62624 14.98 13.310 8.287 5.023 14.77 11.035 11.382 -0.348 14.30 6.712 4.985 1.727 14.28 6.551 4.253 2.29925 14.84 11.769 8.287 3.483 15.14 15.185 11.382 3.803 14.34 7.038 4.985 2.053 14.31 6.793 4.253 2.54026 14.57 9.065 8.287 0.778 14.87 12.092 11.382 0.709 14.53 8.694 4.985 3.709 14.42 7.714 4.253 3.46227 14.78 11.138 8.287 2.851 14.97 13.197 11.382 1.814 14.43 7.801 4.985 2.816 14.46 8.064 4.253 3.81128 14.57 9.065 8.287 0.778 15.20 15.920 11.382 4.538 14.60 9.348 4.985 4.363 14.44 7.888 4.253 3.63529 14.79 11.242 8.287 2.955 14.68 10.124 11.382 -1.258 14.62 9.539 4.985 4.555 14.57 9.065 4.253 4.81230 14.69 10.224 8.287 1.937 14.73 10.625 11.382 -0.757 14.59 9.253 4.985 4.269 14.66 9.927 4.253 5.67531 15.05 14.115 8.287 5.828 14.23 6.159 4.985 1.174 14.23 6.159 4.253 1.906
WL Q WR Balance WL Q WR Balance WL Q WR Balance WL Q WR BalanceDay EL. M m3/sec m3/sec m3/sec EL. M m3/sec m3/sec m3/sec EL. M m3/sec m3/sec m3/sec EL. M m3/sec m3/sec m3/sec
1 14.43 7.801 1.820 5.981 14.45 7.976 10.671 -2.696 14.62 9.539 0.000 9.539 14.80 11.347 8.768 2.5792 14.54 8.786 1.820 6.966 14.35 7.121 10.671 -3.550 14.60 9.348 0.000 9.348 14.76 10.932 8.768 2.1633 14.10 5.196 1.820 3.375 14.15 5.556 10.671 -5.115 14.90 12.418 0.000 12.418 14.76 10.932 8.768 2.1634 14.20 5.929 1.820 4.109 14.10 5.196 10.671 -5.476 15.14 15.185 0.000 15.185 14.65 9.830 8.768 1.0625 14.22 6.082 1.820 4.262 14.49 8.331 10.671 -2.340 14.80 11.347 0.000 11.347 14.95 12.972 8.768 4.2046 14.45 7.976 1.820 6.155 14.69 10.224 10.671 -0.448 14.74 10.727 0.000 10.727 14.75 10.829 8.768 2.0617 14.44 7.888 1.820 6.068 14.83 11.663 10.671 0.992 14.95 12.972 0.000 12.972 14.46 8.064 8.768 -0.7048 14.49 8.331 1.820 6.511 14.67 10.026 10.671 -0.646 15.15 15.307 0.000 15.307 14.90 12.418 8.768 3.6509 14.82 11.557 1.820 9.737 15.04 13.999 10.671 3.327 15.10 14.705 0.000 14.705 14.66 9.927 8.768 1.159
10 14.16 5.630 1.820 3.810 14.72 10.524 10.671 -0.147 15.00 13.538 0.000 13.538 14.70 10.323 8.768 1.55511 14.15 5.556 1.820 3.736 14.43 7.801 10.671 -2.871 15.05 14.115 0.000 14.115 14.90 12.418 8.768 3.65012 14.17 5.704 1.820 3.884 14.55 8.879 10.671 -1.793 15.06 14.232 0.000 14.232 14.93 12.749 8.768 3.98113 14.32 6.874 1.820 5.054 14.45 7.976 10.671 -2.696 14.92 12.638 0.000 12.638 14.94 12.860 8.768 4.09214 14.51 8.512 1.820 6.691 14.25 6.315 10.671 -4.357 15.20 15.920 0.000 15.920 14.94 12.860 8.768 4.09215 14.54 8.786 1.820 6.966 14.20 5.929 10.671 -4.742 15.05 14.115 0.000 14.115 14.65 9.830 8.768 1.06216 14.60 9.348 5.851 3.497 14.22 6.082 10.233 -4.151 14.71 10.423 4.087 6.336 14.75 10.829 8.340 2.48917 14.24 6.237 5.851 0.386 14.15 5.556 10.233 -4.677 15.34 17.702 4.087 13.615 14.72 10.524 8.340 2.18518 13.92 3.996 5.851 -1.855 14.20 5.929 10.233 -4.304 15.10 14.705 4.087 10.618 14.56 8.972 8.340 0.63219 14.62 9.539 5.851 3.688 14.33 6.956 10.233 -3.277 15.02 13.767 4.087 9.680 14.88 12.200 8.340 3.86020 14.62 9.539 5.851 3.688 14.37 7.288 10.233 -2.945 15.02 13.767 4.087 9.680 14.95 12.972 8.340 4.63221 14.24 6.237 5.851 0.386 14.40 7.542 10.233 -2.691 14.81 11.452 4.087 7.365 14.70 10.323 8.340 1.98422 14.43 7.801 5.851 1.950 14.35 7.121 10.233 -3.112 15.22 16.169 4.087 12.082 14.50 8.421 8.340 0.08223 14.38 7.372 5.851 1.521 14.44 7.888 10.233 -2.345 15.05 14.115 4.087 10.028 14.95 12.972 8.340 4.63224 14.45 7.976 5.851 2.125 14.50 8.421 10.233 -1.812 14.95 12.972 4.087 8.885 14.94 12.860 8.340 4.52125 14.10 5.196 5.851 -0.655 14.22 6.082 10.233 -4.151 14.99 13.423 4.087 9.336 14.90 12.418 8.340 4.07826 14.25 6.315 5.851 0.464 14.90 12.418 10.233 2.185 14.83 11.663 4.087 7.576 14.67 10.026 8.340 1.68627 14.25 6.315 5.851 0.464 14.69 10.224 10.233 -0.010 14.88 12.200 4.087 8.113 14.98 13.310 8.340 4.97028 14.40 7.542 5.851 1.691 14.93 12.749 10.233 2.516 14.87 12.092 4.087 8.005 14.70 10.323 8.340 1.98429 14.70 10.323 5.851 4.472 14.95 12.972 10.233 2.739 14.77 11.035 4.087 6.948 14.50 8.421 8.340 0.08230 14.95 12.972 5.851 7.121 15.13 15.065 10.233 4.831 14.74 10.727 4.087 6.640 14.70 10.323 8.340 1.98431 14.86 11.984 5.851 6.133 14.40 7.542 4.087 3.455 14.74 10.727 8.340 2.387
Year/Month
Year/Month
2008 October 2007 April 2007 May 2007 June
1998 March 1998 April 1998 May 2002 December
0.000
2.000
4.000
6.000
8.000
10.000
12.000
14.000
16.000
1 2 3 4 5 6 7 8 9 10 11 12 13 14 15 16 17 18 19 20 21 22 23 24 25 26 27 28 29 30
Wat
er L
evel
(EL.
m)
and
Dis
chrg
e (m
3/se
c)
Day of April 1998
Water Availability and Necessary Intake Capacity for NDIS on Daily BasisApril 1998

B - 7
0.000
2.000
4.000
6.000
8.000
10.000
12.000
1st 2nd 1st 2nd 1st 2nd 1st 2nd 1st 2nd 1st 2nd 1st 2nd 1st 2nd 1st 2nd 1st 2nd 1st 2nd 1st 2nd
Mar Apr May Jun Jul Aug Sep Oct Nov Dec Jan Feb
Inta
ke C
apac
ity
(m3/
sec)
Half Month Period
Water Intake Pattern in 2004
NDISKIS
0.000
2.000
4.000
6.000
8.000
10.000
12.000
1st 2nd 1st 2nd 1st 2nd 1st 2nd 1st 2nd 1st 2nd 1st 2nd 1st 2nd 1st 2nd 1st 2nd 1st 2nd 1st 2nd
Mar Apr May Jun Jul Aug Sep Oct Nov Dec Jan Feb
Inta
ke C
apac
ity
(m3/
sec)
Half Month Period
Water Intake Patter in 2007
NDISKIS
0.000
2.000
4.000
6.000
8.000
10.000
12.000
1st 2nd 1st 2nd 1st 2nd 1st 2nd 1st 2nd 1st 2nd 1st 2nd 1st 2nd 1st 2nd 1st 2nd 1st 2nd 1st 2nd
Mar Apr May Jun Jul Aug Sep Oct Nov Dec Jan Feb
Inta
ke C
apac
ity
(m3/
sec)
Half Month Period
Water Intake Pattern 2010
KIS
NDIS
Fig. B.1 Water Intake Pattern for KIS and NDIS

B - 8
Fig. B.2 Water Level Fluctuation Curve at Kpong Dam Reservoir
14.2
14.3
14.4
14.5
14.6
14.7
14.8
14.9
15
15.1
15.2
15.3
15.4
15.5
15.6
15.7
Wat
er L
evel
(EL.
m)
Year
Water Level Fluctuation Curve at Kpong Dam Reservoire
13.00
14.00
15.00
16.00
17.00
1980 1985 1990 1995 2000 2005 2010 2015
Wat
er L
evel
(EL.
m)
Year
Annual Max. Min. Ave. Water Level at Kpong Dam Resevoir
Max
Min
Ave
Design Water Level : EL. 14.80

B - 9
19
98
Wate
r D
epth
=2 m
ete
rs
Canal B
ott
om
EL.1
2.0
Canal B
ott
om
EL.1
2.8
Kpong I
rrig
ation C
anal
New
Inta
ke C
anal
Secti
on
Desi
gn W
ate
r Level
EL.1
4.8
Wate
r D
epth
=2 m
ete
rs
Desig
n W
ate
r Level
EL.14.0
0
Rela
tionsh
ip a
mong
Kpong
Dam
Rese
rvoir W
ate
r Level Flu
ctu
atu
ion
and N
ew
Irr
igation C
anal and E
xist
ing
Kpong
Irriga
tion C
anal
13.5
0
14.0
0
14.5
0
15.0
0
15.5
0
16.0
0
16.5
0
05
10
15
20
25
30
35
Jan
Feb
Mar
Apr
May
Jun
Jul
Aug
Sep
Oct
Nov
Dec
1998
2007
13.8
0
14.0
0
14.2
0
14.4
0
14.6
0
14.8
0
15.0
0
15.2
0
15.4
0
05
10
15
20
25
30
35
系列
1
系列
2
系列
3
系列
4
系列
5
系列
6
系列
7
系列
8
系列
9
系列
10
系列
11
系列
12
2007
14.2
0
14.4
0
14.6
0
14.8
0
15.0
0
15.2
0
15.4
0
15.6
0
05
10
15
20
25
30
35
系列
1
系列
2
系列
3
系列
4
系列
5
系列
6
系列
7
系列
8
系列
9
系列
10
系列
11
系列
12
2008
Fig.
B.3
D
aily
Wat
er L
evel
Flu
ctua
tion
and
Elev
atio
n of
Irrig
atio
n C
anal
s

B - 10
Attachment(1/3)

B - 11
Attachment(2/3)

B - 12
Attachment(3/3)

B - 13