Embed Size (px)
Citation preview

Korean J. Chem. Eng., 24(5), 860-865 (2007)
SHORT COMMUNICATION
860
†To whom correspondence should be addressed.
E-mail: [email protected]
Preparation of poly(L-lactic acid) submicron particles in aerosol solventextraction system using supercritical carbon dioxide
Mi Yeong Kim, Ki-Pung Yoo* and Jong Sung Lim*,†
Clean Technology Research Center, Korea Institute of Science and Technology,39-1 Hawolgok-dong, Sungbuk-gu, Seoul 136-791, Korea
*Department of Chemical and Biomolecular Engineering, Sogang University,1 Sinsu-dong, Mapo-gu, Seoul 121-742, Korea
(Received 2 June 2006 • accepted 12 February 2007)
Abstract−The aerosol solvent extraction system process (ASES), which is one of the supercritical anti solvent pro-
cesses (SAS), was used to produce poly(L-lactic acid) (PLLA) into the submicron particles. Dichloromethane (DCM,
CH2Cl2) and carbon dioxide were selected as a solvent and as an antisolvent for PLLA, respectively. The objective of this
study was to investigate the effect of the various process parameters such as temperature, pressure, and solution con-
centration on PLLA particles. With increasing temperature and pressure, particle size was increased. Also, higher PLLA
concentration led to larger particle size and broader particle size distribution. A scanning electron microscope (SEM)
was used to observe the morphology and size of PLLA particles recrystallized by ASES process. The mean particle
size and its distribution of processed particles were measured by using a laser diffraction particle size analyzer (PSA).
Key words: Poly(L-lactic acid), ASES Process, Supercritical Carbon Dioxide, SAS Processes, Nano-particles, Recrystallization
INTRODUCTION
The supercritical antisolvent (SAS) process is used when a solute
produced into fine particles is not soluble in the supercritical fluid.
The fine particles are prepared by sudden reduction of the solubil-
ity of the solvent when solution containing the issued materials and
appropriate solvent is dissolved in supercritical solvent. It is effec-
tive in the preparation of submicron particles of thermally sensitive
medicine or protein without residual solvent and needs no spray
drying process. Conventional techniques such as milling, spray dry-
ing and solvent evaporation are not always suitable for producing
fine and pure particles. Spray drying can thermally denature com-
pounds, milling produces broad size distribution and solvent/emul-
sion evaporation techniques often leave residual solvents that are
difficult to remove [1]. The aerosol solvent extraction system pro-
cess (ASES) is one of the supercritical anti solvent processes (SAS).
The core of the ASES process is to spray a solution in the anti-
solvent environment throughout a fine nozzle. Through this action,
fine droplets are generated in the precipitator. This is called atomi-
zation and is expressed by dimensionless Weber number defined as
the ratio of the deformation force and the reformation force [2,3]:
(1)
Where ρA is the density of the antisolvent, v is the relative velocity,
d is the diameter of the droplets by spraying the solution, which
depends on the relative antisolvent-drop velocity and the antisolvent
density. The term σ is the surface tension [4]. The surface tension
also affects on droplet size. The numerator of Eq. (1) means the de-
formation force, and the denominator means the reformation force.
In general, the higher Nwe it has, the smaller the droplets are as the
result of atomization. Mukhopadhyay explained that the drop dy-
namics could be illustrated briefly by the following steps. As soon
as the drop comes in contact with surrounding supercritical fluid,
the supercritical fluid is rapidly diffused into the drop. The drop is
swollen by continuous 2-way mass transfer that is diffusion of su-
percritical fluid into drop and evaporation of solvent from drop sur-
face to flow of supercritical fluid. When the number of nuclei in a
droplet becomes abundant by continuous 2-way mass transfer, the
swollen drop is shrunk by back diffusion of supercritical fluid. They
clarified that substantial drop dynamics is more complex than the
above explanation [5]. The energy for solvent evaporation from the
droplet surface was supplied from the surrounding antisolvent by
conduction and convection. The evaporated solvent is incorporated
into the flow of antisolvent by convection and back diffusion. The
overall rate of evaporation is affected by pressure, temperature, drop-
let diameter, and the velocity difference between the droplet and
the surrounding gas [2]. After going through the 2-way mass trans-
fer, the fine particles are collected on a filter at the bottom of the
precipitator [5]. The two-way mass transfer is very important fac-
tor for micronization. Because the ASES is a semi-continuous pro-
cess, this process can obtain a higher supersaturation than that of
the GAS process in an instant. As a result, the particles produced
by this process have a very small size and narrow particle distribu-
tion.
In this study, we produced submicron particles of PLLA to apply
to the DDS (Drug Delivery System) in the form of microparticle/
microsphere by using the ASES process. Supercritical carbon diox-
ide was used as an antisolvent and dichloromethane was selected
as a solvent for PLLA. We investigated the effect of process param-
eters such as temperature, pressure, and concentration of PLLA on
the particle size and morphology of PLLA. In other words, the ef-
fect of process parameters on PLLA particles was investigated.
Nwe =
ρAv2
d
σ-------------
Preparation of poly(L-lactic acid) submicron particles in ASES using supercritical carbon dioxide 861
Korean J. Chem. Eng.(Vol. 24, No. 5)
EXPERIMENTAL SECTION
1. Materials
PLLA (Mw 85,000-160,000) was purchased from Sigma Ald-
rich Korea LTD. It was a long rod shape having average length of
350µm and width of 100µm. Carbon dioxide (purity 99.9%), used
as an antisolvent for PLLA, was obtained from Sinyang Oxygen.
Dichloromethane (99.9%, Sigma-Aldrich) was used as a solvent for
PLLA. Methanol (98%, J. T. Baker) was selected for dispersion of
the PLLA particles. They were used without further purification.
2. Experimental Apparatus
A schematic diagram of the ASES apparatus is shown in Fig. 1.
It was composed of an antisolvent supplying system, a solution feed-
ing system, a precipitation vessel (KISTEC Co, Korea), two filters
(0.5µm, Swagelok), a back pressure regulator (Tescom Corp.), and
a gas vent system. A precipitator is placed on the center of a ther-
mostat air chamber. Its pressure was controlled by a back pressure
regulator located between the filters and depressurizing tank. Pure
CO2 was cooled by refrigeration bath circulator (Jeio tech) and con-
tinuously fed into a precipitator from the top of vessel by using a high
pressure pump (Oriental Motors). It is continuously vented through
passing a back pressure regulator and dry gas meter (Taekwang En-
ergy S/T-3). The solution containing PLLA was sprayed into the
precipitator by a high pressure liquid pump (Oriental Motors) through
a fine nozzle (0.63 mm internal diameter) located on the top of ves-
sel. It remained in a depressurizing tank (SUS 316) or vented with
CO2 as passing a dry gas meter.
3. Experimental Procedure
The precipitation vessel was filled with CO2 until desired pres-
sure was reached and was heated to the desired operating tempera-
ture. After the flow rate of CO2 was maintained constantly at a de-
signated value, liquid solution containing PLLA was injected into
the precipitator, and was broken up into droplets by a fine nozzle.
As the atomized droplet came in contact with the antisolvent CO2,
the latter diffused into the solution and the solvent evaporated from
the droplet surface [5]. At this time, the solution became cloudy
and nucleation followed. Consequently, polymers were crystallized
to fine particles and particles were collected on a metal filter by con-
tinuous flow of CO2. This continued until the liquid solution in the
solution feed tank was injected completely into the precipitator while
CO2 continued to pump into the precipitator to remove the residual
liquid content, which could remain on the particles for several min-
utes and make particles staying in the vessel leave for a filter. To
obtain the collected particles, the valve between the vessel and filter
was closed and then the pressure in the filter was gradually depres-
surized by using a back pressure regulator. Solvent separated with
the PLLA by CO2 during the spraying process remained in the de-
pressurizing tank or was vented with CO2 passing through a dry
gas meter.
4. Particle Characterization
The morphology of the collected particles was analyzed by FE-
SEM (Field emission scanning electron microscopy; HETACHI).
The samples for SEM were attached by using double-coated adhe-
sive tape and coated with gold by a sputter coater. PSA (Laser dif-
fraction particle size analyzer; LS 230, Coulter Electronics) was
used to measure the mean particle size and particle size distribu-
tion. It uses interaction between a laser and particles, such as dif-
fraction, refraction, reflection and absorbance. Before particles were
analyzed, they were dispersed in methanol for 1 min by using a son-
icator (Power Sonic 510, Hwa Shin Technology Co.).
RESULTS AND DISCUSSION
1. The Effect of Temperature on Particles
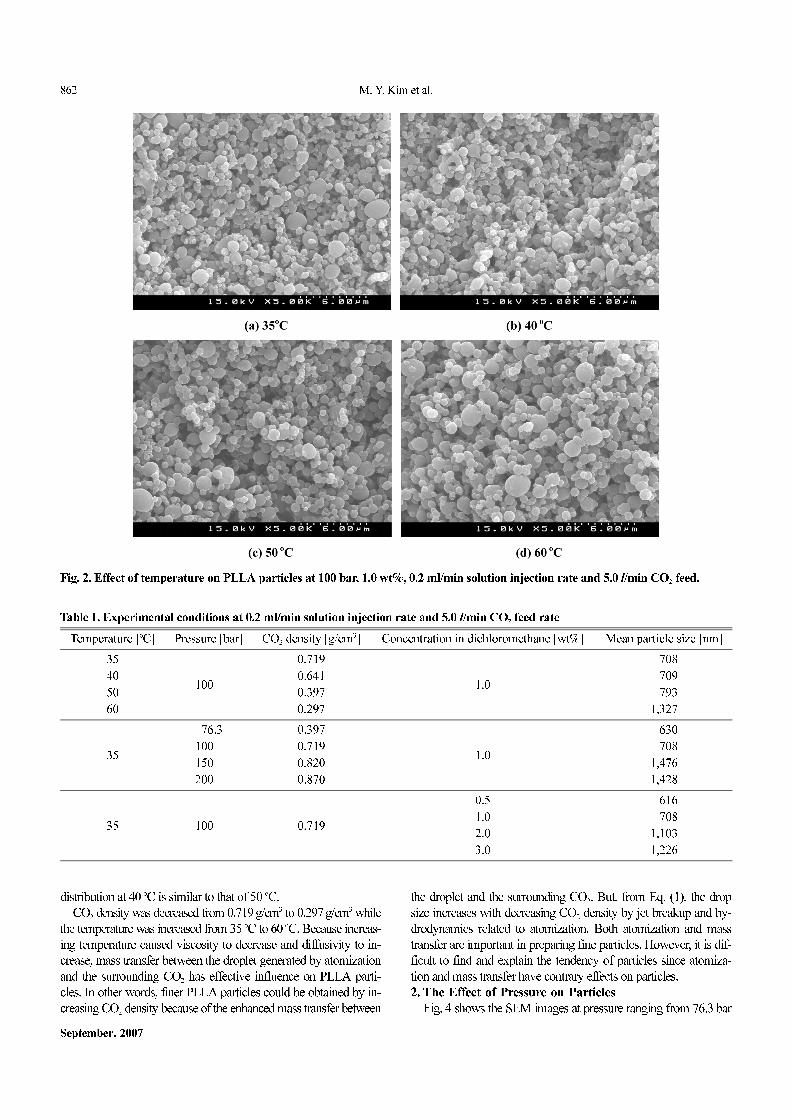
The SEM images of Fig. 2(a)-2(d) show the effect of tempera-
ture on PLLA particle size and morphology. The system tempera-
tures ranged from 35 oC to 60 oC, as shown in Table 1 and Fig. 2.
Fresh CO2 of 0.53 kg/hr was continuously fed into the precipitator
by using the high pressure pump. The other conditions were con-
stant at 100 bar, 1.0 wt% solution concentration, 0.2 ml/min solu-
tion injection rate. The morphology of the particles was not affected
heavily by temperature through the range of experimental tempera-
tures. As shown in Table 1, however, the mean particle size remark-
ably increased from 707.85 nm to 1326.61 nm with increasing tem-
perature because relatively small drops were produced with decreas-
ing the temperature due to high gas density which increases aero-
dynamic forces and break up. Especially, when the temperature was
changed from 50 oC to 60 oC, considerable change in PLLA mean
particle size was observed compared to the other experimental con-
ditions. During the temperature rise from 35 oC to 40 oC, the particle
size was not heavily changed as shown in Fig. 2(a)-2(b). Fig. 3 shows
particle sizes and their distribution measured by a laser diffraction
particle size analyzer (PSA) which sizes and counts the particles
by measuring changes in electrical resistance produced by the non-
conductive particles suspended in an electrolyte. A horizontal axis
indicates particle size (nm) and a vertical axis means particle num-
ber (%) equivalent to the horizontal axis. Particle size distribution
was also larger with increasing the temperature. The particle size
Fig. 1. Schematic diagram of apparatus for the aerosol solvent ex-traction system (ASES).1. CO2 cylinder 10. Back-pressure regulator2. Cooling circulator 11. Depressurizing tank3. High pressure pump 12. Rotameter4. Vessel 13. Solution pump5. Pressure transducer 14. Solution tank6. Thermocouple 15. Temperature controller7. Rupture 16. Pressure indicator8. Air bath 17. Temperature indicator9. Filter 18. Heat exchanger
862 M. Y. Kim et al.
September, 2007
distribution at 40 oC is similar to that of 50 oC.
CO2 density was decreased from 0.719 g/cm3 to 0.297 g/cm3 while
the temperature was increased from 35 oC to 60 oC. Because increas-
ing temperature caused viscosity to decrease and diffusivity to in-
crease, mass transfer between the droplet generated by atomization
and the surrounding CO2 has effective influence on PLLA parti-
cles. In other words, finer PLLA particles could be obtained by in-
creasing CO2 density because of the enhanced mass transfer between
the droplet and the surrounding CO2. But, from Eq. (1), the drop
size increases with decreasing CO2 density by jet breakup and hy-
drodynamics related to atomization. Both atomization and mass
transfer are important in preparing fine particles. However, it is dif-
ficult to find and explain the tendency of particles since atomiza-
tion and mass transfer have contrary effects on particles.
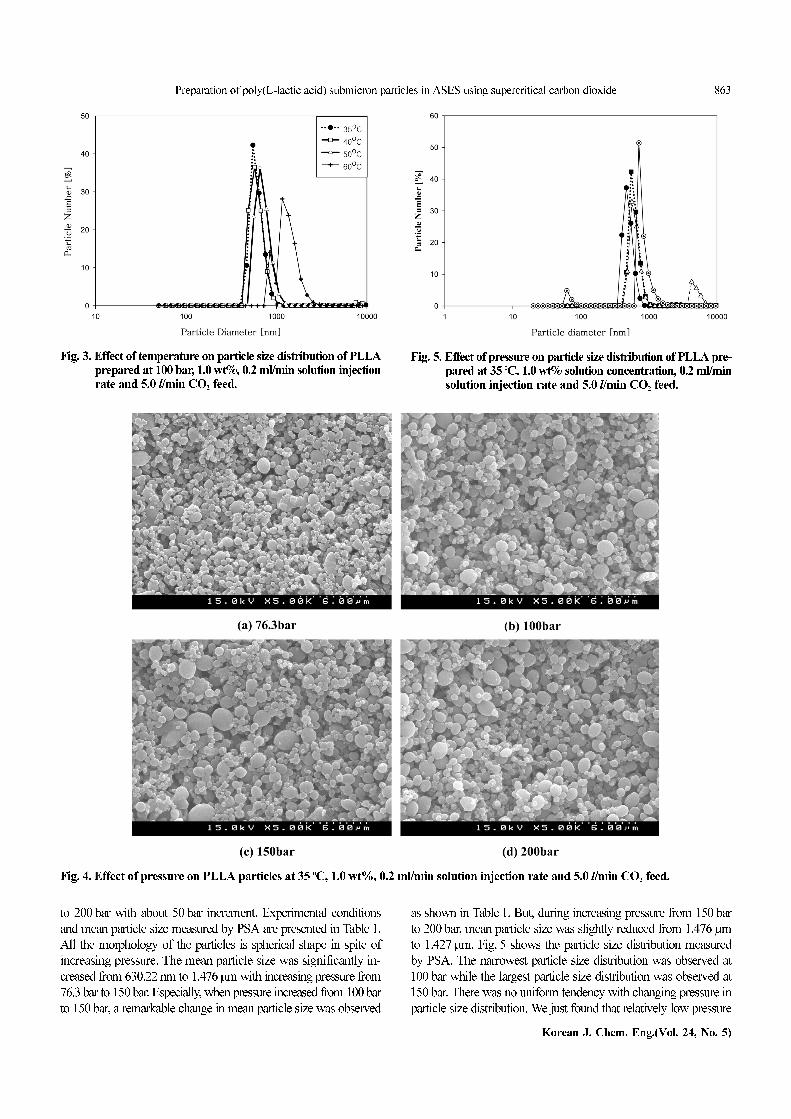
2. The Effect of Pressure on Particles
Fig. 4 shows the SEM images at pressure ranging from 76.3 bar
Table 1. Experimental conditions at 0.2 ml/min solution injection rate and 5.0 l/min CO2 feed rate
Temperature [oC] Pressure [bar] CO2 density [g/cm3] Concentration in dichloromethane [wt%] Mean particle size [nm]
35
100.0
0.719
1.0
0,708
40 0.641 0,709
50 0.397 0,793
60 0.297 1,327
35
076.3 0.397
1.0
0,630
100.0 0.719 0,708
150.0 0.820 1,476
200.0 0.870 1,428
35 100.0 0.719
0.5 0,616
1.0 0,708
2.0 1,103
3.0 1,226
Fig. 2. Effect of temperature on PLLA particles at 100 bar, 1.0 wt%, 0.2 ml/min solution injection rate and 5.0 l/min CO2 feed.
Preparation of poly(L-lactic acid) submicron particles in ASES using supercritical carbon dioxide 863
Korean J. Chem. Eng.(Vol. 24, No. 5)
to 200 bar with about 50 bar increment. Experimental conditions
and mean particle size measured by PSA are presented in Table 1.
All the morphology of the particles is spherical shape in spite of
increasing pressure. The mean particle size was significantly in-
creased from 630.22 nm to 1.476µm with increasing pressure from
76.3 bar to 150 bar. Especially, when pressure increased from 100 bar
to 150 bar, a remarkable change in mean particle size was observed
as shown in Table 1. But, during increasing pressure from 150 bar
to 200 bar, mean particle size was slightly reduced from 1.476µm
to 1.427µm. Fig. 5 shows the particle size distribution measured
by PSA. The narrowest particle size distribution was observed at
100 bar while the largest particle size distribution was observed at
150 bar. There was no uniform tendency with changing pressure in
particle size distribution. We just found that relatively low pressure
Fig. 3. Effect of temperature on particle size distribution of PLLAprepared at 100 bar, 1.0 wt%, 0.2 ml/min solution injectionrate and 5.0 l/min CO2 feed.
Fig. 4. Effect of pressure on PLLA particles at 35 oC, 1.0 wt%, 0.2 ml/min solution injection rate and 5.0 l/min CO2 feed.
Fig. 5. Effect of pressure on particle size distribution of PLLA pre-pared at 35 oC, 1.0 wt% solution concentration, 0.2 ml/minsolution injection rate and 5.0 l/min CO2 feed.

864 M. Y. Kim et al.
September, 2007
Fig. 6. Variation of the diffusivity in CO2 as a function of temper-ature at several pressures [6].
Fig. 7. Variation of the viscosity of CO2 with pressure at three dif-ferent temperatures [7].
Fig. 8. Effect of concentration on PLLA particles at 35 oC, 100 bar, 0.2 ml/min solution injection rate and 5.0 l/min CO2 feed.

Preparation of poly(L-lactic acid) submicron particles in ASES using supercritical carbon dioxide 865
Korean J. Chem. Eng.(Vol. 24, No. 5)
led to narrow particle size distribution.
Variation of the diffusivity in CO2 and viscosity of CO2 was pres-
ented as functions of temperature and pressure in Fig. 6 [6] and Fig.
7 [7], respectively. At 35 oC in Fig. 6, diffusivity of CO2 decreases
considerably as the pressure increases from 76.3 bar to 100 bar and
from 100 bar to 150 bar. But, when the pressure goes up from 150
bar to 200 bar, diffusivity of CO2 is slightly reduced compared with
the other pressure ranges. In Fig. 7, viscosity of CO2 increases with
pressure at the same temperature. Because, in general, reduced dif-
fusivity and increased viscosity hinder mass transfer between the
droplets and the surrounding CO2, particle size must be increased
with increasing pressure. But, increasing pressure led to fine drop-
lets due to increasing aerodynamic force and breakup. Thus, vari-
ous particle sizes were obtained with every pressure increment due
to the contrary effect of mass transfer and atomization on particles.
These results agreed well with previous ones such as Rantakyla
[1], Jarmer [8] and Song [9]. But Reverchon [10] obtained differ-
ent results from us in that it had no effect on PLLA particles size
and its distribution and they admitted that different results were ob-
tainable. Also, they paid attention to the fact that all the results con-
verged in indicating a limited range of particle size variation when
the various process parameters were modified.
3. The Effect of PLLA Concentration on Particles
In Fig. 8, the SEM images show the effect of weight percent of
PLLA in DCM on particle size and their morphology. Concentra-
tion of PLLA in DCM varied from 0.5 wt% to 2.0 wt% with 0.5
wt% increment. As can be seen in Fig. 8, the particle size was sen-
sitive to the solute concentration in the liquid and particle size was
increased remarkably with increasing concentration while only spher-
ical particles were measured without aggregation. The finest parti-
cles were prepared by spraying 0.5 wt% PLLA in DCM solution
into CO2 at 35 oC, 100 bar, 0.2 ml/min solution injection rate and
5.0 l/min CO2 feed rate.
As shown in Fig. 9, the smallest particle size and the narrowest
particle size distribution were observed at 0.5 wt% concentration
of PLLA, that is, at the lowest solute concentration. Particle size
could be easily controlled from 615 nm to 1.2µm with the concen-
tration ranging from 0.5 wt% to 3.0 wt% of PLLA in DCM. It could
be explained from the aspect of nucleation and growth of particles.
As the solution became deeper, saturation was reached at an early
stage of the process and growth process superimposed on nucle-
ation [11]. In short, larger particles and broader particle size distri-
bution were obtained.
CONCLUSIONS
PLLA submicron particles were successfully produced by ASES
process. The atomization and mass transfer which affect the parti-
cle size and its distributions were also easily adjusted by controlling
the temperature and pressure of CO2. The particle size was increased
with increasing temperature from 707 nm to 1.3µm because of the
predominant effect of atomization by jet breakup and hydrodynam-
ics than enhancing the mass transfer which occurred between the
droplets and the surrounding CO2. The particle size was also in-
creased with increasing pressure due to the predominant effect of
reducing mass transfer rather than enhancing atomization. Increas-
ing PLLA concentration also led to large particles by obstructing
the mass transfer between the droplets and the surrounding CO2
due to the increased viscosity and the early reaching to saturation.
Thus the particle size and its distributions of PLLA can be easily
adjusted by using the ASES process by controlling the temperature,
pressure and solute concentration.
ACKNOWLEDGMENT
The authors gratefully acknowledge financial support from the
Korea Ministry of Commerce, Industry & Energy and the Korea
Energy Management Corporation. This research was also supported
by Sogang University Research Grant in 2005.
REFERENCES
1. M. Rantakyla, M. Jantti, O. Aaltonen and M. Hurme, J. Supercrit.
Fluids, 24, 251 (2002).
2. A. H. Lefebvre, Atomization and sprays, Taylor & Francis, 309
(1989).
3. Y. W. Lee, HWAHAK KONGHAK, 41, 679 (2003).
4. J. Y. Andrew and J. D. John, Atomization of melts, Clarendon press,
Oxford, 25 (1994).
5. M. Mukhopadhyay and S. V. Dalvi, J. of Supercrit. Fluids, 30, 333
(2004).
6. M. E. Paulaitis, J. M. L. Penninger, R. D. Gray and Davidson, Chem-
ical engineering at supercritical fluid conditions, Ann Arbor, MI,
Ann Arbor Science (1983).
7. R. P. de Filippi and M. E. Chung, Laboratory evaluation of critical
fluid extraction for environmental applications, Report EPA-600/2-
85-045. April (1980).
8. D. J. Jarmer, C. S. Lengsfeld and T. W. Randolph, J. of Supercriti-
cal Fluids, 27, 317 (2003).
9. K. H. Song, C. H. Lee, J. S. Lim and Y. W. Lee, Korean J. Chem.
Eng., 19, 139 (2002).
10. E. Reverchon, G. D. Porta, I. de Rosa, P. Subra and D. Letourneur,
J. of Supercritical Fluids, 18, 239 (2002).
11. E. Reverchon, I. de Marcon, G. Caputo and G. D. Porta, J. of Super-
critical Fluids, 20, 293 (2003).
Fig. 9. Effect of concentration on particle size distribution of PLLAprepared at 35 oC, 100 bar, 0.2 ml/min solution injection rateand 5.0 l/min CO2 feed.