Embed Size (px)
Citation preview
International Journal of Academic Scientific Research
ISSN: 2272-6446 Volume 6, Issue 1 (February - March 2018), PP 09-25
www.ijasrjournal.org
www.ijasrjournal.org 9 | Page
Preparation of insulating concrete and testing its thermal
conductivity and porosity and mechanical resistance and
modelling the porous medium of it
Majda Barmada1, Amer Haj Taleb2, Rolly Tawfeek Mardelly3
1,2,3Department of Energy Engineering, Faculty of Mechanical Engineering, University of Aleppo
Abstract:Thermal insulation plays a very important role in the field of energy conservation in buildings and
in saving the cost of heating and air - conditioning equipment and the fuel necessary for that.
In the first phase of this research ,three models for concrete insolation were prepared which included in their
composition cement and aluminium powder and differ from each other by adding sodium hydroxide, sodium
chloride and calcium carbonate to the cement with aluminium powder, which reacts with lime located in the
cement and releases hydrogen gas that leaves the dough to be replaced by air to get porous structure. In this
phase, the thermal conductivity test is carried out using a thermocouple measurement device, density and
porosity measurement using a sensitive balance with immersion of samples in water, and measurement of
sound absorption coefficient using receiver and transmitter of vibration waves and finally conducting
mechanical resistance test using pressure test application device to obtain samples of insulating concrete with
low thermal conductivity(0.1 − 0.2)𝑊
𝑚.𝐾 and low pores 22.1% and with bulk densities ranging from(587.1 −
1185.35) 𝐾𝑔
𝑚3 and absorption of sound coefficient ranges from (0.269- 0.14)𝑐𝑚−1,and mechanical resistance
ranging from (0.9-5.89) Mpa. In the second phase: a model was provided for the study of porous media
based on the fractal theory to create a relationship that identifies the effective thermal conductivity (ETC)
coefficient of two samples manufactured from the same insulating material, for two different humidity
degrees: Sw (0.291-0.313) -the obtained the ETC for the first sample was0.1246(𝑊
𝑚.𝐾), and for the second
sample: 0.1309 (𝑊
𝑚.𝐾) - and to determine the characteristic dimensions (L, C) of the modeling, the dimension
of porous and the iteration number (n).
Keyword: AAC(Aerated Autoclaved Concrete),FC (Foamed Concrete),The insulating materials, the cellular
concrete, Sierpinski carpet, the porosity, the bulk density, fractal dimension.
Introduction
No longer energy conservation requirements in buildings can be an omission than in light of the
unlimited rise in the prices of energy sources and the burden that this brings to low - income people, in the
context of the rationalization of public consumption and wastage.
the beginning was with The Swedes, to make blended cement with lime, water and sand (Sometimes
plaster is added as an accelerator to harden the concrete)The Mix expands and swells by the addition of
Aluminium powder where the interaction leads to the generation of Hydrogen gas which gives the bubbly
gaseous structure within the concrete and this structure plays a major role in giving the concrete its insolating
properties.
The issue of energy conservation in buildings has become one of the most important topics at present
in order to reduce the burden on those with limited income by reducing the consumption of fuel. This is done
by applying appropriate thermal insulation. Thermal insulation is defined as the use of materials that help
reduce heat leakage and transfer from inside of the building to outside in winter and vice versa in summer,
through walls, roofs, floors and ventilation openings.
International Journal of Academic Scientific Research
ISSN: 2272-6446 Volume 6, Issue 1 (February - March 2018), PP 09-25
www.ijasrjournal.org 10 | Page
Egyptian built pyramids using calcified gypsum, and the Romans used in the construction of
amphitheatres lime resulting from stones after mixing it with sand and water to link building stones, but for
underwater installations Romans resorted to mixing lime with volcanic ash or baked clay powder.
In 1828,JosephAspdinmixed lime with limestone, then the mix was dried and then grinded, baked
and then refined to be the first to create Portland cement
In 1845, Isaac Johnson determined the proportions of raw materials used in construction as well as
the temperature of roasting to reach the Poznan cement.
In 1929 it was the discovery of AAC (Autoclaved Aerated Concrete) by the Swedish architect and
inventor Dr. Johan Axel Eriksson in cooperation with Henrik Kreüger, to produce a building material
popularly used and to be spread around the world.
Later the production of AAC was slowed in Europe, while the industry is growing and flourishing in
Central Asia, China, India and the Middle East, due to the increasing population density and relatively high
building density.
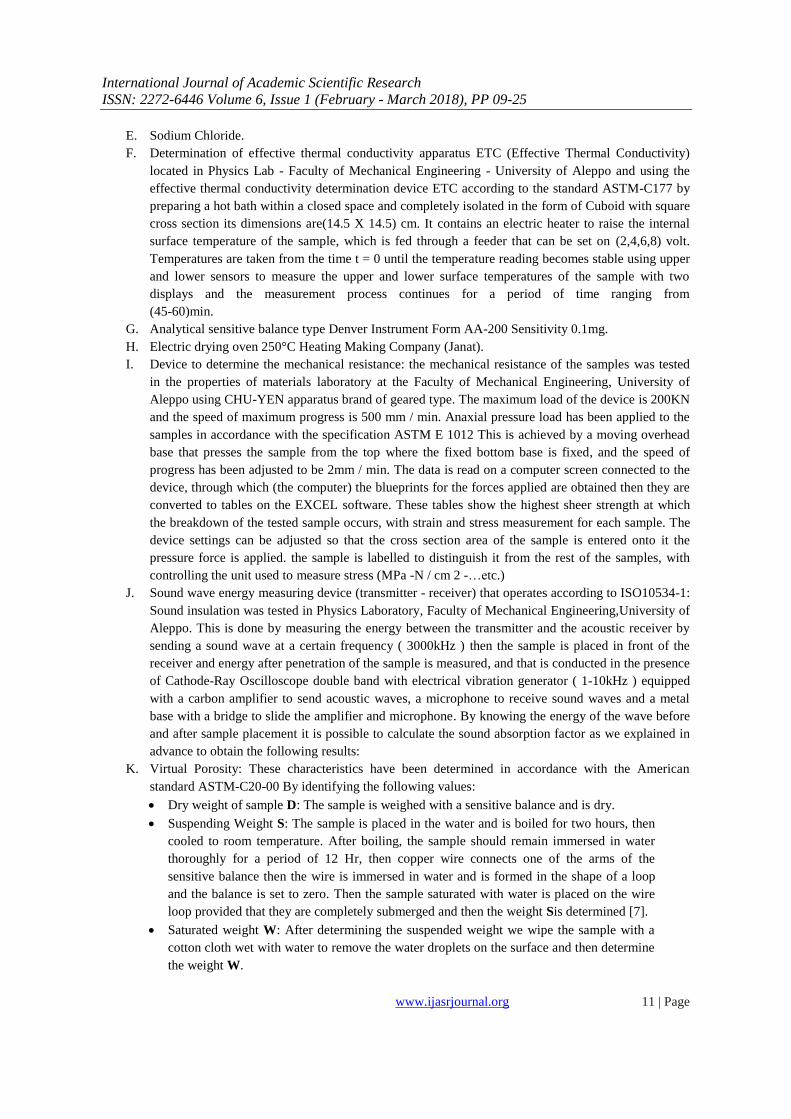
Lightweight concrete that is saturated with gas are classified (AC) Aerated Concrete to:
(AAC): Aerated Autoclaved Concrete
(NAAC):Non Aerated Autoclaved Concrete Also called (FC) Foamed concrete. Fig (1) shows the
classification of gas saturated or cellular concrete[1].
Fig.1:Methods of preparation of cellular concrete
The first checks by the interaction of aluminium powder with cement, lime and fine sand. The
second by injection of foam generated in advance or entrance of foam generating agent to the cement.
The foam concrete differs from the concrete of the saturated gas processed with autoclave in factor
generating voids (air pockets), because air pockets in the foam concrete form by the foam agent and this is a
physical process.[2]
Materials and Methods
Section 1: A. Portland cement conforming to the specification ASTMC150
B. Limestone (CaO)
C. Aluminium powder from aluminium waste.
D. Sodium Hydroxide NaOH.
International Journal of Academic Scientific Research
ISSN: 2272-6446 Volume 6, Issue 1 (February - March 2018), PP 09-25
www.ijasrjournal.org 11 | Page
E. Sodium Chloride.
F. Determination of effective thermal conductivity apparatus ETC (Effective Thermal Conductivity)
located in Physics Lab - Faculty of Mechanical Engineering - University of Aleppo and using the
effective thermal conductivity determination device ETC according to the standard ASTM-C177 by
preparing a hot bath within a closed space and completely isolated in the form of Cuboid with square
cross section its dimensions are(14.5 X 14.5) cm. It contains an electric heater to raise the internal
surface temperature of the sample, which is fed through a feeder that can be set on (2,4,6,8) volt.
Temperatures are taken from the time t = 0 until the temperature reading becomes stable using upper
and lower sensors to measure the upper and lower surface temperatures of the sample with two
displays and the measurement process continues for a period of time ranging from
(45-60)min.
G. Analytical sensitive balance type Denver Instrument Form AA-200 Sensitivity 0.1mg.
H. Electric drying oven 250°C Heating Making Company (Janat).
I. Device to determine the mechanical resistance: the mechanical resistance of the samples was tested
in the properties of materials laboratory at the Faculty of Mechanical Engineering, University of
Aleppo using CHU-YEN apparatus brand of geared type. The maximum load of the device is 200KN
and the speed of maximum progress is 500 mm / min. Anaxial pressure load has been applied to the
samples in accordance with the specification ASTM E 1012 This is achieved by a moving overhead
base that presses the sample from the top where the fixed bottom base is fixed, and the speed of
progress has been adjusted to be 2mm / min. The data is read on a computer screen connected to the
device, through which (the computer) the blueprints for the forces applied are obtained then they are
converted to tables on the EXCEL software. These tables show the highest sheer strength at which
the breakdown of the tested sample occurs, with strain and stress measurement for each sample. The
device settings can be adjusted so that the cross section area of the sample is entered onto it the
pressure force is applied. the sample is labelled to distinguish it from the rest of the samples, with
controlling the unit used to measure stress (MPa -N / cm 2 -…etc.)
J. Sound wave energy measuring device (transmitter - receiver) that operates according to ISO10534-1:
Sound insulation was tested in Physics Laboratory, Faculty of Mechanical Engineering,University of
Aleppo. This is done by measuring the energy between the transmitter and the acoustic receiver by
sending a sound wave at a certain frequency ( 3000kHz ) then the sample is placed in front of the
receiver and energy after penetration of the sample is measured, and that is conducted in the presence
of Cathode-Ray Oscilloscope double band with electrical vibration generator ( 1-10kHz ) equipped
with a carbon amplifier to send acoustic waves, a microphone to receive sound waves and a metal
base with a bridge to slide the amplifier and microphone. By knowing the energy of the wave before
and after sample placement it is possible to calculate the sound absorption factor as we explained in
advance to obtain the following results:
K. Virtual Porosity: These characteristics have been determined in accordance with the American
standard ASTM-C20-00 By identifying the following values:
Dry weight of sample D: The sample is weighed with a sensitive balance and is dry.
Suspending Weight S: The sample is placed in the water and is boiled for two hours, then
cooled to room temperature. After boiling, the sample should remain immersed in water
thoroughly for a period of 12 Hr, then copper wire connects one of the arms of the
sensitive balance then the wire is immersed in water and is formed in the shape of a loop
and the balance is set to zero. Then the sample saturated with water is placed on the wire
loop provided that they are completely submerged and then the weight Sis determined [7].
Saturated weight W: After determining the suspended weight we wipe the sample with a
cotton cloth wet with water to remove the water droplets on the surface and then determine
the weight W.
International Journal of Academic Scientific Research
ISSN: 2272-6446 Volume 6, Issue 1 (February - March 2018), PP 09-25
www.ijasrjournal.org 12 | Page
the size V : Equal to the subtract of the weight of the suspension weight from saturated
weight, V = W-S.
(Knowing that 1g Equal 1cm 3At room temperature)
Laboratory work
The first sample:
Subject Percentage(%) Portland cement 84
Calcium carbonate 15
Aluminium 1
Solid components were weighed so that the total weight of the sample was 150 gr Afterthat the solid
ingredients were blended well. Add water gradually until grout (cement paste) is formed with continuous
manual mixing, and as a result the following reaction, gas is released according to the equation [3]:
2O+3H2.6H3O23CaO.Al→O2+6H 22Al+3Ca(OH)
The sample was casted into a mold with dimensions (14.5 x 14.5) cmand with height no more than
(1.5) cm, Then vibrating casting was conducted to ensure continuity of the reaction and to get two planar
bases with the addition of a little sodium hydroxide solution ( NaOH ) of a concentration 1N to the surface of
the upper sample gradually . The samples were left to dry with the addition of water after initial dryness and
solidification in intermittent intervals until the final form of the sample was obtained after approximately 7
days, then it is placed in an oven at a temperature not exceeding 105 ℃ for about 6 hours .
The second sample:
Subject Percentage(%) Portland cement 99
Aluminium 1
The solid components of the sample were weighed so that the total weight of the sample was 150 gr
according to the above ratios.weighting, blending and casting operations were completed in a similar manner
to the first sample.
The Third Sample:
Subject Percentage(%) Portland cement 89
Sodium chloride ( NaCl ) 10
Aluminium 1
The solid components of the sample were weighed so that the total weight of the sample was 150 gr
according to the above ratios, weighting, mixing and casting processes were performed in a similar manner to
the first sample.
Results and discussion
4.1.Thermalconductivity:The thermal conductivity was tested in the physics laboratory at the Faculty of
Mechanical Engineering, University of Aleppo, using the ASTM-C177 effective thermal conductivity
detection device by preparing an indoor heated bath with an electric heater to raise the internal surface
International Journal of Academic Scientific Research
ISSN: 2272-6446 Volume 6, Issue 1 (February - March 2018), PP 09-25
www.ijasrjournal.org 13 | Page
temperature of the sample, Feeding The measurement process continues for a period of time ranging from min
(45-60).
In order to calculate the difference between 1and2, which represent the upper and lower
temperatures,The thermal conductivity from the apparatus is determined by calculating the difference between
1𝑎𝑛𝑑 2which represent the temperature of the upper and lower sensors. From Fourier's law:
𝑄 = 𝑘. 𝐴.∆
𝐿 (1)
Where
Q: thermal flow is estimated by [W]
: is the difference between the temperature of the surface of the two samples is estimated by [𝐾°]
k: Thermal conductivity coefficient estimated by [W
m.𝐾°]
A: sample surface area is estimated by [m2]
L: The thickness of the sample is estimated by [m]
Thermal flow is calculated using the relationship:
𝑄 = 𝑉 × 𝐼 (2)
V: The feeding voltage is estimated by [V] (voltage) and is applied at 8V
I: The current strength is estimated at [A] (ampere) and applied at 1.1A
8.8 =𝑘(14.6)2 × 10−4 × (24)
1 × 10⁻²⇒ 𝑘 = 0.167
𝑊
𝑚. 𝐾
Error in measuring thermal conductivity:
∆𝑘
𝑘=
∆𝑉
𝑉+
∆𝐼
𝐼+
∆𝑋
𝑋+
∆1
1
+∆2
2
∆𝑉 = 0.025𝑉𝑜𝑙𝑡
, ∆𝐼 = 0.025 𝐴, ∆𝑋 = 0.5 mm, ∆1 = 0.5 ℃∆2 = 0.5 ℃
𝑘 = (0.167 ± 0.0164)𝑊
𝑚. 𝐾
Thus the thermal conductivity determined for the second and third samples with calculating the
committed error in the same way according to the following table (1), which shows the dimensions of the
sample, the temperature groups and the heat transfer coefficient of the prepared samples:
Table(1):Thermal transfer coefficient of samples prepared
sample 𝑨 × 𝟏𝟎−𝟒(𝐦𝟐) 𝑳 × 𝟏𝟎−𝟐(𝐦) ∆
𝒌 ± ∆𝒌
(𝑾
𝒎. 𝑲)
1 (14.8)2 1 24 0.167 ± 0.0164
2 (13.4)2 1.25 37.3 0.163 ± 0.0131
3 (14.5)2 1.1 31.7 0.145 ± 0.01241
International Journal of Academic Scientific Research
ISSN: 2272-6446 Volume 6, Issue 1 (February - March 2018), PP 09-25
www.ijasrjournal.org 14 | Page
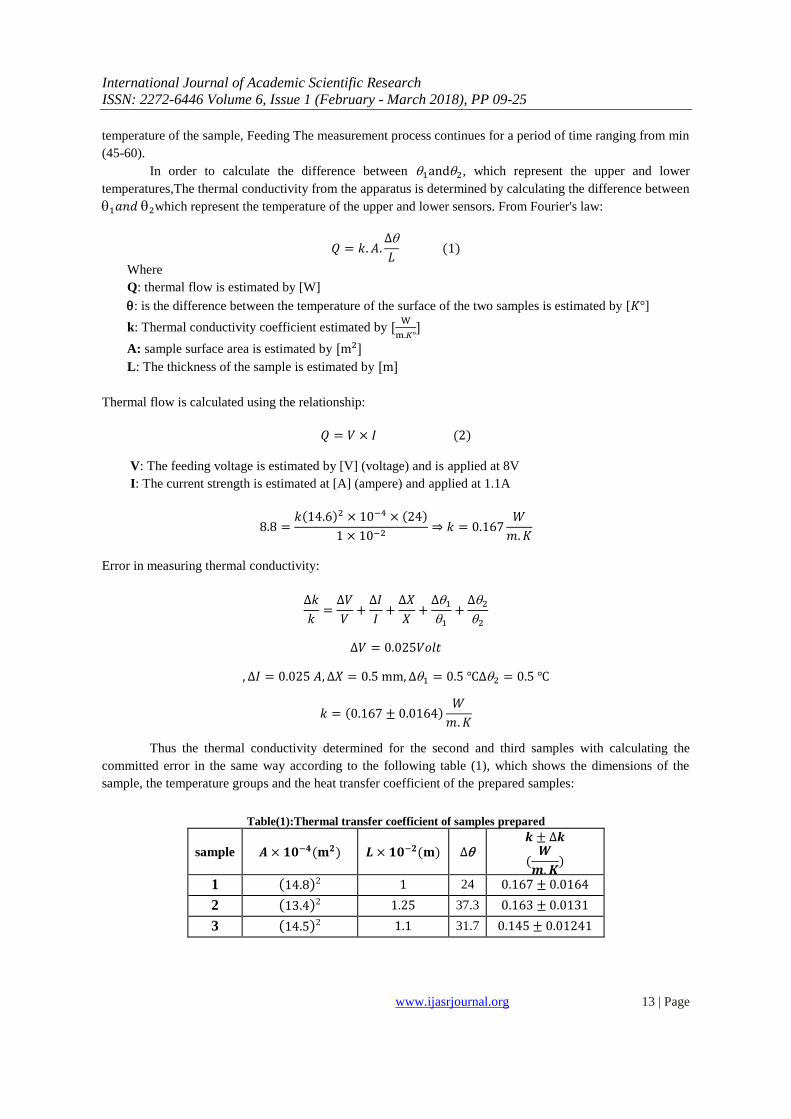
Fig.2:Thermal transfer coefficient of the three samples
4.2.Apparentporosity-thebulk density: After conducting the measurements on the next three prepared
samples:
Porosity % : = {(W.D) / V} x100
Percentage of absorbed water A: A = {(W.D) / D} x100
Bulk Density B: B (g / cm3) = D / V
𝑉1 = 18.37 − 5.46 = 12.91
1
=18.37 − 16
12.91× 100 = 18.3%
𝐴1 =18.37 − 16
16× 100 = 14.8%
The results are summarized according to Table (2):
Table(2): The measured weights of the three samples
sample Dry weight D
(g)
Suspended
Weight S
(g)
Saturated weight
W
(g)
1 15.325 5.26 18.1875
2 14.41 6.785 31.315
3 21.125 6.205 31.89
Table(3):Porosity results and percentage of average absorbed water
sample Porosity P% Volume
V(cm3)
Bulk
density B
(𝐊𝐠
𝐦𝟑)
Apparent Specific weight
T
Percentage of
water
absorbed A
1 22.1 12.927 1185.35 1.5335 18.85
2 68.9 24.53 587.1 1.9465 117.575
0,167
0,163
0,145
0,13
0,135
0,14
0,145
0,15
0,155
0,16
0,165
0,17
Sample 1 Sample 2 Sample 3
k
k
International Journal of Academic Scientific Research
ISSN: 2272-6446 Volume 6, Issue 1 (February - March 2018), PP 09-25
www.ijasrjournal.org 15 | Page
3 41.8 25.685 823.7 1.412 50.9
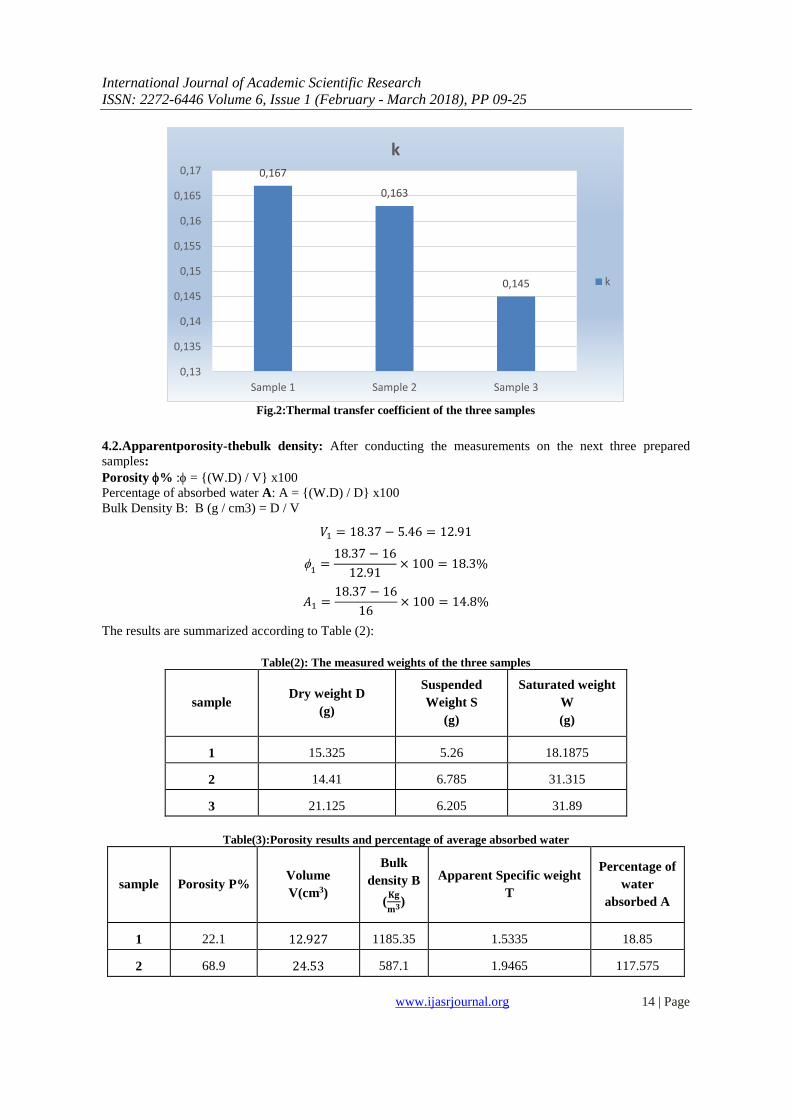
Fig3:apparent porosity and the proportion of absorbed water
First of all from Fig (2), which shows the change of the thermal conductivity of the samples, the
greatest value of the thermal conductivity was for sample (1) which record 0.167 (𝑊
𝑚.𝐾) . This means that it
has the least insolation (in comparison with the other two samples) and this sample is composed of mixture of
aluminium, cement and calcium carbonate without any other additives, and the porosity have reached 22.1 %
At the same time , it recorded the lowest value of water absorption 18.85 % . This means obtaining a heat and
moisture insulating material at the same time as described in Fig (3).
It should be noted that this sample was prepared from aluminium and cement with the addition of
calcium carbonate, which helped to give a more solid form of the sample, the addition of alkali solution on the
surface during the vibration casting helped to continue the interaction and the release of gas and obtaining
suitable porosity which achieved good insulation.
Sample (2) prepared from cement and aluminium powder achieved average thermal
conductivity0.163(𝑊
𝑚.𝐾) with high porosity of 68.9% and large absorption of moisture 115.575 %.
With respect to the sample ( 3 ) The average values were recorded relative to the other two samples
(1,2) The average Porosity has reached 41.8 % with relatively low thermal conductivity 0.145(𝑊
𝑚.𝐾)
But they recorded a relatively high value of absorbed water 50.9 % This means lower performance in
terms of moisture insulation with noticing that this sample was prepared from the cement with aluminium
powder and sodium chloride, which leads to the occurrence of an additional interaction. Then the sample is
washed with water to remove sodium chloride. Returning to Fig (3) we note that the density is correlated to
the thermal conductivity where the higher the density the lower the thermal conductivity.
1,5335
12,927
18,1875
5,26
15,325
1,9465
24,53
31,315
6,785
14,41
1,412
25,685
31,89
6,205
21,125
0
5
10
15
20
25
30
35
1
2
3
International Journal of Academic Scientific Research
ISSN: 2272-6446 Volume 6, Issue 1 (February - March 2018), PP 09-25
www.ijasrjournal.org 16 | Page
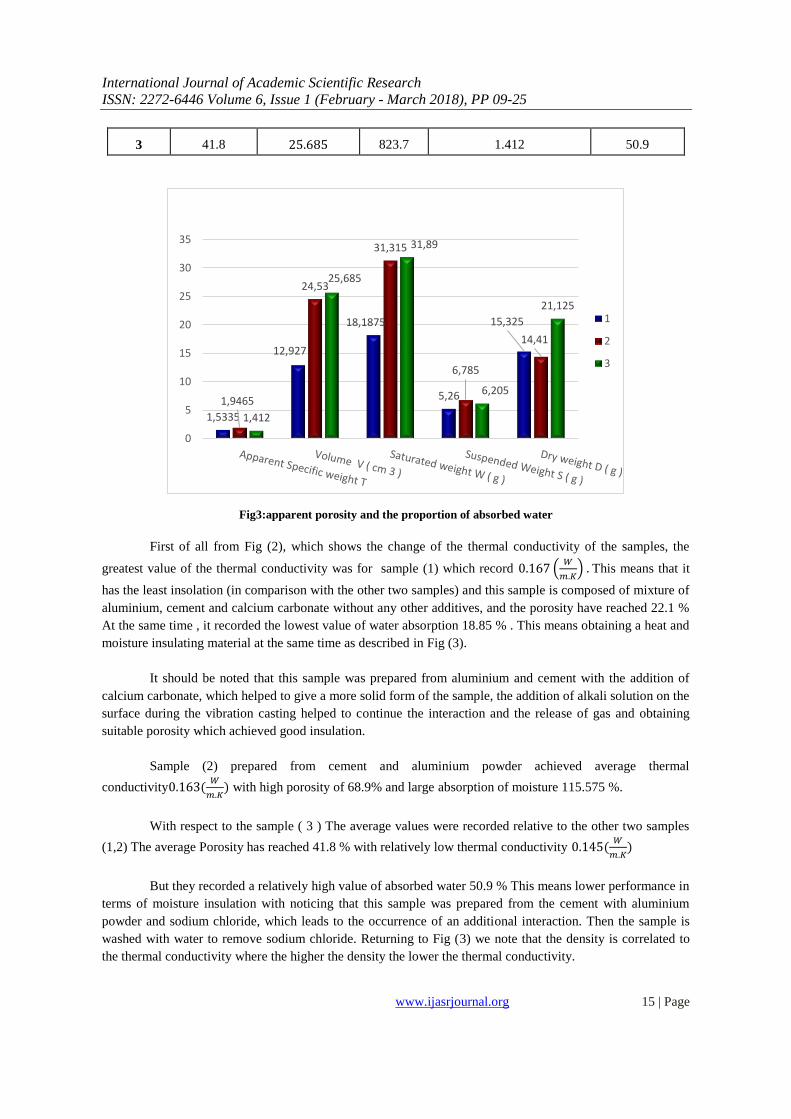
4.3.Soundinsulation: The following table shows the results of the sound absorption coefficient:
Table(4):Results of sound absorption coefficient
Sample
number
Section
space A
(𝐜𝐦𝟐)
Sample
thickness
(𝐜𝐦)
Frequency
(𝐤𝐇𝐳)
Total
wave
energy
(v)
Absorbe
d Wave
Energy
(v)
(𝐄
𝐄𝟎
) 𝐥𝐧𝐄
𝐄𝟎
Sound
absorption
coefficient
(𝐜𝐦−𝟏)
1 0.6 × 0.6 0.9 3000 1.4 1.2 0.857 -0.154 0.171
2 0.6 × 0.6 1.25 3000 1.4 1 0.71 -0.336 0.269
3 0.6 × 0.6 1.1 3000 1.4 1.2 0.857 -0.154 0.14
𝐸 = 𝐸0. 𝑒−𝛼𝑋 (3)
𝐗:The thickness of the sample
𝛂:Sound absorption coefficient
𝐄:The energy of the wave absorbed
𝐄𝟎:Total trans-wave energy
Returning to the table (4) we note that the highest value of the sound absorption factor is for the
second sample to be 0.269. This is explained by the higher porosity of this sample, in which air
occupies most of the volume, while the absorption of sound coefficient of the remaining two samples
is reduced, therefore it is possible to use sample (2) as a good sound insulator in construction work.
4.4.Mechanicalresistance: The law of stress (Mechanical resistance):
=𝐹
𝐴 (4)
σ: represents stress (mechanical resistance) [N/m2]
F: represents the applied mechanical force [N]
A: represents the area of the section to which the force applies [m2]
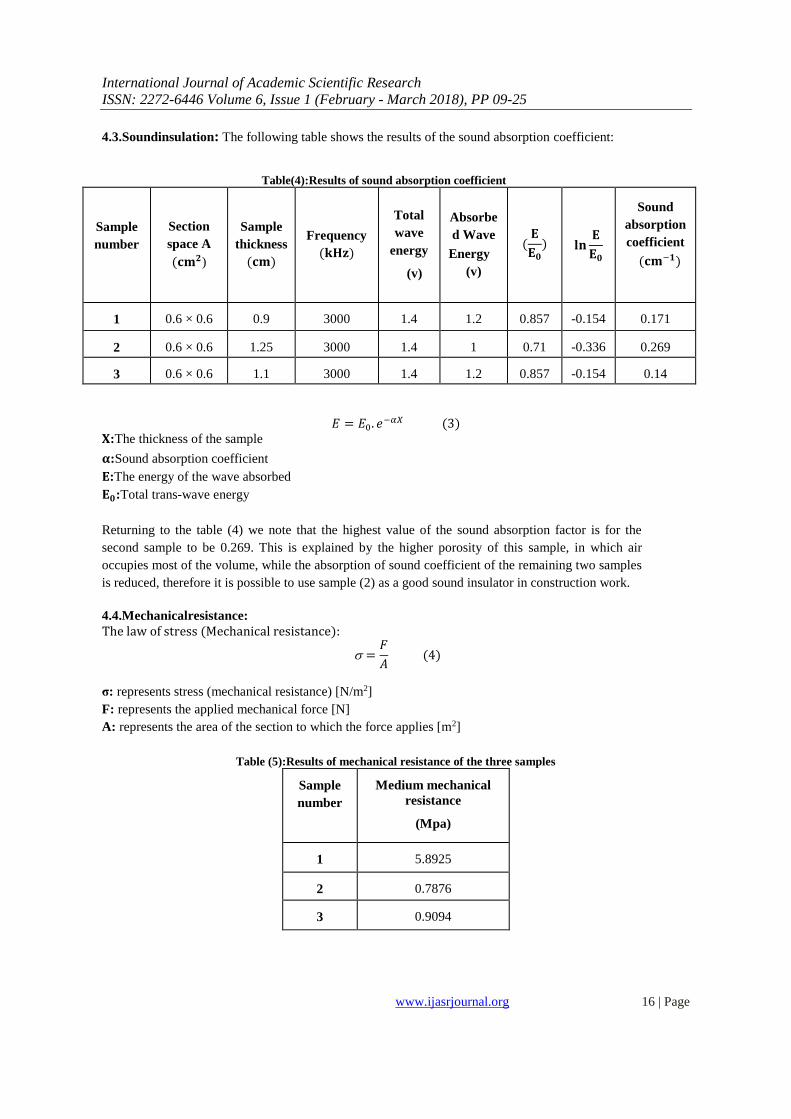
Table (5):Results of mechanical resistance of the three samples
Sample
number
Medium mechanical
resistance
(Mpa)
1 5.8925
2 0.7876
3 0.9094
International Journal of Academic Scientific Research
ISSN: 2272-6446 Volume 6, Issue 1 (February - March 2018), PP 09-25
www.ijasrjournal.org 17 | Page
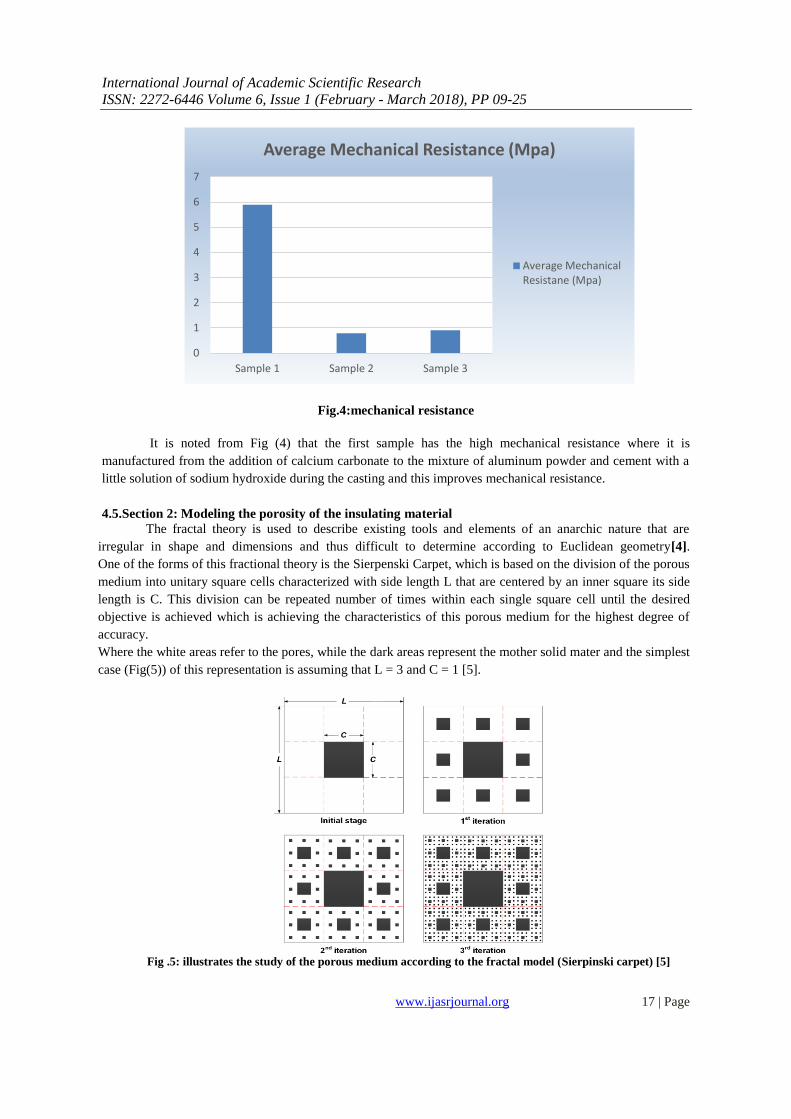
Fig.4:mechanical resistance
It is noted from Fig (4) that the first sample has the high mechanical resistance where it is
manufactured from the addition of calcium carbonate to the mixture of aluminum powder and cement with a
little solution of sodium hydroxide during the casting and this improves mechanical resistance.
4.5.Section 2: Modeling the porosity of the insulating material The fractal theory is used to describe existing tools and elements of an anarchic nature that are
irregular in shape and dimensions and thus difficult to determine according to Euclidean geometry[4].
One of the forms of this fractional theory is the Sierpenski Carpet, which is based on the division of the porous
medium into unitary square cells characterized with side length L that are centered by an inner square its side
length is C. This division can be repeated number of times within each single square cell until the desired
objective is achieved which is achieving the characteristics of this porous medium for the highest degree of
accuracy.
Where the white areas refer to the pores, while the dark areas represent the mother solid mater and the simplest
case (Fig(5)) of this representation is assuming that L = 3 and C = 1 [5].
Fig .5: illustrates the study of the porous medium according to the fractal model (Sierpinski carpet) [5]
0
1
2
3
4
5
6
7
Sample 1 Sample 2 Sample 3
Average Mechanical Resistance (Mpa)
Average MechanicalResistane (Mpa)
International Journal of Academic Scientific Research
ISSN: 2272-6446 Volume 6, Issue 1 (February - March 2018), PP 09-25
www.ijasrjournal.org 18 | Page
The fractional dimension is calculated according to [5]depending on the following relationship:
𝐷𝑓 =ln (𝐿2 − 𝐶2)
ln 𝐿 (4)
As porosity represents the ratio between the area occupied by dark areas and the total area of the
carpet, and also according to Feng, porosity is determined by the relationship:
= (𝐿2 − 𝐶2
𝐿2)
𝑛+1
(5)
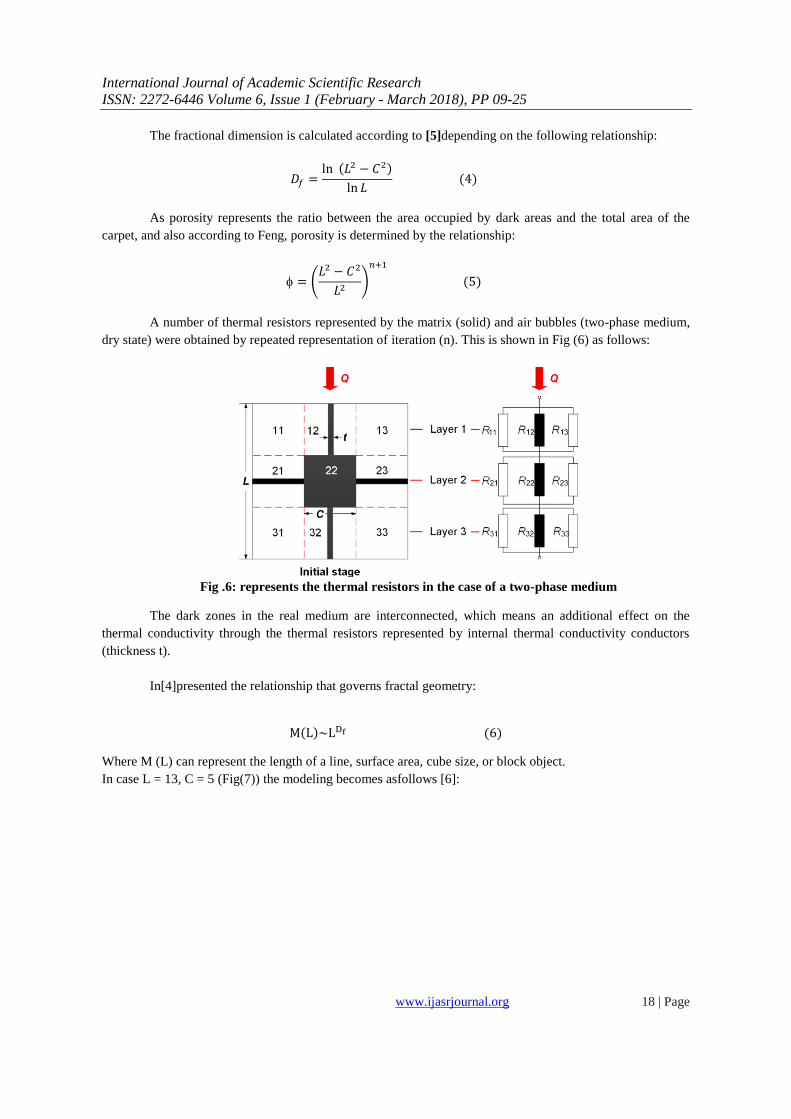
A number of thermal resistors represented by the matrix (solid) and air bubbles (two-phase medium,
dry state) were obtained by repeated representation of iteration (n). This is shown in Fig (6) as follows:
Fig .6: represents the thermal resistors in the case of a two-phase medium
The dark zones in the real medium are interconnected, which means an additional effect on the
thermal conductivity through the thermal resistors represented by internal thermal conductivity conductors
(thickness t).
In[4]presented the relationship that governs fractal geometry:
M(L)~LDf (6)
Where M (L) can represent the length of a line, surface area, cube size, or block object.
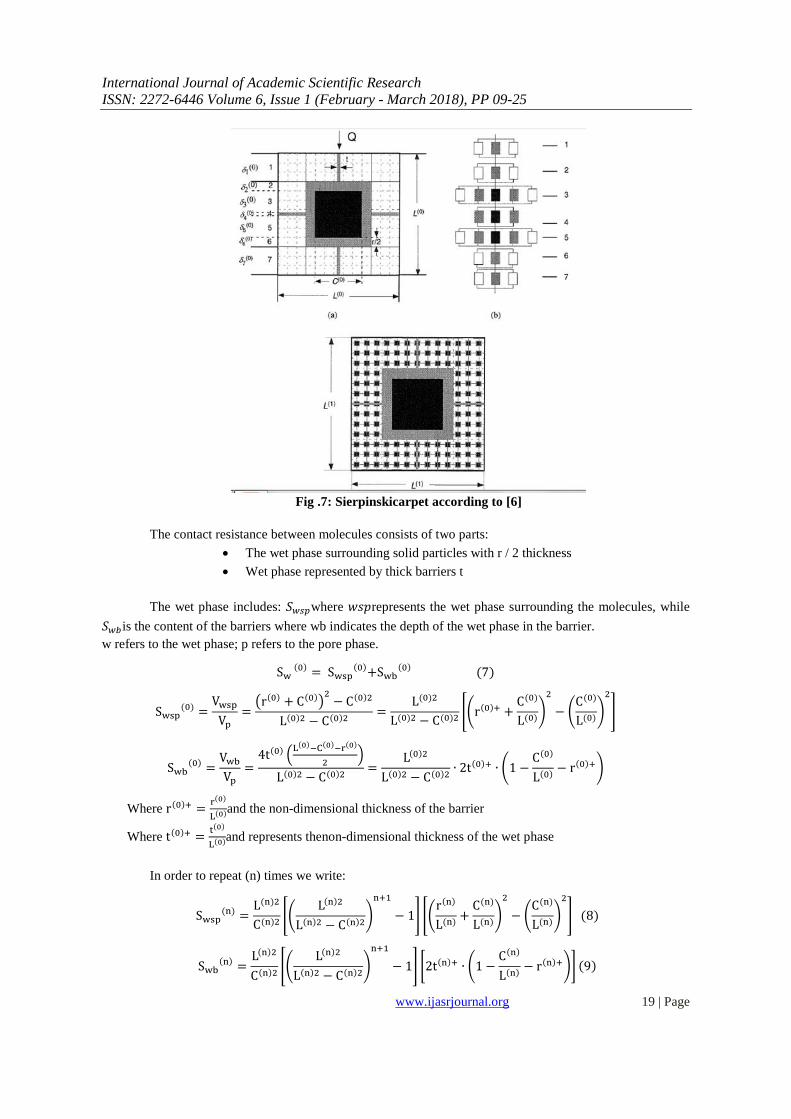
In case L = 13, C = 5 (Fig(7)) the modeling becomes asfollows [6]:
International Journal of Academic Scientific Research
ISSN: 2272-6446 Volume 6, Issue 1 (February - March 2018), PP 09-25
www.ijasrjournal.org 19 | Page
Fig .7: Sierpinskicarpet according to [6]
The contact resistance between molecules consists of two parts:
The wet phase surrounding solid particles with r / 2 thickness
Wet phase represented by thick barriers t
The wet phase includes: 𝑆𝑤𝑠𝑝where 𝑤𝑠𝑝represents the wet phase surrounding the molecules, while
𝑆𝑤𝑏is the content of the barriers where wb indicates the depth of the wet phase in the barrier.
w refers to the wet phase; p refers to the pore phase.
Sw (0) = Swsp
(0)+Swb(0) (7)
Swsp(0) =
Vwsp
Vp
=(r(0) + C(0))
2− C(0)2
L(0)2 − C(0)2=
L(0)2
L(0)2 − C(0)2[(r(0)+ +
C(0)
L(0))
2
− (C(0)
L(0))
2
]
Swb(0) =
Vwb
Vp
=4t(0) (
L(0)−C(0)−r(0)
2)
L(0)2 − C(0)2=
L(0)2
L(0)2 − C(0)2∙ 2t(0)+ ∙ (1 −
C(0)
L(0)− r(0)+)
Where r(0)+ =r(0)
L(0)and the non-dimensional thickness of the barrier
Where t(0)+ =t(0)
L(0)and represents thenon-dimensional thickness of the wet phase
In order to repeat (n) times we write:
Swsp(n) =
L(n)2
C(n)2[(
L(n)2
L(n)2 − C(n)2)
n+1
− 1] [(r(n)
L(n)+
C(n)
L(n))
2
− (C(n)
L(n))
2
] (8)
Swb(n) =
L(n)2
C(n)2[(
L(n)2
L(n)2 − C(n)2)
n+1
− 1] [2t(n)+ ∙ (1 −C(n)
L(n)− r(n)+)] (9)
International Journal of Academic Scientific Research
ISSN: 2272-6446 Volume 6, Issue 1 (February - March 2018), PP 09-25
www.ijasrjournal.org 20 | Page
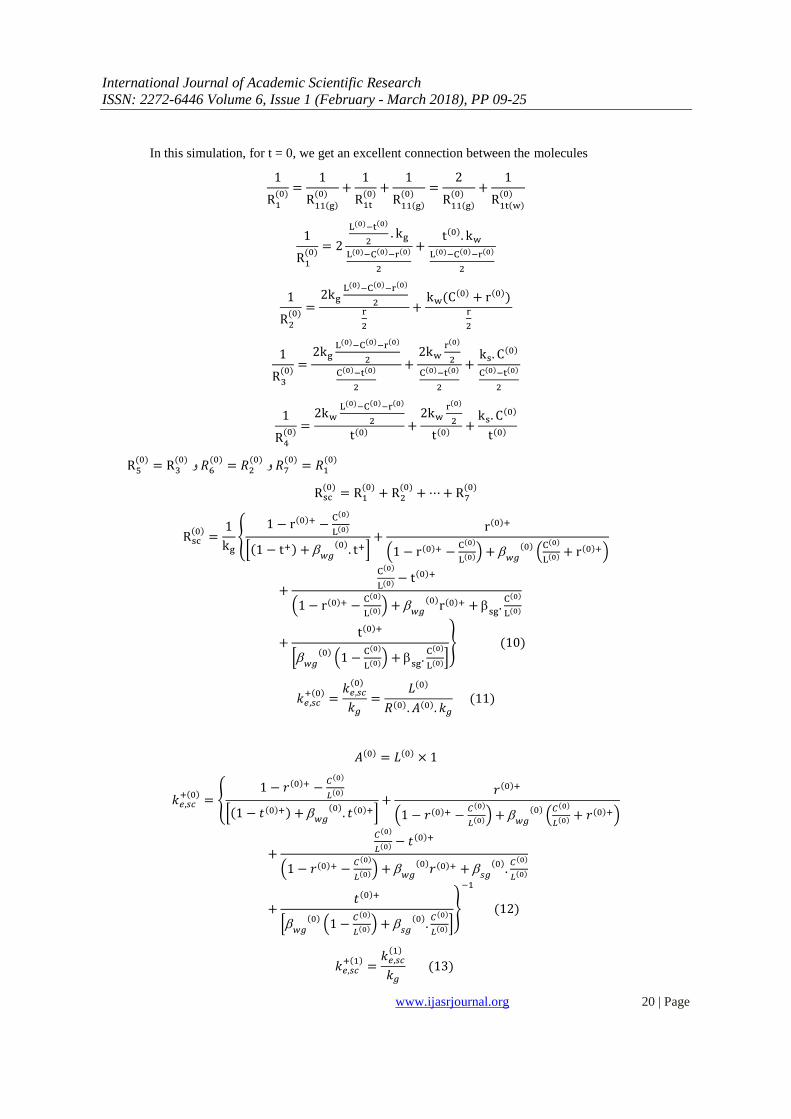
In this simulation, for t = 0, we get an excellent connection between the molecules
1
R1(0)
=1
R11(g)(0)
+1
R1t(0)
+1
R11(g)(0)
=2
R11(g)(0)
+1
R1t(w)(0)
1
R1(0)
= 2
L(0)−t(0)
2. kg
L(0)−C(0)−r(0)
2
+t(0). kw
L(0)−C(0)−r(0)
2
1
R2(0)
=2kg
L(0)−C(0)−r(0)
2r
2
+kw(C(0) + r(0))
r
2
1
R3(0)
=2kg
L(0)−C(0)−r(0)
2
C(0)−t(0)
2
+2kw
r(0)
2
C(0)−t(0)
2
+ks. C(0)
C(0)−t(0)
2
1
R4(0)
=2kw
L(0)−C(0)−r(0)
2
t(0)+
2kwr(0)
2
t(0)+
ks. C(0)
t(0)
R5(0)
= R3(0)
و 𝑅6(0)
= 𝑅2(0)
و 𝑅7(0)
= 𝑅1(0)
Rsc(0)
= R1(0)
+ R2(0)
+ ⋯ + R7(0)
Rsc(0)
=1
kg
{1 − r(0)+ −
C(0)
L(0)
[(1 − t+) + 𝑤𝑔
(0). t+]
+r(0)+
(1 − r(0)+ −C(0)
L(0)) + 𝑤𝑔
(0)(
C(0)
L(0) + r(0)+)
+
C(0)
L(0) − t(0)+
(1 − r(0)+ −C(0)
L(0)) + 𝑤𝑔
(0)r(0)+ +
sg.
C(0)
L(0)
+t(0)+
[𝑤𝑔
(0)(1 −
C(0)
L(0)) + sg
.C(0)
L(0)]} (10)
𝑘𝑒,𝑠𝑐+(0)
=𝑘𝑒,𝑠𝑐
(0)
𝑘𝑔
=𝐿(0)
𝑅(0). 𝐴(0). 𝑘𝑔
(11)
𝐴(0) = 𝐿(0) × 1
𝑘𝑒,𝑠𝑐+(0)
= {1 − 𝑟(0)+ −
𝐶(0)
𝐿(0)
[(1 − 𝑡(0)+) + 𝑤𝑔
(0). 𝑡(0)+]
+𝑟(0)+
(1 − 𝑟(0)+ −𝐶(0)
𝐿(0)) + 𝑤𝑔
(0)(
𝐶(0)
𝐿(0) + 𝑟(0)+)
+
𝐶(0)
𝐿(0) − 𝑡(0)+
(1 − 𝑟(0)+ −𝐶(0)
𝐿(0)) + 𝑤𝑔
(0)𝑟(0)+ +
𝑠𝑔(0)
.𝐶(0)
𝐿(0)
+𝑡(0)+
[𝑤𝑔
(0)(1 −
𝐶(0)
𝐿(0)) + 𝑠𝑔
(0).
𝐶(0)
𝐿(0)]}
−1
(12)
𝑘𝑒,𝑠𝑐+(1)
=𝑘𝑒,𝑠𝑐
(1)
𝑘𝑔
(13)
International Journal of Academic Scientific Research
ISSN: 2272-6446 Volume 6, Issue 1 (February - March 2018), PP 09-25
www.ijasrjournal.org 21 | Page
𝑤𝑔
(1)=
𝑤𝑔
(0)
𝑘𝑒,𝑠𝑐+(0)
𝑠𝑔
(1)=
𝑠𝑔
(0)
𝑘𝑒,𝑠𝑐+(0)
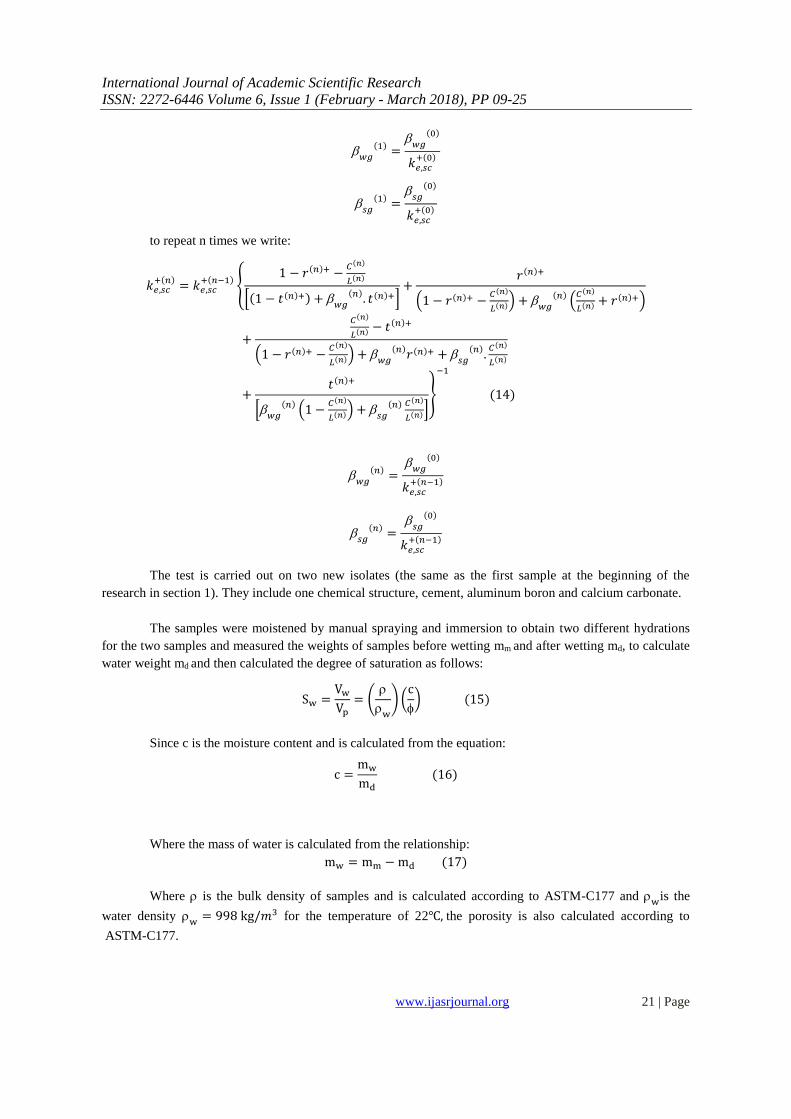
to repeat n times we write:
𝑘𝑒,𝑠𝑐+(𝑛)
= 𝑘𝑒,𝑠𝑐+(𝑛−1)
{1 − 𝑟(𝑛)+ −
𝐶(𝑛)
𝐿(𝑛)
[(1 − 𝑡(𝑛)+) + 𝑤𝑔
(𝑛). 𝑡(𝑛)+]
+𝑟(𝑛)+
(1 − 𝑟(𝑛)+ −𝐶(𝑛)
𝐿(𝑛)) + 𝑤𝑔
(𝑛)(
𝐶(𝑛)
𝐿(𝑛) + 𝑟(𝑛)+)
+
𝐶(𝑛)
𝐿(𝑛) − 𝑡(𝑛)+
(1 − 𝑟(𝑛)+ −𝐶(𝑛)
𝐿(𝑛)) + 𝑤𝑔
(𝑛)𝑟(𝑛)+ +
𝑠𝑔(𝑛)
.𝐶(𝑛)
𝐿(𝑛)
+𝑡(𝑛)+
[𝑤𝑔
(𝑛)(1 −
𝐶(𝑛)
𝐿(𝑛)) + 𝑠𝑔
(𝑛) 𝐶(𝑛)
𝐿(𝑛)]}
−1
(14)
𝑤𝑔
(𝑛)=
𝑤𝑔
(0)
𝑘𝑒,𝑠𝑐+(𝑛−1)
𝑠𝑔
(𝑛)=
𝑠𝑔
(0)
𝑘𝑒,𝑠𝑐+(𝑛−1)
The test is carried out on two new isolates (the same as the first sample at the beginning of the
research in section 1). They include one chemical structure, cement, aluminum boron and calcium carbonate.
The samples were moistened by manual spraying and immersion to obtain two different hydrations
for the two samples and measured the weights of samples before wetting mm and after wetting md, to calculate
water weight md and then calculated the degree of saturation as follows:
Sw =Vw
Vp
= (
w
) (c
) (15)
Since c is the moisture content and is calculated from the equation:
c =mw
md
(16)
Where the mass of water is calculated from the relationship:
mw = mm − md (17)
Where is the bulk density of samples and is calculated according to ASTM-C177 and w
is the
water density w
= 998 kg/𝑚3 for the temperature of 22℃, the porosity is also calculated according to
ASTM-C177.
International Journal of Academic Scientific Research
ISSN: 2272-6446 Volume 6, Issue 1 (February - March 2018), PP 09-25
www.ijasrjournal.org 22 | Page
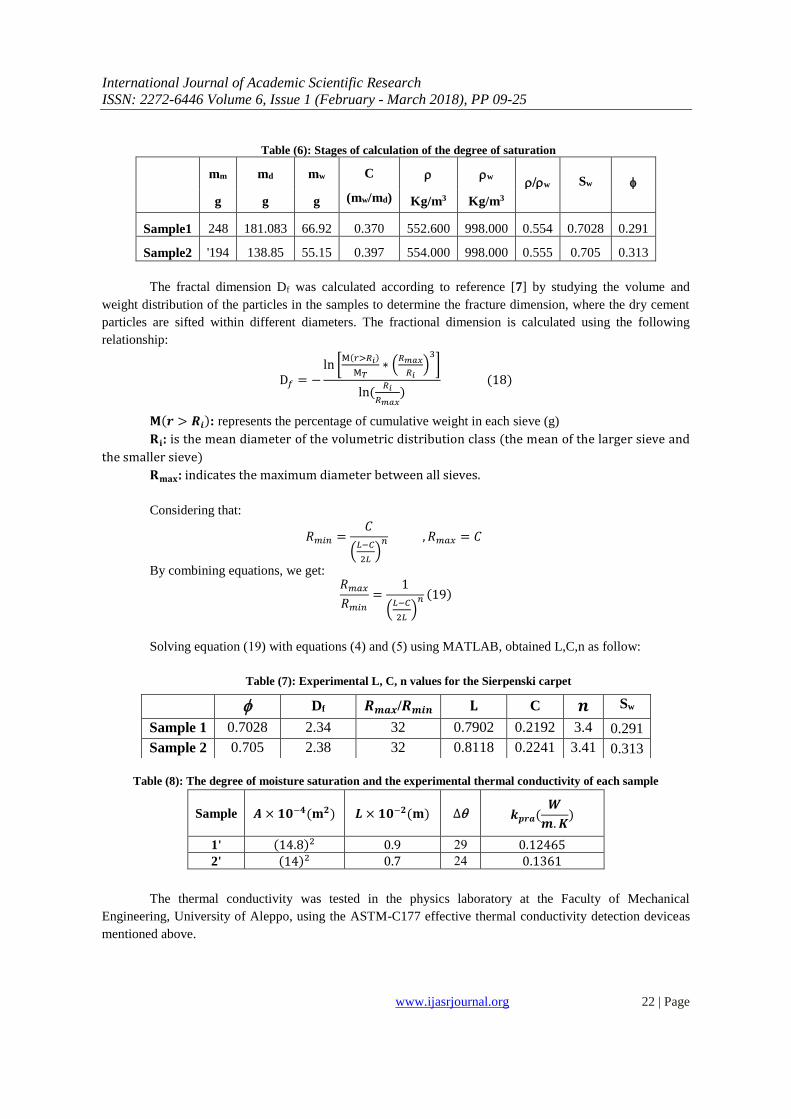
Table (6): Stages of calculation of the degree of saturation
mm md mw C w
w Sw
g g g (mw/md) Kg/m3 Kg/m3
Sample1 248 181.083 66.92 0.370 552.600 998.000 0.554 0.7028 0.291
Sample2 '194 138.85 55.15 0.397 554.000 998.000 0.555 0.705 0.313
The fractal dimension Df was calculated according to reference [7] by studying the volume and
weight distribution of the particles in the samples to determine the fracture dimension, where the dry cement
particles are sifted within different diameters. The fractional dimension is calculated using the following
relationship:
D𝑓 = −ln [
M(𝑟>𝑅𝑖)
M𝑇∗ (
𝑅𝑚𝑎𝑥
𝑅𝑖)
3
]
ln(𝑅𝑖
𝑅𝑚𝑎𝑥)
(18)
𝐌(𝒓 > 𝑹𝒊): represents the percentage of cumulative weight in each sieve (g)
𝐑𝐢: is the mean diameter of the volumetric distribution class (the mean of the larger sieve and
the smaller sieve)
𝐑𝐦𝐚𝐱: indicates the maximum diameter between all sieves.
Considering that:
𝑅𝑚𝑖𝑛 =𝐶
(𝐿−𝐶
2𝐿)
𝑛 , 𝑅𝑚𝑎𝑥 = 𝐶
By combining equations, we get: 𝑅𝑚𝑎𝑥
𝑅𝑚𝑖𝑛
=1
(𝐿−𝐶
2𝐿)
𝑛 (19)
Solving equation (19) with equations (4) and (5) using MATLAB, obtained L,C,n as follow:
Table (7): Experimental L, C, n values for the Sierpenski carpet
Table (8): The degree of moisture saturation and the experimental thermal conductivity of each sample
Sample 𝑨 × 𝟏𝟎−𝟒(𝐦𝟐) 𝑳 × 𝟏𝟎−𝟐(𝐦) ∆ 𝒌𝒑𝒓𝒂(𝑾
𝒎. 𝑲)
1' (14.8)2 0.9 29 0.12465
2' (14)2 0.7 24 0.1361
The thermal conductivity was tested in the physics laboratory at the Faculty of Mechanical
Engineering, University of Aleppo, using the ASTM-C177 effective thermal conductivity detection deviceas
mentioned above.
fD 𝑹𝒎𝒂𝒙/𝑹𝒎𝒊𝒏 𝐋 C 𝒏 wS
Sample 1 0.7028 2.34 32 0.7902 0.2192 3.4 0.291
Sample 2 0.705 2.38 32 0.8118 0.2241 3.41 0.313
International Journal of Academic Scientific Research
ISSN: 2272-6446 Volume 6, Issue 1 (February - March 2018), PP 09-25
www.ijasrjournal.org 23 | Page
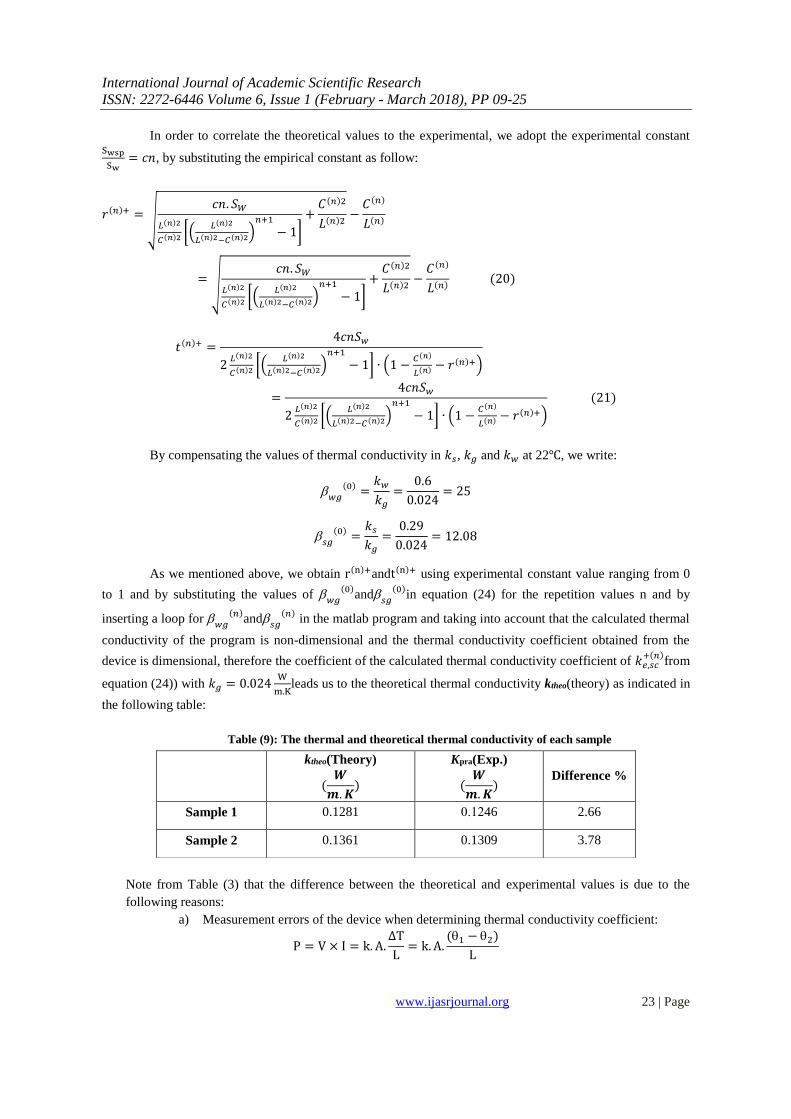
In order to correlate the theoretical values to the experimental, we adopt the experimental constant Swsp
Sw= 𝑐𝑛, by substituting the empirical constant as follow:
𝑟(𝑛)+ = √
𝑐𝑛. 𝑆𝑊
𝐿(𝑛)2
𝐶(𝑛)2 [(𝐿(𝑛)2
𝐿(𝑛)2−𝐶(𝑛)2)𝑛+1
− 1]
+𝐶(𝑛)2
𝐿(𝑛)2−
𝐶(𝑛)
𝐿(𝑛)
= √
𝑐𝑛. 𝑆𝑊
𝐿(𝑛)2
𝐶(𝑛)2 [(𝐿(𝑛)2
𝐿(𝑛)2−𝐶(𝑛)2)𝑛+1
− 1]
+𝐶(𝑛)2
𝐿(𝑛)2−
𝐶(𝑛)
𝐿(𝑛) (20)
𝑡(𝑛)+ =4𝑐𝑛𝑆𝑤
2𝐿(𝑛)2
𝐶(𝑛)2 [(𝐿(𝑛)2
𝐿(𝑛)2−𝐶(𝑛)2)𝑛+1
− 1] ∙ (1 −𝐶(𝑛)
𝐿(𝑛) − 𝑟(𝑛)+)
=4𝑐𝑛𝑆𝑤
2𝐿(𝑛)2
𝐶(𝑛)2 [(𝐿(𝑛)2
𝐿(𝑛)2−𝐶(𝑛)2)𝑛+1
− 1] ∙ (1 −𝐶(𝑛)
𝐿(𝑛) − 𝑟(𝑛)+)
(21)
By compensating the values of thermal conductivity in 𝑘𝑠, 𝑘𝑔 and 𝑘𝑤 at 22℃, we write:
𝑤𝑔
(0)=
𝑘𝑤
𝑘𝑔
=0.6
0.024= 25
𝑠𝑔
(0)=
𝑘𝑠
𝑘𝑔
=0.29
0.024= 12.08
As we mentioned above, we obtain r(n)+andt(n)+ using experimental constant value ranging from 0
to 1 and by substituting the values of 𝑤𝑔
(0)and
𝑠𝑔(0)
in equation (24) for the repetition values n and by
inserting a loop for 𝑤𝑔
(𝑛)and
𝑠𝑔(𝑛)
in the matlab program and taking into account that the calculated thermal
conductivity of the program is non-dimensional and the thermal conductivity coefficient obtained from the
device is dimensional, therefore the coefficient of the calculated thermal conductivity coefficient of 𝑘𝑒,𝑠𝑐+(𝑛)
from
equation (24)) with 𝑘𝑔 = 0.024W
m.Kleads us to the theoretical thermal conductivity ktheo(theory) as indicated in
the following table:
Table (9): The thermal and theoretical thermal conductivity of each sample
Note from Table (3) that the difference between the theoretical and experimental values is due to the
following reasons:
a) Measurement errors of the device when determining thermal conductivity coefficient:
P = V × I = k. A.∆T
L= k. A.
(1 − 2)
L
ktheo(Theory)
(𝑾
𝒎. 𝑲)
Kpra(Exp.)
(𝑾
𝒎. 𝑲)
Difference %
Sample 1 0.1281 0.1246 2.66
Sample 2 0.1361 0.1309 3.78
International Journal of Academic Scientific Research
ISSN: 2272-6446 Volume 6, Issue 1 (February - March 2018), PP 09-25
www.ijasrjournal.org 24 | Page
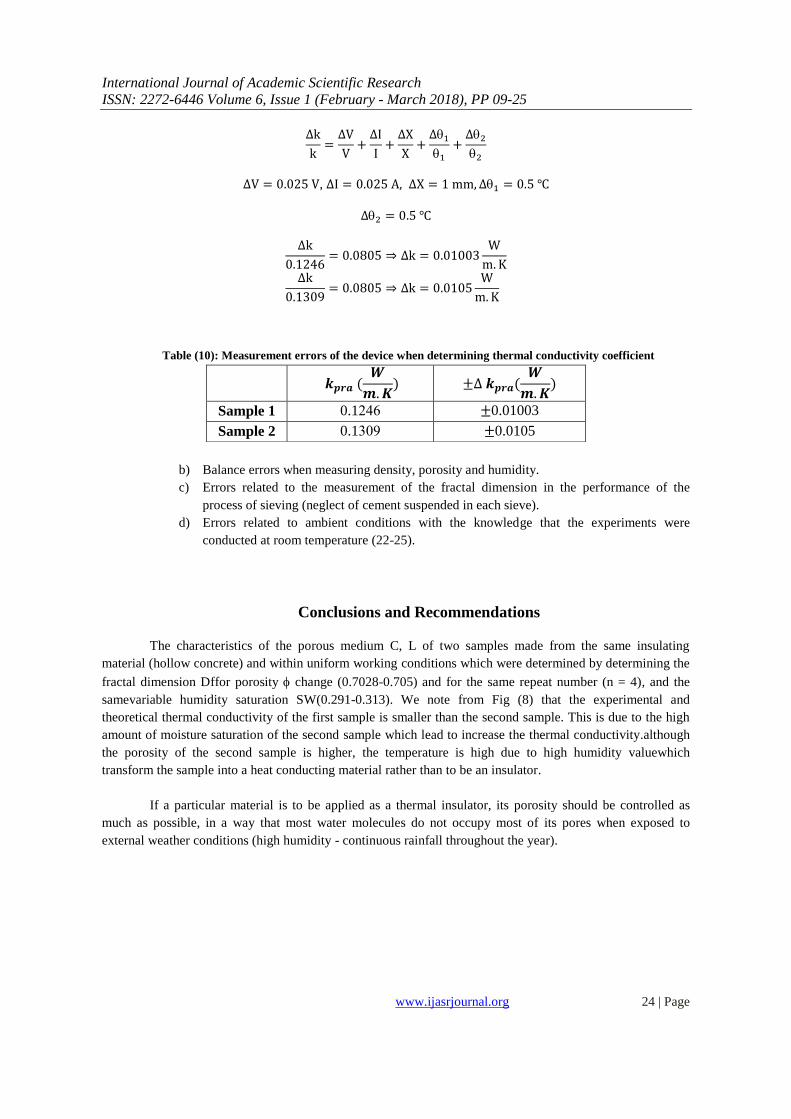
∆k
k=
∆V
V+
∆I
I+
∆X
X+
∆1
1
+∆2
2
∆V = 0.025 V, ∆I = 0.025 A, ∆X = 1 mm, ∆1 = 0.5 ℃
∆2 = 0.5 ℃
∆k
0.1246= 0.0805 ⇒ ∆k = 0.01003
W
m. K
∆k
0.1309= 0.0805 ⇒ ∆k = 0.0105
W
m. K
Table (10): Measurement errors of the device when determining thermal conductivity coefficient
b) Balance errors when measuring density, porosity and humidity.
c) Errors related to the measurement of the fractal dimension in the performance of the
process of sieving (neglect of cement suspended in each sieve).
d) Errors related to ambient conditions with the knowledge that the experiments were
conducted at room temperature (22-25).
Conclusions and Recommendations
The characteristics of the porous medium C, L of two samples made from the same insulating
material (hollow concrete) and within uniform working conditions which were determined by determining the
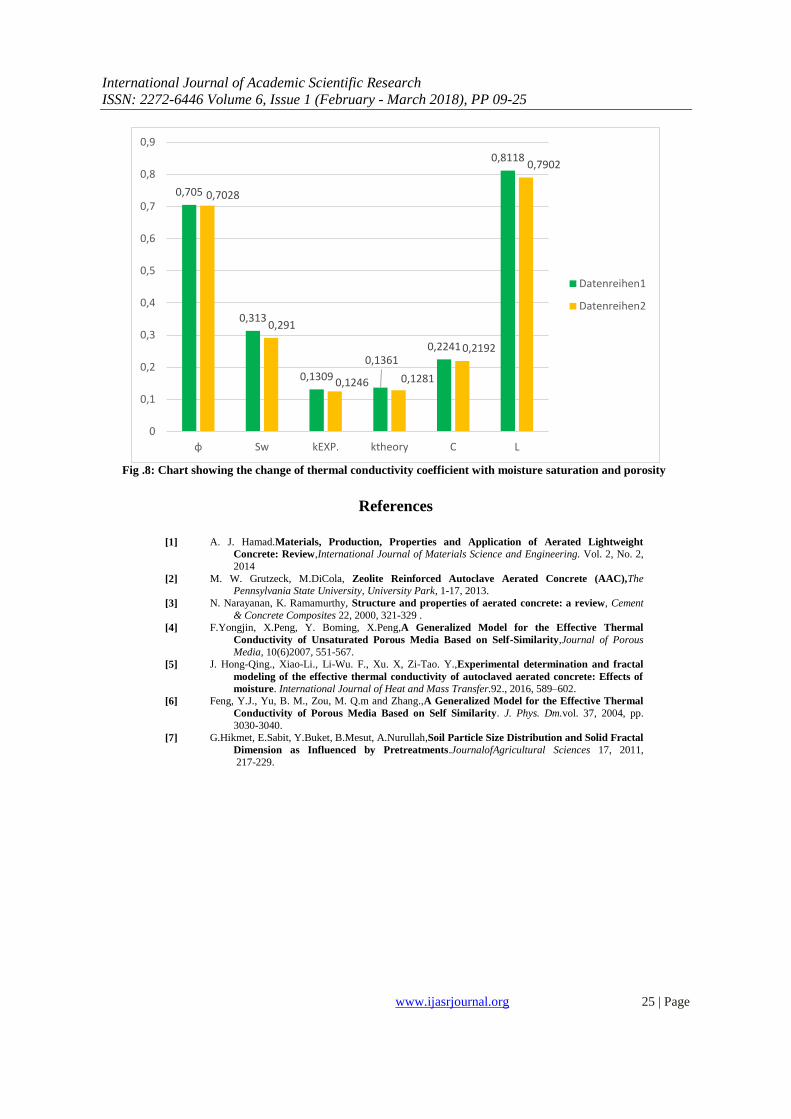
fractal dimension Dffor porosity change (0.7028-0.705) and for the same repeat number (n = 4), and the
samevariable humidity saturation SW(0.291-0.313). We note from Fig (8) that the experimental and
theoretical thermal conductivity of the first sample is smaller than the second sample. This is due to the high
amount of moisture saturation of the second sample which lead to increase the thermal conductivity.although
the porosity of the second sample is higher, the temperature is high due to high humidity valuewhich
transform the sample into a heat conducting material rather than to be an insulator.
If a particular material is to be applied as a thermal insulator, its porosity should be controlled as
much as possible, in a way that most water molecules do not occupy most of its pores when exposed to
external weather conditions (high humidity - continuous rainfall throughout the year).
𝒌𝒑𝒓𝒂 (𝑾
𝒎. 𝑲) ±∆ 𝒌𝒑𝒓𝒂(
𝑾
𝒎. 𝑲)
Sample 1 0.1246 ±0.01003
Sample 2 0.1309 ±0.0105
International Journal of Academic Scientific Research
ISSN: 2272-6446 Volume 6, Issue 1 (February - March 2018), PP 09-25
www.ijasrjournal.org 25 | Page
Fig .8: Chart showing the change of thermal conductivity coefficient with moisture saturation and porosity
References
[1] A. J. Hamad.Materials, Production, Properties and Application of Aerated Lightweight
Concrete: Review,International Journal of Materials Science and Engineering. Vol. 2, No. 2,
2014
[2] M. W. Grutzeck, M.DiCola, Zeolite Reinforced Autoclave Aerated Concrete (AAC),The Pennsylvania State University, University Park, 1-17, 2013.
[3] N. Narayanan, K. Ramamurthy, Structure and properties of aerated concrete: a review, Cement
& Concrete Composites 22, 2000, 321-329 .
[4] F.Yongjin, X.Peng, Y. Boming, X.Peng,A Generalized Model for the Effective Thermal
Conductivity of Unsaturated Porous Media Based on Self-Similarity,Journal of Porous
Media, 10(6)2007, 551-567.
[5]
J. Hong-Qing., Xiao-Li., Li-Wu. F., Xu. X, Zi-Tao. Y.,Experimental determination and fractal
modeling of the effective thermal conductivity of autoclaved aerated concrete: Effects of
moisture. International Journal of Heat and Mass Transfer.92., 2016, 589–602.
[6] Feng, Y.J., Yu, B. M., Zou, M. Q.m and Zhang.,A Generalized Model for the Effective Thermal
Conductivity of Porous Media Based on Self Similarity. J. Phys. Dm.vol. 37, 2004, pp.
3030-3040.
[7] G.Hikmet, E.Sabit, Y.Buket, B.Mesut, A.Nurullah,Soil Particle Size Distribution and Solid Fractal
Dimension as Influenced by Pretreatments.JournalofAgricultural Sciences 17, 2011,
217-229.
0,705
0,313
0,1309
0,13610,2241
0,8118
0,7028
0,291
0,1246 0,1281
0,2192
0,7902
0
0,1
0,2
0,3
0,4
0,5
0,6
0,7
0,8
0,9
φ Sw kEXP. ktheory C L
Datenreihen1
Datenreihen2