Embed Size (px)
Citation preview
Vol. 12, No. 1 March 2011 pp. 44-47
Preparation of Activated Carbon Fibers from Cost Effective Commercial
Textile Grade Acrylic Fibers
Mekala Bikshapathi1, Nishith Verma1,♠, Rohitashaw Kumar Singh2,
Harish Chandra Joshi2 and Anurag Srivastava2
1Depatment of Chemical Engineering, Indian Institute of Technology Kanpur, Kanpur-208016, India2Defence Materials and Stores Research & Development Establishment, Kanpur-208013, India
♠e-mail: [email protected]
(Received January 18, 2011; Accepted March 7, 2011)
Abstract
Activated carbon fibers (ACFs) were prepared from cost effective commercial textiles through stabilization, carbonization,
and subsequently activation by carbon dioxide. ACFs were characterized for surface area and pore size distribution by
physical adsorption of nitrogen at 77 K. ACFs were also examined for various surface characteristics by scanning electron
microscopy, Fourier transform infrared spectroscopy, and CHNO elemental analyzer. The prepared ACFs exhibited good
surface textural properties with well developed micro porous structure. With improvement in physical strength, the
commercial textile grade acrylic precursor based ACFs developed in this study may have great utility as cost effective
adsorbents in environmental remediation applications.
Keywords : Activated carbon fibers, Carbonization, Activation, Adsorption
1. Introduction
Activated carbon fibers (ACF) are porous carbon materials
produced from a variety of fibrous carbonaceous precursors
such as pitch fibers, polyacrylonitrile (PAN), phenolic resin,
and viscose rayon [1-4]. In recent times, ACF has been used
as a novel adsorbent having several advantages over the
conventional forms of activated carbon, such as powders,
granules, etc. [5-8]. The salient advantages include fast
adsorption/desorption rate due to small fiber diameter, which
minimizes diffusional resistance, flexibility of designing
fibers in various forms like felts, paper, and nonwovens, ease
of handling, abrasion resistance, and amenable to surface
functionalization and also, regeneration [3].
It is needless to mention that the cost of precursor strongly
affects the cost of the production of ACF. Hence, a lot of
interest has been generated in recent years among
researchers to reduce the cost of precursor so that the cost of
ACF is low. In this context studies have been performed on
preparation and characterization of ACF from the relatively
less expensive textile grade acrylic fibers are available
[2,3,9,10].
In the present study, ACFs have been produced from the
textile grade acrylic fibers through the steps comprising
stabilization in air, carbonization in nitrogen (N2), and
activation in carbon dioxide (CO2) atmosphere. The prepared
ACFs have been characterized for surface textural properties,
elemental analysis, surface morphology, and Fourier transform
infrared spectroscopy (FTIR) analysis. The materials have
potential to act adsorbents in environmental remediation
applications.
2. Experimental
2.1. Materials
Commercial textile grade acrylic fibers (in non-carbonized/
non-activated form) were procured from M/s Pasupati
Acrylon Ltd., Moradabad, India. The N2, air, and CO2 gases
(with the purity >99%) were obtained from Sigma Gases and
Services Ltd., New Delhi, India.
2.2. Methods
The as-received non-carbonized and non-activated fibers
were stabilized, carbonized and activated in a vertical tubular
furnace having arrangement for suspending fibers in a quartz
reactor (ID = 3.5 cm, L = 100 cm). The arrangements were
made for the gases (air, N2, and CO2) to flow through the
reactor. Approximately 3.5-4.0 gm of acrylic fibers were
placed in the reactor and stabilized at 230oC for five hours in
air at the flowrate of 100 standard cc per min. The heating
rate was maintained at 1oC per min. A load of approximately
80 gm was applied during heating and taken off later before
carbonization to overcome the shrinkage effect during
Carbon
Letters
45 Mekala Bikshapathi et al. / Carbon Letters Vol. 12, No. 1 (2011) 44-47
stabilization. Carbonization in nitrogen atmosphere at
heating rate of 2.5oC up to the desired activation temperature
and subsequently activation in CO2 were carried out in a
single step. The activation temperatures and times were
varied from 700-950oC and 30-600 min, respectively at
constant CO2 flow rate. After activation all samples were
cooled to room temperature in N2 atmosphere before
removing from the reactor.
2.3. Characterization
The prepared ACFs were characterized for surface textural
properties by the surface area analyzer (Micromeritics 2020
ASAP, USA). Before starting adsorption, the samples were
outgassed at 300oC for 4 h. The Brunauer-Emmett-Teller
(BET) surface area and pore volume were calculated at 77 K
using N2 as adsorbate. The BET equation was used for
calculating surface area, and pore volume was measured
with the help of adsorption isotherms at a relative pressure
close to one, assuming that the pores are filled with liquid
nitrogen (density = 0.808 cc/g). Micropore volume was
calculated by the t-plot method and the mesopore volume
was calculated by the Barrett-Joyner-Halenda (BJH) method.
Scanning electron microscopy (SEM) was carried out using
Zeol scanning microscope (Germany) after plating samples
with gold. The FTIR and elemental analysis were carried out
using the Tensor 27 (Bruker, Germany) instrument and
elemental analyzer (Model: CE-440 EL, Exeter Analytical
Inc, USA), respectively.
3. Results and Discussion
3.1. Activation process and surface textural properties
The activation conditions and surface textural properties of
acrylic fibers (indicated as F-Plain) and ACFs derived herein
by activation using CO2 are summarized in Table 1. It is
evident from the table that relatively lower activation
temperature has resulted into low surface area (~240 m2/g)
of ACF (sample F24), even though the samples were
activated for considerable time (4 h). However, increase in
the activation temperature from 800oC to 900oC resulted in
the significant increase of surface area from 240 m2/g to
734 m2/g. With further increase in the activation temperature
above 900oC, the surface area decreased.
Porosity in carbon materials initially develops during
carbonization due to irregular spacing between aromatic
sheets. However, the pores are subsequently blocked-off
because of deposition of tarry materials. Activation is aimed
at partial gasification of carbonized materials in order to
clear off disorganized carbon and open up closed pores, and
at the same time creating new pores by selective burning off
of the carbon atoms from regions of low energy [11].
Therefore, the observed increase of surface area as well as
pore volume in the present case is attributed to the
gasification of carbonized fibers by CO2. At low activation
temperature the micropore formation and the pore widening
occur simultaneously, resulting in a large micro porous and
low surface area-carbon. This is probably the reason for low
surface area and high micro porosity observed for the sample
F24. Moreover, at low temperature pore widening does not
commence and in addition, the creation of new pores occurs
at a slow rate. This may also be attributed to the slow
reaction rate of CO2 with the carbonized fibers. At relatively
higher activation temperatures both pore formation and
widening occur. However, creation of pores occurs at a
slower rate as compared to that of pore widening [4]. This
explains decrease in micro porosity observed in the sample
F17. At high activation temperature (950oC), the reaction of
CO2 with carbonized fibers occurs at large rate resulting in
surface oxidation rather than gasification inside the carbon
skeleton. The reason may be attributed to the collapse of
micro porous structure because of the thermal shrinkage of
pores at high temperature, as also reported elsewhere [12,13].
Sample F19 exhibited poor physical strength on physical
observation suggesting the adverse effect of reaction at
950oC. Comparing the surface characteristics of different
samples, the activation conditions used in preparing the
sample F4 appear optimum, as the corresponding ACFs have
reasonable large surface area and micro porosity. It appears
that the optimum reaction conditions facilitate a balance
Table 1. Surface Areas, Pore Volumes, and Pore Size Distributions of the Different Samples
S. No SampleActivation
temperature (°C)
Activation time (min)
BET surface area (m2/g)
Micro pore area (m2/g)
Total pore volume(cc/g)
Micro pore volume(cc/g)
Microporosity
(%)
Meso pore volume(cc/g)
Mesoporosity
(%)
1 F-plain -- -- -- -- -- -- -- -- --
2 F-24 750 300 240 226 0.139 0.133 95 0.006 4
3 F-9 800 180 330 293 0.26 0.241 92 0.019 7
4 F-4 850 180 654 634 0.359 0.332 92 0.027 7
5 F-17 900 90 734 616 0.46 0.314 68 0.146 31
6 F-19 950 30 472 416 0.275 0.212 77 0.063 22
BET: Brunauer-Emmett-Teller.
Preparation of activated carbon fibers from cost effective commercial textile grade acrylic fibers 46
between pore creation (leading to micro pores) and pore
widening (leading to mesopores), as observed fin sample F4.
It is worthwhile to point out here that a balance between the
micropores formation and destruction (pore widening) leads
to the development of a viable commercial adsorbent which
is the primary objective of this study.
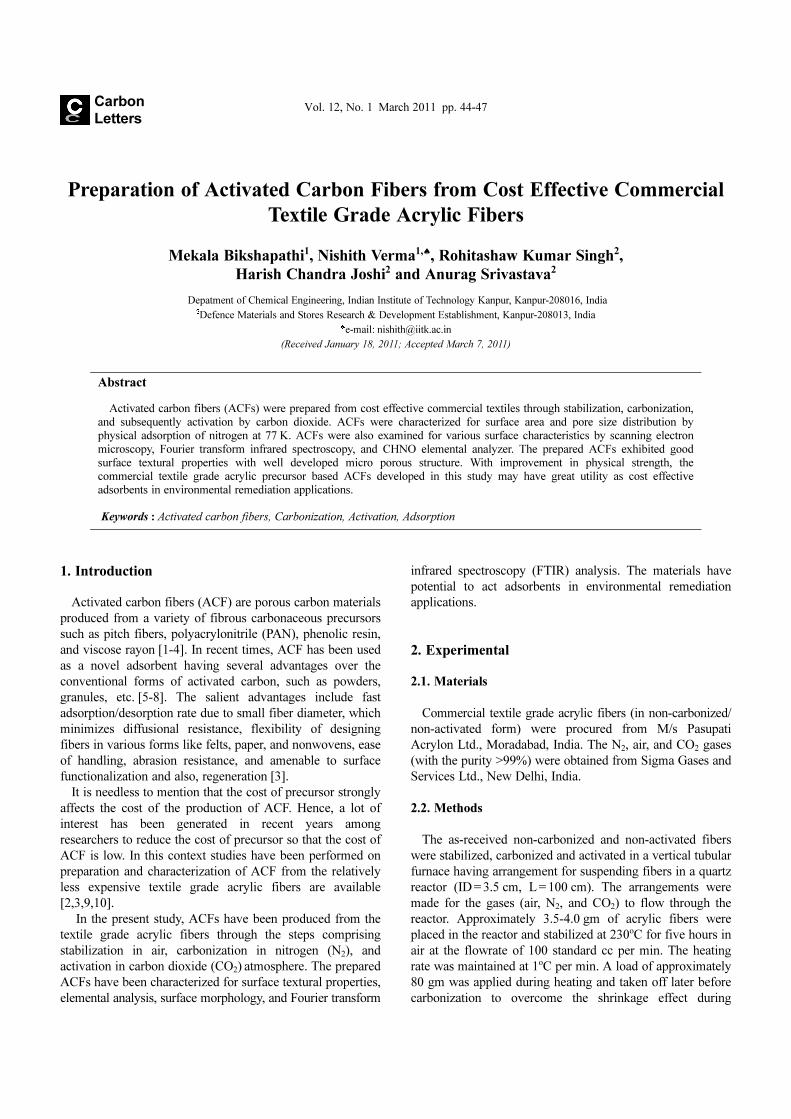
3.2. Adsorption isotherms
Adsorption by nitrogen at 77 K is a standard procedure for
the characterization of porous materials. The shape of
nitrogen adsorption isotherm provides information about the
development of porosity in adsorbents. As per International
Union of Pure and Applied Chemistry (IUPAC) norms pores
are classified in three categories according to the pore
dimensions: (a) micro pores (average size < 2 nm) (b) meso
pores (2 nm < average size < 50 nm), and (c) macro pores
(average size > 50 nm) [14]. The isotherms for ACF (Fig. 2)
are observed to be type 1, which is the characteristics of
micro porous adsorbents, according to Brunauer, Deming,
Deming and Teller (BDDT) classification [15]. The shapes
of such isotherms have a platue after an initial vertical rise.
The knees of the isotherms are sharp and the platues are
fairly horizontal. It implies that the pore size distribution is
narrow. This is also supported by the high porosity values, as
indicated in Table 1. However, increased adsorption is
observed at high relative pressures for samples F17 and F19.
This indicates that the sample is micro porous having a
relatively smaller external surface area, which may be
because of widening of the existing micro pores. As
discussed in section 3.1, the isotherms also reflect activation
and the development of porosity in ACFs. It is evident that
the pore formation overrates pore widening below 850oC. A
highly micro porous ACF is consequently produced, as
reflected in the corresponding adsorption isotherm with an
initial rise in the slope. The slope tends to level off at high
relative pressures. However, pore widening above 850oC
takes place at a faster rate in comparison to that of the
formation of new pores. This is reflected in the shape of
isotherms (sample F17) with an increase in slope at high
relative pressures.
3.3. Elemental analysis
The acrylic fibers (in non-carbonized and non-activated
forms, represented as F-Plain) and ACFs were analyzed for
elemental compositions for carbon (C), hydrogen (H), nitrogen
(N), and oxygen (O). As observed from the Table 2, there is
continually marginal increase of C-contents, which is an
indicative of increased charring of base material at high
temperature. On contrary, N- and H-contents significantly
decrease with increasing activation temperature. O-contents
increase continually. The reason is attributed to the reaction
between the activating agent and carbon matrix, producing
oxygenated functional groups, also corroborated by the FTIR
spectra discussed later in the manuscript. Therefore, it may be
concluded that CO2 activation results in increase of O-contents.
Fig. 1. Nitrogen adsorption isotherms at 77 K of F-24 (activatedat 750oC, 300 min in CO2 atmosphere), F-19 (activated at950oC, 30 min in CO2 atmosphere), F-17 (activated at 900oC,90 min in CO2 atmosphere), F-19 (activated at 950oC, 30 min inCO2 atmosphere), F-9 (activated at 800oC, 180 min in CO2
atmosphere), F-4 (activated at 850oC, 180 min in CO2 atmo-sphere).
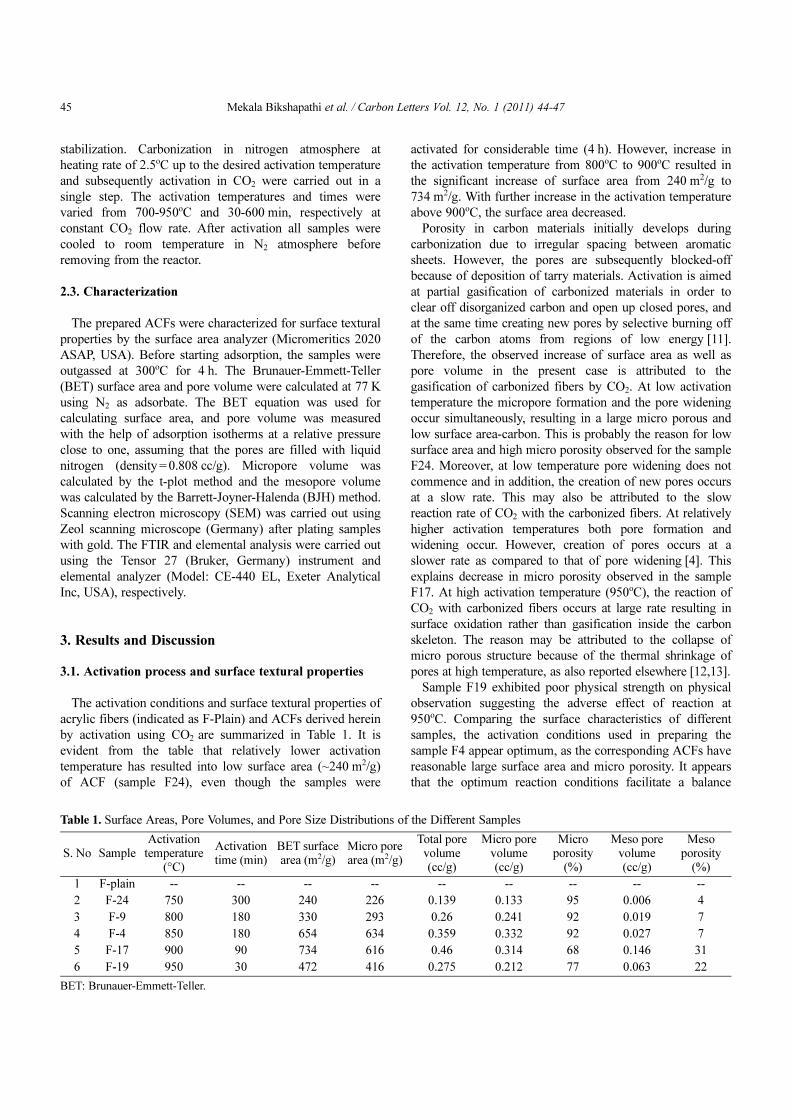
Fig. 2. Fourier transform infrared spectroscopy analysis ofdifferent samples.
Table 2. Elemental Analysis Data
S. No SampleElemental data (wt %)
C H N O
1 F-plain 65.51 5.63 22.85 4.96
2 F-24 71.10 1.03 12.10 13.15
3 F-9 71.47 0.87 8.96 16.92
4 F-4 73.15 0.74 6.40 18.36
47 Mekala Bikshapathi et al. / Carbon Letters Vol. 12, No. 1 (2011) 44-47
3.4. FTIR analysis
All samples except F-plain were treated with CO2 at
different temperatures. The corresponding FTIR spectra are
shown in Fig. 2. As observed, the small peaks at around
1700-1785 cm−1 are due to the carbonyl functionality of
different groups such as ketone, lactone, aldehyde, and
quinine on the carbon surface. The aromatic C-C stretching
observed at around 1550 cm−1 is because of activation at
high temperature, as the disordered carbon are arranged and
aromatized. The peaks observed between 950 to 1350 cm−1
for high temperatures-activated samples correspond to the C-
O stretching of alcohols, carboxylic acids, esters, ethers, and
lactone, and also to the aromatic C-H bending or
deformation. In summary, it may be concluded that the
surface gets increasingly ordered at high temperature.
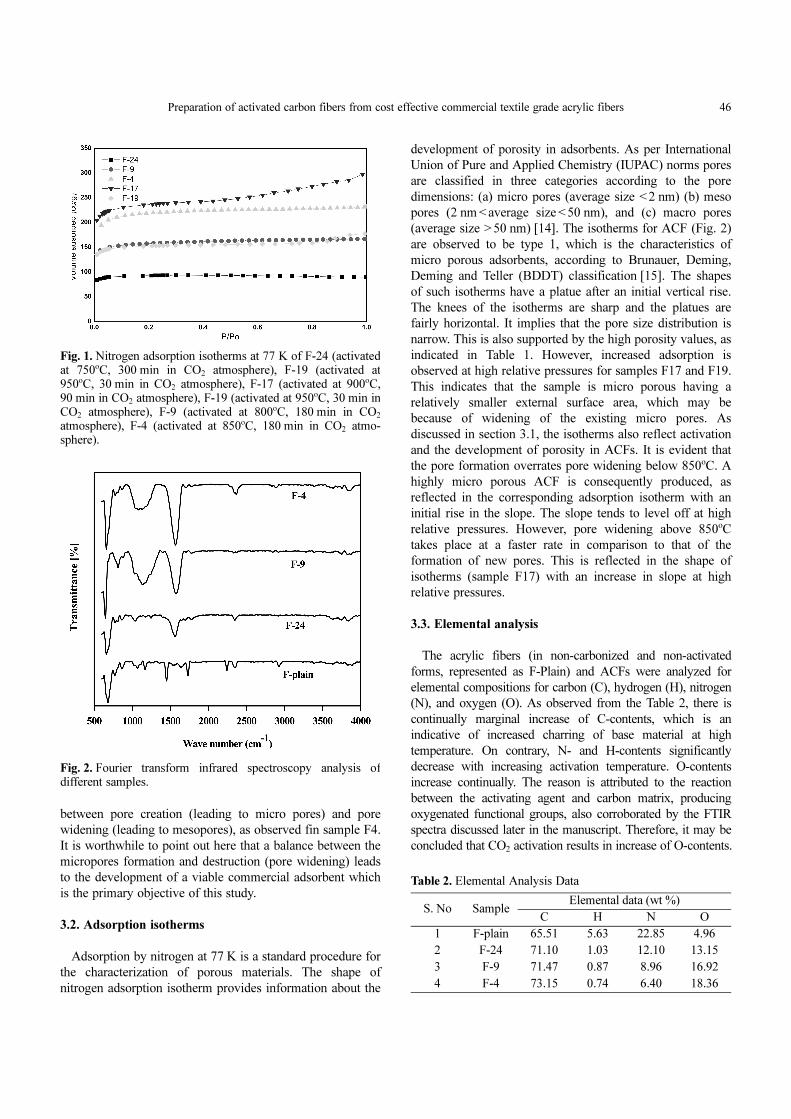
3.5. SEM observation
The SEM images of non-carbonized, non-activated acrylic
precursor fiber, carbonized fiber and ACF are shown in Fig. 3.
The images shown in Figs. 3(a) and (b) are suggestive of the
preservation of the initial structure of acrylic fiber during
stabilization and carbonization. Similar observation has also
been reported in a study [2]. As also observed in Fig. 3(a),
the cross-section of non-carbonized and non-activated fiber
is kidney shaped. The diameter of carbonized fiber is around
10-12 µm, as observed in Fig. 3(b). We also examined
electron micrographs both at cross-sections and along the
surface. Small unevenly dispersed pits on surface were
observed in ACFs, as shown in Figs. 3(c) and (d). In the
SEM investigation carried out by Ryu et al. [3], elongated
micro pores created because of shear during spinning were
observed parallel to the fiber axis. The similar pores were,
however, not observed in the present investigation. It appears
from the surface morphology of sample F-19 that CO2
gasification rate at 950oC is high, resulting in surface
roughening and fiber disintegration. Similar observations are
also reported elsewhere [2,10].
4. Conclusions
ACFs were produced from the cost effective commercially
available textile grade acrylic fibers. The ACFs showed
good surface textural properties and physical strength at
relatively lower activation temperatures. However, activation
at higher temperature produced ACFs with small surface
area and micro porosity. The ACFs showed physical
disintegration as well as small surface area and micro
porosity above 900oC. The activation temperature of 850oC
and activation time of 180 min were found to be optimum
for producing ACFs having the BET surface area of 654 m2/g
and pore volume of 0.359 cc/g. ACFs produced may be of
great interest as a cost effective adsorbent material in various
adsorption applications. However, physical strength of ACF
is required to be improved upon for commercial viability.
References
[1] Ryu SK, Kim SY, Gallego N, Edie DD. Carbon, 37, 1619
(1999).
[2] Carrott PJM, Nabais JMV, Ribeiro Carrott MML, Pajares
JA. Carbon, 39, 1543 (2001).
[3] Ryu Z, Zheng J, Wang M. Carbon, 36, 427 (1998).
[4] Gurudatt K, Lal D, Tripathi VS. Indian J Fiber Textil Res,
23, 153 (1998).
[5] Oya A, Yoshida S, Alcaniz-Monge J, Linares-Solano A.
Carbon, 34, 53 (1996).
[6] Li CY, Wan YZ, Wang J, Wang YL, Jiang XQ, Han LM.
Carbon, 36, 61 (1998).
[7] Bohra JN, Saxena RK. Colloid Surface, 58, 375 (1991).
[8] Oya A, Yoshida S, Alcaniz-Monge J, Linares-Solano A.
Carbon, 33, 1085 (1995).
[9] You SY, Park YH, Park CR. Carbon, 38, 1453 (2000).
[10] Carrott PJM, Nabais JMV, Ribeiro Carrott MML, Pajares
JA. Fuel Process Technol, 77-78, 381 (2002).
[11] Marsh H, Rand B. Carbon, 9, 47 (1971).
[12] Nakagawa H, Watanabe K, Harada Y, Miura K. Carbon,
37, 1455 (1999).
[13] Carrott PJM, Freeman JJ. Carbon, 29, 499 (1991).
[14] Zdravkov BD, Cermak JJ, Sefara M, Janku J. Cent Eur J
Chem, 5, 385 (2007).
[15] Gregg SJ, Sing KSW. Adsorption, Surface Area, and
Porosity. 2nd ed., Academic Press, New York (1982).
Fig. 3. SEM images of F-plain, F-carbonized (850oC, 30 minunder N2 flow), F-17 (activated at 900oC, 90 min in CO2 atmo-sphere), and F-19 (activated at 950oC, 30 min in CO2 atmo-sphere). SEM: scanning electron microscopy.


![Influence of the Permittivity on Carbon Fiber · carbon in its different allotropic forms for the production of RAMs, whether in the form of activated carbon fibers polymer [15],](https://img.pdfslide.us/doc/110x75/6063d95b24cba350fb039d06/influence-of-the-permittivity-on-carbon-fiber-carbon-in-its-different-allotropic.jpg)

![Effect of Fasudil on Glioma Cell Migration...cellular activities including cell motility, cytokinesis, regulation of stress fibers and formation of focal adhesions [5]. Activated GTP-RhoA](https://img.pdfslide.us/doc/110x75/61385b7a0ad5d20676493446/effect-of-fasudil-on-glioma-cell-migration-cellular-activities-including-cell.jpg)


![Pitch-based carbon fibers from coal tar or petroleum ...carbonlett.org/Upload/files/CARBONLETT/[072-078]-09.pdf · 72 Pitch-based carbon fibers from coal tar or petroleum residue](https://img.pdfslide.us/doc/110x75/5b858d487f8b9ab7618df583/pitch-based-carbon-fibers-from-coal-tar-or-petroleum-072-078-09pdf-72.jpg)