Embed Size (px)
Citation preview
Journal of Structural Geology, Vol. 15, No. 7, pp. 933 to 937, 1993 0191-8141/93 $06.00+0.00 Printed in Great Britain © 1993 Pergamon Press Ltd
Brevia
SHORT NOTES
Preparation of accurate geological and structural maps, cross-sections or block diagrams from colour slides, using multi-model photogrammetry
K. S. DUEHOLM
Institute of Surveying and Photogrammetry, Technical University of Denmark, Landm~lervej 7, DK-2800 Lyngby, Denmark
A. A. GARDE
Geological Survey of Greenland, Oster Voldgade 10, DK-1350 Copenhagen K, Denmark
and
A. K. PEDERSEN
Geological Museum, University of Copenhagen, Oster Voldgade 5-7, DK-1350 Copenhagen K, Denmark
(Received 13 July 1992; accepted in revised form 11 November 1992)
Abstract--The multi-model photogrammetric method is a new technique that allows field geologists to make accurate three-dimensional models of their choice using standard colour slides taken with ordinary field cameras. The method greatly expands the geological potential of photogrammetry beyond conventional methods based on vertical aerial photographs or satellite data. A computerized stereoscopic instrument, in which the commercial software is replaced by multi-model software, is used for interpretation. The multi-model technique links a series of stereoscopic images of the same target viewed at different scales, or from different angles, to form one composite three-dimensional model, and permits instantaneous image shifts to be performed during interpre- tation. The method can be applied to numerous geological situations where accuracy is required, but where access or overview is difficult or impossible; a significant proportion of geological and structural analysis can thus be moved from the field to the laboratory. Examples of geological and structural applications include studies of Tertiary basalts in West Greenland and Precambrian gneisses in South India; the scale of these studies varies from 1:200,000 to 1:25.
INTRODUCTION
GEOLOGISTS who study rock outcrops in the field face the common problem of illustrating and quantifying their observations. They wish to place geological contacts or internal boundaries accurately on maps or sections, and often need to know the precise geometry of visible structures such as bedding planes, foliations, fold axes, lineations or joint systems in order to solve structural problems. It is also sometimes desirable to work with accurate three-dimensional presentations of a series of related outcrops; e.g. for correlation purposes or to model oil reservoirs. Both the collection of observations and their conversion to a convenient model may present problems. For example, geological field work in well- exposed alpine terrain can be frustrating, as the outcrops are often excellent but may be impossible of access, and it may be difficult to obtain a good viewing position of large-scale structures. Furthermore, topographic maps are often not available at a scale or quality that allows satisfactory presentation of the geological data.
Stereoscopic terrain images based on aerial photo- graphs and/or satellite data are at present employed by
geological surveys to overcome some of these difficul- ties, and vertical aerial photographs mounted in modi- fied conventional photogrammetric instruments can be used to obtain precise geological information (e.g. Pedersen 1981, Pillmore et al. 1981, Dueholm & Pill- more 1989, Hougaard et al. 1991). However methods based on standard aerial photographs are severely lim- ited by scale to regional studies, and their viewpoint high above the ground makes them impractical in many situations, such as the study of steep mountain faces. Other drawbacks include the fact that vertical aerial photographs are usually not in colour, and parts of the landscape may be hidden in shadow.
THE MULTI-MODEL METHOD
The multi-model method is an elegant new photo- grammetric technique that ideally overcomes all the abovementioned difficulties; it allows the field geologist, using colour slides taken by a hand-held ordinary camera, to create accurate three-dimensional geological data in the laboratory. The method was developed at the
933
934 K.S. DUEHOLbi, A. A. GARDE and A. K. PEDERSEN
Institute of Surveying and Photogrammetry, Technical University of Denmark, and at the U.S. Geological Survey, Denver, Colorado, in close co-operation with geologists of the University of Copenhagen and the Geological Survey of Greenland. The geologist can establish an accurate three-dimensional model of the study area, in colour, at scale and from a direction of view chosen to best portray the geology at hand. In contrast to conventional photogrammetric methods, which are based on large-frame photographs made with expensive purpose-designed metric cameras, the multi- model method was developed for small-frame non- metric cameras like those already used by the field geologist for illustrative purposes (see below for techni- cal details). A great advantage of the multi-model tech- nique is that links can be made between several series or blocks of photographs (not a single stereoscopic pair) combined in one composite, three-dimensional 'multi- model', in which a common co-ordinate system is created around the geological target. During subsequent interpretation the observer can move freely back and forth among the individual model scenes within the composite model, or switch between models to obtain a different scale or viewing angle, while the chosen point of observation is retained.
The multi-model blocks may consist of several photo- graphs (typically 35-mm colour slides) of, for example, a quarry, taken from different directions or at different scales; or of one or several long strips of overlapping photographs taken along a mountain face, a coastline, road cutting or tunnel wall; or of one pair of standard aerial photographs combined with blocks of small-frame colour photographs providing selected close-ups. The actual photography may be performed during field work from the ground, by boat, or from the air using a helicopter or small fixed-wing aircraft.
The photographs are mounted on two moving stage plates in a Kern DSR-15 analytical plotter. This instru- ment is a computerized equivalent of earlier mechanical instruments, where the entire mechanical system that controls the stereoscopic model and moves the view- point has been replaced by the two stages, the move- ments of which are controlled by a computer. The factory software is replaced by multi-model software (Dueholm 1990), which handles the administration and orientation of all the integrated stereoscopic models, performs automatic or prompted model shifts, provides the user interface, and stores and displays the data collected during the interpretation.
Once the photographs have been mounted in the instrument, the geologist can continue his field study in the analytical plotter, where the physical terrain is now replaced by a composite three-dimensional photogram- metric model. Any visible geological features, such as lithological boundaries, internal rock structures, folds, lineaments, faults, etc. (as well as constructed topo- graphical features such as contour lines) can be tracked continuously across model boundaries with a floating mark, and their positions measured and stored in data files as groups of three-dimensional (Universal Trans-
verse Mercator (U.T.M.) or local) co-ordinates. In the same way, the orientations and/or dimensions of visible planar or linear structural elements (e.g. bedding planes, joint sets, foliation surfaces or fold axes) can be measured and stored. The analytical plotter is connected to an on-line plotting table, where the collected data are shown at the desired scale and projection along with topography as plan views, vertical or oblique profiles, block diagrams or perspectives. Data files can sub- sequently be transferred in a standardized format to desktop computers for further manipulation, inte- gration with geographical information systems, or pro- duction of publication-ready illustration with a graphics application (Garde 1992a, Humlum 1992).
PRACTICAL PROCEDURES
Photography
The photographs to be used in multi-model photo- grammetry may be taken with any ordinary small-flame camera (with film formats such as 35 or 70 mm, i.e. 24 x 36 or 60 × 60 mm photographs) equipped with a stan- dard or wide-angle lens (experiments have not yet been done with zoom lenses, which generally have an inferior optical quality). The lens should always be set at the same focusing distance, in practice at infinity. Further details are given in Dueholm (1992). The considerable radial lens distortion found in non-metric camera lenses is compensated for by an initial calibration of the camera; a three-dimensional test field is photographed, the positions of the test points on the film are measured, and the resulting calibration parameters are used for continuous automatic correction by the multi-model software during use of the analytical plotter.
Stereoscopic overlap between individual exposures in strip should be about 65% to obtain good measure- ments, but may be increased to 80% to ensure complete coverage of irregular targets such as mountain faces with narrow side gullies. Camera direction should be kept constant (within ca 10 °) during photography of each strip to facilitate easy stereoscopic viewing; large variations of scale can later be compensated for by the viewing system of the analytical plotter.
Successful multi-model projects have been carried out with both 35- and 70-mm cameras. The former are easier to handle, and twice as many models (39 instead of 17) can be mounted together as a multi-model block in the analytical plotter; the 70-ram film format provides better coverage of tall subjects such as high cliffs.
Model orientation and reference points
Initial model orientation is typically carried out by a technician, but most geologists can master the technique with appropriate tuition. Once a multi-model has been established, it can be re-installed in a few minutes by the geologist.
The creation of a three-dimensional photogrammetric
Preparat ion of maps using multi-model pho togrammetry 935
. . : . : . : : : : : : ' : i~! i ! ! :!:!:::: i : i : i i ! i i
. . . . i:ili!!!i!!ii!i!i!i iii iii ! :
iiiil;!iiiii!;iiiilili :. : iiiiiii!i!!!-!iiiiiiiiii!!iiii!iiiii;iiiii!i!i.:.:.:.:,:.:.:.: ........ . ....
-~04000 ÷
: : ; . 7 : : : " : ' : • ;,,': • : ! : " . ,~"
,
• " : ' : " :* : ' : ' : ' ! : i : i(ff '.~i ::::::::::::::::::::: :,/. . , : . . : , : . : . : . : . : . : . : . - : I ~."'
• ' • ' : ' ~ 1 ' : ' : ' : ' : ' : ' ======================
: . : ~ . : . : . : . : . : . : . ~...: . : : : , : : : : '~ : : : : :~ :
=======================
.:i:i:!:~:!:!;~i:i:.(:i :" ============================= • : . : . : . : . : . : . : :i~ .
• i : i : i ' i : i : ~ : i : ~ ' ' " ~ ' '
: . . . . ! . : - . .
" { . . . . : . . . . . . . . ' . . . . / " " . . . . . . . >" . . . . . . ; 7 : . . . . I v . . . . , . . . . . . . . . • . . . . ~ . . , : . . ;, . ;...,.. . . . . >, . . . . . . . y . , ..: ..... ....... , ........ : • ~,~,.. -.,..> ...... :,....../..~.,,..
: i : ! : ," " " . . . . . , . . . . . . . . . r ~ " - : ' "~> . . . . . . ;, . . . . . . J ' 7"' )'/ . . . . : : : : : : : : : : : : : : : : : : : : : : : : : : : : : : : : : : : : : : : : : : , / : ) " " . '~- .
. . . . . ; , . . , > , . : " . . ] . . . . . . . . . ~ - ~ " . . . ~ ; ~ , , . . - - . . . . . . c ~ . c . _ . ) . • • ' " - " " A " ' f . . ~ . , . . . . . " . , . r i d . ,,,,.t" . . . . . . . . . . . . . . ~. . . . . . " . . . . . . . . . , . . . . . . . . : . . , " . . . . . . . . ~ 75 : : : : : : : • , ~ , , I . . y : . . . . . :t . . . . ,~ . . . . . ; . . . , : ; - ~ .~ .-r-'.. ~ . - < - - ~ "' " ~ . ~ - ~ . ~ - : . - . ~ v - . ' . . ~ : - . " : ' .
" ;;.~" " .... z .............. I . , , , . - ~ : . . - . . . ~ - - ~ . . ~ ~. --~ • l °" " ) ' " > ' ' " . # " . . . . . " I " " " " • " ~ ~ f ' / , . . . . . . . . . . . ........ ,.. ......
. ~ : . / . . j . . . . . ' ' 1 . . . . . ; ,I ' . : : ! : i : i : i : ! . . . . . f - ====================================== : : : : : : ' " "
",~ ~ . ~ / i , / ~ . . . : ' ~ i ! i : i : i : i : i : i i i : i i ! i i i i i i i i i i l i l i . . a ~ . i i i i ! i i i i : i : : ' : ' " " -~ i ! ~ " . ' 6 ! ' ~ ' - ~ _ _ ~ : : : : : : : : : : : : : : : : : : : : : : : : : : : : : : : : : : : : : : : : : : : : : : : : : : : : : : : : : .
~ . ~ . . . ' . : i ! i ! i ! ! i i ! i i ! ! i l i ! i i i : ~ : : . . . .
. . . . ~ ~ i i ! i::!i!::!i! I::::' + ~ Quaternary cover
- " %: ii!iiiiiii! iiiiiii!iiiiiiiiiii :::" D , , k e = = = = = = = = = = = = = = = = = = = = = = = = = = = = = = = = = t ~
. . , . . . , x . . . . ~ , . . . . ~ . , ; 4 ~ . . , . . . . , . . . . . .
:':':':':'":':':~" ":':':':" ~ Orthogneiss
__~...'=======================:= . . . . 1 k m S h e a r z o n e C o n t o u r i n t e r v a l 5 0 m ~ ~ ~ ' " ~ . - , , . , . . . . . . , . , .
i : i : i : i i : : : " so S t r i k e a n c l c l i p o f d y k e , . , .
i i
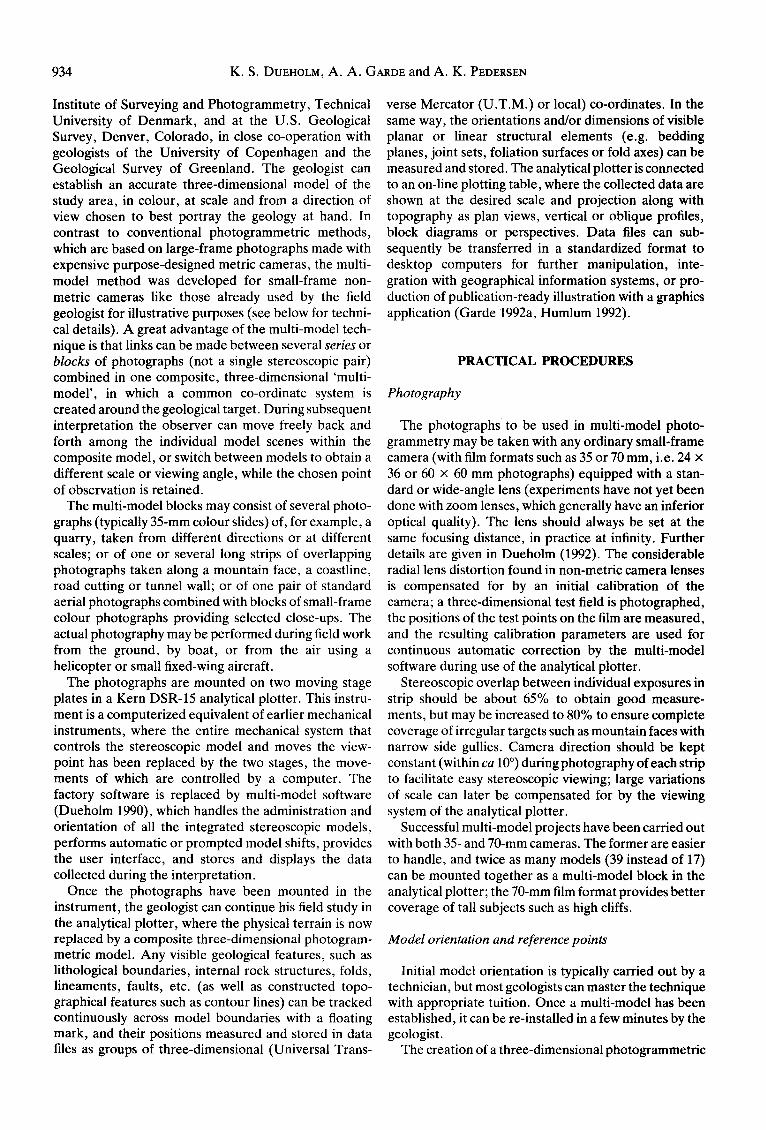
Fig. 1. Perspective view and map of rotated mafic dykes at Ilordleraq, Nuussuaq, West Greenland, constructed from seven 35-ram colour slides taken from a helicopter using the multi-model method. The dykes were intruded into Precambrian basement gneisses between two periods of deformation, and progressively rotated from vertical to shallow ENE-dipping orientations within a major syncline during the second phase of deformation. Strikes and dips of the rotated dykes (shown
on the map) were measured in the analytical plotter. Numerous shear zones run parallel to the dyke direction.
model with correct geographical co-ordinates and scale requires that a number of reference points with known ground co-ordinates can be recognized in the photo- graphs. With conventional photogrammetr ic methods, at least three reference points are necessary to establish each stereoscopic model. In multi-model photogram- metry, however , where the whole block of related models is established simultaneously, much fewer ground reference points are needed (approximately the same as the number of models). This greatly simplifies the orientation procedure , and at the same time over- comes the inherent photogrammetr ic problem of creat-
ing sufficiently accurate steroscopic models with small- f rame photographs.
The reference points can be established in a variety of ways. Geographical co-ordinates can be obtained from a national geodetic network, using points transferred from aerotr iangulated vertical aerial photographs; this is the standard method employed by geologists using the multi-model method in Greenland (Pedersen & Due- holm 1992). Points can also be transferred from topo- graphical maps where these are of good quality, or use can be made of the global positioning system (GPS). In some cases a local co-ordinate system may conveniently
936 K.S . DUEHOLM, A. A. GARDE and A. K. PEDERSEN
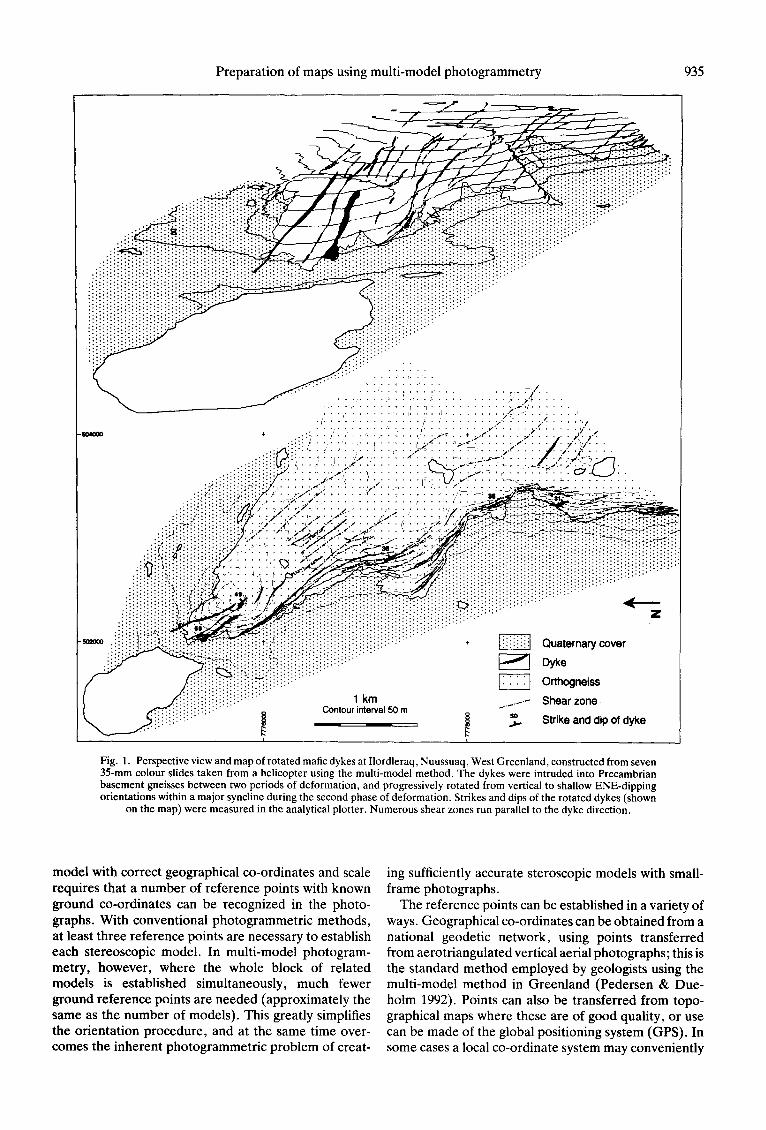
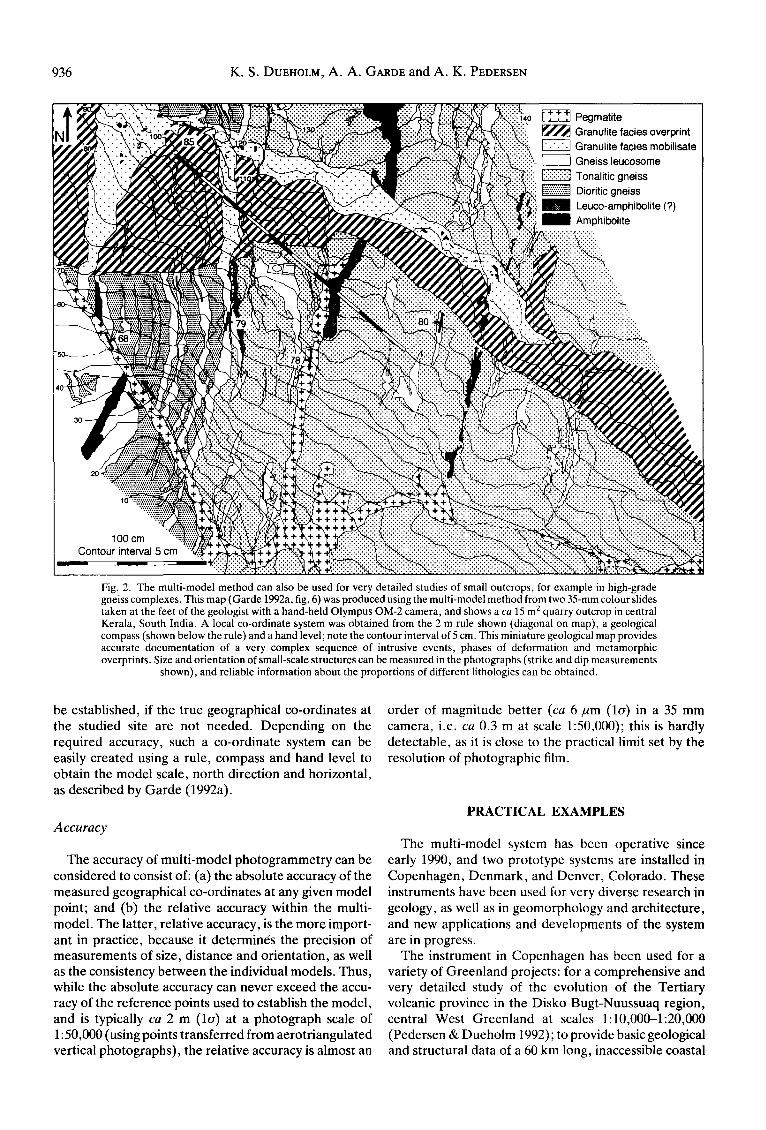
Fig. 2. The multi-model method can also be used for very detailed studies of small outcrops, for example in high-grade gneiss complexes. This map (Garde 1992a, fig. 6) was produced using the multi-model method from two 35-mm colour slides taken at the feet of the geologist with a hand-held Olympus OM-2 camera, and shows a ca 15 m 2 quarry outcrop in central Kerala, South India. A local co-ordinate system was obtained from the 2 m rule shown (diagonal on map), a geological compass (shown below the rule) and a hand level; note the contour interval of 5 cm. This miniature geological map provides accurate documentation of a very complex sequence of intrusive events, phases of deformation and metamorphic overprints. Size and orientation of small-scale structures can be measured in the photographs (strike and dip measurements
shown), and reliable information about the proportions of different lithologies can be obtained.
be established, if the true geographical co-ordinates at the studied site are not needed. Depending on the required accuracy, such a co-ordinate system can be easily created using a rule, compass and hand level to obtain the model scale, north direction and horizontal, as described by Garde (1992a).
A c c u r a c y
The accuracy of multi-model photogrammetry can be considered to consist of: (a) the absolute accuracy of the measured geographical co-ordinates at any given model point; and (b) the relative accuracy within the multi- model. The latter, relative accuracy, is the more import- ant in practice, because it determines the precision of measurements of size, distance and orientation, as well as the consistency between the individual models. Thus, while the absolute accuracy can never exceed the accu- racy of the reference points used to establish the model, and is typically ca 2 m ( la) at a photograph scale of 1:50,000 (using points transferred from aerotriangulated vertical photographs), the relative accuracy is almost an
order of magnitude better (ca 6/~m (lo) in a 35 mm camera, i.e. ca 0.3 m at scale 1:50,000); this is hardly detectable, as it is close to the practical limit set by the resolution of photographic film.
PRACTICAL EXAMPLES
The multi-model system has been operative since early 1990, and two prototype systems are installed in Copenhagen, Denmark, and Denver, Colorado. These instruments have been used for very diverse research in geology, as well as in geomorphology and architecture, and new applications and developments of the system are in progress.
The instrument in Copenhagen has been used for a variety of Greenland projects: for a comprehensive and very detailed study of the evolution of the Tertiary volcanic province in the Disko Bugt-Nuussuaq region, central West Greenland at scales 1:10,000-1:20,000 (Pedersen & Dueholm 1992); to provide basic geological and structural data of a 60 km long, inaccessible coastal
Preparation of maps using multi-model photogrammetry 937
cliff section in Archaean basement rocks (scale 1:200,000; Garde 1992b); to study basement reacti- vation (rotation and deformation of dykes) during Pro- terozoic deformation of Archaean rocks, at the scale 1:25,000-1:50,000 (Fig. 1); to make three-dimensional modelling of Cretaceous-Tertiary fluviatile and deltaic sediment geometry at scales between 1:5000 and 1:20,000 (Olsen 1992, Pedersen 1992); and to study recent geomorphological and vegetation patterns at the scale 1:5000 (Humlum 1992). The method has also been applied to a detailed structural and metamorphic study of quarry outcrops of orthogneisses in South India at scales up to 1:25 (Fig. 2) (Garde 1992a).
The multi-model method has obvious potential in studies of any well exposed mountainous area where access is normally difficult or impossible, and structural studies of nappe tectonics in areas such as the Alps or Himalayas come immediately to mind. Even in more accessible areas multi-model photogrammetry may pro- vide new points of view and thus new insights into structural studies based on field geology. Potential users of the method are encouraged to contact the authors.
Acknowledgements--The authors thank A. K. Higgins, Geological Survey of Greenland, for useful comments and improvement of the English language, A. A. Garde published with the permission of the Geological Survey of Greenland.
REFERENCES
Dueholm, K. S. 1990. Multi-model stereo restitution. Photogram. Engng & Remote Sensing 58, 51-56.
Dueholm, K. S. 1992. Geologic photogrammetry using standard small-frame cameras. Rapp. Grenlands geoL Unders. 156, 7-17.
Dueholm, K. S. & Pillmore, C. L. 1989. Computer-assisted geologic photogrammetry. Photogram. Engng & Remote Sensing 55, 1191- 1196.
Garde, A. A. 1992a. Close-range photogrammetry studies: field and laboratory procedures with examples from prograde granulite fades orthogneisses, Kerala, South India. Rapp. Grenlands geol. Unders. 156, 53-62.
Garde, A. A. 1992b. Interpretation of flat-lying Precambrian struc- ture by geological photogrammetry along a 65 km coastal profile in Nuussuaq, West Greenland. Rapp. Grenlands geol. Unders. 156, 35--40.
Hougaard, G., Jepsen, H. H. & Neve, J. K. 1991. GGU's photogeolo- gical laboratory: aerial photogrammetry--a valuable geological tool in Greenland. Rapp. Gr#nlands geol. Unders. 152, 32-35.
Humlum, O. 1992. Geomorphological applications of multi-model photogrammetry. Rapp. Grenlands geol. Unders. 156, 63-67.
Olsen, T. 1992. Photogrammetric mapping of fluvial channel sand- bodies in the Atane Formation at Paatuut, Nuussuaq, central West Greenland. Rapp. Grenlands geol. Unders. 156, 41--46.
Pedersen, A. K. & Dueholm, K. S. 1992. New methods for the geological analysis of Tertiary volcanic formation on Nuussuaq and Disko, central West Greenland, using multi-model photogram- metry. Rapp. Grenlands geol. Unders. 156, 19-34.
Pedersen, G. K. 1992. An application of multi-model photogram- metry in the study of a Tertiary shale unit, north-east Disko, West Greenland. Rapp. Grenlands geol. Unders. 156, 47-51.
Pedersen, S. A. S. 1981. The application of computer-assisted photo- grammetric studies in the structural analyses of part of the North Greenland Fold Belt. J. Struct. Geol. 3,253-264.
Pillmore, C. L., Dueholm, K. S., Jepsen, H. S. & Schuch, C. H. 1981. Computer-assisted photogrammetric mapping system for geologic studies---a progress report. Photogrammetria 36, 159-171.