Embed Size (px)
Citation preview
Bull. Mater. Sci., Vol. 38, No. 6, October 2015, pp. 1609–1616. c© Indian Academy of Sciences.
Preparation, characterization and electrical study of gum arabic/ZnOnanocomposites
PUSPENDU BARIK1,#, ASHIS BHATTACHARJEE1,∗ and MADHUSUDAN ROY2
1Department of Physics, Visva-Bharati University, Santiniketan 735223, India2Surface Physics and Material Science Division, Saha Institute of Nuclear Physics, Kolkata 700084, India#Present address: Instituto de Ciencias Físicas, Universidad Nacional Autónoma de México, Cuernavaca 62210, Mexico
MS received 24 February 2015; accepted 8 June 2015
Abstract. Gum arabic (GA)-mediated chemical synthesis was carried out for obtaining ZnO nanoparticles (ZnO-
NPs) (particle size of ZnO ≈ 40 nm) which, in turn, was used for preparing ZnO–biopolymer nanocomposites. The
dielectric study of this synthesized products is reported in this paper. The synthesized products were characterized
by X-ray diffraction, Fourier transform infrared, and transmission electron microscopy for their structure and mor-
phology study. The frequency dependence of dielectric constant and dielectric loss of these GA–ZnO nanocomposites
were analysed in the frequency range of 100 Hz–5 kHz. In addition, the dielectric property of these nanocomposites
(0–15 wt% filler concentration) was analysed with respect to frequency in the temperature range 30–80◦C. A high
dielectric constant of 275 is achieved for the sample with 10 wt% of ZnO filler. The dielectric property of GA–ZnO
nanocomposites is attributed to the interfacial and orientation polarization.
Keywords. Polymers; chemical synthesis; infrared spectroscopy; dielectric properties.
1. Introduction
Gum arabic (GA) is an inexpensive, hydrophilic, non-toxic, biocompatible and totally biodegradable polymer.1–3
It is a weak polyelectrolyte that carries charged groups(carboxylate and amine groups), negatively charged abovepH 2.2.4 When adsorbed on a particle surface, it cre-ates steric hindrance, bridging or charge-patch dependingon the pH of the particle solution.5 It is being widelyused for industrial purposes in the food industry, and toa lesser extent in textiles, ceramics, lithography, cosmeticand pharmaceutical industry.6 The GA molecule can actas a reducer, bridging agent, template, stabilizing agentfor oxide and metal nanoparticles.5,7–10 Polymer nanocom-posites with high dielectric constant are always desirablefor transducers, piezo-sensors, hydrophones in producingelectromagnetic antennas, etc. Use of inorganic filler ZnOshows some interesting microscopic, spectroscopic, ther-mal, mechanical, electrical, especially dielectric and con-ductive properties.11–16 Semiconducting ZnO nanoparticles(ZnO-NPs) have some unique properties like large exci-ton binding energy (∼60 meV) and large direct bandgapof 3.3 eV at room temperature.17,18 These properties ofZnO provide higher breakdown voltages and sustain largeelectric fields and offer low electric noise.19 By choos-ing particular kind of matrix and filler nanoparticles, onecan modify the desired properties of the nanocompos-ite for a particular application. As reported in litera-ture, ZnO nanocomposites were investigated for electrical
∗Author for correspondence ([email protected])
study using the matrix of polystyrene, polyaniline, ethy-lene vinyl acetate, polyvinylidine fluoride, polyvinyl alcohol,starch-based polymer, epoxy resins, polyurethane, acrylic,etc.11–14,20–27 There are several reports in the literature onthe dielectric studies of ZnO-doped nanocomposites withpolymers, e.g., acrylic/ZnO,11 polyurethane/ZnO,12 epoxyresin/ZnO,20 polyvinylidene-fluoride–ZnO,21,22 polyaniline(PANI)–ZnO,25 polyvinyl alcohol/ZnO.26,27 Hence, theincorporation of the ZnO-NPs in the biopolymer GA matrixwas explored with the hope that it may lead to some new andinteresting results as compared to other reported matrices asbiopolymers have not been explored in this context.
In this work, ZnO-NPs were successfully prepared usingGA as stabilizing agent and then GA/ZnO nanocompositeand investigated dielectric properties over a low frequencyrange of 0.1–5 kHz and temperature range of 30–80◦C. Thebio-polymeric nanocomposites, consisting of ZnO nanopar-ticles as fillers in various proportions, were characterizedusing electric modulus. ZnO nanoparticles were preparedwith thermal decomposition of zinc hydroxide embedded ina GA matrix. Nano-filler contents have a large surface area ascompared to micro-fillers, and there is a vast growing field toinvestigate nano-filler interaction with polymer matrices forbasic understanding of the filler effect due to nanostructure.16
2. Experimental
2.1 Preparation of ZnO-NPs
The synthesis of ZnO-NPs in the solution of GA (mol. wt. =
250,000) biopolymer was conducted at room temperature. To
1609
1610 Puspendu Barik et al
prepare a solution (A), zinc nitrate [Zn(NO3)2·6H2O] wasdissolved in distilled water under vigorous stirring at roomtemperature. To prepare another solution (B), GA in distilledwater was prepared under vigorous stirring at room temper-ature. Solutions A and B were mixed and NH4OH solutionwas added to it dropwise. pH factor of the final solutionwas maintained at constant value of 12. The white precip-itate was filtered and washed with distilled water for sev-eral times. Then the precipitates were dried in oven at 90–100◦C for several hours and the yield was about 90%. Toreduce the agglomeration among the smaller particles, theGA molecule containing many –OH functional groups wasused in this synthesis method. These functional groups helpto bind to surface of nanoparticles at the initial nucleationstage. Finally, the dried product was subjected to heat treat-ment at temperature 600◦C in air for 2 h to remove residuesof GA polymer.
Zn(NO3)2·6H2O, ammonium hydroxide [NH4OH], GAand ethanol used were all analytical grade. All of the chemi-cals were used as-received without any further treatment.
2.2 Preparation of GA/ZnO nanocomposites
The GA/ZnO nanocomposites were prepared by addingappropriate amount of ZnO-NPs to the GA solution undersonication at ∼60◦C with sonication frequency of 33 kHz.The details of the sample composition, temperature and dry-ing method are given in table 1. Note that the solution mix-ing of each component under sonication was applied to over-come the agglomeration of the nanoparticles in GA watersolution.
2.3 Characterization
The structure of the nanocomposites was investigated withPhilips X-ray diffractometer (Model PW 1710) with filteredCu-Kα radiation of wavelength λ = 0.1541874 nm. Themicrostructure of the specimens was observed under trans-mission electron microscope (TEM, Philips, Model-CM12).Fourier transmission infrared (FT-IR) spectra of GA/ZnOfilms, coated on dry potassium bromide (KBr) pellet, wererecorded on FT-IR 8400S spectrometer with resolution set-ting of 4 cm−1 and range of 400–4000 cm−1. Each sam-ple was scanned 4 times. The fine powders of GA–ZnO
Table 1. Sample composition and temperature of the GA/ZnOnanocomposites.
Sonication temperature,Sample Composition time and drying method
S00 Gum arabic (GA) SonicationS05 1 g GA + 50 mg ZnO temperature—60◦C,S10 1 g GA + 100 mg ZnO time—1 h;S15 1 g GA + 150 mg ZnO drying method—ovenS100 Zinc oxide dried at 90–100◦C
nanocomposites were isostatically pressed into pellets underpressure of 5 bar for 5 min. The capacitance of the sam-ple was measured by using a LCR meter (Model-LCRHiTESTER-3532-50, Hioki) in 100 Hz–1 MHz frequencyrange and in 30–80◦C temperature range. Thermal stabilityof the nanocomposites within the working temperature rangehas been checked and confirmed by using a thermogravime-try analyzer (STA 449F3 Jupiter, Netzsch, Germany).
3. Results and discussion
3.1 Microstructure of ZnO with X-ray diffraction (XRD)
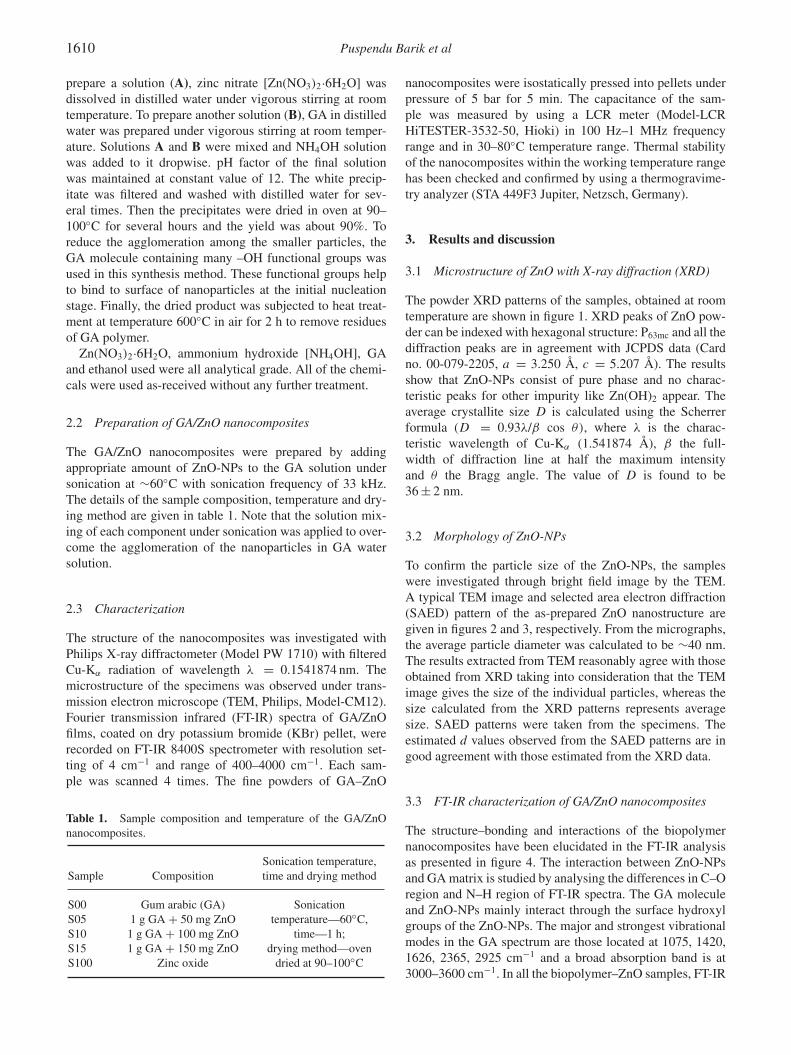
The powder XRD patterns of the samples, obtained at roomtemperature are shown in figure 1. XRD peaks of ZnO pow-der can be indexed with hexagonal structure: P63mc and all thediffraction peaks are in agreement with JCPDS data (Cardno. 00-079-2205, a = 3.250 Å, c = 5.207 Å). The resultsshow that ZnO-NPs consist of pure phase and no charac-teristic peaks for other impurity like Zn(OH)2 appear. Theaverage crystallite size D is calculated using the Scherrerformula (D = 0.93λ/β cos θ), where λ is the charac-teristic wavelength of Cu-Kα (1.541874 Å), β the full-width of diffraction line at half the maximum intensityand θ the Bragg angle. The value of D is found to be36 ± 2 nm.
3.2 Morphology of ZnO-NPs
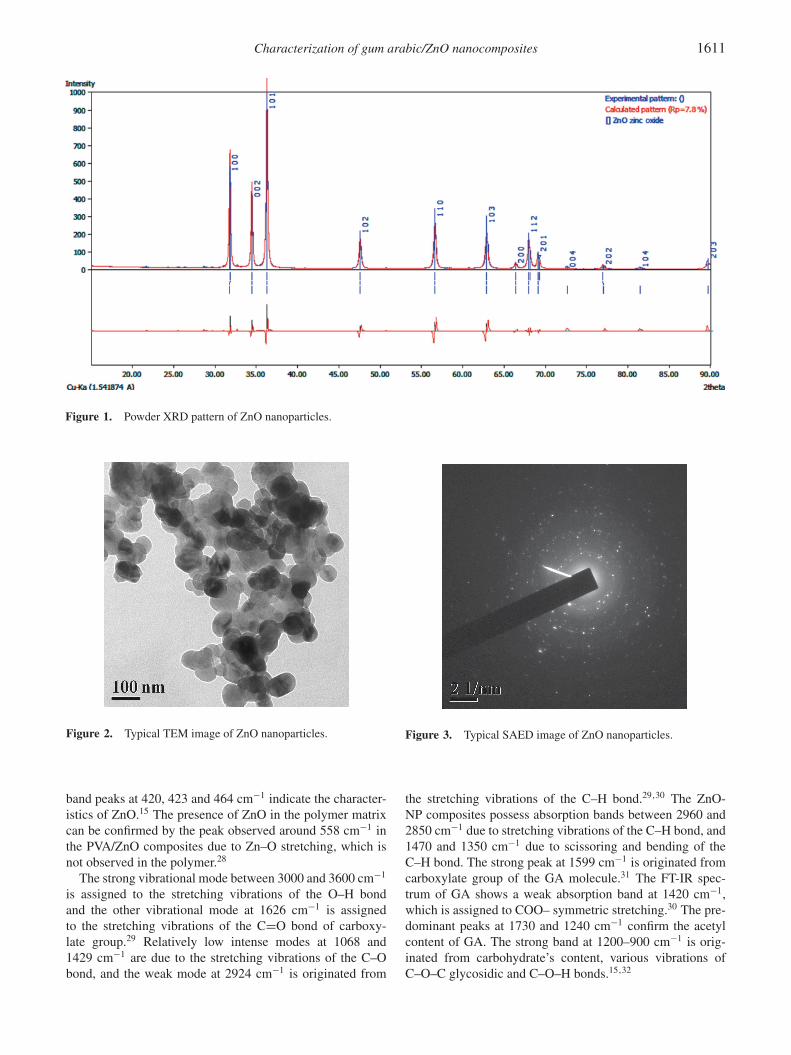
To confirm the particle size of the ZnO-NPs, the sampleswere investigated through bright field image by the TEM.A typical TEM image and selected area electron diffraction(SAED) pattern of the as-prepared ZnO nanostructure aregiven in figures 2 and 3, respectively. From the micrographs,the average particle diameter was calculated to be ∼40 nm.The results extracted from TEM reasonably agree with thoseobtained from XRD taking into consideration that the TEMimage gives the size of the individual particles, whereas thesize calculated from the XRD patterns represents averagesize. SAED patterns were taken from the specimens. Theestimated d values observed from the SAED patterns are ingood agreement with those estimated from the XRD data.
3.3 FT-IR characterization of GA/ZnO nanocomposites
The structure–bonding and interactions of the biopolymernanocomposites have been elucidated in the FT-IR analysisas presented in figure 4. The interaction between ZnO-NPsand GA matrix is studied by analysing the differences in C–Oregion and N–H region of FT-IR spectra. The GA moleculeand ZnO-NPs mainly interact through the surface hydroxylgroups of the ZnO-NPs. The major and strongest vibrationalmodes in the GA spectrum are those located at 1075, 1420,1626, 2365, 2925 cm−1 and a broad absorption band is at3000–3600 cm−1. In all the biopolymer–ZnO samples, FT-IR
Characterization of gum arabic/ZnO nanocomposites 1611
Figure 1. Powder XRD pattern of ZnO nanoparticles.
Figure 2. Typical TEM image of ZnO nanoparticles.
band peaks at 420, 423 and 464 cm−1 indicate the character-istics of ZnO.15 The presence of ZnO in the polymer matrixcan be confirmed by the peak observed around 558 cm−1 inthe PVA/ZnO composites due to Zn–O stretching, which isnot observed in the polymer.28
The strong vibrational mode between 3000 and 3600 cm−1
is assigned to the stretching vibrations of the O–H bondand the other vibrational mode at 1626 cm−1 is assignedto the stretching vibrations of the C=O bond of carboxy-late group.29 Relatively low intense modes at 1068 and1429 cm−1 are due to the stretching vibrations of the C–Obond, and the weak mode at 2924 cm−1 is originated from
Figure 3. Typical SAED image of ZnO nanoparticles.
the stretching vibrations of the C–H bond.29,30 The ZnO-NP composites possess absorption bands between 2960 and2850 cm−1 due to stretching vibrations of the C–H bond, and1470 and 1350 cm−1 due to scissoring and bending of theC–H bond. The strong peak at 1599 cm−1 is originated fromcarboxylate group of the GA molecule.31 The FT-IR spec-trum of GA shows a weak absorption band at 1420 cm−1,which is assigned to COO– symmetric stretching.30 The pre-dominant peaks at 1730 and 1240 cm−1 confirm the acetylcontent of GA. The strong band at 1200–900 cm−1 is orig-inated from carbohydrate’s content, various vibrations ofC–O–C glycosidic and C–O–H bonds.15,32
1612 Puspendu Barik et al
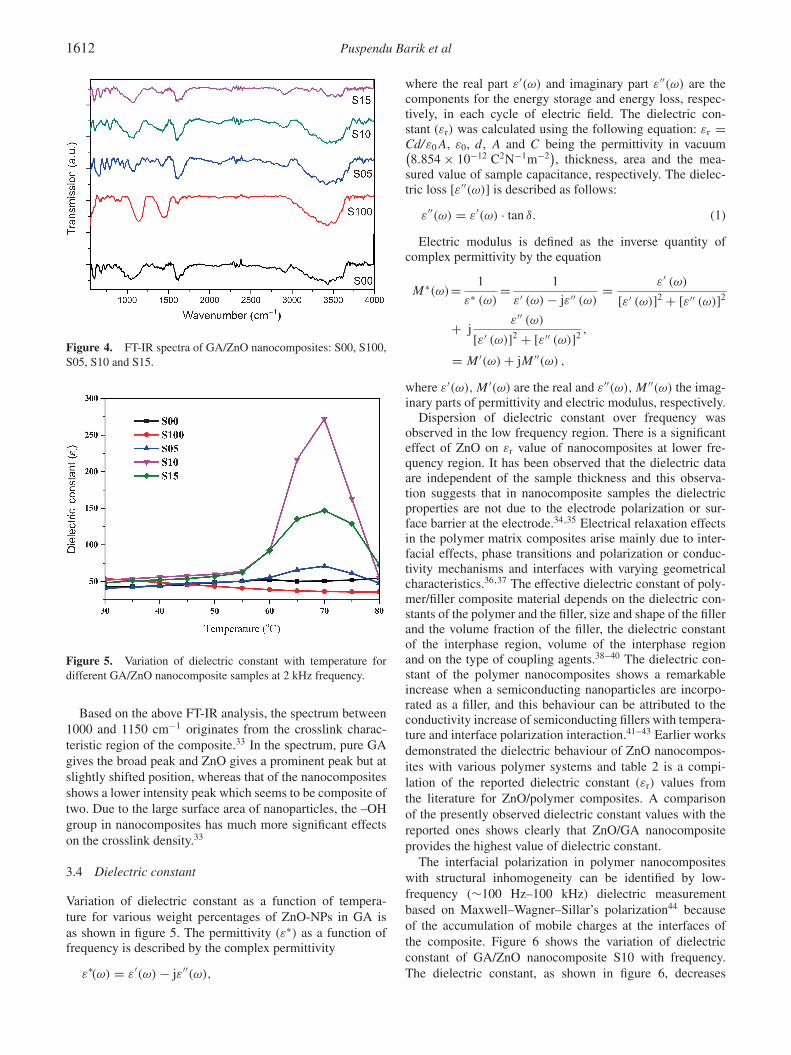
Figure 4. FT-IR spectra of GA/ZnO nanocomposites: S00, S100,S05, S10 and S15.
Figure 5. Variation of dielectric constant with temperature fordifferent GA/ZnO nanocomposite samples at 2 kHz frequency.
Based on the above FT-IR analysis, the spectrum between1000 and 1150 cm−1 originates from the crosslink charac-teristic region of the composite.33 In the spectrum, pure GAgives the broad peak and ZnO gives a prominent peak but atslightly shifted position, whereas that of the nanocompositesshows a lower intensity peak which seems to be composite oftwo. Due to the large surface area of nanoparticles, the –OHgroup in nanocomposites has much more significant effectson the crosslink density.33
3.4 Dielectric constant
Variation of dielectric constant as a function of tempera-ture for various weight percentages of ZnO-NPs in GA isas shown in figure 5. The permittivity (ε∗) as a function offrequency is described by the complex permittivity
ε∗(ω) = ε′(ω) − jε′′(ω),
where the real part ε′(ω) and imaginary part ε′′(ω) are thecomponents for the energy storage and energy loss, respec-tively, in each cycle of electric field. The dielectric con-stant (εr) was calculated using the following equation: εr =
Cd/ε0A, ε0, d, A and C being the permittivity in vacuum(
8.854 × 10⁻¹² C2N−1m−2)
, thickness, area and the mea-sured value of sample capacitance, respectively. The dielec-tric loss [ε′′(ω)] is described as follows:
ε′′(ω) = ε′(ω) · tan δ. (1)
Electric modulus is defined as the inverse quantity ofcomplex permittivity by the equation
M∗(ω)=1
ε∗ (ω)=
1
ε′ (ω) − jε′′ (ω)=
ε′ (ω)
[ε′ (ω)]2 + [ε′′ (ω)]2
+ jε′′ (ω)
[ε′ (ω)]2 + [ε′′ (ω)]2 ,
= M ′(ω) + jM ′′(ω) ,
where ε′(ω),M ′(ω) are the real and ε′′(ω),M ′′(ω) the imag-inary parts of permittivity and electric modulus, respectively.
Dispersion of dielectric constant over frequency wasobserved in the low frequency region. There is a significanteffect of ZnO on εr value of nanocomposites at lower fre-quency region. It has been observed that the dielectric dataare independent of the sample thickness and this observa-tion suggests that in nanocomposite samples the dielectricproperties are not due to the electrode polarization or sur-face barrier at the electrode.34,35 Electrical relaxation effectsin the polymer matrix composites arise mainly due to inter-facial effects, phase transitions and polarization or conduc-tivity mechanisms and interfaces with varying geometricalcharacteristics.36,37 The effective dielectric constant of poly-mer/filler composite material depends on the dielectric con-stants of the polymer and the filler, size and shape of the fillerand the volume fraction of the filler, the dielectric constantof the interphase region, volume of the interphase regionand on the type of coupling agents.38–40 The dielectric con-stant of the polymer nanocomposites shows a remarkableincrease when a semiconducting nanoparticles are incorpo-rated as a filler, and this behaviour can be attributed to theconductivity increase of semiconducting fillers with tempera-ture and interface polarization interaction.41–43 Earlier worksdemonstrated the dielectric behaviour of ZnO nanocompos-ites with various polymer systems and table 2 is a compi-lation of the reported dielectric constant (εr) values fromthe literature for ZnO/polymer composites. A comparisonof the presently observed dielectric constant values with thereported ones shows clearly that ZnO/GA nanocompositeprovides the highest value of dielectric constant.
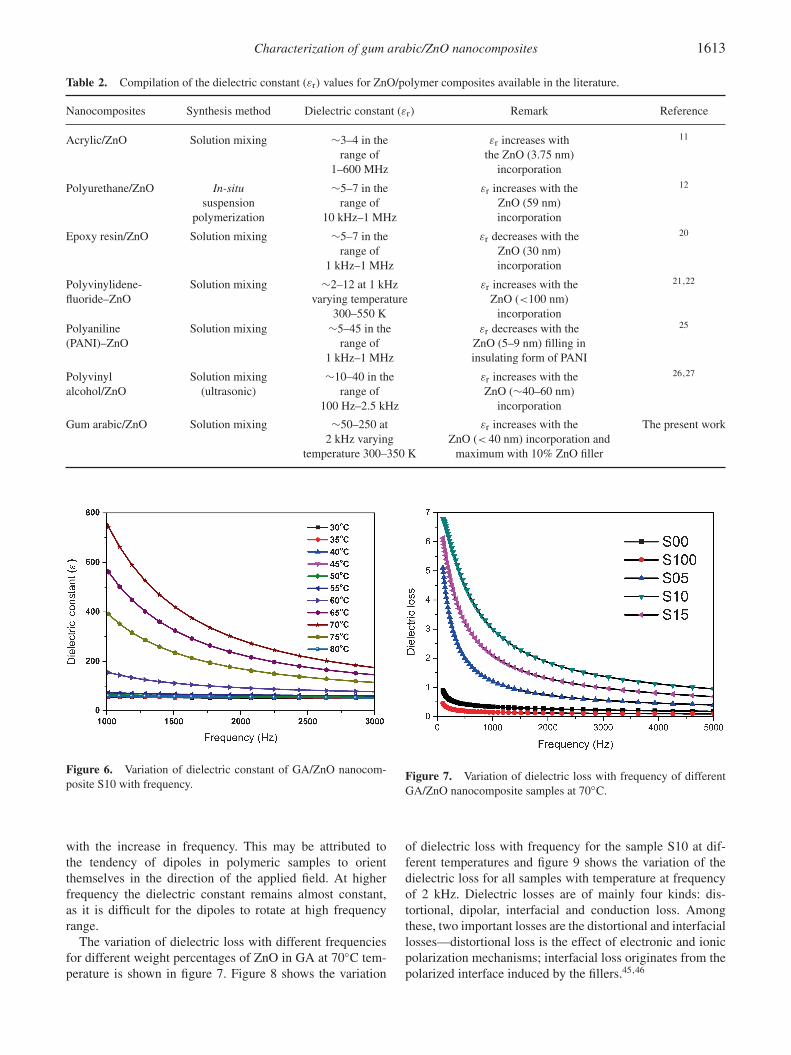
The interfacial polarization in polymer nanocompositeswith structural inhomogeneity can be identified by low-frequency (∼100 Hz–100 kHz) dielectric measurementbased on Maxwell–Wagner–Sillar’s polarization44 becauseof the accumulation of mobile charges at the interfaces ofthe composite. Figure 6 shows the variation of dielectricconstant of GA/ZnO nanocomposite S10 with frequency.The dielectric constant, as shown in figure 6, decreases
Characterization of gum arabic/ZnO nanocomposites 1613
Table 2. Compilation of the dielectric constant (εr) values for ZnO/polymer composites available in the literature.
Nanocomposites Synthesis method Dielectric constant (εr) Remark Reference
Acrylic/ZnO Solution mixing ∼3–4 in the εr increases with 11
range of the ZnO (3.75 nm)1–600 MHz incorporation
Polyurethane/ZnO In-situ ∼5–7 in the εr increases with the 12
suspension range of ZnO (59 nm)polymerization 10 kHz–1 MHz incorporation
Epoxy resin/ZnO Solution mixing ∼5–7 in the εr decreases with the 20
range of ZnO (30 nm)1 kHz–1 MHz incorporation
Polyvinylidene- Solution mixing ∼2–12 at 1 kHz εr increases with the 21,22
fluoride–ZnO varying temperature ZnO (<100 nm)300–550 K incorporation
Polyaniline Solution mixing ∼5–45 in the εr decreases with the 25
(PANI)–ZnO range of ZnO (5–9 nm) filling in1 kHz–1 MHz insulating form of PANI
Polyvinyl Solution mixing ∼10–40 in the εr increases with the 26,27
alcohol/ZnO (ultrasonic) range of ZnO (∼40–60 nm)100 Hz–2.5 kHz incorporation
Gum arabic/ZnO Solution mixing ∼50–250 at εr increases with the The present work2 kHz varying ZnO (< 40 nm) incorporation and
temperature 300–350 K maximum with 10% ZnO filler
Figure 6. Variation of dielectric constant of GA/ZnO nanocom-posite S10 with frequency.
with the increase in frequency. This may be attributed tothe tendency of dipoles in polymeric samples to orientthemselves in the direction of the applied field. At higherfrequency the dielectric constant remains almost constant,as it is difficult for the dipoles to rotate at high frequencyrange.
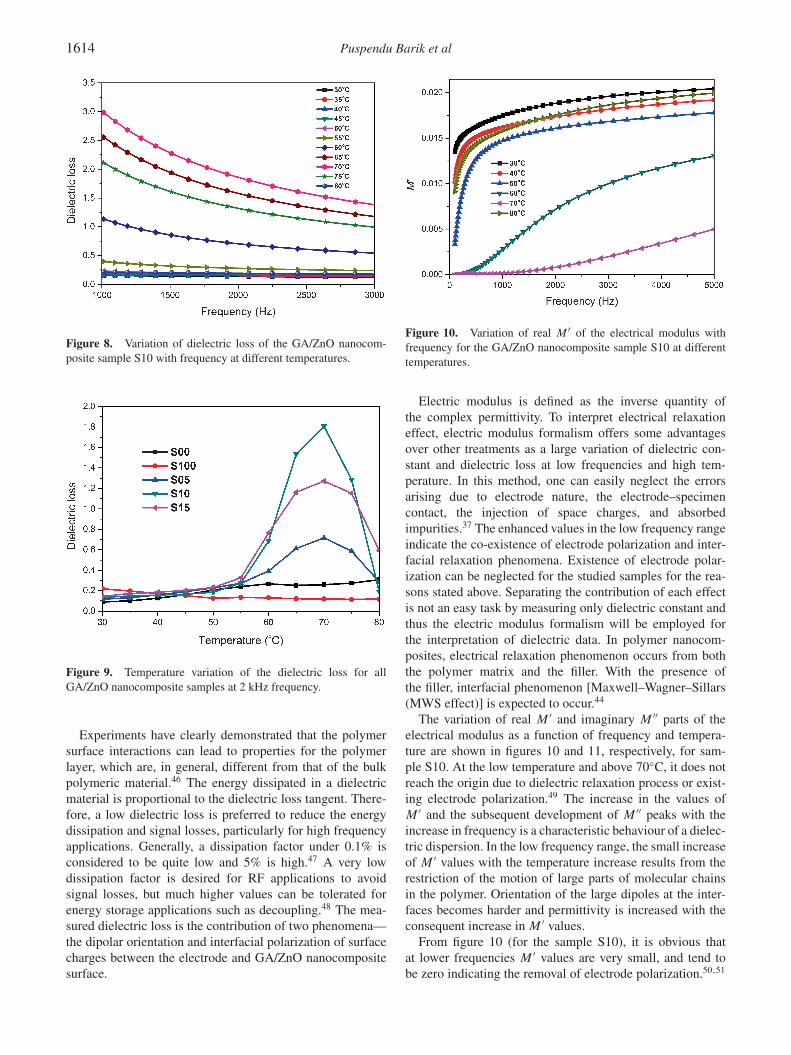
The variation of dielectric loss with different frequenciesfor different weight percentages of ZnO in GA at 70◦C tem-perature is shown in figure 7. Figure 8 shows the variation
Figure 7. Variation of dielectric loss with frequency of differentGA/ZnO nanocomposite samples at 70◦C.
of dielectric loss with frequency for the sample S10 at dif-ferent temperatures and figure 9 shows the variation of thedielectric loss for all samples with temperature at frequencyof 2 kHz. Dielectric losses are of mainly four kinds: dis-tortional, dipolar, interfacial and conduction loss. Amongthese, two important losses are the distortional and interfaciallosses—distortional loss is the effect of electronic and ionicpolarization mechanisms; interfacial loss originates from thepolarized interface induced by the fillers.45,46
1614 Puspendu Barik et al
Figure 8. Variation of dielectric loss of the GA/ZnO nanocom-posite sample S10 with frequency at different temperatures.
Figure 9. Temperature variation of the dielectric loss for allGA/ZnO nanocomposite samples at 2 kHz frequency.
Experiments have clearly demonstrated that the polymersurface interactions can lead to properties for the polymerlayer, which are, in general, different from that of the bulkpolymeric material.46 The energy dissipated in a dielectricmaterial is proportional to the dielectric loss tangent. There-fore, a low dielectric loss is preferred to reduce the energydissipation and signal losses, particularly for high frequencyapplications. Generally, a dissipation factor under 0.1% isconsidered to be quite low and 5% is high.47 A very lowdissipation factor is desired for RF applications to avoidsignal losses, but much higher values can be tolerated forenergy storage applications such as decoupling.48 The mea-sured dielectric loss is the contribution of two phenomena—the dipolar orientation and interfacial polarization of surfacecharges between the electrode and GA/ZnO nanocompositesurface.
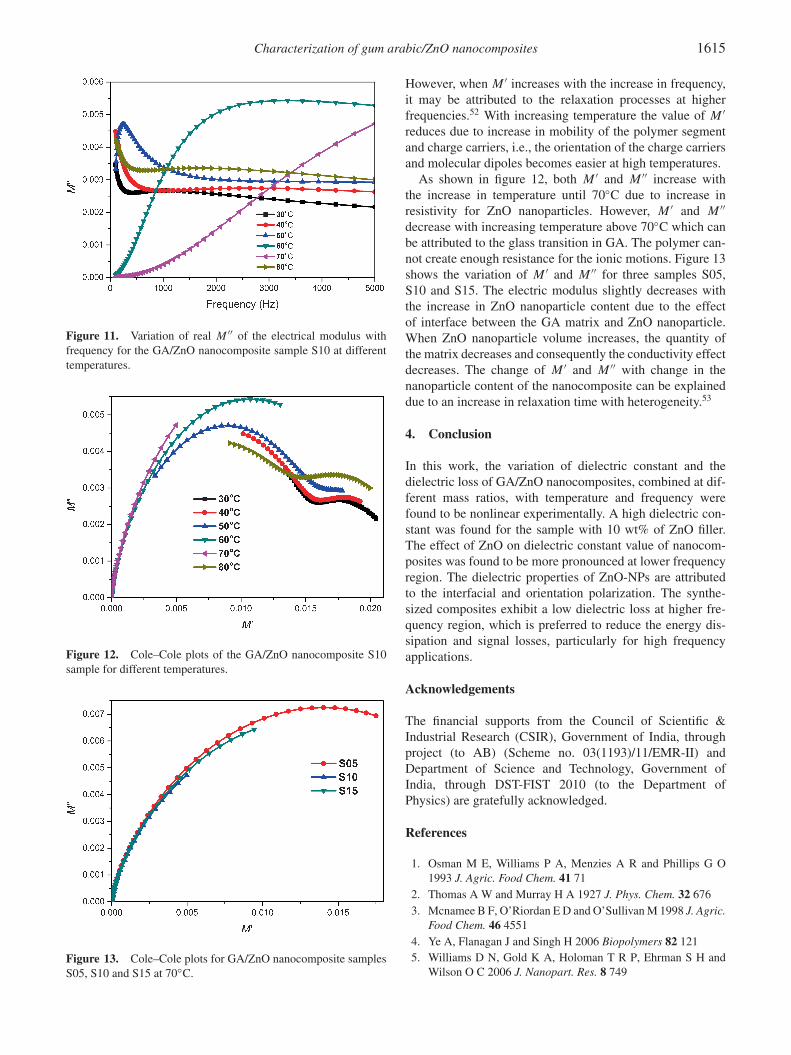
Figure 10. Variation of real M ′ of the electrical modulus withfrequency for the GA/ZnO nanocomposite sample S10 at differenttemperatures.
Electric modulus is defined as the inverse quantity ofthe complex permittivity. To interpret electrical relaxationeffect, electric modulus formalism offers some advantagesover other treatments as a large variation of dielectric con-stant and dielectric loss at low frequencies and high tem-perature. In this method, one can easily neglect the errorsarising due to electrode nature, the electrode–specimencontact, the injection of space charges, and absorbedimpurities.37 The enhanced values in the low frequency rangeindicate the co-existence of electrode polarization and inter-facial relaxation phenomena. Existence of electrode polar-ization can be neglected for the studied samples for the rea-sons stated above. Separating the contribution of each effectis not an easy task by measuring only dielectric constant andthus the electric modulus formalism will be employed forthe interpretation of dielectric data. In polymer nanocom-posites, electrical relaxation phenomenon occurs from boththe polymer matrix and the filler. With the presence ofthe filler, interfacial phenomenon [Maxwell–Wagner–Sillars(MWS effect)] is expected to occur.44
The variation of real M ′ and imaginary M ′′ parts of theelectrical modulus as a function of frequency and tempera-ture are shown in figures 10 and 11, respectively, for sam-ple S10. At the low temperature and above 70◦C, it does notreach the origin due to dielectric relaxation process or exist-ing electrode polarization.49 The increase in the values ofM ′ and the subsequent development of M ′′ peaks with theincrease in frequency is a characteristic behaviour of a dielec-tric dispersion. In the low frequency range, the small increaseof M ′ values with the temperature increase results from therestriction of the motion of large parts of molecular chainsin the polymer. Orientation of the large dipoles at the inter-faces becomes harder and permittivity is increased with theconsequent increase in M ′ values.
From figure 10 (for the sample S10), it is obvious thatat lower frequencies M ′ values are very small, and tend tobe zero indicating the removal of electrode polarization.50,51
Characterization of gum arabic/ZnO nanocomposites 1615
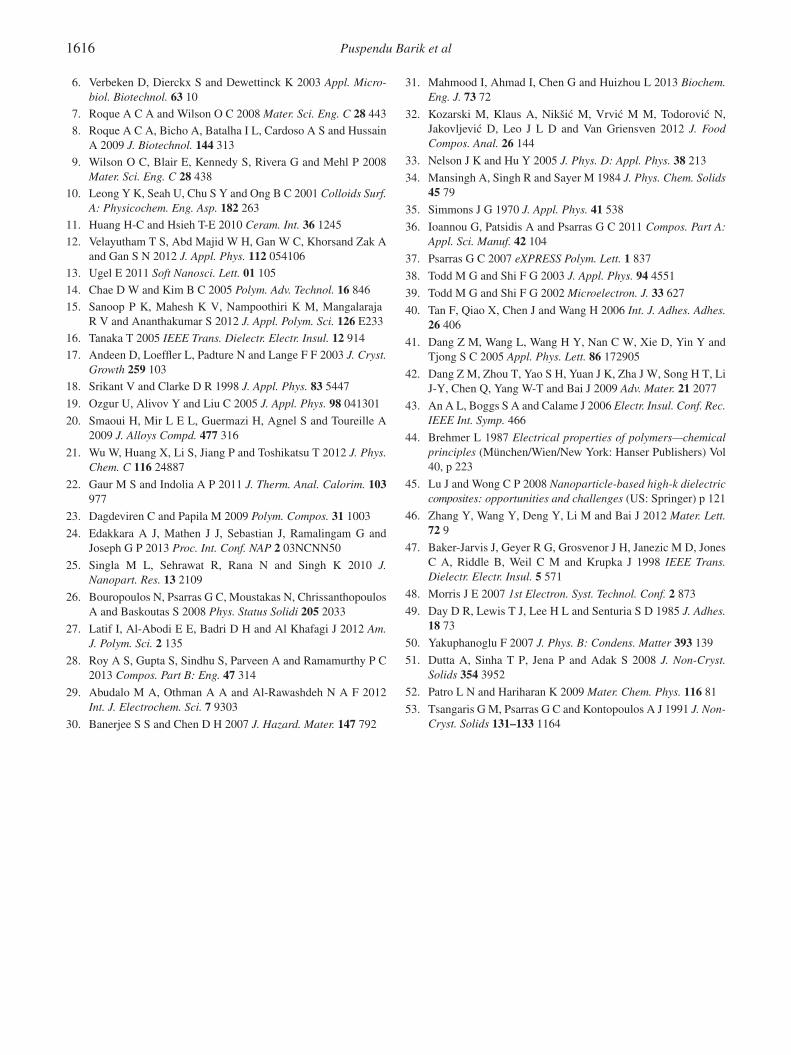
Figure 11. Variation of real M ′′ of the electrical modulus withfrequency for the GA/ZnO nanocomposite sample S10 at differenttemperatures.
Figure 12. Cole–Cole plots of the GA/ZnO nanocomposite S10sample for different temperatures.
Figure 13. Cole–Cole plots for GA/ZnO nanocomposite samplesS05, S10 and S15 at 70◦C.
However, when M ′ increases with the increase in frequency,it may be attributed to the relaxation processes at higherfrequencies.52 With increasing temperature the value of M ′
reduces due to increase in mobility of the polymer segmentand charge carriers, i.e., the orientation of the charge carriersand molecular dipoles becomes easier at high temperatures.
As shown in figure 12, both M ′ and M ′′ increase withthe increase in temperature until 70◦C due to increase inresistivity for ZnO nanoparticles. However, M ′ and M ′′
decrease with increasing temperature above 70◦C which canbe attributed to the glass transition in GA. The polymer can-not create enough resistance for the ionic motions. Figure 13shows the variation of M ′ and M ′′ for three samples S05,S10 and S15. The electric modulus slightly decreases withthe increase in ZnO nanoparticle content due to the effectof interface between the GA matrix and ZnO nanoparticle.When ZnO nanoparticle volume increases, the quantity ofthe matrix decreases and consequently the conductivity effectdecreases. The change of M ′ and M ′′ with change in thenanoparticle content of the nanocomposite can be explaineddue to an increase in relaxation time with heterogeneity.53
4. Conclusion
In this work, the variation of dielectric constant and thedielectric loss of GA/ZnO nanocomposites, combined at dif-ferent mass ratios, with temperature and frequency werefound to be nonlinear experimentally. A high dielectric con-stant was found for the sample with 10 wt% of ZnO filler.The effect of ZnO on dielectric constant value of nanocom-posites was found to be more pronounced at lower frequencyregion. The dielectric properties of ZnO-NPs are attributedto the interfacial and orientation polarization. The synthe-sized composites exhibit a low dielectric loss at higher fre-quency region, which is preferred to reduce the energy dis-sipation and signal losses, particularly for high frequencyapplications.
Acknowledgements
The financial supports from the Council of Scientific &Industrial Research (CSIR), Government of India, throughproject (to AB) (Scheme no. 03(1193)/11/EMR-II) andDepartment of Science and Technology, Government ofIndia, through DST-FIST 2010 (to the Department ofPhysics) are gratefully acknowledged.
References
1. Osman M E, Williams P A, Menzies A R and Phillips G O1993 J. Agric. Food Chem. 41 71
2. Thomas A W and Murray H A 1927 J. Phys. Chem. 32 6763. Mcnamee B F, O’Riordan E D and O’Sullivan M 1998 J. Agric.
Food Chem. 46 45514. Ye A, Flanagan J and Singh H 2006 Biopolymers 82 1215. Williams D N, Gold K A, Holoman T R P, Ehrman S H and
Wilson O C 2006 J. Nanopart. Res. 8 749
1616 Puspendu Barik et al
6. Verbeken D, Dierckx S and Dewettinck K 2003 Appl. Micro-
biol. Biotechnol. 63 10
7. Roque A C A and Wilson O C 2008 Mater. Sci. Eng. C 28 443
8. Roque A C A, Bicho A, Batalha I L, Cardoso A S and HussainA 2009 J. Biotechnol. 144 313
9. Wilson O C, Blair E, Kennedy S, Rivera G and Mehl P 2008Mater. Sci. Eng. C 28 438
10. Leong Y K, Seah U, Chu S Y and Ong B C 2001 Colloids Surf.
A: Physicochem. Eng. Asp. 182 263
11. Huang H-C and Hsieh T-E 2010 Ceram. Int. 36 1245
12. Velayutham T S, Abd Majid W H, Gan W C, Khorsand Zak Aand Gan S N 2012 J. Appl. Phys. 112 054106
13. Ugel E 2011 Soft Nanosci. Lett. 01 105
14. Chae D W and Kim B C 2005 Polym. Adv. Technol. 16 846
15. Sanoop P K, Mahesh K V, Nampoothiri K M, MangalarajaR V and Ananthakumar S 2012 J. Appl. Polym. Sci. 126 E233
16. Tanaka T 2005 IEEE Trans. Dielectr. Electr. Insul. 12 914
17. Andeen D, Loeffler L, Padture N and Lange F F 2003 J. Cryst.
Growth 259 103
18. Srikant V and Clarke D R 1998 J. Appl. Phys. 83 5447
19. Ozgur U, Alivov Y and Liu C 2005 J. Appl. Phys. 98 041301
20. Smaoui H, Mir L E L, Guermazi H, Agnel S and Toureille A2009 J. Alloys Compd. 477 316
21. Wu W, Huang X, Li S, Jiang P and Toshikatsu T 2012 J. Phys.
Chem. C 116 24887
22. Gaur M S and Indolia A P 2011 J. Therm. Anal. Calorim. 103
977
23. Dagdeviren C and Papila M 2009 Polym. Compos. 31 1003
24. Edakkara A J, Mathen J J, Sebastian J, Ramalingam G andJoseph G P 2013 Proc. Int. Conf. NAP 2 03NCNN50
25. Singla M L, Sehrawat R, Rana N and Singh K 2010 J.
Nanopart. Res. 13 2109
26. Bouropoulos N, Psarras G C, Moustakas N, ChrissanthopoulosA and Baskoutas S 2008 Phys. Status Solidi 205 2033
27. Latif I, Al-Abodi E E, Badri D H and Al Khafagi J 2012 Am.
J. Polym. Sci. 2 135
28. Roy A S, Gupta S, Sindhu S, Parveen A and Ramamurthy P C2013 Compos. Part B: Eng. 47 314
29. Abudalo M A, Othman A A and Al-Rawashdeh N A F 2012Int. J. Electrochem. Sci. 7 9303
30. Banerjee S S and Chen D H 2007 J. Hazard. Mater. 147 792
31. Mahmood I, Ahmad I, Chen G and Huizhou L 2013 Biochem.
Eng. J. 73 72
32. Kozarski M, Klaus A, Nikšic M, Vrvic M M, Todorovic N,Jakovljevic D, Leo J L D and Van Griensven 2012 J. Food
Compos. Anal. 26 144
33. Nelson J K and Hu Y 2005 J. Phys. D: Appl. Phys. 38 213
34. Mansingh A, Singh R and Sayer M 1984 J. Phys. Chem. Solids
45 79
35. Simmons J G 1970 J. Appl. Phys. 41 538
36. Ioannou G, Patsidis A and Psarras G C 2011 Compos. Part A:
Appl. Sci. Manuf. 42 104
37. Psarras G C 2007 eXPRESS Polym. Lett. 1 837
38. Todd M G and Shi F G 2003 J. Appl. Phys. 94 4551
39. Todd M G and Shi F G 2002 Microelectron. J. 33 627
40. Tan F, Qiao X, Chen J and Wang H 2006 Int. J. Adhes. Adhes.
26 406
41. Dang Z M, Wang L, Wang H Y, Nan C W, Xie D, Yin Y andTjong S C 2005 Appl. Phys. Lett. 86 172905
42. Dang Z M, Zhou T, Yao S H, Yuan J K, Zha J W, Song H T, LiJ-Y, Chen Q, Yang W-T and Bai J 2009 Adv. Mater. 21 2077
43. An A L, Boggs S A and Calame J 2006 Electr. Insul. Conf. Rec.
IEEE Int. Symp. 466
44. Brehmer L 1987 Electrical properties of polymers—chemical
principles (München/Wien/New York: Hanser Publishers) Vol40, p 223
45. Lu J and Wong C P 2008 Nanoparticle-based high-k dielectric
composites: opportunities and challenges (US: Springer) p 121
46. Zhang Y, Wang Y, Deng Y, Li M and Bai J 2012 Mater. Lett.
72 9
47. Baker-Jarvis J, Geyer R G, Grosvenor J H, Janezic M D, JonesC A, Riddle B, Weil C M and Krupka J 1998 IEEE Trans.
Dielectr. Electr. Insul. 5 571
48. Morris J E 2007 1st Electron. Syst. Technol. Conf. 2 873
49. Day D R, Lewis T J, Lee H L and Senturia S D 1985 J. Adhes.
18 73
50. Yakuphanoglu F 2007 J. Phys. B: Condens. Matter 393 139
51. Dutta A, Sinha T P, Jena P and Adak S 2008 J. Non-Cryst.
Solids 354 3952
52. Patro L N and Hariharan K 2009 Mater. Chem. Phys. 116 81
53. Tsangaris G M, Psarras G C and Kontopoulos A J 1991 J. Non-
Cryst. Solids 131–133 1164