Embed Size (px)
Citation preview
Journal of Babylon University/Engineering Sciences/ No.(4)/ Vol.(25): 2017
1339
Preparation and Mechanical Characterization of Cu-Al2O3 Functionally Graded Material for electrical
contact applications Abdul Raheem. K. Abid Ali
Materials Engineering College, University of Babylon
Roaa Hatem Kadhim Dept. of Metallurgical Eng., College of Material's Eng. /University of Babylon
Abstract In this study, five-layered stepwise Cu/Al2O3 as functionally graded materials have been prepared
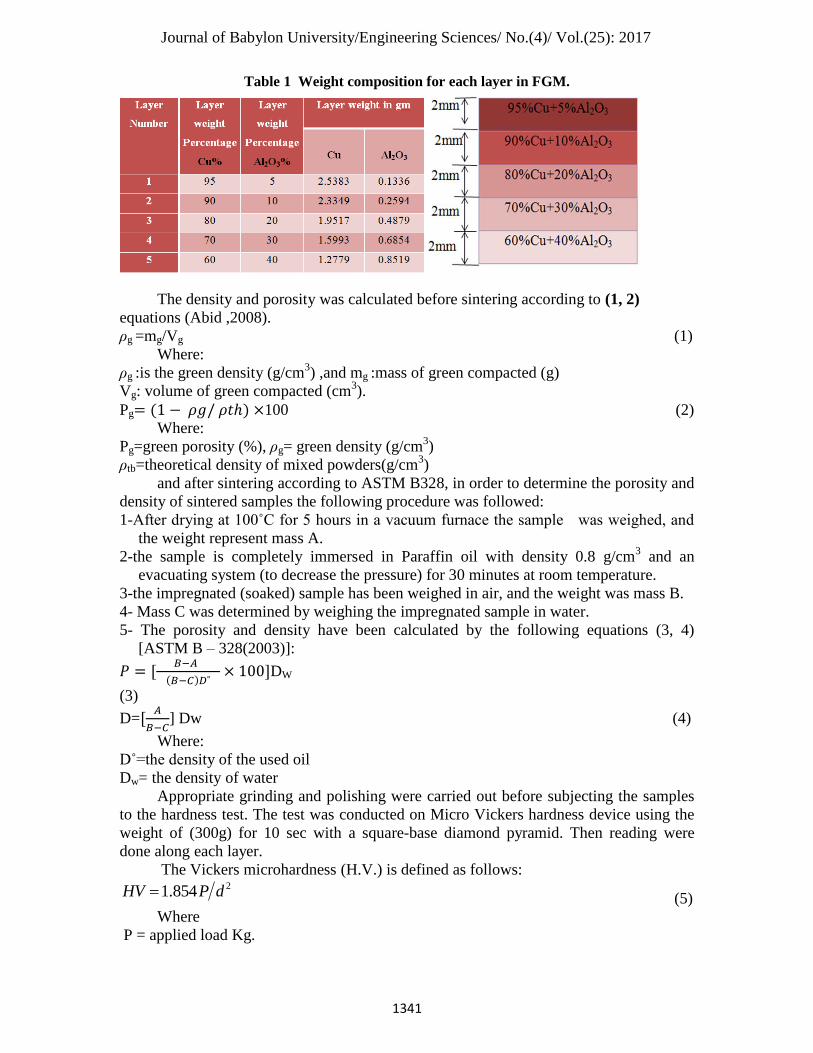
from copper powder with with five percentage of alumina powder as (5 ,10 ,20 ,30 and 40 Wt%) by using
powder metallurgy technique. Mixing of copper (34.32 µm) and alumina (1.439 µm) powders for two hours
and then several disk sample with dimensions (14mm diameter and 10 thickness) have been compacting at
different compacting stresses (550, 650 and 750 MPa). However, sintering of specimens for three hours at
850 under vacuum about has been achieved. The Porosity and density before and after
sintering have been calculated. X-ray diffraction analysis showed that tests before and after sintering is
similar, there is no new phase formed after sintering. Scanning electron microscopy technique is used to
characterize the surface of each layer. Hardness test showed slight linear graded microhardness across the
layers without any obvious jumps throughout the thickness. Pin on disc method have been used in
determining the wear or material removal of prepared FGM samples. In addition, it was examined thermal conductivity and the electrical resistance have been done in preparing samples from composite and functionally graded material. From the experimental results, it is clear that hardness results change in each
layer by producing FGM according to the percentage of the harder constituent (i.e. Al2O3) from 53 to 113
Hv. While Thermal conductivity decrease with the increasing addition weight percentage for α-Al2O3. And Electrical resistance increased when alumina content increased for (5% to 40%). Wear rate improved
with the increasing additive percentage of alumina from 0.507 for layer 1 to 0.15 for layer five at
15N and 25 min. Smoothly gradual change of the composition in the Cu/Al2O3 FGM can eliminate the
microscopic interface, such as a result as that traditional Cu-Al2O3 joint. Keywords: Cu/Al2O3, functionally graded materials, powder metallurgy technique , Material
characterization of FGM.
الخالصة
[5, 10, 20, 30 and 40 wt%]
[550, 650 and 750 MPa]14mm
10mm850C◦3hr
MPa056
Cu/Al2O3 FGM
Cu/Al2O3
Journal of Babylon University/Engineering Sciences/ No.(4)/ Vol.(25): 2017
1340
Introduction Many structural components encounter severe conditions and, so, need material
performance that changes with location within the component. For example, the body of a gear
must be strong, while its surface should be solid and wear resistant, and the body of a turbine
blade should be strong, tough and creep-resistant, while on the other hand its outer surface should
be refractory and oxidation-resistant (Ghafil, 2011).
It is well known that abrupt transitions in materials composition and features within a
component often result in sharp local concentrations of stress, whether the stress is applied
internally or externally. Another known this is that these stress concentrations are greatly
lessened if the transition from one material to the other is made gradually (Maricel ,2011).
Functionally Graded Material (FGM) belongs to a class of advanced material characterized
by variation in properties as the dimension varies. The overall properties of FMG are unique and
different from any of the individual material that forms it (Mahmoud et.al.,2012).
FGM is frequently a mixture of two particular material phases: e.g. Ceramic and metal
with the variation of the volume fraction (Tran et.al., 2014). Because of contrasts of thermal and
mechanical properties in ceramics and metals, residual stresses develop in regions near the
ceramic-metal interfaces during the manufacturing and under thermal and mechanical loading in
service. These stresses influence the performance and the lifetime of the ceramic-metal bonded
systems and can lead to breaking within ceramic, plastic distortion accompanied by the formation
and growth of voids in metal and: or ceramic metal decoration(Grujicic et.al., 1998).
From literature review, it is observed, two types of functionally graded materials FGMs
were studied. The first type was metal/metal FGM, such as Steel/Al, Al/Si (Nemat-Alla1 et.al.,
2011; Zhongtao and Tingju 2008). The second type was metal/ceramic FGM, such as Al/SiC and
Al2O3/Ti, Cu/Al2O3, Cu/Nbc, Al/Al2O3 ( Kumar1 and Chandrappa ,2014; Abdulamer ,2012;
Strojny-Nędza and Agata ,2016; Shiri et.al.,2015;Sanuddin,2012). the aim of this type was to
increase the wear resistance and hardness, in addition, donʼ t cracking or failure under thermal
stresses when functionally graded materials FGMs were used instead of welding.
In this study, an attempt is made to prepare five-layers functionally graded Cu/Al2O3 with
gradient of Al2O3 from 5, 10, 20, 30 and 40 wt.% by using powder metallurgy technique.
Furthermore, different parameters have been studied such as: α- Al2O3 weight percentage,
Different compacting pressure, Dry sliding wear parameters.
Experimental Part In this work, elemental powders of copper and alumina used to prepare the
functionally graded Cu/Al2O3 with gradient of Al2O3 from 5, 10, 20, 30 and 40 wt.% By using
powder metallurgy technique. Mixing of copper (34.32 µm) and alumina (1.439 µm) powders for
two hours and then several disk sample with dimensions (14mm diameter and 10 thickness)
have been compacting at different compacting stresses (550, 650 and 750 Mpa). However,
sintering of specimens for three hours at 850 under vacuum about has been achieved.
The samples surface subsequently ground, polished and then characterize with scanning
electron microscopy. Compositions for each layer of elemental powders used in this study
have been shown in the Table 1.
Journal of Babylon University/Engineering Sciences/ No.(4)/ Vol.(25): 2017
1341
Table 1 Weight composition for each layer in FGM.
The density and porosity was calculated before sintering according to (1, 2)
equations (Abid ,2008).
ρg =mg/Vg (1)
Where:
ρg :is the green density (g/cm3) ,and mg :mass of green compacted (g)
Vg: volume of green compacted (cm3).
Pg 100 (2)
Where:
Pg=green porosity (%), ρg= green density (g/cm3)
ρtb=theoretical density of mixed powders(g/cm3)
and after sintering according to ASTM B328, in order to determine the porosity and
density of sintered samples the following procedure was followed:
1-After drying at 100˚C for 5 hours in a vacuum furnace the sample was weighed, and
the weight represent mass A.
2-the sample is completely immersed in Paraffin oil with density 0.8 g/cm3 and an
evacuating system (to decrease the pressure) for 30 minutes at room temperature.
3-the impregnated (soaked) sample has been weighed in air, and the weight was mass B.
4- Mass C was determined by weighing the impregnated sample in water.
5- The porosity and density have been calculated by the following equations (3, 4)
[ASTM B – 328(2003)]:
DW
(3)
D=
] Dw (4)
Where:
D˚=the density of the used oil
Dw= the density of water
Appropriate grinding and polishing were carried out before subjecting the samples
to the hardness test. The test was conducted on Micro Vickers hardness device using the
weight of (300g) for 10 sec with a square-base diamond pyramid. Then reading were
done along each layer.
The Vickers microhardness (H.V.) is defined as follows: 2854.1 dPHV (5)
Where
P = applied load Kg.
Journal of Babylon University/Engineering Sciences/ No.(4)/ Vol.(25): 2017
1342
d = average length of the diagonal mm2.
Pin on disk concept was used to study dry sliding wear, The specimen to be tested
was set as a pin against a rotating steel disc at a radius of 5mm. The rotating speed of the
disc was fixed at 300 rpm, while the loads were (5N, 10N, 15N). The sample is weighted
after (5, 10, 15, 20, and 25) min to determine the dry sliding wear rate according to
equation (6). The test method has been covered according to [ASTM G 99-04”].
Volume loss (𝑐 3) = weight loss (g) / ρ (g/ 𝑐 3) (6)
Where: 𝛥 𝑤: Weight lost = weight before the test – weight after the test.
samples of 14mm in diameter that prepared by powder metallurgy are used
to show the effect of additive percentage on the electrical resistance. The
measurement method depended on Ohm’s law from the equation (7) to calculate
the electrical resistance.
σ=1/ρ………..……… (7)
thermal conductivity was conducted by using a thermal system which
includes two disks of copper. The sample was placed within the upper heating
disk. It was placed between the two copper disks. Then the required temperature
degree was selected as (100ºC) to measure the thermal conductivity coefficient
then, the reading results, that represent the voltage of the upper and lower copper
disks in both cases; cooling and heating, were recorded. Heat transfer by
conduction shown in this equation:
The thermal conductivity coefficient was determined based on the
equation below.
(
) (9)
K: thermal conductivity coefficient (w/m.k).
m: mass of copper plate (0.824 kg).
C: specific heat capacity of copper plate is 3.805*10^2 (kj/kg.k).
hp, Rp: thickness and radius of copper plate are 7.01mm, 32.5mm respectively.
Rв: radius of specimen is 8mm.
v1, v2: voltage of thermocouple 1,2 at heating.
Δv: difference in voltage at cooling.
Δt: difference in time in cooling
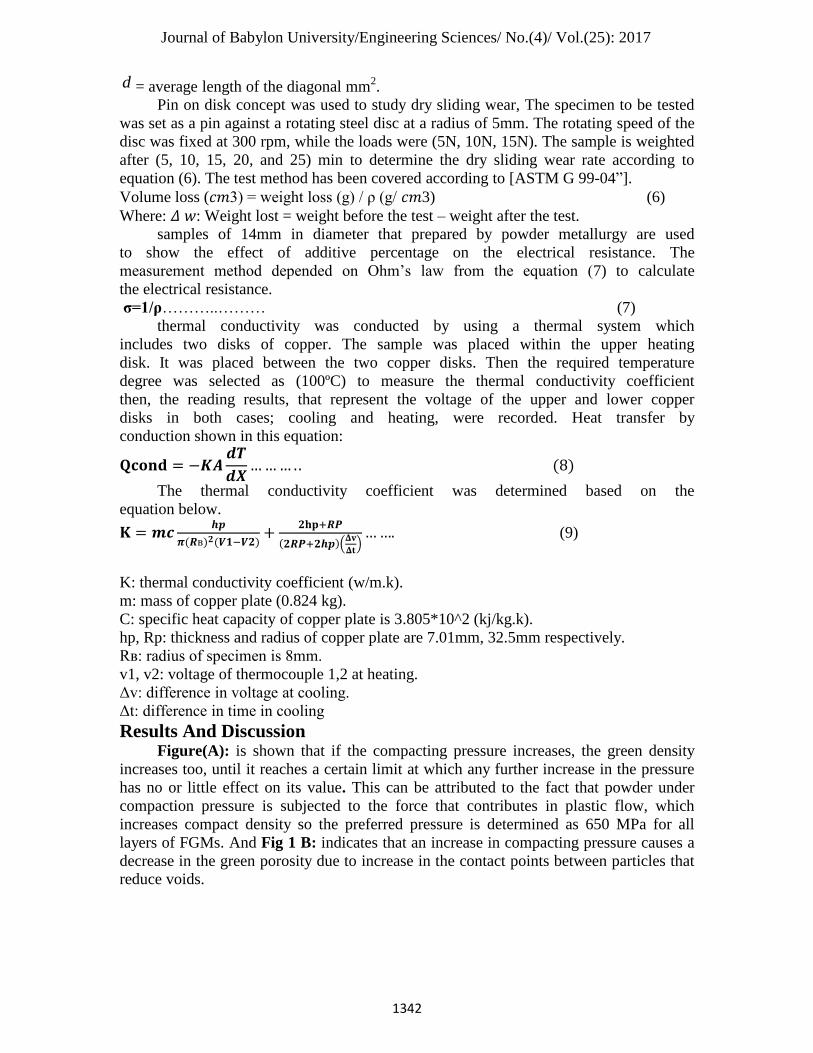
Results And Discussion Figure(A): is shown that if the compacting pressure increases, the green density
increases too, until it reaches a certain limit at which any further increase in the pressure
has no or little effect on its value. This can be attributed to the fact that powder under
compaction pressure is subjected to the force that contributes in plastic flow, which
increases compact density so the preferred pressure is determined as 650 MPa for all
layers of FGMs. And Fig 1 B: indicates that an increase in compacting pressure causes a
decrease in the green porosity due to increase in the contact points between particles that
reduce voids.
Journal of Babylon University/Engineering Sciences/ No.(4)/ Vol.(25): 2017
1343
A B
Fig. 1: A: Green density of FGMs compacts as a function of compacting pressure. B:
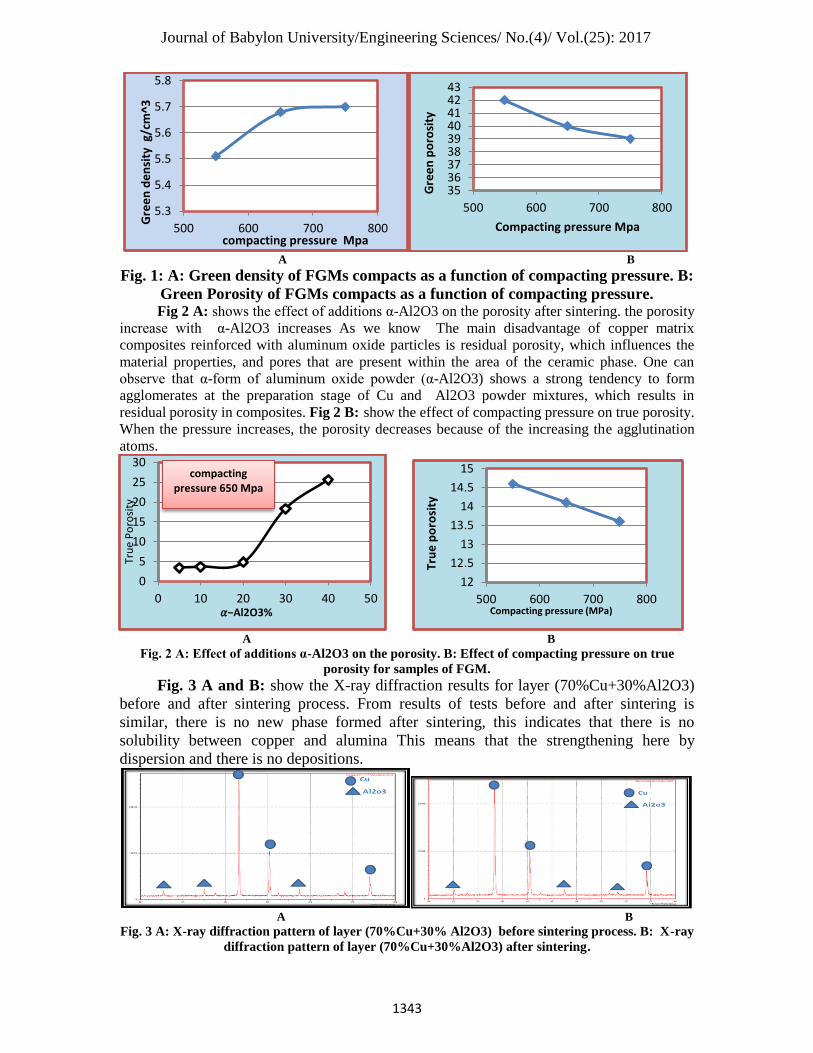
Green Porosity of FGMs compacts as a function of compacting pressure. Fig 2 A: shows the effect of additions α-Al2O3 on the porosity after sintering. the porosity
increase with α-Al2O3 increases As we know The main disadvantage of copper matrix
composites reinforced with aluminum oxide particles is residual porosity, which influences the
material properties, and pores that are present within the area of the ceramic phase. One can
observe that α-form of aluminum oxide powder (α-Al2O3) shows a strong tendency to form
agglomerates at the preparation stage of Cu and Al2O3 powder mixtures, which results in
residual porosity in composites. Fig 2 B: show the effect of compacting pressure on true porosity.
When the pressure increases, the porosity decreases because of the increasing the agglutination
atoms.
A B
Fig. 2 A: Effect of additions α-Al2O3 on the porosity. B: Effect of compacting pressure on true
porosity for samples of FGM.
Fig. 3 A and B: show the X-ray diffraction results for layer (70%Cu+30%Al2O3)
before and after sintering process. From results of tests before and after sintering is
similar, there is no new phase formed after sintering, this indicates that there is no
solubility between copper and alumina This means that the strengthening here by
dispersion and there is no depositions.
A B Fig. 3 A: X-ray diffraction pattern of layer (70%Cu+30% Al2O3) before sintering process. B: X-ray
diffraction pattern of layer (70%Cu+30%Al2O3) after sintering.
5.3
5.4
5.5
5.6
5.7
5.8
500 600 700 800
Gre
en
de
nsi
ty g
/cm
^3
compacting pressure Mpa
353637383940414243
500 600 700 800
Gre
en
po
rosi
ty
Compacting pressure Mpa
0
5
10
15
20
25
30
0 10 20 30 40 50
Tru
e P
oro
sity
compacting pressure 650 Mpa
𝛼−Al2O3%
12
12.5
13
13.5
14
14.5
15
500 600 700 800Compacting pressure (MPa)
Tru
e p
oro
sity
Journal of Babylon University/Engineering Sciences/ No.(4)/ Vol.(25): 2017
1344
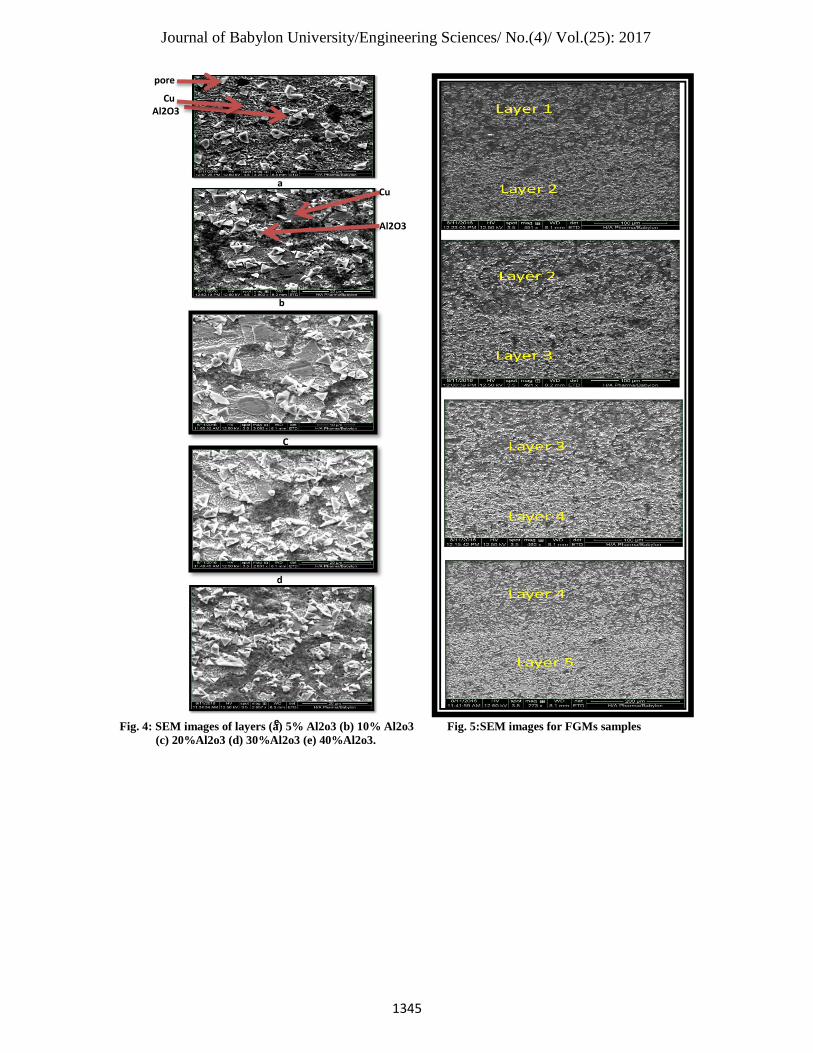
Fig. 4, and Fig 5: show the SEM images for Layers each one individually and
FGMs sample using a compacting pressure of 650 Mpa with different magnifications.
From these images it is seen that the distribution and existence of additive particle and
pores through the sample surface. Note that additive particle distributed uniformly in the
copper matrix, Through the SEM test for functionally graded sample as shown in Fig.5
seen that the existence of a gradation clear for layers within the sample functionally
graded, and also the presence of the overlap between the layers, this is proof of the
gradation properties.
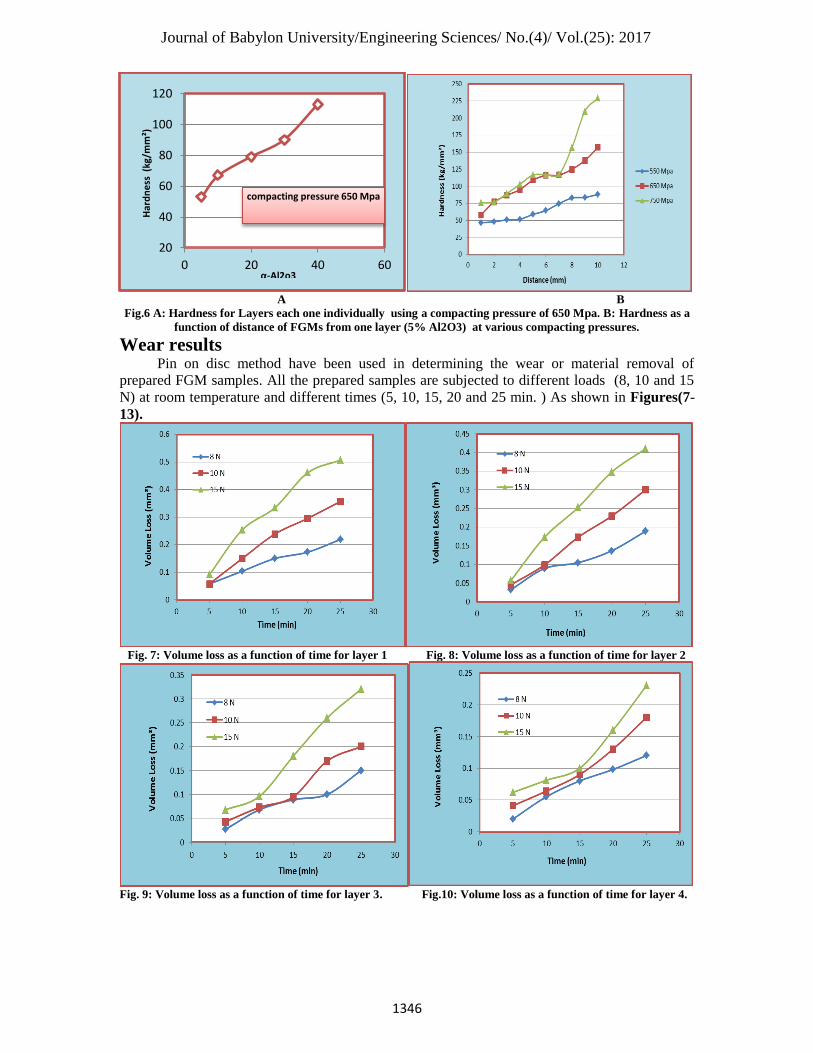
Hardness results The results show that the hardness increases with the increasing the adding
percentage because of the added material particles (α-Al2O3) work to obstruct and prevent
the movement of dislocations on the sliding planes and due to the fact that the rise in
additive content make the ability of the indenture of the hardness tester to hit additive
particles increase and the additive particles has high hardness compared with copper
hardness. This result has been corresponding with (Li Yu et.al.,2009).
Fig. 6 A: shows the measured hardness for layers (Cu-Al2O3 composite) at
compacting pressure 650 MPa, and Fig.6 B: for FGMs sample using various values of
compacting pressure. Figure (4.14) shows Vickers microhardness in each layer was
measured at 1mm interval from the first to fifth layer. The interface between each layer
was monitored carefully in this work. All samples generally show an interesting graded
microhardness across the thickness. Dependent on the microstructure of those samples,
material properties vary with position within the gradient and can be used to tailor
functionality. Removing the sharp interface by an interlayer compositional gradient.
However, residual stresses still develop at the new heterogeneous interfaces introduced
by the composite compositional gradient.
It is realized that when the compacting pressure increases the hardness increases.
Increasing pressure works on minimizing the pores and increases the density of the
sample and leads to increase of the hardness.
Journal of Babylon University/Engineering Sciences/ No.(4)/ Vol.(25): 2017
1345
Fig. 4: SEM images of layers (a) 5% Al2o3 (b) 10% Al2o3 Fig. 5:SEM images for FGMs samples
(c) 20%Al2o3 (d) 30%Al2o3 (e) 40%Al2o3.
a
b
Al2O3
Cu
Cu
pores
Al2O3
C
d
e
Journal of Babylon University/Engineering Sciences/ No.(4)/ Vol.(25): 2017
1346
A B
Fig.6 A: Hardness for Layers each one individually using a compacting pressure of 650 Mpa. B: Hardness as a
function of distance of FGMs from one layer (5% Al2O3) at various compacting pressures.
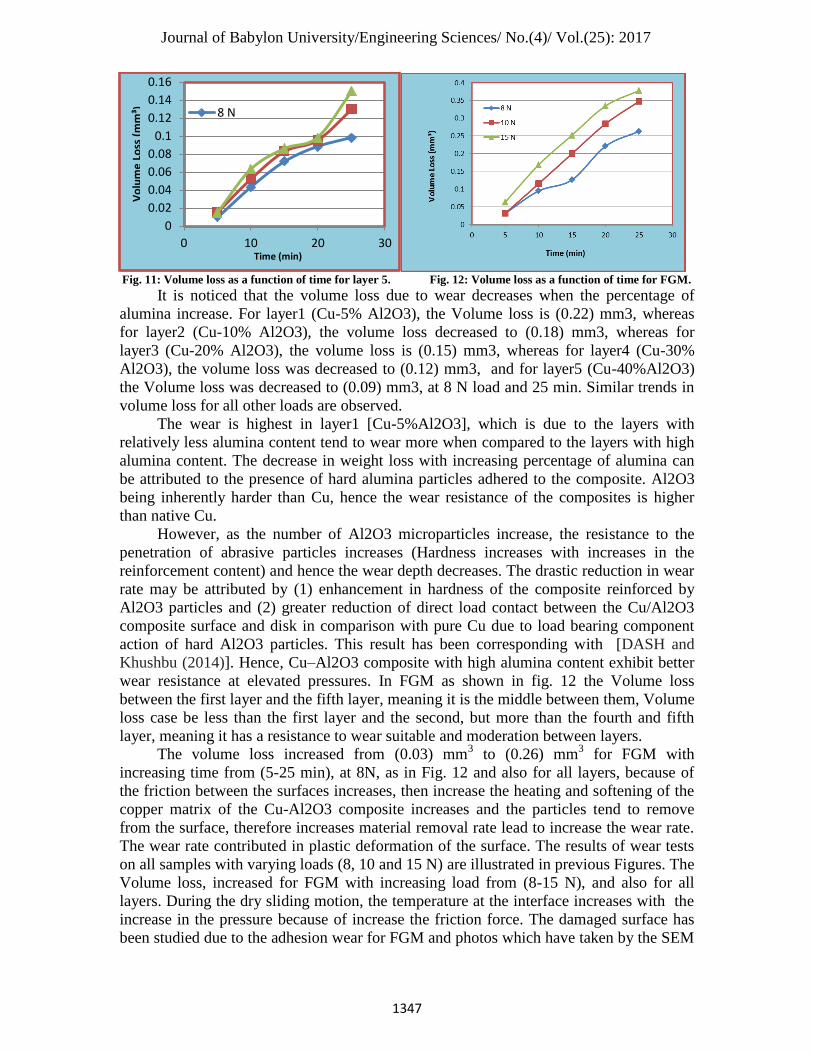
Wear results Pin on disc method have been used in determining the wear or material removal of
prepared FGM samples. All the prepared samples are subjected to different loads (8, 10 and 15
N) at room temperature and different times (5, 10, 15, 20 and 25 min. ) As shown in Figures(7-
13).
Fig. 7: Volume loss as a function of time for layer 1 Fig. 8: Volume loss as a function of time for layer 2
Fig. 9: Volume loss as a function of time for layer 3. Fig.10: Volume loss as a function of time for layer 4.
20
40
60
80
100
120
0 20 40 60
compacting pressure 650 Mpa
α-Al2o3
Har
dn
ess
(kg
/mm
²)
Journal of Babylon University/Engineering Sciences/ No.(4)/ Vol.(25): 2017
1347
Fig. 11: Volume loss as a function of time for layer 5. Fig. 12: Volume loss as a function of time for FGM.
It is noticed that the volume loss due to wear decreases when the percentage of
alumina increase. For layer1 (Cu-5% Al2O3), the Volume loss is (0.22) mm3, whereas
for layer2 (Cu-10% Al2O3), the volume loss decreased to (0.18) mm3, whereas for
layer3 (Cu-20% Al2O3), the volume loss is (0.15) mm3, whereas for layer4 (Cu-30%
Al2O3), the volume loss was decreased to (0.12) mm3, and for layer5 (Cu-40%Al2O3)
the Volume loss was decreased to (0.09) mm3, at 8 N load and 25 min. Similar trends in
volume loss for all other loads are observed.
The wear is highest in layer1 [Cu-5%Al2O3], which is due to the layers with
relatively less alumina content tend to wear more when compared to the layers with high
alumina content. The decrease in weight loss with increasing percentage of alumina can
be attributed to the presence of hard alumina particles adhered to the composite. Al2O3
being inherently harder than Cu, hence the wear resistance of the composites is higher
than native Cu.
However, as the number of Al2O3 microparticles increase, the resistance to the
penetration of abrasive particles increases (Hardness increases with increases in the
reinforcement content) and hence the wear depth decreases. The drastic reduction in wear
rate may be attributed by (1) enhancement in hardness of the composite reinforced by
Al2O3 particles and (2) greater reduction of direct load contact between the Cu/Al2O3
composite surface and disk in comparison with pure Cu due to load bearing component
action of hard Al2O3 particles. This result has been corresponding with [DASH and
Khushbu (2014)]. Hence, Cu–Al2O3 composite with high alumina content exhibit better
wear resistance at elevated pressures. In FGM as shown in fig. 12 the Volume loss
between the first layer and the fifth layer, meaning it is the middle between them, Volume
loss case be less than the first layer and the second, but more than the fourth and fifth
layer, meaning it has a resistance to wear suitable and moderation between layers.
The volume loss increased from (0.03) mm3 to (0.26) mm
3 for FGM with
increasing time from (5-25 min), at 8N, as in Fig. 12 and also for all layers, because of
the friction between the surfaces increases, then increase the heating and softening of the
copper matrix of the Cu-Al2O3 composite increases and the particles tend to remove
from the surface, therefore increases material removal rate lead to increase the wear rate.
The wear rate contributed in plastic deformation of the surface. The results of wear tests
on all samples with varying loads (8, 10 and 15 N) are illustrated in previous Figures. The
Volume loss, increased for FGM with increasing load from (8-15 N), and also for all
layers. During the dry sliding motion, the temperature at the interface increases with the
increase in the pressure because of increase the friction force. The damaged surface has
been studied due to the adhesion wear for FGM and photos which have taken by the SEM
0
0.02
0.04
0.06
0.08
0.1
0.12
0.14
0.16
0 10 20 30
8 N
Vo
lum
e L
oss
(m
m³)
Time (min)
Journal of Babylon University/Engineering Sciences/ No.(4)/ Vol.(25): 2017
1348
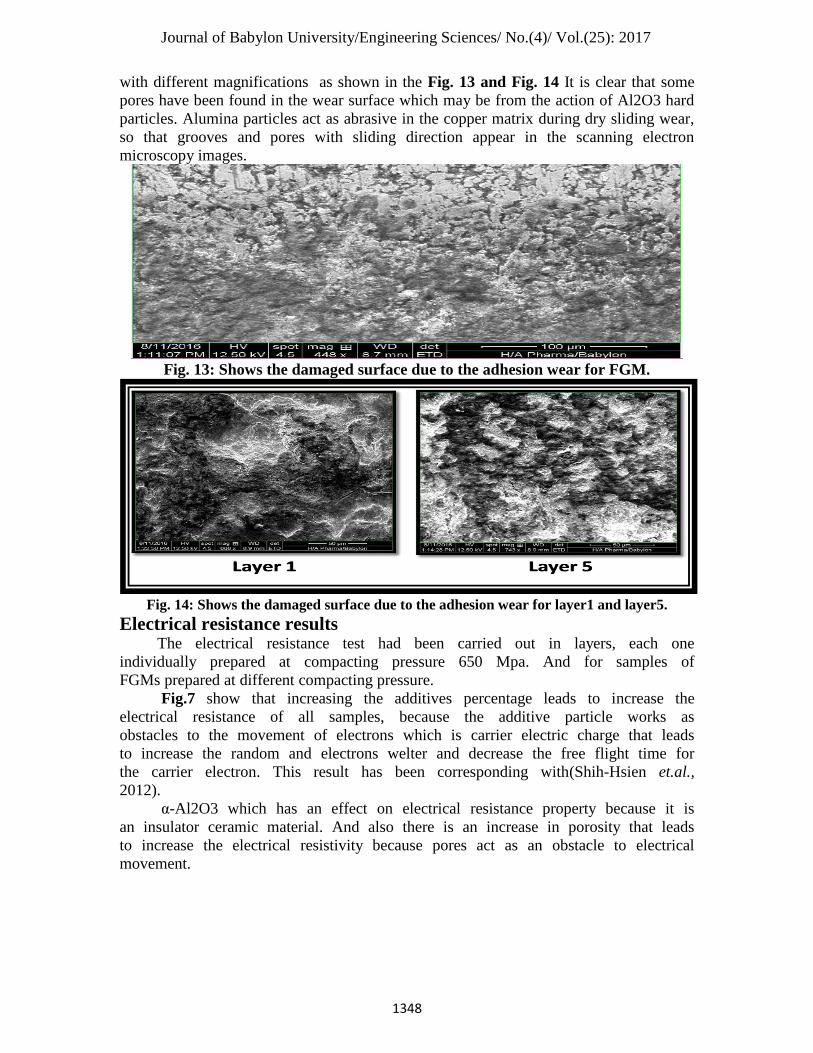
with different magnifications as shown in the Fig. 13 and Fig. 14 It is clear that some
pores have been found in the wear surface which may be from the action of Al2O3 hard
particles. Alumina particles act as abrasive in the copper matrix during dry sliding wear,
so that grooves and pores with sliding direction appear in the scanning electron
microscopy images.
Fig. 13: Shows the damaged surface due to the adhesion wear for FGM.
Fig. 14: Shows the damaged surface due to the adhesion wear for layer1 and layer5.
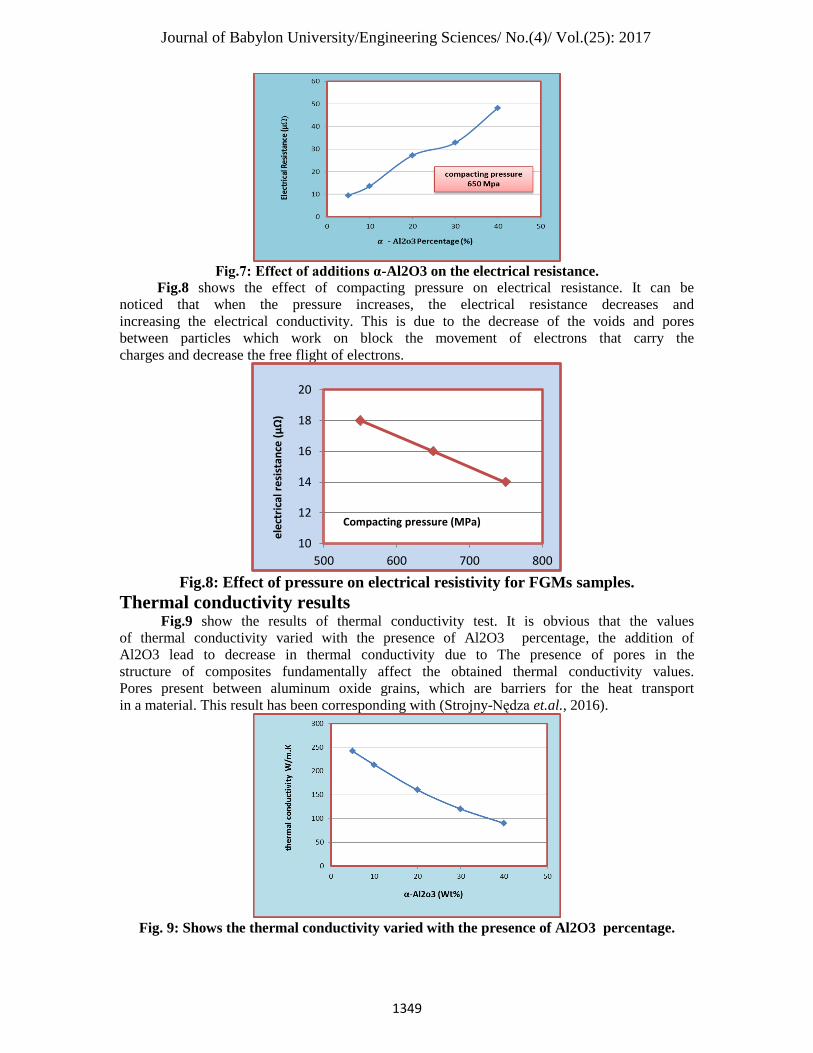
Electrical resistance results The electrical resistance test had been carried out in layers, each one
individually prepared at compacting pressure 650 Mpa. And for samples of
FGMs prepared at different compacting pressure.
Fig.7 show that increasing the additives percentage leads to increase the
electrical resistance of all samples, because the additive particle works as
obstacles to the movement of electrons which is carrier electric charge that leads
to increase the random and electrons welter and decrease the free flight time for
the carrier electron. This result has been corresponding with(Shih-Hsien et.al.,
2012).
α-Al2O3 which has an effect on electrical resistance property because it is
an insulator ceramic material. And also there is an increase in porosity that leads
to increase the electrical resistivity because pores act as an obstacle to electrical
movement.
Journal of Babylon University/Engineering Sciences/ No.(4)/ Vol.(25): 2017
1349
Fig.7: Effect of additions α-Al2O3 on the electrical resistance.
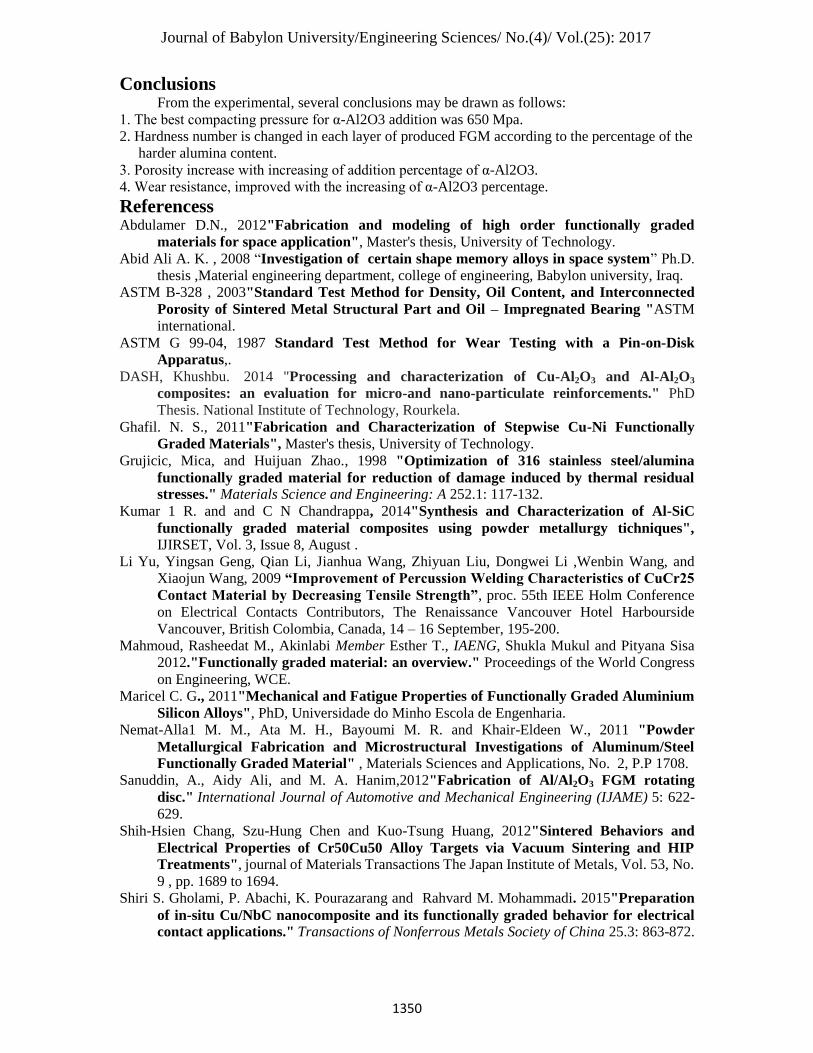
Fig.8 shows the effect of compacting pressure on electrical resistance. It can be
noticed that when the pressure increases, the electrical resistance decreases and
increasing the electrical conductivity. This is due to the decrease of the voids and pores
between particles which work on block the movement of electrons that carry the
charges and decrease the free flight of electrons.
Fig.8: Effect of pressure on electrical resistivity for FGMs samples.
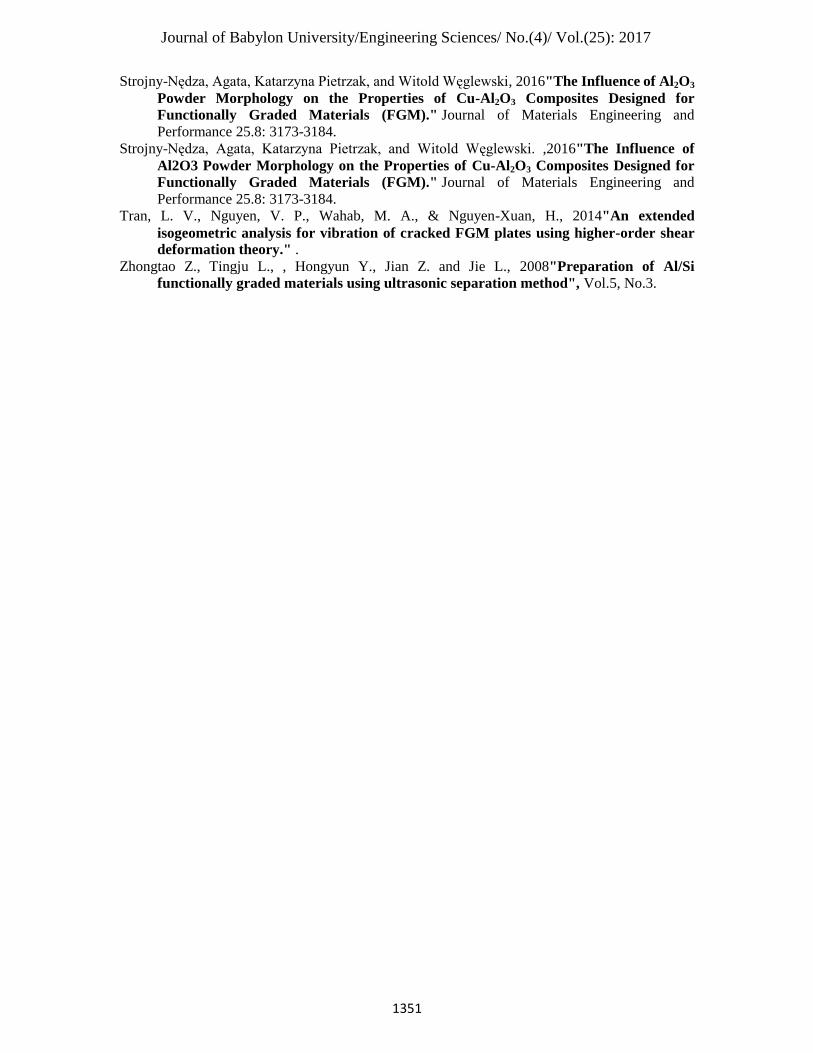
Thermal conductivity results Fig.9 show the results of thermal conductivity test. It is obvious that the values
of thermal conductivity varied with the presence of Al2O3 percentage, the addition of
Al2O3 lead to decrease in thermal conductivity due to The presence of pores in the
structure of composites fundamentally affect the obtained thermal conductivity values.
Pores present between aluminum oxide grains, which are barriers for the heat transport
in a material. This result has been corresponding with (Strojny-Nędza et.al., 2016).
Fig. 9: Shows the thermal conductivity varied with the presence of Al2O3 percentage.
10
12
14
16
18
20
500 600 700 800
Compacting pressure (MPa)
ele
ctri
cal r
esi
stan
ce (
μΩ
)
Journal of Babylon University/Engineering Sciences/ No.(4)/ Vol.(25): 2017
1350
Conclusions From the experimental, several conclusions may be drawn as follows:
1. The best compacting pressure for α-Al2O3 addition was 650 Mpa.
2. Hardness number is changed in each layer of produced FGM according to the percentage of the
harder alumina content.
3. Porosity increase with increasing of addition percentage of α-Al2O3.
4. Wear resistance, improved with the increasing of α-Al2O3 percentage.
Referencess Abdulamer D.N., 2012"Fabrication and modeling of high order functionally graded
materials for space application", Master's thesis, University of Technology.
Abid Ali A. K. , 2008 “Investigation of certain shape memory alloys in space system” Ph.D.
thesis ,Material engineering department, college of engineering, Babylon university, Iraq.
ASTM B-328 , 2003"Standard Test Method for Density, Oil Content, and Interconnected
Porosity of Sintered Metal Structural Part and Oil – Impregnated Bearing "ASTM
international.
ASTM G 99-04, 1987 Standard Test Method for Wear Testing with a Pin-on-Disk
Apparatus,.
DASH, Khushbu. 2014 "Processing and characterization of Cu-Al2O3 and Al-Al2O3
composites: an evaluation for micro-and nano-particulate reinforcements." PhD
Thesis. National Institute of Technology, Rourkela.
Ghafil. N. S., 2011"Fabrication and Characterization of Stepwise Cu-Ni Functionally
Graded Materials", Master's thesis, University of Technology.
Grujicic, Mica, and Huijuan Zhao., 1998 "Optimization of 316 stainless steel/alumina
functionally graded material for reduction of damage induced by thermal residual
stresses." Materials Science and Engineering: A 252.1: 117-132.
Kumar 1 R. and and C N Chandrappa, 2014"Synthesis and Characterization of Al-SiC
functionally graded material composites using powder metallurgy tichniques",
IJIRSET, Vol. 3, Issue 8, August .
Li Yu, Yingsan Geng, Qian Li, Jianhua Wang, Zhiyuan Liu, Dongwei Li ,Wenbin Wang, and
Xiaojun Wang, 2009 “Improvement of Percussion Welding Characteristics of CuCr25
Contact Material by Decreasing Tensile Strength”, proc. 55th IEEE Holm Conference
on Electrical Contacts Contributors, The Renaissance Vancouver Hotel Harbourside
Vancouver, British Colombia, Canada, 14 – 16 September, 195-200.
Mahmoud, Rasheedat M., Akinlabi Member Esther T., IAENG, Shukla Mukul and Pityana Sisa
2012."Functionally graded material: an overview." Proceedings of the World Congress
on Engineering, WCE.
Maricel C. G., 2011"Mechanical and Fatigue Properties of Functionally Graded Aluminium
Silicon Alloys", PhD, Universidade do Minho Escola de Engenharia.
Nemat-Alla1 M. M., Ata M. H., Bayoumi M. R. and Khair-Eldeen W., 2011 "Powder
Metallurgical Fabrication and Microstructural Investigations of Aluminum/Steel
Functionally Graded Material" , Materials Sciences and Applications, No. 2, P.P 1708.
Sanuddin, A., Aidy Ali, and M. A. Hanim,2012"Fabrication of Al/Al2O3 FGM rotating
disc." International Journal of Automotive and Mechanical Engineering (IJAME) 5: 622-
629.
Shih-Hsien Chang, Szu-Hung Chen and Kuo-Tsung Huang, 2012"Sintered Behaviors and
Electrical Properties of Cr50Cu50 Alloy Targets via Vacuum Sintering and HIP
Treatments", journal of Materials Transactions The Japan Institute of Metals, Vol. 53, No.
9 , pp. 1689 to 1694.
Shiri S. Gholami, P. Abachi, K. Pourazarang and Rahvard M. Mohammadi. 2015"Preparation
of in-situ Cu/NbC nanocomposite and its functionally graded behavior for electrical
contact applications." Transactions of Nonferrous Metals Society of China 25.3: 863-872.
Journal of Babylon University/Engineering Sciences/ No.(4)/ Vol.(25): 2017
1351
Strojny-Nędza, Agata, Katarzyna Pietrzak, and Witold Węglewski, 2016"The Influence of Al2O3
Powder Morphology on the Properties of Cu-Al2O3 Composites Designed for
Functionally Graded Materials (FGM)." Journal of Materials Engineering and
Performance 25.8: 3173-3184.
Strojny-Nędza, Agata, Katarzyna Pietrzak, and Witold Węglewski. ,2016"The Influence of
Al2O3 Powder Morphology on the Properties of Cu-Al2O3 Composites Designed for
Functionally Graded Materials (FGM)." Journal of Materials Engineering and
Performance 25.8: 3173-3184.
Tran, L. V., Nguyen, V. P., Wahab, M. A., & Nguyen-Xuan, H., 2014"An extended
isogeometric analysis for vibration of cracked FGM plates using higher-order shear
deformation theory." .
Zhongtao Z., Tingju L., , Hongyun Y., Jian Z. and Jie L., 2008"Preparation of Al/Si
functionally graded materials using ultrasonic separation method", Vol.5, No.3.


![Preparation and Characterization of Cu-Zn ferrites by ......[11] Jadhav S.A, Structural and magnetic properties of Zn substituted Li-Cu ferrites, Materials Chemistry and Physics, 65,](https://img.pdfslide.us/doc/110x75/60b16c8dee3ee35e092a229c/preparation-and-characterization-of-cu-zn-ferrites-by-11-jadhav-sa-structural.jpg)