Embed Size (px)
Citation preview

Premier VisionApril 2017

Contents
Tax Free Trends
Summary 03
Tax Free Sales Trends 05
Feature: 2017 Evidences a Resurgence
in Tourism to Italy 07
Tax Free Sales by Destination and Source 08
Top 5 Visitor Nations per Destination Country 10
Currency Trends 12
Arrivals Forecast
Europe Overview 14
France 15
United Kingdom 16
Italy 17
Spain 18
Germany 19
Singapore 20
Premier Tax Free | 02 Premier Vision April 2017

Top 5 Destination Markets Top 5 Source Markets
Tax Free Sales Turnover
Tax Free Sales Turnover
Vouchers/ Transaction
Vouchers/ Transaction
Avg. Transaction Values (ATV)
Avg. Transaction Values (ATV)
Arrivals Arrivals
FRA CHN
GBR RUS
ITA
HKGESP
USA
DEU TWN
+7%
+36%
+31%
+18%
-1%
+37%
+23%
+16%
+32%
+12%
-3%
+33%
+33%
+8%
-1%
+24%
+9%
+44%
+22%
+13%
+11%
+3%
-1%
+10%
+0%
+10%
+14%
-19%
+9%
-0%
+19%
+18%
+13%
+27%
-9%
+2%
+19%
+23%
+28%
+0%
Premier Vision April 2017 Premier Tax Free | 03
Shopping & Arrivals Growth Summary – April 2017
+17%Total Sales
+15%Total Vouchers
+2%Total ATV
+13%Total Arrivals

Premier Tax Free | 04 Premier Vision April 2017
Shopping & Arrivals Growth Summary – Year to Date
Top 5 Destination Markets Top 5 Source Markets
Tax Free Sales Turnover
Tax Free Sales Turnover
Vouchers/ Transaction
Vouchers/ Transaction
Avg. Transaction Values (ATV)
Avg. Transaction Values (ATV)
Arrivals Arrivals
FRA CHN
GBR
ITA
HKGESP
DEU TWN
+19%
+34%
+27%
+20%
+5%
+31%
+12%
+28%
+64%
+53%
+2%
+29%
+29%
+10%
+1%
+23%
+40%
+16%
+29%
+42%
+16%
+4%
-2%
+9%
+4%
+7%
-20%
+11%
+27%
+8%
+15%
+13%
+9%
+19%
+2%
+14%
+15%
+11%
+19%
+4%
+20%Total Sales
+15%Total Vouchers
+5%Total ATV
+12%Total Arrivals
RUS
USA

Overview
Tax Free Shopping sales continued to see strong gains
in April, albeit at a marginally lower pace than seen since
the start of 2017, with sales of growth 17% comparing
to the 20% increase in sales seen throughout the first
quarter of 2017. Whilst the transaction growth of 15%
was comparable to rates of growth seen in Q1 of 2017,
the 2% increase in Average Transaction Values was
modestly lower than the 6% growth in the first quarter.
On year to date basis, sales have increased by 20%,
and with the exception of Germany, the most prominent
European destinations have all experienced double-
digit gains. Italy has continued to see a strong rebound
in 2017, with 27% growth on a year to date basis: see
featured article on page 7 for more details.
Premier Vision April 2017
Tax Free Sales: Overview & Source Market Trends – April 2017
Chinese tourist spend evidences highest rate of growth in Europe since July 2015
Growth in spend of 37% by Chinese tourists in April,
not only surpassed the rates of growth seen in the first
quarter of 2017, but also represented the highest gains
seen since Jul-15.
The inhibiting factors that affected Chinese tourism to
European destinations in 2016, such as biometrics and
safety concerns, have to a degree dissipated in 2017 and
since unleashed a new wave of tourism and spending by
these tourists. With the exception of Germany, the main
European destinations continued their resurgence, with
alternative destinations continuing to gain popularity,
with gains of 60% in April.
Whilst a proportion of tourists will likely have diverted
travel intentions amid hostilities with South Korea,
a recent report by BNP Paribas highlights the price
differential of luxury goods, serving as a reminder as to
why Bain & Co. once labelled Europe, “the world’s largest
in-season outlet”. The report highlights that luxury goods
in China cost about 21% more than the global average,
whilst in France and Italy they cost about 22% less,
predominantly due to Chinese taxes and duties, foreign
exchange rates, and distribution costs for brands in China.
June arrival numbers for end of Ramadan to provide early summer boost for retailers
The timing of the end of Ramadan celebrations on
24th June this year, versus 5th July in 2016, is forecast
to provide a significant boost to arrival numbers in
June, with a 45% increase in tourists from the Gulf
Co-Operation Council (GCC) nations.
Relative to other tax free shopping nationalities, sales
to these tourists have seen a relatively modest increase
of 5% in the first four months of 2017, as despite
the recovery in oil prices, the economies of these
nations continue to adjust to cuts in expenditure, and
investments to diversify the drivers of these economies
away from the dependence on oil, resulting in relatively
tepid economic growth.
However, the summer of 2017 is set to evidence an early
boost for the main European destination markets, with
70%+ gains predicted in tourists from Saudi Arabia and
Kuwait, whilst Qatari and Emirati tourists are predicted
to see gains of 41% and 24%, respectively. All major
European destinations are set to benefit from these
increases, and as the most popular destination choices,
France and the UK are predicted to see gains of 46%
and 42%, respectively.
Premier Tax Free | 05

UK resilient post Westminster attack, France attack provides a moderate setback
Following the Westminster attack in March, the UK
defied the aversion for travel and tourism to terror hit
destinations, where concerns for safety continue to be
usurped by the price arbitrage opportunity presented by
the devaluation of Sterling. This is further underscored
by the predicted double-digit gains in arrival numbers
expected in May and June, moderately tempered by
projected gains of 9% in July 2017.
Conversely, the attack on the Champs Elysees on 20th
April, amid already heightened security ahead of the
Presidential elections, provided a moderate setback to
sales in France in April with growth of 7%, following the
20%+ gains seen in the first quarter of 2017.
Whilst the short term outlook for arrivals in May and June
have been moderated to gains of 6% and 7%, respectively,
this nevertheless points to a resilience in the continued
recovery for travel and tourism to France, which will likely
be further aided by both the ending and outcome of the
Presidential elections, pointing to a period of relative
stability. Furthermore, early indications suggest that
whilst sales on the Champs-Elysees were immediately
impacted, the following week saw a strong rebound.
Premier Vision April 2017
Russian tourism rebound gathers pace despite Average Transaction Value (ATV) declines
Sales to Russian tourists experienced growth of 16%
in April, despite a 44% increase in transactions in
the month, with this rate of growth in transactions
having now been sustained for the last three
consecutive months.
This distortion between sales and transaction growth
was a result of a 20% decline in Average Transaction
Values by these tourists, predominantly attributable
to declines in France, but also seen across a number
of destination markets, however the prominence
of this destination is highlighted by the fact that
excluding France, sales to Russian tourists saw
growth of 36% in April.
Tax Free Sales: Destination Market Trends – April 2017
The first quarter of 2017 saw the Russian economy
officially exit the recessionary period it had occupied
for the previous two years, and whilst the economy is
predicted to continue to recover, the rate of growth is
expected to be modest. Nevertheless, coupled with the
current rate of growth in Tax Free shopping transactions,
continued expansion of the Russian economy will likely
continue to increase the purchasing power
of these tourists throughout 2017.

Following significant gains in arrival numbers in 2015, partly attributable to the Expo Milano, and therefore due to the inherently strong growth compares, arrivals to Italy in 2016 saw a modest decline.
Consequently, whilst arrivals to Italy in 2017 have
evidenced strong gains, Tax Free Shopping sales have
seen a disproportionately higher increase in sales,
with increasing numbers of Chinese and Russian
tourists opting to travel to Italy, resulting in the 31%
growth in sales in April 2017 representing the highest
gains since Sep-15.
Feature: 2017 Evidences a Resurgence in Tourism to Italy
The 16% increase in Chinese tourist arrivals to Italy
in April 2017 was not only commensurate with a 57%
increase in sales to these tourists, but also represented
the highest rate of growth of these tourists among the
main European destination markets in April. Furthermore,
as one of the first destinations to witness a resurgence in
Russian tourist spend in 2016, and with Italy representing
the second most important destination for these tourists
for Tax Free shopping, it has also benefitted from a 44%
increase in sales to these tourists on a year to date
basis. The current outlook suggests the rate of growth in
Chinese tourist arrivals will be moderately lower from May
through to July, however arrivals of Russian, American
Taiwanese and Japanese arrivals are all predicted to
experience double-digit gains.
Premier Vision April 2017 Premier Tax Free | 07
MILAN
VENICE
FLORENCE
ROME
45%8%
12%
22%
YOY Growth for Main Cities (2017 YTD)
Sales Market Share(2017 YTD)
YOY Sales Growth(2017 YTD)
28%
27%
23%
12%
ROME
MILAN
FLORENCE
VENICE
Top Source MarketsSales Market share by City (2017 YTD)
29%
14%
7%
6%
3%
3%
3%
2%
2%
2%
39%
44%
31%
21%
11%
35%
-9%
-10%
69%
-1%
CHN
RUS
JPN
THA
HKG
IDN
UAE
USA
TWN
KOR

By Destination By Source Market
7.0%
36.3%
31.4%
18.3%
-1.1%
-4.7%
21.7%
38.1%
41.9%
58.2%
37.2%
23.2%
16.1%
32.4%
12.3%
29.3%
2.2%
12.0%
36.8%
12.5%
FRA
GBR
ITA
ESP
SGP
DEU
AUT
PRT
CZE
IRL
Premier Vision April 2017 Premier Tax Free | 08
Sales Performance – April 2017
CHN
USA
THA
TWN
UAE
KOR
SAU
IDN
HKG
RUS

By Destination By Source Market
18.7%
34.3%
26.6%
20.2%
-8.5%
4.9%
20.5%
44.9%
38.2%
34.4%
31.0%
12.3%
28.1%
63.8%
53.1%
14.9%
15.1%
15.1%
21.8%
12.5%
FRA CHN
GBR RUS
ITA
ESP
SGP TWN
DEU
AUT UAE
PRT
CZE
IRL KUW
HKG
USA
Premier Vision April 2017 Premier Tax Free | 09
Sales Performance – Year to Date
KOR
THA
IDN
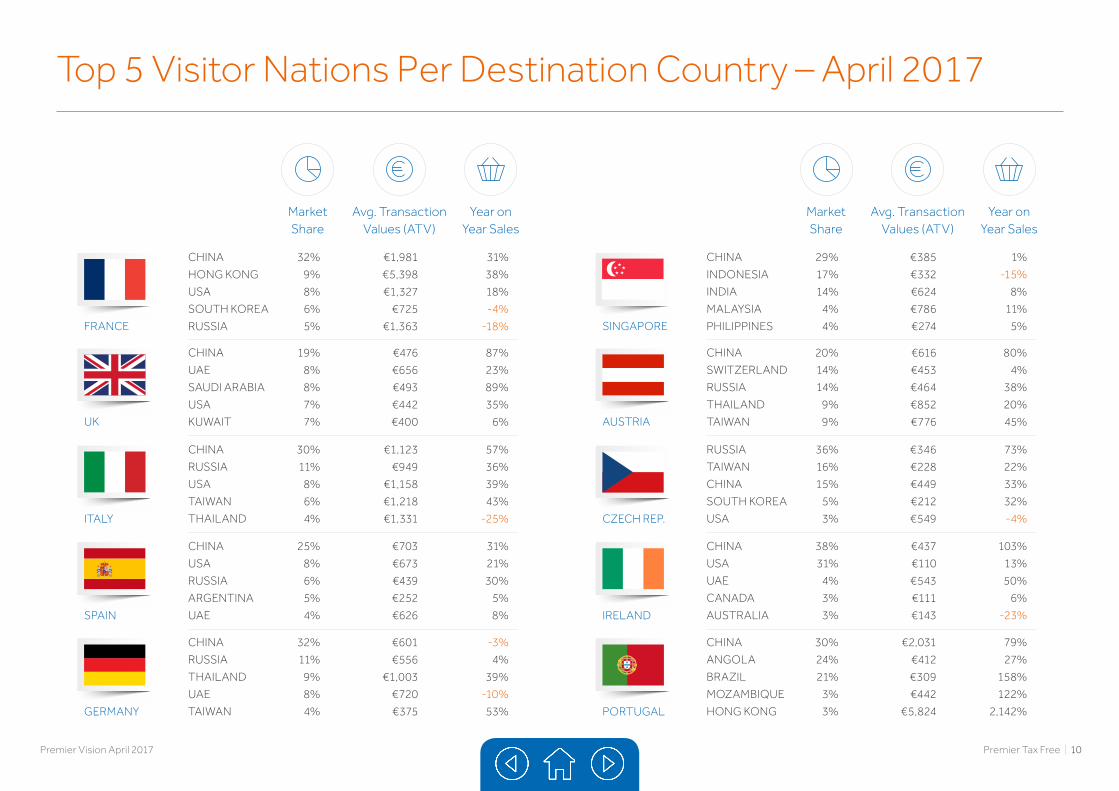
CHINA 32% €1,981 31%
HONG KONG 9% €5,398 38%
USA 8% €1,327 18%
SOUTH KOREA 6% €725 -4%
RUSSIA 5% €1,363 -18%
CHINA 29% €385 1%
INDONESIA 17% €332 -15%
INDIA 14% €624 8%
MALAYSIA 4% €786 11%
PHILIPPINES 4% €274 5%
CHINA 19% €476 87%
UAE 8% €656 23%
SAUDI ARABIA 8% €493 89%
USA 7% €442 35%
KUWAIT 7% €400 6%
CHINA 20% €616 80%
SWITZERLAND 14% €453 4%
RUSSIA 14% €464 38%
THAILAND 9% €852 20%
TAIWAN 9% €776 45%
CHINA 30% €1,123 57%
RUSSIA 11% €949 36%
USA 8% €1,158 39%
TAIWAN 6% €1,218 43%
THAILAND 4% €1,331 -25%
RUSSIA 36% €346 73%
TAIWAN 16% €228 22%
CHINA 15% €449 33%
SOUTH KOREA 5% €212 32%
USA 3% €549 -4%
CHINA 25% €703 31%
USA 8% €673 21%
RUSSIA 6% €439 30%
ARGENTINA 5% €252 5%
UAE 4% €626 8%
CHINA 38% €437 103%
USA 31% €110 13%
UAE 4% €543 50%
CANADA 3% €111 6%
AUSTRALIA 3% €143 -23%
CHINA 32% €601 -3%
RUSSIA 11% €556 4%
THAILAND 9% €1,003 39%
UAE 8% €720 -10%
TAIWAN 4% €375 53%
CHINA 30% €2,031 79%
ANGOLA 24% €412 27%
BRAZIL 21% €309 158%
MOZAMBIQUE 3% €442 122%
HONG KONG 3% €5,824 2,142%
Market Share
Market Share
Avg. Transaction Values (ATV)
Avg. Transaction Values (ATV)
Year on Year Sales
Year on Year Sales
Premier Vision April 2017 Premier Tax Free | 10
FRANCE SINGAPORE
UK AUSTRIA
ITALY CZECH REP.
SPAIN IRELAND
GERMANY PORTUGAL
Top 5 Visitor Nations Per Destination Country – April 2017

Premier Vision April 2017 Premier Tax Free | 11
Top 5 Visitor Nations Per Destination Country – YTD
CHINA 30% €1,789 29%
HONG KONG 10% €5,582 89%
USA 7% €1,304 21%
RUSSIA 6% €1,566 -3%
SOUTH KOREA 5% €760 -1%
CHINA 31% €599 0%
RUSSIA 14% €540 20%
THAILAND 6% €1,072 31%
UAE 5% €742 -12%
TAIWAN 4% €421 38%
CHINA 24% €457 61%
KUWAIT 7% €390 19%
USA 7% €502 48%
UAE 6% €705 31%
HONG KONG 4% €414 69%
RUSSIA 20% €465 32%
CHINA 17% €583 77%
SWITZERLAND 14% €418 4%
TAIWAN 7% €727 23%
UKRAINE 6% €581 4%
CHINA 29% €1,701 39%
RUSSIA 14% €907 44%
USA 7% €1,158 31%
TAIWAN 6% €1,191 21%
JAPAN 3% €875 11%
CHINA 28% €1,673 21%
BRAZIL 24% €359 129%
ANGOLA 23% €391 34%
RUSSIA 3% €342 125%
HONG KONG 2% €3,776 287%
CHINA 29% €679 33%
USA 7% €737 29%
RUSSIA 7% €444 26%
ARGENTINA 4% €254 31%
MOROCCO 3% €311 -2%
RUSSIA 39% €389 63%
CHINA 15% €426 50%
TAIWAN 14% €224 35%
SOUTH KOREA 4% €209 33%
UKRAINE 4% €602 41%
CHINA 34% €438 -4%
INDONESIA 16% €346 -11%
INDIA 11% €611 -5%
VIETNAM 5% €436 27%
MALAYSIA 3% €631 -22%
CHINA 47% €416 68%
USA 22% €128 11%
AUSTRALIA 3% €171 5%
CANADA 2% €130 17%
MALAYSIA 2% €270 25%
Market Share
Market Share
Avg. Transaction Values (ATV)
Avg. Transaction Values (ATV)
Year on Year Sales
Year on Year Sales
FRANCE GERMANY
UK AUSTRIA
ITALY PORTUGAL
SPAIN CZECH REP.
SINGAPORE IRELAND

Currency movements: Last 52 Weeks
7.6
7.5
7.4
7.3
7.2
7.1
7.0
9.8
9.6
9.4
9.2
9.0
8.8
8.6
8.4
8.2
8.0
80
75
70
65
60
55
1.16
1.14
1.12
1.10
1.08
1.06
1.04
1.02
1.50
1.45
1.40
1.35
1.30
1.25
1.20
8.9
8.8
8.7
8.6
8.5
8.4
8.3
8.2
8.1
8.0
USD > EUR USD > GBP
CNY > EUR CNY > GBPRUB > EUR
HKD > EUR
Premier Vision April 2017 Premier Tax Free | 12
Currency vs Euro & GBP: Top Source Markets

Arrivals Forecast In partnership with

UK
FRANCE
GERMANY
ITALY
SPAIN
Premier Vision April 2017 Premier Tax Free | 14
Europe Overview
Outlook
The projected 9% increase in arrival numbers to the main European destinations between
May and July 2017, continues to provide a cautiously optimistic outlook. Spain and the UK are
predicted to continue to be the primary beneficiaries over the course of the next three months,
with growth of 14% and 11%, respectively, followed closely by predicted gains of 9% to Italy.
Forecasted arrivals to Germany indicate a degree of confidence returning to this destination,
and whilst France is modestly impacted by the recent attack on the Champs Elysees, the
conclusion and outcome of the Presidential election should serve to provide a degree of stability.
The main European destination markets witnessed arrival gains across the majority of source
markets in April, with tourists from Hong Kong and Saudi Arabia evidencing the most significant
growth, both experiencing an increase of 28%, followed by impressive gains in American tourists
of 23%. The increase in Saudi tourists in April was attributable to the timing of the mid-semester
break versus the prior year.
Opportunity
Arrival numbers are predicted to increase by 11% in May, with all major source markets expected
to provide double-digit gains, with the exception of the Gulf Co-Operation Council (GCC)
members, with the onset of Ramadan from the 26th May and the tradition of fasting, suggesting
an 18% decline during this period. However, the end of Ramadan on 24th June is predicted
to result in a 45% increase in arrival numbers in June, with all destination markets forecast to
experience a 40%+ increase. The timing of the end of Ramadan on 5th July in 2016 correlates to
a 14% decline in GCC arrival numbers in July 2017, and accounting for this variation in the
timing, over the course of June and July, arrival numbers from GCC nations are predicted to see
a 2% increase. The BRIC nations are forecast to continue to provide significant opportunity over
the course of the next three months, attributable to predicted gains of 21% and 30% in Russian
and Brazilian tourists, respectively. American and Japanese tourists are also predicted to see
strong gains, with a 17% increase in both nationalities.
MAY 16 – JUL 16 -1.4%
MAY 17 +12.9%JUN 17 +13.0%JUL 17 +8.7%
MAY 17 – JUL 17 +11.3%
MAY 16 – JUL 16 -7.1%
MAY 17 +5.9%JUN 17 +7.2%JUL 17 +4.1%
MAY 17 – JUL 17 +5.7%
MAY 16 – JUL 16 -4.7%
MAY 17 +13.9%JUN 17 +2.7%JUL 17 +2.3%
MAY 17 – JUL 17 +5.9%
MAY 16 – JUL 16 -2.4%
MAY 17 +8.1%JUN 17 +10.5%JUL 17 +8.1%
MAY 17 – JUL 17 +8.9%
MAY 16 – JUL 16 +8.5%
MAY 17 +18.8%JUN 17 +15.1%JUL 17 +8.6%
MAY 17 – JUL 17 +13.9%

FRANCE
S. KOREA
USA
RUSSIA HONG KONG CHINA
JAPAN
TAIWAN
INDIA AUSTRALIAUAEQATARS.ARABIA
BRAZIL
KUWAIT
THAILAND
3 Month Arrivals Outlook
Premier Vision April 2017 Premier Tax Free | 15
MAY 16 – JUL 16 -22.7%
MAY 17 +39.2%JUN 17 +0.8%JUL 17 +16.9%
MAY 17 – JUL 17 +16.7%
MAY 16 – JUL 16 -20.9%
MAY 17 +19.8%JUN 17 -9.8%JUL 17 +0.2%
MAY 17 – JUL 17 +1.0%
MAY 16 – JUL 16 -18.2%
MAY 17 +9.4%JUN 17 -5.9%JUL 17 +2.0%
MAY 17 – JUL 17 +1.1%
MAY 16 – JUL 16 -10.2%
MAY 17 -2.4%JUN 17 -7.9%JUL 17 -0.0%
MAY 17 – JUL 17 -3.8%
MAY 16 – JUL 16 +2.1%
MAY 17 +13.9%JUN 17 +6.6%JUL 17 -3.4%
MAY 17 – JUL 17 +7.8%
MAY 16 – JUL 16 -10.5%
MAY 17 -0.2%JUN 17 +21.7%JUL 17 -10.3%
MAY 17 – JUL 17 +1.0%
MAY 16 – JUL 16 -23.8%
MAY 17 -18.3%JUN 17 +38.2%JUL 17 -13.1%
MAY 17 – JUL 17 -2.6%
MAY 16 – JUL 16 -16.0%
MAY 17 -30.9%JUN 17 +93.1%JUL 17 -12.1%
MAY 17 – JUL 17 -3.5%
MAY 16 – JUL 16 -8.7%
MAY 17 +24.3%JUN 17 -0.5%JUL 17 -5.1%
MAY 17 – JUL 17 +4.7%
MAY 16 – JUL 16 -30.9%
MAY 17 +25.7%JUN 17 +31.8%JUL 17 +26.8%
MAY 17 – JUL 17 +28.3%
MAY 16 – JUL 16 -27.2%
MAY 17 +29.6%JUN 17 +1.2%JUL 17 +13.7%
MAY 17 – JUL 17 +12.6%
MAY 16 – JUL 16 -2.8%
MAY 17 -6.7%JUN 17 -6.3%JUL 17 -3.4%
MAY 17 – JUL 17 -5.4%
MAY 16 – JUL 16 -11.7%
MAY 17 -25.4%JUN 17 +66.3%JUL 17 -8.5%
MAY 17 – JUL 17 -1.0%
MAY 16 – JUL 16 -30.9%
MAY 17 +22.1%JUN 17 +47.3%JUL 17 +56.1%
MAY 17 – JUL 17 +42.1%
MAY 16 – JUL 16 -7.3%
MAY 17 +21.6%JUN 17 +22.3%JUL 17 +19.0%
MAY 17 – JUL 17 +21.0%

UK
S. KOREA
USA
RUSSIA HONG KONG CHINA
JAPAN
TAIWAN
INDIA AUSTRALIAUAEQATARS.ARABIA
BRAZIL
KUWAIT
THAILAND
3 Month Arrivals Outlook
Premier Vision April 2017
MAY 16 – JUL 16 +4.7%
MAY 17 +8.8%JUN 17 +7.8%JUL 17 +24.6%
MAY 17 – JUL 17 +15.1%
MAY 16 – JUL 16 -1.7%
MAY 17 +36.7%JUN 17 -0.9%JUL 17 +13.6%
MAY 17 – JUL 17 +13.5%
MAY 16 – JUL 16 +11.2%
MAY 17 +53.0%JUN 17 +9.4%JUL 17 +19.0%
MAY 17 – JUL 17 +21.6%
MAY 16 – JUL 16 -0.2%
MAY 17 +14.2%JUN 17 +8.0%JUL 17 +12.1%
MAY 17 – JUL 17 +11.0%
MAY 16 – JUL 16 +0.3%
MAY 17 +3.5%JUN 17 +3.9%JUL 17 -5.4%
MAY 17 – JUL 17 +1.2%
MAY 16 – JUL 16 +1.0%
MAY 17 -5.5%JUN 17 +28.5%JUL 17 -16.7%
MAY 17 – JUL 17 -3.6%
MAY 16 – JUL 16 -10.2%
MAY 17 -8.6%JUN 17 +55.8%JUL 17 -24.5%
MAY 17 – JUL 17 -8.8%
MAY 16 – JUL 16 -3.3%
MAY 17 -23.6%JUN 17 +53.5%JUL 17 -17.9%
MAY 17 – JUL 17 -5.8%
MAY 16 – JUL 16 -5.0%
MAY 17 +31.9%JUN 17 +2.1%JUL 17 +4.5%
MAY 17 – JUL 17 +10.1%
MAY 16 – JUL 16 -13.7%
MAY 17 +21.1%JUN 17 +12.0%JUL 17 +16.2%
MAY 17 – JUL 17 +15.9%
MAY 16 – JUL 16 -11.7%
MAY 17 +89.9%JUN 17 +20.4%JUL 17 +33.0%
MAY 17 – JUL 17 +38.4%
MAY 16 – JUL 16 +5.0%
MAY 17 -7.2%JUN 17 -9.9%JUL 17 +1.4%
MAY 17 – JUL 17 -4.8%
MAY 16 – JUL 16 +14.8%
MAY 17 -17.0%JUN 17 +52.4%JUL 17 -17.9%
MAY 17 – JUL 17 -6.8%
MAY 16 – JUL 16 -25.1%
MAY 17 +29.7%JUN 17 +35.0%JUL 17 +56.2%
MAY 17 – JUL 17 +42.0%
MAY 16 – JUL 16 +0.2%
MAY 17 +18.1%JUN 17 +21.5%JUL 17 +18.8%
MAY 17 – JUL 17 +19.6%
Premier Tax Free | 16

ITALY
S. KOREA
USA
RUSSIA HONG KONG CHINA
JAPAN
TAIWAN
INDIA AUSTRALIAUAEQATARS.ARABIA
BRAZIL
KUWAIT
THAILAND
3 Month Arrivals Outlook
Premier Vision April 2017
MAY 16 – JUL 16 -25.4%
MAY 17 +25.3%JUN 17 +17.8%JUL 17 +21.1%
MAY 17 – JUL 17 +21.1%
MAY 16 – JUL 16 -24.4%
MAY 17 +17.8%JUN 17 -7.5%JUL 17 -4.4%
MAY 17 – JUL 17 +0.1%
MAY 16 – JUL 16 -12.9%
MAY 17 +23.1%JUN 17 -7.8%JUL 17 +5.5%
MAY 17 – JUL 17 +5.3%
MAY 16 – JUL 16 +6.8%
MAY 17 +10.5%JUN 17 +8.1%JUL 17 +14.3%
MAY 17 – JUL 17 +11.0%
MAY 16 – JUL 16 +9.6%
MAY 17 -0.6%JUN 17 +1.7%JUL 17 -9.4%
MAY 17 – JUL 17 -1.6%
MAY 16 – JUL 16 -5.9%
MAY 17 -6.3%JUN 17 +21.0%JUL 17 -8.8%
MAY 17 – JUL 17 -0.3%
MAY 16 – JUL 16 -18.2%
MAY 17 -15.2%JUN 17 +32.2%JUL 17 -22.3%
MAY 17 – JUL 17 -9.5%
MAY 16 – JUL 16 -7.1%
MAY 17 -36.1%JUN 17 +81.2%JUL 17 -15.7%
MAY 17 – JUL 17 -11.1%
MAY 16 – JUL 16 +0.4%
MAY 17 +14.4%JUN 17 +7.1%JUL 17 -2.3%
MAY 17 – JUL 17 +5.8%
MAY 16 – JUL 16 -13.7%
MAY 17 +2.0%JUN 17 +21.4%JUL 17 +13.2%
MAY 17 – JUL 17 +12.5%
MAY 16 – JUL 16 -19.7%
MAY 17 +52.1%JUN 17 +6.9%JUL 17 +14.5%
MAY 17 – JUL 17 +22.6%
MAY 16 – JUL 16 -6.0%
MAY 17 -1.2%JUN 17 +5.2%JUL 17 -8.1%
MAY 17 – JUL 17 -1.2%
MAY 16 – JUL 16 -5.1%
MAY 17 -27.6%JUN 17 +43.2%JUL 17 -17.9%
MAY 17 – JUL 17 -11.5%
MAY 16 – JUL 16 -12.7%
MAY 17 +10.9%JUN 17 +30.7%JUL 17 +43.4%
MAY 17 – JUL 17 +27.9%
MAY 16 – JUL 16 +1.6%
MAY 17 +15.1%JUN 17 +15.0%JUL 17 +16.1%
MAY 17 – JUL 17 +15.4%
Premier Tax Free | 17

Premier Tax Free | 18
SPAIN
S. KOREA
USA
RUSSIA HONG KONG CHINA
JAPAN
TAIWAN
INDIA AUSTRALIAUAEQATARS.ARABIA
BRAZIL
KUWAIT
THAILAND
3 Month Arrivals Outlook
Premier Vision April 2017
MAY 16 – JUL 16 -26.6%
MAY 17 +28.3%JUN 17 +33.8%JUL 17 +34.9%
MAY 17 – JUL 17 +33.0%
MAY 16 – JUL 16 +6.2%
MAY 17 +43.1%JUN 17 +0.6%JUL 17 +12.2%
MAY 17 – JUL 17 +15.9%
MAY 16 – JUL 16 +4.3%
MAY 17 +38.8%JUN 17 +16.0%JUL 17 +11.4%
MAY 17 – JUL 17 +20.9%
MAY 16 – JUL 16 +9.7%
MAY 17 +21.3%JUN 17 +15.3%JUL 17 +12.7%
MAY 17 – JUL 17 +16.3%
MAY 16 – JUL 16 +18.0%
MAY 17 +17.7%JUN 17 -3.0%JUL 17 +3.5%
MAY 17 – JUL 17 +5.8%
MAY 16 – JUL 16 -0.8%
MAY 17 -3.4%JUN 17 +27.6%JUL 17 -9.3%
MAY 17 – JUL 17 +1.3%
MAY 16 – JUL 16 -4.9%
MAY 17 -12.0%JUN 17 +3.4%JUL 17 -15.7%
MAY 17 – JUL 17 -10.3%
MAY 16 – JUL 16 -1.8%
MAY 17 -33.2%JUN 17 +100.2%JUL 17 -15.9%
MAY 17 – JUL 17 -5.9%
MAY 16 – JUL 16 +13.7%
MAY 17 +26.5%JUN 17 +1.0%JUL 17 -12.0%
MAY 17 – JUL 17 +4.3%
MAY 16 – JUL 16 -15.1%
MAY 17 +11.5%JUN 17 +23.6%JUL 17 +23.5%
MAY 17 – JUL 17 +19.4%
MAY 16 – JUL 16 +18.8%
MAY 17 +57.8%JUN 17 -6.5%JUL 17 +8.5%
MAY 17 – JUL 17 +18.1%
MAY 16 – JUL 16 -6.8%
MAY 17 +27.9%JUN 17 +29.6%JUL 17 -0.6%
MAY 17 – JUL 17 +20.1%
MAY 16 – JUL 16 +14.3%
MAY 17 -28.4%JUN 17 +101.5%JUL 17 -21.0%
MAY 17 – JUL 17 -8.9%
MAY 16 – JUL 16 -1.1%
MAY 17 +4.2%JUN 17 +25.5%JUL 17 +30.4%
MAY 17 – JUL 17 +20.2%
MAY 16 – JUL 16 +9.1%
MAY 17 +29.6%JUN 17 +19.5%JUL 17 +15.5%
MAY 17 – JUL 17 +21.4%

Premier Tax Free | 19
GERMANY
S. KOREA
USA
RUSSIA HONG KONG CHINA
JAPAN
TAIWAN
INDIA AUSTRALIAUAEQATARS.ARABIA
BRAZIL
KUWAIT
THAILAND
3 Month Arrivals Outlook
Premier Vision April 2017
MAY 16 – JUL 16 -32.9%
MAY 17 +24.6%JUN 17 +6.6%JUL 17 +19.1%
MAY 17 – JUL 17 +16.4%
MAY 16 – JUL 16 -3.2%
MAY 17 +24.2%JUN 17 -15.4%JUL 17 -7.8%
MAY 17 – JUL 17 -1.2%
MAY 16 – JUL 16 -6.6%
MAY 17 +26.8%JUN 17 -15.1%JUL 17 -0.2%
MAY 17 – JUL 17 +2.2%
MAY 16 – JUL 16 +9.4%
MAY 17 +9.6%JUN 17 +8.9%JUL 17 +12.7%
MAY 17 – JUL 17 +10.4%
MAY 16 – JUL 16 +1.2%
MAY 17 +19.8%JUN 17 -10.4%JUL 17 -7.4%
MAY 17 – JUL 17 +1.8%
MAY 16 – JUL 16 -17.4%
MAY 17 -7.8%JUN 17 +16.2%JUL 17 -11.4%
MAY 17 – JUL 17 -5.7%
MAY 16 – JUL 16 -29.4%
MAY 17 -28.4%JUN 17 +48.5%JUL 17 -13.2%
MAY 17 – JUL 17 -8.0%
MAY 16 – JUL 16 -25.0%
MAY 17 -29.5%JUN 17 +117.4%JUL 17 +0.7%
MAY 17 – JUL 17 +4.3%
MAY 16 – JUL 16 +6.6%
MAY 17 +39.4%JUN 17 +7.8%JUL 17 +3.1%
MAY 17 – JUL 17 +14.7%
MAY 16 – JUL 16 -13.2%
MAY 17 +23.7%JUN 17 +5.8%JUL 17 +13.3%
MAY 17 – JUL 17 +13.8%
MAY 16 – JUL 16 -9.6%
MAY 17 +52.3%JUN 17 +1.0%JUL 17 +5.5%
MAY 17 – JUL 17 +16.3%
MAY 16 – JUL 16 -2.7%
MAY 17 +9.0%JUN 17 -5.4%JUL 17 -4.7%
MAY 17 – JUL 17 +0.3%
MAY 16 – JUL 16 -7.5%
MAY 17 -42.0%JUN 17 +98.9%JUL 17 -7.2%
MAY 17 – JUL 17 +0.4%
MAY 16 – JUL 16 -13.2%
MAY 17 +19.1%JUN 17 +17.2%JUL 17 +30.3%
MAY 17 – JUL 17 +22.4%
MAY 16 – JUL 16 +0.3%
MAY 17 +14.0%JUN 17 +10.4%JUL 17 +8.6%
MAY 17 – JUL 17 +10.8%

Premier Tax Free | 20
SINGAPORE
S. KOREA
USA
RUSSIA HONG KONG CHINA
JAPAN
TAIWAN
INDIA AUSTRALIAUAEQATARS.ARABIA
BRAZIL
KUWAIT
THAILAND
3 Month Arrivals Outlook
Premier Vision April 2017
MAY 16 – JUL 16 -10.9%
MAY 17 +17.9%JUN 17 +44.0%JUL 17 +37.6%
MAY 17 – JUL 17 +32.7%
MAY 16 – JUL 16 -6.1%
MAY 17 -23.2%JUN 17 -23.9%JUL 17 -16.9%
MAY 17 – JUL 17 -20.8%
MAY 16 – JUL 16 +1.3%
MAY 17 +8.8%JUN 17 -15.2%JUL 17 -1.2%
MAY 17 – JUL 17 -2.8%
MAY 16 – JUL 16 +0.5%
MAY 17 +7.8%JUN 17 +24.1%JUL 17 +18.7%
MAY 17 – JUL 17 +17.4%
MAY 16 – JUL 16 -1.0%
MAY 17 +21.8%JUN 17 +18.9%JUL 17 +3.1%
MAY 17 – JUL 17 +16.4%
MAY 16 – JUL 16 +7.3%
MAY 17 -14.6%JUN 17 +11.7%JUL 17 -15.8%
MAY 17 – JUL 17 -9.2%
MAY 16 – JUL 16 +23.8%
MAY 17 -42.2%JUN 17 +24.2%JUL 17 -25.4%
MAY 17 – JUL 17 -21.5%
MAY 16 – JUL 16 -6.9%
MAY 17 -27.3%JUN 17 +40.9%JUL 17 -43.1%
MAY 17 – JUL 17 -20.4%
MAY 16 – JUL 16 +16.8%
MAY 17 +19.1%JUN 17 +17.5%JUL 17 +1.4%
MAY 17 – JUL 17 +11.5%
MAY 16 – JUL 16 -6.7%
MAY 17 +5.7%JUN 17 +19.6%JUL 17 +14.9%
MAY 17 – JUL 17 +13.1%
MAY 16 – JUL 16 +10.5%
MAY 17 +10.4%JUN 17 -18.0%JUL 17 +2.3%
MAY 17 – JUL 17 -2.2%
MAY 16 – JUL 16 -6.3%
MAY 17 -2.1%JUN 17 -1.6%JUL 17 -7.8%
MAY 17 – JUL 17 -4.0%
MAY 16 – JUL 16 -5.6%
MAY 17 -28.9%JUN 17 +104.8%JUL 17 -26.7%
MAY 17 – JUL 17 -15.7%
MAY 16 – JUL 16 -10.0%
MAY 17 +0.2%JUN 17 +11.1%JUL 17 +15.2%
MAY 17 – JUL 17 +8.2%
MAY 16 – JUL 16 -6.3%
MAY 17 +2.3%JUN 17 +17.1%JUL 17 +9.3%
MAY 17 – JUL 17 +9.8%

Part of the Fintrax Group
Fintrax Group HoldingsHeadquartered in Galway, Ireland
Email: [email protected] | Web: premiertaxfree.com/business
If you would like to know more about Tax Free Statistics, please get in touch with
your Premier Tax Free representative.